Abstract
Photovoltaic (PV) power generation is essential for achieving carbon neutrality and advancing renewable energy development. In Northwest China, the rapid expansion of PV installations requires accurate and timely spatial data to support effective monitoring and planning. Addressing the limitations of existing datasets in spatiotemporal resolution and driver analysis, this study develops a scalable solar facility inventory framework on the Google Earth Engine (GEE) platform. The framework integrates Sentinel-1 SAR, Sentinel-2 multispectral imagery, and interpretable machine learning. Feature redundancy is first assessed using correlation-based metrics, after which a Random Forest classifier is applied to generate a 10 m resolution distribution map of utility-scale photovoltaic power plants as of December 2023. To elucidate model behavior, SHAP (SHapley Additive exPlanations) is used to identify key predictors, and MaxEnt is incorporated to provide a preliminary quantitative assessment of spatial drivers of PV deployment. The RFECV-optimized model, retaining 44 key features, achieves an overall accuracy of 98.4% and a Kappa coefficient of 0.96. The study region contains approximately 2560 km2 of PV installations, with pronounced clusters in northern Ningxia, central Shaanxi, and parts of Xinjiang and Gansu. SHAP analysis highlights the Enhanced Photovoltaic Index (EPVI), the Normalized Difference Built-up Index (NDBI), Sentinel-2 Band 8A, and related texture metrics as primary contributors to model predictions. High EPVI, NDBI, and Sentinel-2 Band 8A values contribute positively to PV classification, whereas vegetation-related indices (e.g., NDVI) exhibit predominantly negative contributions; these results indicate that PV mapping relies on the integrated discrimination of multiple spectral and texture features rather than on a single dominant variable. MaxEnt results indicate that grid accessibility and land-use constraints (e.g., nighttime light intensity reflecting human activity) are dominant drivers of PV clustering, often exerting more influence than solar irradiance alone. This framework provides robust technical support for PV monitoring and offers high-resolution spatial distribution data and driver insights to inform sustainable energy management and regional renewable-energy planning.
1. Introduction
In the global effort to address climate change and ensure energy security, solar energy has become a central component of the energy transition [1,2]. Projections by the International Renewable Energy Agency (IRENA) indicate that under a renewable energy transition scenario, global photovoltaic (PV) installed capacity may exceed 5400 GW by 2030 and reach approximately 8500 GW by 2050 [3]. These projections highlight both the substantial potential of the PV sector and the profound restructuring underway in the global energy system. Within this broader transition, China’s “dual-carbon” targets (carbon peaking and carbon neutrality) have accelerated domestic PV expansion, solidifying China’s role as a key contributor to sustainable energy development. According to the National Energy Administration, China’s grid-connected PV capacity reached 608.918 GW by the end of 2023 [4]. Northwest China, benefiting from exceptional solar resources and extensive flat terrain, has become a strategic center of utility-scale PV development. The region hosts 117.57 GW of utility-scale capacity, accounting for over 34% of the national total [5,6]. Nevertheless, the rapid deployment of PV facilities has introduced challenges for planning and management. A high-resolution, regularly updated spatial inventory is essential for assessing renewable energy penetration, evaluating ecological impacts, and supporting regional energy planning and grid balancing. Existing global and national PV datasets often suffer from coarse spatial resolution, long update cycles, or the absence of plant-level boundaries, making them insufficient for monitoring the recent surge of new installations in Northwest China. Even where point coordinates exist for individual plants, a unified dataset with 10 m geometric precision remains lacking, limiting independent verification of official statistics and hindering robust assessments of cumulative land-use impacts. For researchers and planners without access to proprietary grid data, accurate baseline information is fundamental to analyses of development drivers and future scenarios. More broadly, current research tends to emphasize static mapping rather than explaining why PV clusters form in particular locations, leaving quantitative interpretation of driving factors underdeveloped.
To address these gaps, this study develops an integrated framework combining multi-source remote sensing data, the Google Earth Engine (GEE) cloud platform, and interpretable machine learning. The study pursues three objectives: (1) Construct a compact and discriminative feature set by integrating spectral features, spectral indices, and texture variables, and removing redundancy through systematic feature selection. (2) Produce a high-accuracy spatial inventory of PV installations by applying a Random Forest classifier on GEE to generate a 10 m resolution distribution map of PV power plants in Northwest China as of December 2023. (3) Enhance interpretability and identify development drivers by using SHAP (SHapley Additive exPlanations) to explain model decisions and highlight key variables, and by employing the MaxEnt (Maximum Entropy) model to preliminarily quantify and discuss environmental and socio-economic influences on PV clustering. By accomplishing these objectives, this study establishes a transparent, scalable, and reproducible framework for mapping and monitoring large-scale photovoltaic power plants in Northwest China and potentially in other regions, offering data-driven support for sustainable energy planning.
2. Literature Review
2.1. Limitations of Traditional Surveys and Early Remote Sensing Methods
Early data collection on solar energy facilities primarily relied on field surveys, statistical yearbooks, and semi-automated inventory compilation methods. Although these approaches provide relatively reliable data at small scales, they show clear limitations when applied at regional or national scales [7,8]. Field surveys are time-consuming, labor-intensive, and incapable of covering the vast and topographically complex uninhabited areas of Northwest China; statistical yearbook data often lack spatial location information and therefore cannot support fine-scale spatial planning analyses. Consequently, these traditional approaches can no longer meet the current demand for large-scale and time-sensitive PV monitoring.
2.2. Applications and Challenges of Deep Learning in PV Mapping
To overcome the limitations of traditional approaches, recent studies have increasingly shifted toward remote sensing–based PV monitoring. Among them, deep learning methods have emerged as an important research branch. Researchers have applied convolutional neural networks (CNNs) and U-Net architectures for object extraction and semantic segmentation of PV facilities. These models are designed to automatically delineate PV array boundaries with very high spatial accuracy, and some studies have even inferred installation periods using multi-temporal satellite imagery [9,10,11,12]. However, despite the strong performance of deep learning in specific scenarios, its broader application still faces notable challenges. First, deep learning models typically require large pixel-level annotated datasets for training, which is difficult to obtain in regions where PV samples are scarce. Second, processing large-scale high-resolution imagery demands substantial high-performance computing resources, limiting adoption in resource-constrained environments [13]. More critically, the “black-box” nature of deep learning restricts its interpretability in operational monitoring contexts [14]. For policymakers, it is essential to understand why a model identifies a particular area as a PV power plant—whether the decision is driven by spectral properties or geometric patterns—yet deep learning models often cannot provide such transparent decision rationale.
2.3. Advantages of GEE-Based Machine Learning Methods
In parallel with deep learning, traditional machine learning algorithms remain widely used in the remote sensing domain due to their lower computational requirements and stronger interpretability [15,16]. Particularly with the rise of cloud computing platforms such as Google Earth Engine (GEE), the efficiency of machine learning methods in data acquisition, preprocessing, and large-scale analysis has markedly improved. Recent studies have shown that machine learning classifiers implemented on the GEE platform—including Random Forest, Support Vector Machine (SVM), and decision trees—have been successfully applied to large-area PV facility mapping across diverse geomorphological settings in China and abroad [17,18]. For example, Kruitwagen et al. constructed a global PV inventory using cloud computing and machine learning, demonstrating the feasibility of this technical pathway [10]. Zhang et al. further explored methods for PV mapping in China using Sentinel data [7]. Collectively, these studies demonstrate that cloud-based machine learning workflows offer an efficient, scalable, and accurate alternative for regional to national-scale PV mapping, particularly in balancing computational cost and mapping precision.
2.4. Advances in Feature Selection and Explainability Research
Within machine learning frameworks, feature design and selection play a central role in improving classification accuracy for multi-source datasets [19]. Existing studies have developed and evaluated a variety of remote sensing features for PV identification. Commonly used features include the Normalized Difference Built-up Index (NDBI) [20], which enhances the detection of impervious surfaces; the Normalized Difference Photovoltaic Index (NDPI) [21], designed specifically to improve PV identification and support 10 m resolution national PV inventories; and the Enhanced Photovoltaic Index (EPVI), which facilitates large-scale PV extraction by improving brightness contrast and suppressing noise [22]. To address challenges such as cloud contamination and spectral confusion, some studies have further integrated optical and Synthetic Aperture Radar (SAR) observations, leveraging their complementary spectral and scattering properties. However, such data fusion often introduces high-dimensional redundancy, resulting in a “curse of dimensionality” that complicates model training and increases the risk of overfitting [19,23]. To manage this issue, feature ranking and selection techniques—such as Relief-F [24], Recursive Feature Elimination (RFE) [25], and Random Forest–based importance metrics—have been widely employed to reduce feature dimensionality, remove redundant or irrelevant variables, and enhance model robustness in large-scale remote sensing classification. Meanwhile, interpretability tools such as SHAP (SHapley Additive exPlanations) are gaining increasing attention. Based on cooperative game theory, SHAP quantifies the contribution of each feature to model predictions, thereby clarifying the decision process [26,27]. Durlević et al. (2025), in a study on wildfire susceptibility mapping, reported that SHAP effectively reveals nonlinear feature responses and interactions in complex environmental models, providing analytical support for diagnosing misclassification and optimizing feature engineering [28]. Despite these advances, systematic integration of feature selection strategies with interpretability analysis for multi-source PV mapping remains limited in existing literature, leaving room for methodological development in this field.
3. Materials and Methods
3.1. Study Area
The present study focuses on Northwest China, which comprises five provincial-level administrative units: Shaanxi Province, Gansu Province, Qinghai Province, Ningxia Hui Autonomous Region, and Xinjiang Uyghur Autonomous Region (see Figure 1). Collectively, these regions span approximately 3.1 million km2, accounting for nearly one-third of China’s total land area. Northwest China is characterized by an arid to semi-arid climate, with annual sunshine duration typically exceeding 2500 h, and in many desert basins surpassing 3000 h [29]. In addition to abundant solar radiation, the region exhibits low annual precipitation, generally below 200–300 mm, and in core desert and Gobi environments often less than 100 mm, resulting in sparse vegetation cover and extensive open land surfaces. Mean annual temperatures vary considerably due to differences in elevation, yet large portions of Northwest China maintain moderate thermal conditions favorable for photovoltaic (PV) system operation. The region is characterized by high solar irradiance, minimal cloud cover, low humidity, and extensive homogeneous terrain. Geomorphologically, broad basins, plateaus, and gently undulating plains provide large, contiguous areas suitable for utility-scale PV deployment. Surface water is scarce and largely confined to localized inland rivers, minimizing potential conflicts with water resources. Vegetation is primarily composed of desert, desert steppe, and dry grassland ecosystems, with low biomass and limited land-use intensity. Collectively, these natural attributes offer inherent advantages for the development and spatial expansion of photovoltaic power infrastructure.
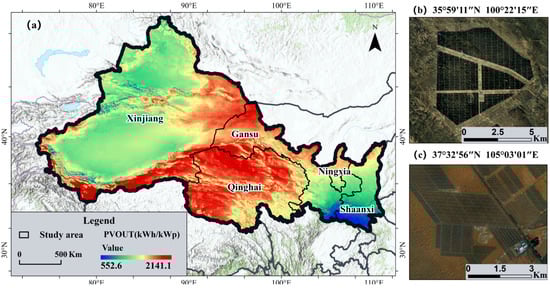
Figure 1.
(a) Location of the study area and long-term annual average potential photovoltaic power generation (PVOUT, 2007–2018); (b,c) Typical photovoltaic facility landscapes in the study area. The PVOUT data are sourced from https://globalsolaratlas.info/map (accessed on 8 December 2024).
In recent years, Northwest China has become the primary locus of centralized PV development. According to China Energy Net (www.china5e.com), utility-scale installations accounted for more than 80% of China’s total installed PV capacity by the end of 2023. Such facilities are predominantly situated in deserts, Gobi regions, and sparsely vegetated plains, where the spectral signatures of PV arrays differ markedly from surrounding land-cover types. This distinctiveness enables high separability in remote sensing imagery and supports reliable large-scale mapping of solar energy infrastructure [26,30,31].
3.2. Data Sources
All remote sensing data used in this study were acquired and processed on the Google Earth Engine (GEE) platform. The Sentinel-1 Ground Range Detected (GRD) Synthetic Aperture Radar (SAR) product provides all-weather, day-and-night observation capability with a spatial resolution of 10 m and a nominal revisit frequency of 6 days at the equator (shorter at higher latitudes), enabling consistent acquisition while minimizing cloud contamination. The Sentinel-2 Level-2A surface reflectance product, derived from the Multispectral Instrument (MSI), offers high-resolution multispectral observations (10 m for several bands) with a nominal 5-day revisit under the Sentinel-2A/2B constellation [31]. Between 1 September and 31 December 2023, a total of 23,478 Sentinel-1 SAR scenes and 1343 Sentinel-2 MSI scenes were collected to support PV mapping across Northwest China (Figure 2a). Sentinel-1 scenes available on GEE had been preprocessed for thermal noise removal and radiometric calibration, while Sentinel-2 Level-2A tiles had undergone radiometric calibration and atmospheric correction [32]. Sentinel-2 images with cloud coverage > 15% were excluded using the QA60 band and an automated cloud mask; the remaining images were median-composited to produce cloud-reduced, denoised multispectral mosaics. Sentinel-1 IW-mode data were Lee-filtered to suppress speckle and then median-composited to generate a final backscatter mosaic.
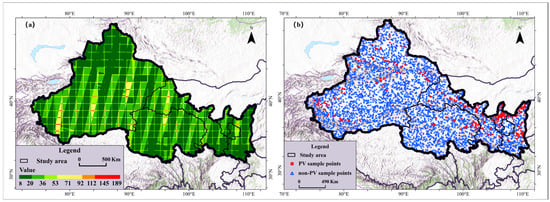
Figure 2.
(a) The spatial coverage frequency of Sentinel-2 images with cloud cover less than 15%. (b) the spatial distribution of sample points for PV and non-PV.
The PV sample base was derived from the dataset of Chen et al. [12], which delineates PV power-plant footprints across Northwest China (2022). Random sampling points were generated inside PV footprints (and outside for non-PV areas), followed by visual verification using high-resolution Google Earth imagery for labelling and correction. After iterative inspection and calibration, the final sample library contained 5000 PV and 10,000 non-PV samples (Figure 2b). PV boundaries were further cross-checked using Tianditu (National Platform for Common Geospatial Information Services).
To assess the development status and spatial distribution patterns of PV power plants, we incorporated the Global Solar Atlas PVOUT (https://globalsolaratlas.info/map, accessed on 8 December 2024) dataset (30 arc-seconds, ≈1 km) and annual nighttime light data (VIIRS V2.1) obtained from the Google Earth Engine cloud computing platform (Google LLC, Mountain View, CA, USA) (≈500 m). All large-scale preprocessing, compositing, feature extraction, SNIC segmentation, and Random Forest classification were conducted within the GEE environment, whereas ArcGIS 10.8 was used for visual inspection, limited manual correction of obvious misclassifications, and final cartographic refinement.
3.3. Research Methods
This study proposes a comprehensive framework for classifying photovoltaic power plants, consisting of six key steps (see Figure 3): (a) data preparation; (b) construction of the initial feature set; (c) feature selection; (d) object-based classification of PV power plants; (e) explainable analysis; (f) accuracy and consistency evaluation.
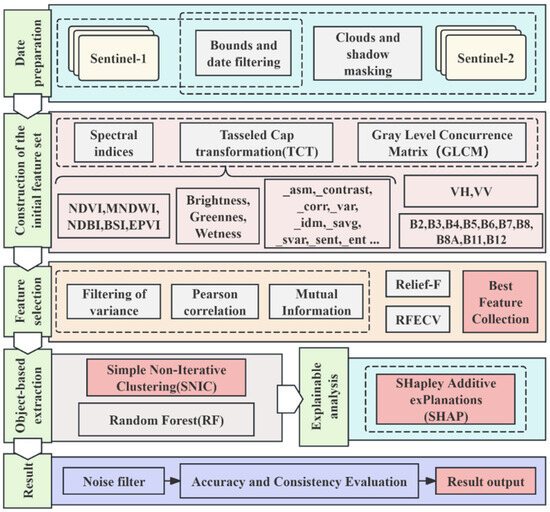
Figure 3.
Workflow for classifying photovoltaic power plants.
3.3.1. Feature Set Construction
- Construction of the initial feature set
Crystalline silicon materials used in photovoltaic power plants exhibit distinct spectral response characteristics [33]. In this study, surface reflectance values from Sentinel-2 bands B2, B3, B4, B5, B6, B7, B8, B8A, B11, and B12 were used to compute a set of spectral indices to enhance the separability of vegetation, water bodies, built-up areas, bare soil, and photovoltaic power plants. These spectral indices were calculated using specific combinations of the selected Sentinel-2 bands and include the Normalized Difference Vegetation Index (NDVI) [34,35], Modified Normalized Difference Water Index (MNDWI) [36], Normalized Difference Built-up Index (NDBI) [21], Bare Soil Index (BSI) [37], and Enhanced Photovoltaic Index (EPVI) [22]. Although Sentinel-2 multispectral bands already contain abundant spectral information, studies have shown that spectral indices and transformations can improve class separability by emphasizing specific biophysical or structural properties [38,39]. For example, NDVI highlights vegetation vigor, while NDBI and BSI accentuate impervious and bare surfaces that may be spectrally similar to PV installations. Likewise, the tasseled cap transformation (TCT) has been widely used to reduce redundancy and improve classification accuracy [40]. Therefore, combining original bands with derived indices ensures that subtle but critical differences between PV plants and surrounding land-cover types are more effectively captured. Considering the smooth surface and regular structure of PV power plants, which result in distinct backscatter differences in the VV and VH polarization channels of Sentinel-1 SAR imagery, both polarization bands were also incorporated into the feature set.
TCT was applied to convert the original multi-band Sentinel-2 imagery into three principal components—brightness, greenness, and wetness—which effectively capture key surface characteristics. photovoltaic power plants are typically arranged in matrix formations and exhibit distinctive textures. Therefore, spectral information was combined with texture features quantified by the gray level co-occurrence matrix (GLCM) [41]. Ultimately, a 360-dimensional multi-source feature set was constructed, encompassing spectral, index-based, polarization, and texture features (see Table 1).
where ,,,, and are the respective reflectance of Sentinel-2 Band 2, Band 3, Band 4, Band 8, Band 11, and Band 12, ranging from 0 to 1.

Table 1.
All the features evaluated in this study.
Table 1.
All the features evaluated in this study.
| Feature Groups | Number | Specific Features |
|---|---|---|
| Sentinel-1 | 2 | VV, VH |
| Sentinel-2 | 10 | B2, B3, B4, B5, B6, B7, B8, B8A, B11, B12 |
| Spectral indices | 5 | NDVI, MNDWI, NDBI, BSI, EPVI |
| Tasseled Cap | 3 | Brightness, Greens, Wetness |
| Texture | 17 × 30 | Table 2 |
Table 2.
Seventeen texture features.
Table 2.
Seventeen texture features.
| Texture Symbol | Description | Texture Symbol | Description |
|---|---|---|---|
| _asm | angular second moment | _dvar | difference variance |
| _contrast | contrast | _dent | difference entropy |
| _corr | correlation | _imcorr1 | information measure of Corr.1 |
| _var | variance | _imcorr2 | information measure of Corr.2 |
| _idm | inverse difference moment | _diss | dissimilarity |
| _savg | sum average | _inertia | inertia |
| _svar | sum variance | _shade | cluster shade |
| _sent | sum entropy | _prom | cluster prominence |
| _ent | entropy |
- Feature Selection
In order to reduce redundancy, enhance computational efficiency, and improve the generalisability of the model, it is imperative to reduce dimensions and improve the robustness and generalisability of the model through feature selection [42]. Consequently, a multi-step feature selection strategy was adopted. Firstly, the variance threshold method was employed to remove features with a variance of zero or close to zero, as these features have been shown to contain little discriminative information [43]; The threshold was set at 0.005, thereby deleting five features (Equation (6)). Secondly, the linear correlation between the features and the binary target was evaluated. Pearson’s correlation coefficient was utilized as the standard for continuous variables, while the binomial correlation coefficient (a special case of Pearson’s correlation) was employed for binary-continuous variable pairs to enhance the quantification of the relationship in PV classification [44,45], with consideration given to the category proportion and average difference (Equation (7)). Thirdly, mutual information (MI) was applied to capture the linear and nonlinear associations between features and the target, providing an additional measure of correlation; the higher the mutual information value, the stronger the predictive potential [46] (Equation (8)). A systematic redundancy analysis of the feature space was conducted by integrating these three methods. The purpose of this analysis was to ensure that the selected variables are both informative and minimize redundancy as much as possible. The objective of this process is to facilitate more efficient and robust modeling.
In the equation, denotes the value of feature for the sample, represents the mean value of the feature , and is the total number of samples. A variance threshold of 0.005 was applied, resulting in the removal of five features with variance below this threshold.
where and denote the mean values of the continuous variable for the PV (label = 1) and non-PV (label = 0) classes, respectively. denotes the standard deviation of the continuous variable. and are the number of samples in the PV and non-PV classes, respectively, and is the total number of samples.
where denotes the joint probability distribution of variables and , while and represent their corresponding marginal probability distributions. If two variables are completely independent, the mutual information between them is zero. Conversely, the higher the mutual information value, the greater the amount of shared information between the two variables.
To systematically reduce the number of features and identify the most effective ones from the 355 candidate features, two feature selection methods were adopted: Relief-F and Recursive Feature Elimination with Cross-Validation (RFECV). The Relief-F algorithm assesses each feature based on its ability to distinguish adjacent samples of different classes, and assigns higher weights to features with stronger distinguishing ability [47]. In contrast, RFECV is built on the framework of Recursive Feature Elimination (RFE), automatically identifying the optimal subset by using the importance scores derived from the model, and achieving this goal by iteratively deleting the least important features. At the same time, 10-fold cross-validation is used to evaluate the performance of each step [48]. These two methods were independently applied to the same feature set to evaluate their stability and efficiency. The comparison results (Table 3) show that the subset based on RFECV achieved the highest classification accuracy (98.40%), and therefore was selected as the optimal feature dataset for subsequent analysis.
Table 3.
Grouping situation and optimal classification accuracy.
3.3.2. Object-Based Classification of PV Power Plants
In this study, image segmentation was conducted on the Enhanced Photovoltaic Index (EPVI) imagery using the Simple Non-Iterative Clustering (SNIC) algorithm [49], as implemented on the Google Earth Engine (GEE) platform. In EPVI images, PV regions generally exhibit high brightness and well-defined boundaries [22], making them well-suited for segmentation into superpixel regions based on spectral and spatial characteristics using SNIC. This approach enables efficient segmentation with low memory consumption. Based on multiple experiments and visual inspection, and considering the regular geometry, high contrast, and clustered distribution of photovoltaic power plants, we selected optimal parameters. To optimize SNIC segmentation, a sensitivity analysis was performed on the EPVI-derived image using different combinations of size, compactness, connectivity, and neighborhoodSize. Evaluation was conducted based on the classification accuracy of 500 test samples. Results show that size = 10, compactness = 1, connectivity = 8, and neighborhoodSize = 256 achieved the best balance between boundary delineation and segmentation stability. Smaller segments (size = 5) caused over-fragmentation, while larger segments (size = 20) merged adjacent panels, reducing precision. The selected parameters produced consistent boundaries and the highest classification accuracy (overall = 98.40%, Kappa = 0.963), and were adopted for this study. The detailed sensitivity analysis for all tested parameter combinations is provided in Supplementary Material.
Following image segmentation and feature selection, a Random Forest (RF) classifier was constructed for classification. RF is robust to overfitting, handles high-dimensional, multi-source features, and performs well without massive labeled datasets or heavy computation, and it has been successfully applied to PV mapping with Landsat and Sentinel imagery on GEE [50]. In contrast to deep learning approaches, which typically require large volumes of pixel-level annotations and substantial computational resources for large-area applications [9], RF aligns better with our feature-based, object-level workflow and data availability in Northwest China. Comparative studies also confirm RF’s superior adaptability and feature-importance interpretability in large-scale remote sensing applications [51]. To enhance spatial coherence and improve classification accuracy, the results were visually validated using TianDiTu and Google Earth imagery. Only misclassified non-PV areas were manually removed, while the boundaries of detected PV regions were left unaltered to preserve the original morphology of the classification results.
3.3.3. Explainable Analysis Based on SHAP
The SHAP (SHapley Additive exPlanations) algorithm is a model interpretation method derived from cooperative game theory, where a Shapley value represents the average marginal contribution of a feature across all possible feature combinations [26]. This formulation ensures desirable properties such as local accuracy and consistency, allowing SHAP to produce both reliable global importance rankings and sample-level explanations. Beyond its theoretical advantages, SHAP has proven particularly valuable in environmental and sustainable-energy applications because it links model predictions to physically interpretable surface characteristics—such as vegetation cover, albedo patterns, and structural regularity—thereby improving transparency and supporting defensible remote-sensing-based mapping outcomes. Recent studies demonstrate that SHAP effectively reveals nonlinear feature responses and interactions in complex environmental models, providing an analytical basis for diagnosing misclassifications and refining feature engineering [28]. This study uses SHAP to quantify how spectral, index-based, and texture features contribute to the discrimination between PV and non-PV surfaces. By analyzing SHAP values, it becomes possible to identify which features play key roles in distinguishing PV from non-PV areas, as shown in Equation (9):
where denotes the Shapley value of feature , is a subset of features, is the total number of features, and is the value function of the feature subset .
3.3.4. Accuracy and Consistency Evaluation Metrics
This study assesses the classification results by testing the samples. The main indicators include Overall Accuracy (OA), Kappa Coefficient (Kappa), Producer’s Accuracy (PA), and User’s Accuracy (UA), which respectively measure the overall accuracy of the classification, the difference between the results and randomness, the proportion of correctly identified samples in a certain category among the actual samples (reflecting the situation of missed classification), and the proportion of correctly identified samples in a certain category among those classified as that category (reflecting the situation of incorrect classification). Additionally, to strictly and precisely evaluate the consistency of the results, the classification results are divided by 1 km grid and compared with the existing dataset “PV extracted by Chen”. The consistency evaluation is conducted using the following formula, as shown in (10):
where refers to the number of PV power plants polygons in the existing PV power plants database, and denotes the number of PV power plants polygons classified in this study within the same spatial extent. A PV power plants polygon is considered detected if the overlapping area with a reference polygon reaches or exceeds 60%.
4. Results
4.1. Feature Selection and Explainable Analysis
For the 355 features remaining after variance filtering, Pearson correlation and mutual information analyses were conducted, followed by feature selection using the Relief-F and RFECV methods (see Figure 4). The model constructed with the top 53 features selected by Relief-F achieved an overall accuracy of 98.39%, whereas the model based on the 44 features selected by RFECV achieved an overall accuracy of 98.40%, slightly higher. Therefore, the feature subset selected by RFECV was adopted. An importance ranking list was generated by reversing the RFECV-based feature elimination order, as follows: EPVI, NDBI, B8A, B8_savg, EPVI_corr, B8, NDBI_savg, EPVI_savg, B7, B6, NDVI_savg, B2, B5, B2_savg, B4_savg, Brightness, Wetness_savg, NDVI, EPVI_shade, NDBI_shade, B8A_savg, Wetness, EPVI_imcorr1, B3, B11, MNDWI, VH, B7_savg, BSI, B12_savg, B12, NDBI_corr, Greenness, B5_savg, MNDWI_savg, B3_savg, B11_savg, Wetness_shade, EPVI_svar, B11_dent, EPVI_imcorr2, EPVI_prom, B11_asm, and MNDWI_contrast. The top 20 features were used to construct Pearson correlation and mutual information heatmaps (Figure 5, Figure 6 and Figure 7). Pearson correlation coefficients indicate that most features are strongly linearly correlated (r > 0.8, p ≤ 0.001), particularly among adjacent NIR bands (e.g., B6–B7, B7–B8, B8–B8A), suggesting spectral redundancy. Feature–label correlations generally range from 0.3 to 0.5, with EPVI and NDBI achieving the highest correlation, r = 0.48, reflecting strong discriminative power. High inter-feature correlations were also observed, for example, between NDBI_savg and EPVI_savg (r = 0.93), indicating convergence in spectral response. Nevertheless, the retained features positively contributed to classification performance, demonstrating the robustness of the RFECV–Random Forest framework.
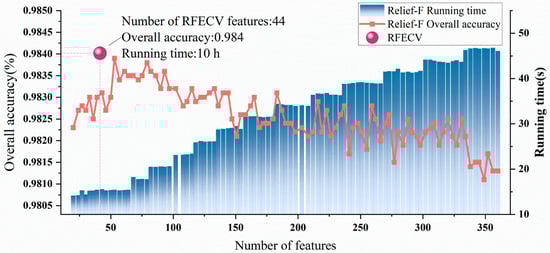
Figure 4.
Comparative Analysis of Classification Accuracy and Running Time between Relief-F and RFECV Feature Selection Methods.
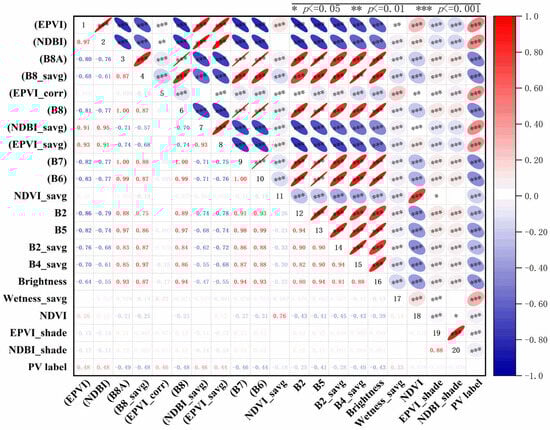
Figure 5.
The Pearson correlation coefficients of the top 20 preferred features. (( ) This indicates that it ranks among the top ten in the Pearson absolute value ranking of PV_label).
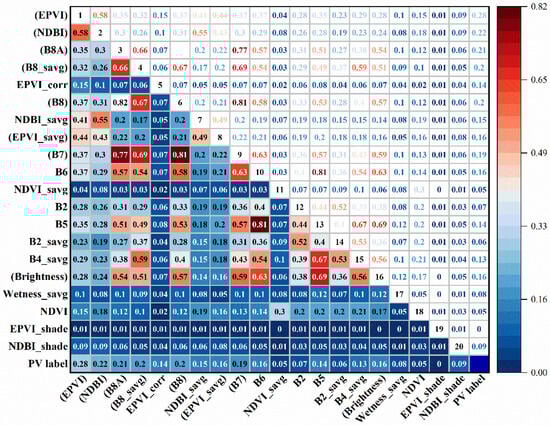
Figure 6.
The mutual information of the top 20 preferred features. (( ) This indicates that the mutual information ranking with PV_label is among the top ten).

Figure 7.
SHAP-based feature importance analysis of the RF. (a) SHAP summary plot. (b) Bar plot of the mean absolute SHAP values for each feature (Class 0: non-PV, Class 1: PV).
Mutual information analysis reveals dependencies between features (Figure 6). For instance, B6–B5, B7–B8A, and B4_savg–Brightness pairs exceed 0.65, reflecting notable spectral or functional similarity. In contrast, mutual information between individual features and the PV label is low. EPVI shows the highest individual mutual information, with a value of approximately 0.28, followed by NDBI and B8A, each with a value of approximately 0.22. This indicates that PV identification relies more on multi-feature integration than on any single dominant variable. Overall, combining RFECV and Random Forest improves discrimination at the feature level and leverages multi-feature fusion to enhance classification robustness, providing a reliable basis for photovoltaic panel detection. Feature importance rankings were further examined using the SHAP alongside the Random Forest algorithm. The swarm plot of the top 20 features (Figure 7) shows that the most discriminative features for identifying photovoltaic installations are, in descending order: EPVI, EPVI_corr, NDBI, B8A, and NDVI_savg. High values of EPVI and EPVI_corr correspond to positive SHAP values, indicating that pixels with strong vegetation suppression and exposed impervious surfaces—typical characteristics of photovoltaic arrays—are more likely to be classified as such. Similarly, elevated NDBI and B8A values also contribute positively, consistent with the high near-infrared reflectance and low vegetation cover associated with solar installations. Conversely, high values of NDVI_savg correspond to negative SHAP values, to some extent reflecting that areas with dense vegetation are less likely to have photovoltaic installations. Moisture indices (Wetness and MNDWI) and several single-band features (B2, B7, B11) show SHAP values concentrated near zero, suggesting a relatively limited influence on classification in the study region. Figure 7 illustrates the 20 most important features, ordered according to their mean absolute SHAP values, which quantify each feature’s contribution to model output. Notably, EPVI, NDBI, and B8A exhibit the highest mean SHAP values, highlighting their dominant role in distinguishing PV (Class 1) from non-PV (Class 0) samples.
4.2. Accuracy and Consistency Assessment Results
To thoroughly assess the performance of the proposed classification approach, multiple aspects including classification accuracy, spatial consistency with existing databases, and visual completeness were analyzed. As demonstrated in Table 4, the classification scheme based on the selected feature subset achieved an overall accuracy of 98.40% and a Kappa coefficient of 0.963, outperforming the full-feature scheme (98.13% overall accuracy, Kappa = 0.962). For the photovoltaic (PV) class, producer’s and user’s accuracies were 98.2% and 98.1%, respectively, while for the non-PV class they reached 97.6% and 97.3%; in comparison, the all-feature classification exhibited slightly lower performance for the non-PV class (97.5% and 97.1%), indicating that feature selection enhances both overall and class-specific discriminative capability. Spatial consistency with the existing “PV extracted by Chen” dataset (covering the five northwestern provinces/autonomous regions) was evaluated using polygon-level intersection analysis (Table 5). Detection rates varied across provinces, with Qinghai achieving the highest rate at 93.8%, reflecting relatively concentrated PV layouts and low land cover heterogeneity, and Ningxia the lowest at 77.2%, likely due to dispersed PV distributions and higher heterogeneity. Shaanxi (84.5%), Xinjiang (85.3%), and Gansu (80.7%) achieved moderate to above-average detection rates, yielding an overall regional detection rate of 83.5%, which confirms strong spatial consistency and reliability between the newly generated dataset and the existing geospatial data. Visual validation was further conducted using three representative PV power plant areas overlaid on Google Earth imagery, median composite true-color Sentinel-2 imagery (September–December 2023), and the 2022 “PV extracted by Chen et al.” dataset (Figure 8). As illustrated in Figure 8a–c (Ningxia), Figure 8d–f (Qinghai), and Figure 8g–i (Gansu), The classified polygons in this study are more complete and better aligned with real-world imagery, accurately capturing newly constructed PV arrays in 2023 and correcting fine-scale discrepancies observed in the comparison dataset, such as omissions along the western edge in Ningxia and minor discontinuities in Gansu.
Table 4.
Accuracy of different classification schemes.
Table 5.
Consistency of our classification with existing PV database.
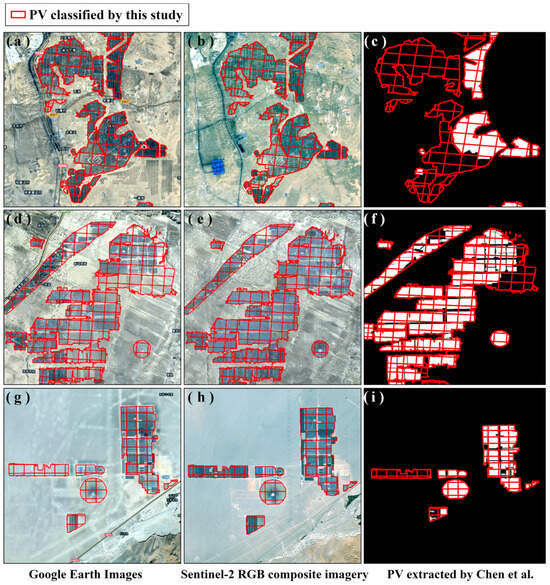
Figure 8.
Classification results of photovoltaic (PV) power plants (red boxes indicate PV plants identified in this study): (a,d,g) Google Earth images of representative PV areas; (b,e,h) corresponding Sentinel-2 RGB composite imagery; (c,f,i) PV areas extracted by Chen et al. [12].
Collectively, these findings indicate that the proposed classification method, in combination with the selected feature set, achieves high accuracy in discriminating between PV and non-PV classes, maintains strong spatial consistency with existing geospatial data, and effectively captures temporal updates and fine-scale boundary details. Furthermore, the spatial and areal analyses (Figure 9 and Figure 10) reveal that PV deployment in Northwest China exhibits a dual pattern of concentrated and dispersed layouts, with area expansion closely tracking installed capacity growth, validating the robustness and applicability of the provincial classification framework.
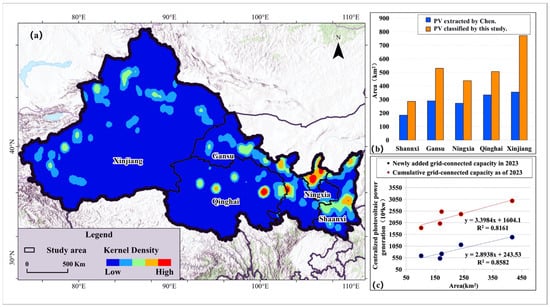
Figure 9.
Spatial distribution characteristics and statistical analysis of photovoltaic power plants. (a) Spatial distribution of the nuclear density of photovoltaic power stations in 2023. (b) Comparison of the area of photovoltaic power plants in different regions. (c) Correlation between the area of photovoltaic power plants and the newly added and cumulative grid-connected capacity in each region.

Figure 10.
The mapping result of PV power plants.
4.3. Spatial Distribution of PV Power Plants
As demonstrated in Figure 9a, kernel density analysis reveals the spatial distribution pattern of large-scale photovoltaic (PV) deployment across Xinjiang Uygur Autonomous Region, Gansu Province, Qinghai Province, Ningxia Hui Autonomous Region, and Shaanxi Province in China. High-density clusters are observed in northern Ningxia and central Shaanxi, while additional hotspot regions are present in southern Xinjiang and central Gansu, indicating concentrated PV development in these areas. Despite the relatively limited number of PV power plants in Qinghai, a distinct high-density cluster appears in its eastern region, reflecting localized centralized development. These spatial patterns are corroborated by the mapping of PV power plants in Figure 10, where plant locations closely align with the kernel density hotspots, providing direct evidence of spatial aggregation. By 2023, the cumulative area of PV installations across the five provinces reached approximately 2560 km2 (Figure 9b). Specifically, Shaanxi’s PV area increased from 184.02 km2 (“PV extracted by Chen”) to 286.11 km2, Gansu’s from 289.79 km2 to 529.72 km2, Ningxia’s from 272.11 km2 to 439.33 km2, Qinghai’s from 333.64 km2 to 506.48 km2, and Xinjiang’s from 354.37 km2 to 771.79 km2, ranking first among the provinces. Although hotspot intensity in southern Xinjiang is slightly lower than in Ningxia and Shaanxi, Xinjiang still exhibits the largest total installed area. Figure 10 shows that PV installations across the study region generally follow a dispersed spatial pattern. This pattern is especially evident in Xinjiang, where vast uninhabited zones, extensive desert surfaces, and large tracts of low-competition terrain allow PV arrays to spread over broad, continuous surfaces, resulting in the most pronounced spatial dispersion among the five provinces. As illustrated in Figure 9c, the relationship between area and installed capacity shows that the growth of newly added PV area and the expansion of cumulative area are closely aligned with increases in capacity. The regression analysis yields high coefficients of determination, indicating strong consistency between the mapped surface expansion and the official capacity statistics. This coherence confirms the reliability of the classification outputs. Spatial differences across the five provinces reflect varying combinations of land suitability and surface heterogeneity. Xinjiang possesses extensive flat or gently sloping terrain, large areas of developable unused land, and favorable solar irradiance conditions, all of which support the construction of large-scale, contiguous PV complexes. Qinghai and Gansu show moderately concentrated patterns, reflecting relatively coherent development zones but with greater terrain constraints than Xinjiang. In contrast, Ningxia and Shaanxi exhibit more fragmented PV distributions, shaped by higher land cover heterogeneity and limited contiguous construction patches. These contrasts account for the observed provincial deployment differences, with Xinjiang achieving the largest installed area while maintaining a broadly dispersed spatial structure.
5. Discussion
5.1. Scalability and Reliability of the Framework
This study adopts a systematic feature engineering and model optimization framework to achieve high-accuracy and interpretable identification of photovoltaic (PV) power plants. We first apply variance filtering to remove features with limited informational value, followed by an integrated assessment using Pearson correlation, point-biserial correlation, and mutual information. By examining inter-feature relationships from both linear and nonlinear perspectives, this process effectively reduces redundancy and noise within the feature space, thereby enhancing the comprehensiveness and robustness of feature selection.
During the feature optimization phase, we compared Relief-F—a distance-based heuristic approach—with Recursive Feature Elimination with Cross-Validation (RFECV), which is more tightly aligned with model behavior. Although Relief-F is computationally efficient, its model-agnostic nature limits its ability to fully capture classifier-specific feature interactions [52]. By contrast, RFECV, implemented with a random forest classifier, iteratively removes low-contribution features during model training and evaluates the predictive performance of candidate subsets through cross-validation, resulting in a closer integration between feature selection and the classifier [48]. Despite its substantially higher computational cost (approximately 10 h), findings from related fields suggest that model-oriented feature selection can significantly improve robustness and generalization [53]. Following this optimization, the final feature subset achieved outstanding generalization performance, with an overall accuracy of 98.4% and a Kappa coefficient of 0.963, demonstrating excellent stability and discriminative capability.
Compared with existing research, this study shows notable improvements in feature construction, selection strategies, and the overall classification framework. For example, Zhang et al. systematically demonstrated the importance of texture features for enhancing PV detection accuracy in remote sensing imagery. By incorporating GLCM texture features into medium-resolution imagery, they significantly improved the performance of random forest classification [41]. Building on this foundation, our study not only integrates texture features but also incorporates spectral, geometric, and other feature types. Through comprehensive redundancy filtering, model-integrated feature selection, and interpretability analysis, we achieve higher overall accuracy and improved generalization.
Another national-scale study by Liu et al. employed pixel-level random forest classification on 30 m Landsat imagery to map PV installations across China. Although suitable for large-scale assessments, this approach is susceptible to spectral mixing and “salt-and-pepper” noise, with limited capability in delineating complex boundaries [54]. In contrast, our study employs object-based classification combined with refined feature selection and SHAP interpretability analysis. This approach improves boundary consistency and classification stability while maintaining high computational efficiency, making it more suitable for detecting medium- to large-scale centralized PV plants with complex geometries.
Addressing the challenges of complex terrain, Mao et al. (2025) recently proposed an object-based method integrated with a cascaded random forest classifier using Sentinel-1/2 multisource data to improve PV identification in mountainous regions [55]. While their study highlights the potential of terrain-specific solutions, our work offers a generalized feature optimization and interpretability framework that performs effectively across diverse environments, including arid and semi-arid regions, demonstrating strong transferability.
Overall, this study demonstrates advantages over previous work in terms of the systematic nature of feature selection, the transparency of the classification methodology, the precision of boundary extraction, and the stability and generalizability of the model. To further validate the classification results, a trained researcher manually inspected more than 1000 randomly selected sample parcels, ensuring consistency and reliability. The entire workflow maintains high transparency, reproducibility, and methodological rigor while preserving flexibility and scalability, thus providing a robust technical foundation and high-quality data resource for future remote sensing–based analyses of energy infrastructure.
5.2. Main Sources of Misclassification
Identifying photovoltaic (PV) power plants in remote sensing imagery is often hindered by complex surface backgrounds, spectral mixing, and limitations in feature representation, which may lead to misclassification. To systematically analyze the sources of these errors, this study integrates SHAP explanation plots for representative samples (Figure 11a–d) with examples of major confusing land-cover types (Figure 12a–f), examining the issue from both the model’s decision mechanism and the spectral–spatial similarity of surface features. The SHAP analysis shows that the model’s decisions rely heavily on the values of key features. As illustrated in Figure 11a, when features such as EPVI, NDBI, and B8A contribute positively, the predicted score of a true PV sample increases from the baseline value of 0.493 to 0.979, resulting in correct classification. Conversely, when the same features contribute negatively (Figure 11b), the sample is misclassified as non-PV (score 0.007). Figure 11c,d further present examples in which non-PV samples are correctly or incorrectly classified depending on the direction of feature contributions, demonstrating that the model’s interpretation is strongly affected by surface materials, shadows, and variations in reflectance. These results indicate that classification outcomes emerge from the combined effects of multiple interacting features [56].
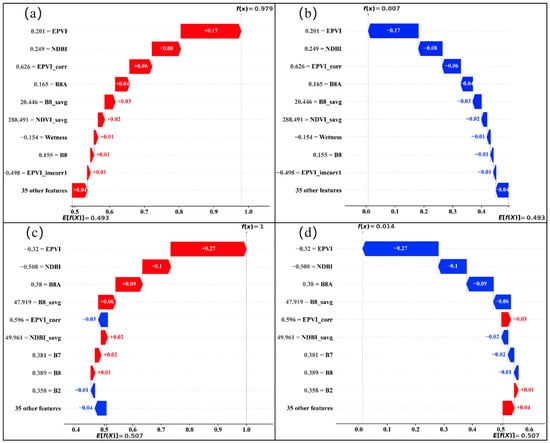
Figure 11.
SHAP waterfall explanation comparison between PV and non-PV samples. (a,b) Feature attribution for photovoltaic (PV) samples; (c,d) Feature attribution for non-photovoltaic (non-PV) samples.

Figure 12.
Illustration of the main sources of classification errors (rooted in spectral-spatial similarity between PV and non-PV land-cover types): (a) Bright, homogeneous desert-gobi surfaces; (b) Regularly arranged, highly reflective agricultural plastic greenhouses; (c) Mountain shadows that weaken spectral signals; (d) Linearly structured newly constructed road edges; (e) Uniformly reflective plastic playground surfaces; (f) Gobi gravel with uniform texture and indistinct boundaries.
The uncertainty in the model’s decisions fundamentally arises from the high spectral and spatial similarity between PV installations and several non-PV land-cover types [30]. Figure 12 shows six representative confusing categories: (a) bright and homogeneous desert–gobi surfaces; (b) highly reflective agricultural plastic greenhouses arranged in regular patterns; (c) mountain shadows that weaken spectral signals; (d) newly constructed road edges with linear structures; (e) uniformly reflective plastic playground surfaces; and (f) gobi gravel with uniform texture and indistinct boundaries. These examples indicate that intrinsic limitations of feature representation and the spectral–spatial similarity among surface types form the main sources of misclassification.
The types of confusion identified in this study are consistent with findings reported in previous research. Wang et al. used multi-source remote sensing data to construct a random forest classifier and achieved high PV detection accuracy across diverse landscapes, but also identified bare rock, mountain shadows, and highly reflective artificial structures (e.g., plastic sheds) as major sources of false positives and false negatives, in line with our observations [17]. Similarly, Zhang et al. demonstrated that texture features effectively improve the mapping of centralized PV power plants in flat areas [41]. Compared with these studies, the present work not only considers more complex environments—such as deserts and gobi regions with minimal texture variation—but more importantly connects specific misclassification cases (Figure 12) with the internal decision logic revealed by SHAP (Figure 11). This linkage deepens the understanding of the intrinsic causes of confusion from the perspective of feature contributions and complements existing discussions on the limitations of PV detection in complex scenes.
5.3. Limitations and Prospects
While the proposed framework enables large-scale, high-resolution mapping of photovoltaic (PV) power plants using spectral, textural features and machine-learning interpretation, certain limitations remain. In particular, distinguishing PV modules from visually similar surface materials, such as plastic greenhouses, bare soil, and shadowed mountainous terrains—continues to pose challenges in complex environments.
To investigate the spatial aggregation patterns of PV installations and the underlying driving mechanisms, we overlaid the kernel density of PV modules with PV output potential and incorporated centroid samples of 2023 PV deployment areas into the Maxent model, together with solar irradiance data obtained from the Global Solar Atlas developed by the World Bank Group in collaboration with Solargis (available at https://globalsolaratlas.info, accessed in 8 January 2025), as well as environmental variables such as distance to the power grid, transportation accessibility, nighttime light intensity, and elevation [57,58]. This enabled a preliminary identification of the key drivers influencing PV siting.
The results show that PV development in the region is shaped not solely by solar resource abundance but by the combined effects of resource availability, engineering feasibility, and institutional constraints. As illustrated in Figure 13, dense PV clusters tend to occur in areas with favorable illumination; however, their spatial coincidence with transmission infrastructure indicates that grid accessibility constitutes a primary constraint. Clusters are more likely to follow transmission corridors rather than simply occupying areas with the highest irradiance. Nighttime light intensity—used as a proxy for human and economic activity—further suggests that PV deployment avoids zones with high land-use competition, instead concentrating within buildable, grid-accessible, and low-conflict spatial windows. This pattern is consistent with earlier studies showing that PV siting often prioritizes minimizing land-use conflict [59].

Figure 13.
Spatial distribution of detected photovoltaic (PV) power plants, main power transmission lines, and NPP-VIIRS nighttime light data (2023 mean). (a) Kernel density estimation of PV power plants across the entire study area; (b–f) enlarged views of representative regions illustrating the spatial relationships among detected PV power plants, power transmission infrastructure, and nighttime light intensity.
The Maxent jackknife test results (Figure 14) further reveal that variables representing grid access, transportation access, and human activity—namely distance to transmission lines, distance to roads, and nighttime light intensity—exhibit the strongest independent predictive power. By contrast, irradiance and elevation primarily constrain the broader environmental envelope, while protected areas and hydrological networks act as secondary or redundant constraints indirectly represented by other variables. Together, these findings suggest a hierarchical structure in which infrastructure accessibility and engineering feasibility dominate PV deployment, with resource conditions serving as necessary but insufficient background determinants.
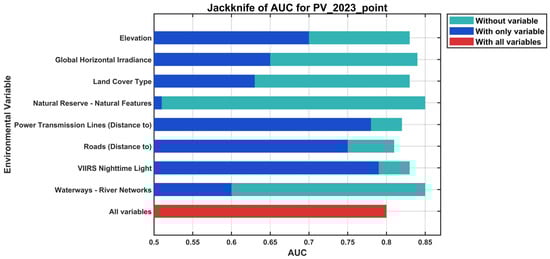
Figure 14.
Jackknife AUC results of the Maxent model for PV presence points (2023).
Future work should incorporate additional climatic variables—such as ambient temperature, atmospheric transmissivity, and long-term cloud cover—which directly influence PV performance and long-term operational efficiency. Including these factors would improve the reliability of suitability assessments, especially in regions where meteorological variability affects energy output. Integrating such variables into future analyses will support a more comprehensive understanding of the environmental constraints shaping PV deployment. Overall, these insights offer practical guidance for PV planning and underscore the value of multi-criteria approaches in reducing uncertainties in future siting decisions.
6. Conclusions
This study developed and applied an integrated remote sensing and interpretable machine learning framework on the GEE platform, resulting in the following key findings: (1) A 10 m resolution inventory of utility-scale PV power plants in Northwest China (as of Dec 2023) was produced, covering approximately 2560 km2. (2) The RFECV-optimized Random Forest model achieved a high classification accuracy, with an Overall Accuracy of 98.4% and a Kappa coefficient of 0.96. (3) SHAP analysis identified EPVI, NDBI, and Sentinel-2 Band 8A as the most influential features for PV identification. (4) A preliminary MaxEnt driver analysis revealed that grid accessibility and land-use constraints (proxied by nighttime light) were more decisive for existing PV clustering patterns than solar irradiance alone. (5) The generated dataset and the proposed framework provide a reliable baseline and a scalable tool for sustainable PV planning, monitoring, and impact assessment.
In order to enhance the transparency of the model, SHAP analysis was implemented, thereby facilitating a comprehensible evaluation of the contributions of the features. The findings suggest that a systematic evaluation and filtration of feature redundancy can remarkably enhance the comprehension of the feature set, while the optimized subset demonstrates augmented discriminative capacity for PV classification. The model exhibits a high degree of stability and reliability across all evaluation metrics. Furthermore, SHAP-based visualizations furnish lucid insights into the impact of salient features on classification outcomes, thereby offering a transparent perspective on the model’s decision-making process. A high-resolution PV spatial distribution dataset for 2023 was generated and released, covering the five northwestern provinces (autonomous regions) of China. This dataset provides a robust baseline for regional PV planning, land-use compliance monitoring, and environmental impact assessment. Of particular significance is the transferability of the proposed methodological framework, which enables its application to the remote sensing identification of other land-cover targets. The integration of interpretability, high-resolution mapping, and regional applicability in this approach not only advances technical understanding of PV deployment but also provides actionable data for sustainable energy planning and policy-making in resource-constrained and environmentally sensitive regions. The findings of this study establish a robust technical basis for regional photovoltaic infrastructure planning and optimization. Consequently, government agencies such as the National Energy Administration and provincial development and reform commissions, as well as non-governmental organizations focused on renewable energy transitions and land-use planning, can directly benefit from the spatial insights and methodological framework produced in this work.
7. Future Work
Based on the solid framework developed in this study, several directions for future research are suggested to improve both the scientific rigor and practical applicability of the methodology. First, to improve the temporal accuracy and real-world applicability of PV mapping, future studies should consider incorporating the spectral and geometric complexities associated with dynamic tilting systems and variable panel angles, which are increasingly common in modern utility-scale installations. Second, although the remote sensing-based classification achieved high statistical accuracy, experimental field validation against independent ground-truth measurements across diverse sites is essential to further strengthen the reliability and credibility of large-scale PV inventories. Third, assessing the generalizability and robustness of the framework is critical; this can be accomplished by applying the methodology to regions with markedly different climatic, topographic, and land-cover conditions beyond the arid Northwest China context. Finally, integrating the derived high-resolution PV maps with operational PV monitoring data could enable predictive modeling of energy production, providing dynamic information to support optimized regional energy management and infrastructure planning. Collectively, these extensions will reinforce the forward-looking perspective of the proposed framework, ensuring its continued relevance for sustainable PV planning, management, and decision-making under diverse environmental and operational conditions.
Supplementary Materials
The following supporting information can be downloaded at: https://www.mdpi.com/article/10.3390/su18020820/s1. The following supporting information is available to enhance reproducibility and transparency of the PV mapping workflow, feature selection, and classification analyses: statistical tables and Excel files (Mutual information result.xlsx, Pearson correlation results.xlsx, The 360 feature names after screening.xlsx), variance analysis (Variance calculation result.csv), feature selection and cross-validation results (RELIEF-F Fine Sample Interval Results.txt, RFECV 10-fold cross-validation -Results.txt), and shapefile datasets for PV and non-PV sample locations. Figures S1–S14 provide additional methodological details, classification results, spatial analyses, and feature importance visualizations. SNIC Segmentation Parameters and Sensitivity Analysis: SNIC Segmentation Parameter Evaluation Table (SNIC_parameter_sensitivity_results.xlsx), including size, compactness, connectivity, and neighborhoodSize parameter combinations, boundary fidelity assessment, and segmentation accuracy metrics. MaxEnt Model Outputs: MaxEnt Model Output Archive (MaxEnt_output_package.zip), containing environmental variable response curves, jackknife tests, permutation importance tables, ROC/AUC statistics, and model prediction rasters. These materials can be accessed at Zenodo (https://doi.org/10.5281/zenodo.17933514).
Author Contributions
Conceptualization, X.S. and W.L.; Methodology, X.S. and W.L.; Software, X.S., W.L. and Y.Y.; Validation, W.D.; Formal analysis, X.S., W.L. and W.D.; Investigation, X.S. and Y.Y.; Resources, L.W.; Data curation, X.S. and Y.W.; Writing – original draft, X.S. and W.L.; Writing – review & editing, W.L. and L.W.; Visualization, X.S. and Y.W.; Supervision, W.L.; Project administration, W.L.; Funding acquisition, X.S. All authors have read and agreed to the published version of the manuscript.
Funding
This research was funded by the Outstanding Youth Science Fund of Xi’an University of Science and Technology (2024YQ2-02) and the National Natural Science Foundation of China (NSFC, 52079103).
Institutional Review Board Statement
Not applicable.
Informed Consent Statement
Not applicable.
Data Availability Statement
The datasets used in this study are publicly available. Sentinel-1 and Sentinel-2 imagery were obtained from the Google Earth Engine platform (https://earthengine.google.com/, accessed on 8 December 2024). Additional datasets and scripts supporting the findings of this study are available from the corresponding author upon reasonable request. The datasets generated in this study, including the 2023 high-resolution photovoltaic power plant mapping product for Northwest China, are available at [Lyu, W. 2025. 2023 Dataset on Spatial Distribution of Photovoltaic Power Stations in Northwest China (v1.0) [Data set]. Zenodo. https://doi.org/10.5281/zenodo.17432548 (accessed on 23 October 2025)]. Source code and processing scripts are available from the corresponding author upon reasonable request.
Acknowledgments
We would like to express our gratitude to everyone who has contributed to this research, including those who have made contributions in aspects such as data collection and manuscript review.
Conflicts of Interest
The authors declare no conflicts of interest.
Abbreviations
| PV | Photovoltaic |
| GEE | Google Earth Engine |
| SAR | Synthetic Aperture Radar |
| RF | Random Forest |
| SHAP | SHapley Additive exPlanations |
| EPVI | Enhanced Photovoltaic Index |
| NDBI | Normalized Difference Built-up Index |
| NDVI | Normalized Difference Vegetation Index |
| MNDWI | Modified Normalized Difference Water Index |
| BSI | Bare Soil Index |
| GLCM | Gray Level Co-occurrence Matrix |
| SNIC | Simple Non-Iterative Clustering |
| RFECV | Recursive Feature Elimination with Cross-Validation |
| OA | Overall Accuracy |
| PA | Producer’s Accuracy |
| UA | User’s Accuracy |
| MI | Mutual Information |
| TCT | Tasseled Cap Transformation |
| NIR | Near Infrared |
| VIIRS | Visible Infrared Imaging Radiometer Suite |
| OB | Object-Based |
| Maxent | Maximum Entropy Model |
References
- International Renewable Energy Agency (IRENA). Future of Solar Photovoltaic: Deployment, Investment, Technology, Grid Integration, and Socio-Economic Aspects; International Renewable Energy Agency: Abu Dhabi, United Arab Emirates, 2019. [Google Scholar]
- Zheng, H.; Song, M.; Shen, Z. The evolution of renewable energy and its impact on carbon reduction in China. Energy 2021, 237, 121639. [Google Scholar] [CrossRef]
- Global Renewables Alliance; COP28 Presidency. Tripling Renewable Power and Doubling Energy Efficiency by 2030: Crucial Steps Towards 1.5 °C; Global Renewables Alliance: Dubai, United Arab Emirates, 2023. [Google Scholar]
- Zhao, X.; Ma, X.; Chen, B.; Shang, Y.; Song, M. Challenges toward carbon neutrality in China: Strategies and countermeasures. Resour. Conserv. Recycl. 2022, 176, 105959. [Google Scholar] [CrossRef]
- National Energy Administration (NEA). Statistical Bulletin on Electricity Industry 2023. Available online: https://www.nea.gov.cn (accessed on 23 October 2025).
- Ren, S.; Hu, W.; Bradbury, K.; Harrison-Atlas, D.; Malaguzzi Valeri, L.; Murray, B.; Malof, J.M. Automated extraction of energy systems information from remotely sensed data: A review and analysis. Appl. Energy 2022, 326, 119876. [Google Scholar] [CrossRef]
- Zhang, L.; Wang, Z.; Zhang, H.; Zhang, N.; Zhang, T.; Bao, H.; Chen, H.; Zhang, Q. Comparative performance of machine learning classifiers for photovoltaic mapping in arid regions using Google Earth Engine. Energies 2025, 18, 4464. [Google Scholar] [CrossRef]
- Wang, X.; Xiao, X.; Zhang, X.; Ye, H.; Dong, J.; He, Q.; Wang, X.; Liu, J.; Li, B.; Wu, J. Characterization and mapping of photovoltaic solar power plants by Landsat imagery and random forest: A case study in Gansu Province, China. J. Clean. Prod. 2023, 417, 138015. [Google Scholar] [CrossRef]
- Jiang, H.; Yao, L.; Lu, N.; Qin, J.; Liu, T.; Liu, Y.; Zhou, C. Multi-resolution dataset for photovoltaic panel segmentation from satellite and aerial imagery. Earth Syst. Sci. Data Discuss. 2021, 13, 5389–5401. [Google Scholar] [CrossRef]
- Kruitwagen, L.; Story, K.T.; Friedrich, J.; Byers, L.; Skillman, S.; Hepburn, C. A global inventory of photovoltaic solar energy generating units. Nature 2021, 598, 604–610. [Google Scholar] [CrossRef]
- Ren, S.; Malof, J.; Fetter, R.; Beach, R.; Rineer, J.; Bradbury, K. Utilizing geospatial data for assessing energy security: Mapping small solar home systems using unmanned aerial vehicles and deep learning. ISPRS Int. J. Geo-Inf. 2022, 11, 222. [Google Scholar] [CrossRef]
- Chen, Y.; Zhou, J.; Ge, Y.; Dong, J. Uncovering the rapid expansion of photovoltaic power plants in China from 2010 to 2022 using satellite data and deep learning. Remote Sens. Environ. 2024, 305, 114100. [Google Scholar] [CrossRef]
- Ball, J.E.; Anderson, D.T.; Wei, P. State-of-the-art and gaps for deep learning on limited training data in remote sensing. In Proceedings of the IGARSS 2018—2018 IEEE International Geoscience and Remote Sensing Symposium, Valencia, Spain, 22–27 July 2018; IEEE: New York, NY, USA, 2018; pp. 4119–4122. [Google Scholar] [CrossRef]
- Roscher, R.; Bohn, B.; Duarte, M.F.; Garcke, J. Explainable machine learning for scientific insights and discoveries. IEEE Access 2020, 8, 42200–42216. [Google Scholar] [CrossRef]
- Maxwell, A.E.; Warner, T.A.; Fang, F. Implementation of machine-learning classification in remote sensing: An applied review. Int. J. Remote Sens. 2018, 39, 2784–2817. [Google Scholar] [CrossRef]
- Ball, J.E.; Anderson, D.T.; Chan, C.S. Comprehensive survey of deep learning in remote sensing: Theories, tools, and challenges for the community. J. Appl. Remote Sens. 2017, 11, 042609. [Google Scholar] [CrossRef]
- Wang, J.; Liu, J.; Li, L. Detecting photovoltaic installations in diverse landscapes using open multi-source remote sensing data. Remote Sens. 2022, 14, 6296. [Google Scholar] [CrossRef]
- Lyu, X.; Li, X.; Wei, H.; Wu, J.; Dang, D.; Zhang, C.; Wang, K.; Lou, A. Mapping of utility-scale solar panel areas from 2000 to 2022 in China using Google Earth Engine. IEEE J. Sel. Top. Appl. Earth Obs. Remote Sens. 2024, 17, 18083–18095. [Google Scholar] [CrossRef]
- Zhang, Z.; Zhang, L.; Wu, J.; Guo, W. Optical and synthetic aperture radar image fusion for ship detection and recognition: Current state, challenges, and future prospects. IEEE Geosci. Remote Sens. Mag. 2024, 12, 132–168. [Google Scholar] [CrossRef]
- Zha, Y.; Gao, J.; Ni, S. Use of normalized difference built-up index in automatically mapping urban areas from TM imagery. Int. J. Remote Sens. 2003, 24, 583–594. [Google Scholar] [CrossRef]
- Feng, Q.; Niu, B.; Ren, Y.; Su, S.; Wang, J.; Shi, H.; Yang, J.; Han, M. A 10-m national-scale map of ground-mounted photovoltaic power stations in China of 2020. Sci. Data 2024, 11, 198. [Google Scholar] [CrossRef]
- Wang, J.; Chen, X.; Shi, T.; Hu, L.; Shi, W.; Du, Z.; Zhang, X.; Zhang, H.; Zeng, Y.; Hua, L.; et al. Mapping national-scale photovoltaic power stations using a novel enhanced photovoltaic index and evaluating carbon reduction benefits. Energy Convers. Manag. 2024, 318, 118894. [Google Scholar] [CrossRef]
- Bioucas-Dias, J.M.; Plaza, A.; Camps-Valls, G.; Scheunders, P.; Nasrabadi, N.; Chanussot, J. Hyperspectral remote sensing data analysis and future challenges. IEEE Geosci. Remote Sens. Mag. 2013, 1, 6–36. [Google Scholar] [CrossRef]
- Robnik-Šikonja, M.; Kononenko, I. Theoretical and empirical analysis of ReliefF and RReliefF. Mach. Learn. 2003, 53, 23–69. [Google Scholar] [CrossRef]
- Guyon, I.; Weston, J.; Barnhill, S.; Vapnik, V. Gene selection for cancer classification using support vector machines. Mach. Learn. 2002, 46, 389–422. [Google Scholar] [CrossRef]
- Lundberg, S.M.; Lee, S.-I. A unified approach to interpreting model predictions. In Advances in Neural Information Processing Systems; MIT Press: Cambridge, MA, USA, 2017; p. 30. [Google Scholar]
- Nohara, Y.; Matsumoto, K.; Soejima, H.; Nakashima, N. Explanation of machine learning models using improved Shapley additive explanation. In Proceedings of the 10th ACM International Conference on Bioinformatics, Computational Biology and Health Informatics, Niagara Falls, NY, USA, 7–10 September 2019; p. 546. [Google Scholar] [CrossRef]
- Durlević, U.; Ilić, V.; Valjarević, A. Wildfire Susceptibility Mapping Using Deep Learning and Machine Learning Models Based on Multi-Sensor Satellite Data Fusion: A Case Study of Serbia. Fire 2025, 8, 407. [Google Scholar] [CrossRef]
- Qu, Z.; Jiang, C.; Wang, Y.; Wang, R.; Zhao, Y.; Yang, S. China’s photovoltaic development and its spillover effects on carbon footprint at cross-regional scale: Insights from the largest photovoltaic industry in Northwest arid area. Sustainability 2024, 16, 9922. [Google Scholar] [CrossRef]
- Chen, Y.; Zhang, L.; Yan, M.; Wu, Y.; Dong, Y.; Shao, W.; Zhang, Q. Identification and land-environment analysis of centralized photovoltaic stations in the arid northwest region of China. Int. J. Digit. Earth 2025, 18, 2468419. [Google Scholar] [CrossRef]
- Zhang, X.; Liu, L.; Wu, C.; Chen, X.; Gao, Y.; Xie, S.; Zhang, B. Development of a global 30-m impervious surface map using multi-source and multi-temporal remote sensing datasets with the Google Earth Engine platform. Earth Syst. Sci. Data Discuss. 2020, 12, 1625–1648. [Google Scholar] [CrossRef]
- Razzano, F.; Iandolo, M.R.; Zarro, C.; Yogesh, G.S.; Ullo, S.L. Integration of Sentinel-1 and Sentinel-2 data for Earth surface classification using machine learning algorithms implemented on Google Earth Engine. In Proceedings of the 2023 IEEE India Geoscience and Remote Sensing Symposium (InGARSS), Bangalore, India, 10–13 December 2023; IEEE: New York, NY, USA, 2023; pp. 1–4. [Google Scholar] [CrossRef]
- Gouvêa, E.C.; Sobrinho, P.M.; Souza, T.M. Spectral response of polycrystalline silicon photovoltaic cells under real-use conditions. Energies 2017, 10, 1178. [Google Scholar] [CrossRef]
- Bhandari, A.K.; Kumar, A.; Singh, G.K. Feature extraction using normalized difference vegetation index (NDVI): A case study of Jabalpur city. Procedia Technol. 2012, 6, 612–621. [Google Scholar] [CrossRef]
- Rouse, J.W.; Haas, R.H.; Schell, J.A.; Deering, D.W. Monitoring the Vernal Advancement and Retrogradation (Green Wave Effect) of Natural Vegetation; NASA Contractor Report (NASA-CR-132982); National Aeronautics and Space Administration, Goddard Space Flight Center: Cleveland, OH, USA, 1973. [Google Scholar]
- Xu, H. Modification of normalised difference water index (NDWI) to enhance open water features in remotely sensed imagery. Int. J. Remote Sens. 2006, 27, 3025–3033. [Google Scholar] [CrossRef]
- Rikimaru, A.; Roy, P.S.; Miyatake, S. Tropical forest cover density mapping. Trop. Ecol. 2002, 43, 39–47. [Google Scholar]
- Bruzzone, L.; Fernàndez Prieto, D. Unsupervised retraining of a maximum likelihood classifier for the analysis of multitemporal remote sensing images. IEEE Trans. Geosci. Remote Sens. 2002, 39, 456–460. [Google Scholar] [CrossRef]
- Zhu, Z.; Woodcock, C.E. Object-based cloud and cloud shadow detection in Landsat imagery. Remote Sens. Environ. 2012, 118, 83–94. [Google Scholar] [CrossRef]
- Shi, T.; Xu, H. Derivation of tasseled cap transformation coefficients for Sentinel-2 MSI at-sensor reflectance data. IEEE J. Sel. Top. Appl. Earth Obs. Remote Sens. 2019, 12, 4038–4048. [Google Scholar] [CrossRef]
- Zhang, X.; Zeraatpisheh, M.; Rahman, M.M.; Wang, S.; Xu, M. Texture is important in improving the accuracy of mapping photovoltaic power plants: A case study of Ningxia Autonomous Region, China. Remote Sens. 2021, 13, 3909. [Google Scholar] [CrossRef]
- Gnana, D.A.A.; Appavu, S.A.B.; Jebamalar Leavline, E. Literature review on feature selection methods for high-dimensional data. Int. J. Comput. Appl. 2016, 136, 9–17. [Google Scholar] [CrossRef]
- Guyon, I.; Elisseeff, A. An introduction to variable and feature selection. J. Mach. Learn. Res. 2003, 3, 1157–1182. [Google Scholar]
- Sedgwick, P. Pearson’s correlation coefficient. BMJ 2012, 345, e4483. [Google Scholar] [CrossRef]
- Brown, J.D. Point-biserial correlation coefficients. Statistics 2001, 5, 12–16. [Google Scholar]
- Kraskov, A.; Stögbauer, H.; Grassberger, P. Estimating mutual information. Phys. Rev. E Stat. Nonlinear Soft Matter Phys. 2004, 69, 066138. [Google Scholar] [CrossRef] [PubMed]
- Mahmood, T.; Usman, M.; Conrad, C. Selecting relevant features for random forest-based crop type classifications by spatial assessments of backward feature reduction. PFG—J. Photogramm. Remote Sens. Geoinf. Sci. 2025, 93, 173–196. [Google Scholar] [CrossRef]
- Mustaqim, A.Z.; Adi, S.; Pristyanto, Y.; Astuti, Y. The effect of recursive feature elimination with cross-validation (RFECV) feature selection algorithm toward classifier performance on credit card fraud detection. In Proceedings of the 2021 International Conference on Artificial Intelligence and Computer Science Technology (ICAICST), Yogyakarta, Indonesia, 29–30 June 2021; IEEE: New York, NY, USA, 2021; pp. 270–275. [Google Scholar] [CrossRef]
- Tassi, A.; Vizzari, M. Object-oriented LULC classification in Google Earth Engine combining SNIC, GLCM, and machine learning algorithms. Remote Sens. 2020, 12, 3776. [Google Scholar] [CrossRef]
- Xia, Z.; Li, Y.; Chen, R.; Sengupta, D.; Guo, X.; Xiong, B.; Niu, Y. Mapping the rapid development of photovoltaic power stations in northwestern China using remote sensing. Energy Rep. 2022, 8, 4117–4127. [Google Scholar] [CrossRef]
- Belgiu, M.; Drăguţ, L. Random forest in remote sensing: A review of applications and future directions. ISPRS J. Photogramm. Remote Sens. 2016, 114, 24–31. [Google Scholar] [CrossRef]
- Reyes, O.; Morell, C.; Ventura, S. Scalable extensions of the ReliefF algorithm for weighting and selecting features on the multi-label learning context. Neurocomputing 2015, 161, 168–182. [Google Scholar] [CrossRef]
- Yuan, Y.; Wang, J.; Zhu, D.; Wang, J.; Wang, T.; Yang, K. Feature extraction and classification method of coal gangue acoustic signal during top coal caving. J. Min. Sci. Technol. 2021, 6, 711–720. [Google Scholar]
- Zhang, X.; Xu, M.; Wang, S.; Huang, Y.; Xie, Z. Mapping Photovoltaic Power Plants in China Using Landsat, Random Forest, and Google Earth Engine. Earth Syst. Sci. Data 2022, 14, 3743–3755. [Google Scholar] [CrossRef]
- Mao, H.; Liu, W.; Chen, X.; Tian, Z.; Zarrella, A.; Luo, Y.; Fan, J.; Wu, W. A Method for Mapping the Distribution of Photovoltaic Power Stations in Complex Terrain Regions. Renew. Energy 2025, 247, 122964. [Google Scholar] [CrossRef]
- Zhao, C.; He, D.; Qiao, Y. Identification method of multi-feature weed based on multi-spectral images and data mining. Trans. Chin. Soc. Agric. Eng. 2013, 29, 192–198. [Google Scholar]
- Phillips, S.J.; Anderson, R.P.; Schapire, R.E. Maximum Entropy Modeling of Species Geographic Distributions. Ecol. Model. 2006, 190, 231–259. [Google Scholar] [CrossRef]
- Tekin, S.; Guner, E.D.; Cilek, A.; Unal Cilek, M. Selection of Renewable Energy Systems Sites Using the MaxEnt Model in the Eastern Mediterranean Region in Turkey. Environ. Sci. Pollut. Res. 2021, 28, 51405–51424. [Google Scholar] [CrossRef]
- Levin, N.; Kyba, C.C.M.; Zhang, Q.; Sánchez de Miguel, A.; Román, M.O.; Li, X.; Portnov, B.A.; Molthan, A.L.; Jechow, A.; Miller, S.D.; et al. Remote sensing of night lights: A review and an outlook for the future. Remote Sens. Environ. 2020, 237, 111443. [Google Scholar] [CrossRef]
Disclaimer/Publisher’s Note: The statements, opinions and data contained in all publications are solely those of the individual author(s) and contributor(s) and not of MDPI and/or the editor(s). MDPI and/or the editor(s) disclaim responsibility for any injury to people or property resulting from any ideas, methods, instructions or products referred to in the content. |
© 2026 by the authors. Licensee MDPI, Basel, Switzerland. This article is an open access article distributed under the terms and conditions of the Creative Commons Attribution (CC BY) license.