Abstract
Land use/cover change (LUCC) is a dominant driver of ecosystem service dynamics in arid inland basins. Focusing on the Yarkant River Basin (YRB), Xinjiang, we coupled the PLUS land-use simulation with the InVEST Habitat Quality Model to project 2040 land-use patterns under four policy scenarios—Natural Development (ND), Arable Protection (AP), Ecological Protection (EP), and Economic Development (ED)—and to quantify their impact on habitat quality. Model validation against the 2020 map indicated strong agreement (Kappa = 0.792; FOM = 0.342), supporting scenario inference. From 1990 to 2023, arable land expanded by 58.17% and construction land by 121.64%, while forest land declined by 37.45%; these shifts corresponded to a basin-wide decline and increasing spatial heterogeneity of habitat quality. Scenario comparisons showed the EP pathway performed best, with 32.11% of the basin classified as very high-quality habitat and only 8.36% as very low-quality. In contrast, under ED, the combined share of very low + low quality reached 11.17%, alongside greater fragmentation. Spatially, high-quality habitat concentrates in forest and grassland zones of the middle–upper basin, whereas low-quality areas cluster along the oasis–desert transition and urban peripheries. Expansion of arable and construction land emerges as the primary driver of degradation. These results underscore the need to prioritize ecological-protection strategies especially improving habitat quality in oasis regions and strengthening landscape connectivity to support spatial planning and ecological security in dryland inland river basins.
1. Introduction
Ecosystem services encompass the processes by which ecosystems maintain the environmental conditions and functions essential for human well-being, delivering diverse direct and indirect benefits to society [1]. Among global change drivers, land use/land cover change (LUCC) reshapes Earth’s surface properties, reorganizing ecosystem structure and function and thereby modulating ecosystem services across space and time [2,3]. These dynamics are especially pronounced in arid inland basins, where water scarcity and fragile ecotones amplify the sensitivity of ecosystem services to human disturbance. In western China’s Yarkant River Basin (YRB), rapid urbanization and agricultural expansion have intensified competition for limited water resources, heightened biodiversity risks, and posed new challenges to regional ecological security, constraining sustainable development [4]. Within the national strategy emphasizing the “integrated conservation and systematic management of mountains, waters, forests, farmlands, lakes, grasslands, and deserts” and promoting “harmonious coexistence between humans and nature,” robust, decision-oriented evidence on how LUCC influences ecosystem functions in ecologically fragile, glacier-fed basins like the YRB is urgently needed to balance development and conservation and to advance ecological civilization.
Despite growing applications of the PLUS–InVEST framework, much of the existing literature prioritizes single ecosystem services (e.g., carbon storage or habitat quality) and focuses on provincial, municipal, or single-watershed scales, limiting its utility for basin-scale, policy-sensitive planning in arid regions [5,6,7]. Moreover, the spatiotemporal evolution of habitat quality—a pivotal proxy for biodiversity maintenance and ecological security—has rarely been assessed under multiple, policy-relevant LUCC scenarios in typical inland river basins such as the YRB, where oasis–desert transitions and cryosphere-regulated hydrology create distinctive constraints and trade-offs [8,9]. Recent studies underscore additional sources of pressure and uncertainty for the YRB: glacier and snowmelt variability that redistributes runoff seasonally and interannually, with implications for ecological flows and downstream habitat integrity [10], and basin-scale management decisions that couple mid-/upper-reach water consumption to downstream ecological outcomes [11]. In parallel, advances in scenario-based land use modeling and ecosystem service assessment provide a path to integrate policy constraints with spatial competition among land types, enabling more credible projections and trade-off analyses for territorial spatial planning. In this context, we take the Yarkant River Basin (YRB) in Xinjiang as the study area and explicitly set out to: (i) Simulate LUCC patterns to 2040 using the PLUS model under four policy-relevant scenarios: natural development, arable land protection, ecological protection and economic development. (ii) Couple these simulations with the InVEST habitat quality module to quantitatively evaluate how alternative land trajectories are expected to affect habitat quality. (iii) Elucidate the spatial response relationships among land conversion, threat gradients, and biodiversity-maintenance potential. (iv) Derive scenario-specific planning implications that support territorial spatial optimization, ecological protection and restoration, and sustainable development in the YRB’s mountain–oasis–desert system while accounting for stringent water-resource constraints.
The overall research framework integrating these objectives, methodological steps, and analytical components is visually summarized in Figure 1. It illustrates two main analytical streams: (a) the LUCC and Habitat Quality Simulation Process, which integrates historical land use data (1990–2023) with drivers (natural factors, soil, roads) to simulate past habitat quality and project future LULC (2040s) and habitat quality under four scenarios; and (b) the Land–Ecological Importance Analysis, which synthesizes the simulated 2040s LULC and habitat quality to assess the importance of land–ecological functions under each scenario. This study provides a basin-scale, policy-sensitive assessment of habitat quality in a glacier-fed arid basin using coupled PLUS–InVEST modeling, quantifies the ecological impacts of four policy-driven land-use scenarios, and translates scenario outcomes into spatially explicit planning implications for territorial spatial optimization under water-resource constraints.
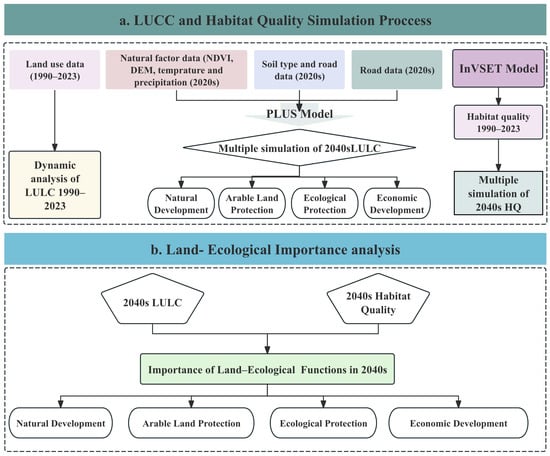
Figure 1.
Research Framework.
2. Materials and Methods
2.1. Study Area
The Yarkant River Basin (YRB; 73°30′–80°00′ E, 35°40′–39°30′ N) lies on the western margin of the Tarim Basin in southwestern Xinjiang, China [12]. The basin exhibits a typical arid continental climate and a mountain–oasis–desert ecological configuration, with physiographic units comprising extensive mountainous headwaters, alluvial/plains, and oasis belts; the mountainous region occupies the largest proportion of the basin area [13]. An overview map of the YRB, including its major physiographic zones and hydrometric stations, is provided in Figure 2.

Figure 2.
Overview of the study area.
Surface hydrology is dominated by the Yarkant and Tiznafu rivers, whose flows are primarily sustained by high-altitude glacier and seasonal snowmelt, resulting in pronounced intra-annual variability [14]. At Kaqun Station—the outlet control of the Yarkant River—annual discharge during 1954–2022 ranged from 4.468 to 9.553 × 10⁹ m3·a−1 (mean 6.730 × 10⁹ m3·a−1), corresponding to a mean annual runoff depth of 146.66 mm. At Jiangka Station on the Tiznafu River, annual discharge varied between 5.85 × 10⁸ and 1.359 × 10⁹ m3·a−1 (mean 9.00 × 10⁸ m3·a−1). Baseflow contributes ~21.3% of total runoff, whereas July–September flows are dominated by meltwater inputs; during this period, meltwater accounts for 73.9% of annual flow, and mean annual snowfall is ~231 mm [15].
Groundwater resources in the plain area are estimated at 3.258 × 10⁹ m3. Under ecological balance constraints, the allowable (ecologically sustainable) abstraction should not exceed 9.19 × 10⁸ m3·a−1. Due to interannual instability of surface water supply and historical over-extraction, groundwater levels in the irrigation district have shown a persistent decline, with water-table fall rates of ~0.165–0.300 m·a−1; fluctuations are relatively smaller in the upper reaches of the district [16].
Cropping systems are dominated by cotton, wheat, maize (Zea mays L.), and commercial orchards. The sown area for grain crops increased from 131,000 hm2 in 1953 to 253,000 hm2 in 2015, reflecting sustained agricultural expansion [17]. From 1991 to 2016, the district’s average agricultural output accounted for ~9.50% of Xinjiang’s total and ~58.53% of the Kashgar region’s total. Irrigation relies primarily on river-fed canal systems, with groundwater well irrigation as a supplementary source.
2.2. Data Sources and Processing
We assembled four categories of spatial datasets to drive the future land-use simulations: (1) multi-period land-use/land-cover (LULC) maps for 1990–2023 obtained from the Resource and Environment Science and Data Center of the Chinese Academy of Sciences (https://www.resdc.cn/), classified into six classes—arable land, forest land, grassland, water areas, construction land, and unused land; (2) natural factors comprising topography (Digital Elevation Model, DEM), climate (mean annual temperature, annual precipitation), and environmental layers (soil type, vegetation type); (3) socio-economic rasters including gridded population and gross domestic product (GDP); and (4) transportation accessibility variables derived from distances to county government seats, roads, railways, and highways. Detailed data sources are summarized in Table 1.

Table 1.
Data sources.
All rasters were harmonized to a common 30 m grid, reprojected to Krasovsky_1940_Albers, and clipped using China’s standard national boundary for consistency, then masked to the Yarkant River Basin (YRB) extent. To preserve thematic integrity, categorical datasets (e.g., LULC, soil, vegetation) were resampled using nearest-neighbor, whereas continuous variables (e.g., DEM, temperature, precipitation, GDP, population) were resampled using bilinear interpolation (Table 2). From the DEM, we derived slope to represent terrain constraints on land conversion. Transportation and administrative-center influences were quantified as Euclidean distance raster’s (m) to county seats, roads, railways, and highways; to reduce skewness in accessibility gradients, these distance layers were optionally log-transformed after adding a small constant.
Table 2.
Contribution of driving factors to the expansion of different land use types during the historical period (1990–2020).
To ensure comparability across predictors, continuous drivers were standardized (z-score). Prior to model input, we screened for multicollinearity using pairwise correlation and variance inflation factor (VIF), retaining variables with |r| ≤ 0.7 and VIF < 10 to maintain model stability. Historical LULC layers (1990–2023) were used solely to construct the driving-factor stack and provide training samples for suitability learning in PLUS, while all drivers were co-registered and masked to the intersection of valid pixels across layers.
2.3. Methods
2.3.1. Land Use Dynamic Change
We interpreted multi-temporal remote-sensing imagery at five epochs (1990, 2000, 2010, 2020, 2023) to produce a harmonized land-use dataset for the Yarkant River Basin (YRB). We then quantified spatiotemporal dynamics in terms of class composition, annualized rates of change, and transition patterns. Following [23], we calculated both the single-class dynamic degree and the comprehensive dynamic degree for 1990–2000, 2000–2010, 2010–2020, 2020–2023, and cumulatively for 1990–2023. The single-class metric captures the rate of change in an individual land-use category over a given interval, whereas the comprehensive metric measures the overall intensity of land-use transformation across the study area. To characterize conversion directions and magnitudes among categories, we constructed land-use transfer matrices for each pair of adjacent epochs, enabling identification of dominant transition pathways and interpretation of underlying landscape-evolution processes.
The formula for calculating the single land use dynamics [24]:
where Ua represents the area of a specific land use type at the beginning of the study period (km2), Ub denotes the area of the same land use type at the end of the study period (km2), and t refers to the length of the study period. The value of K indicates the annual rate of change (%) for each land use type in the study area.
2.3.2. Land Use Pattern Prediction: PLUS Model
The PLUS model is a patch-level land-use simulation framework that integrates multidimensional drivers socioeconomic, policy, and environmental together with spatial constraints and geographic context to predict dynamic land-use change. Its principal advantage lies in capturing fine-scale transitions at high spatial resolution while enabling scenario-based evaluation of policy and development pathways, thereby providing decision-relevant support for urban planning and land management [25]. Accordingly, the PLUS model was adopted in this study to project China’s land-use patterns for 2040.
In the PLUS model, the neighborhood influence factor (range 0–1) quantifies the extent to which a land-use class is promoted by adjacent patches of the same or different classes. Values approaching 1 indicate a stronger propensity for local clustering and edge expansion, whereas values near 0 imply weak dependence on neighboring land uses. In this study, three scenarios were defined. Neighborhood weights for these scenarios were derived from the proportional expansion of each land-use class relative to the total expansion observed during 1990–2020. The resulting weights were cropland 0.38, forest land 0.11, grassland 0.09, water bodies 0.20, construction land 0.04, and unused land 0.19. To incorporate distinct policy preferences into our simulations, we adjusted the neighborhood weights for each scenario (Table 3). Under the Natural Development (ND) scenario, historical weights were maintained. For Arable Protection (AP), we increased the weight for cropland to enhance its spatial clustering. In the Ecological Protection (EP) scenario, we raised the weights for forest and grassland to promote their aggregation and recovery, while reducing the weight for construction land. Conversely, for the Economic Development (ED) scenario, we elevated the weight for construction land to reflect accelerated urban expansion. These adjusted neighborhood weights, together with the scenario-specific transition matrices (Table 4), guide the simulation of divergent future land-use patterns.
Table 3.
Neighborhood weights for land use types under different policy scenarios.
Table 4.
The transfer matrix of different scenario.
2.3.3. Dynamic Analysis of Habitat Quality: InVEST Model
Habitat quality is a composite indicator of an ecosystem’s capacity to provide conditions suitable for species survival, reproduction, and the maintenance of biodiversity, and it is widely regarded as a core parameter for evaluating ecosystem service functions [26]. In this study, we used the Habitat Quality Model (HQM) within the InVEST framework to quantify spatial patterns of habitat degradation and the resilience of natural ecosystems.
For model computation, land-use/land-cover (LUCC) data and normalized difference vegetation index (NDVI) rasters served as the primary inputs. Key ecological stressors and class-specific habitat sensitivity parameters were specified according to local environmental conditions and known species vulnerabilities. The model integrates these factors to produce spatially explicit habitat quality scores and corresponding degradation maps, thereby providing a scientific basis for ecological conservation planning and biodiversity protection across the YRB region [27].
where Qxj and Dxj are the habitat quality and habitat threat level, respectively, Hj is the habitat suitability level of land cover type j, K is the half-saturation constant, Yr is the number of grids with r threat sources, Wr is the weight of threat factor r, ry is the y coercion value of the grid, βx is the accessibility of the threat source to grid x, irxy is the coercion value of the threat source r to grid x in grid y, and Sjr is the sensitivity of land cover type j to threat factor r.
2.3.4. Evaluation of Land–Ecological Function Importance
To obtain a more comprehensive understanding of how future land-use changes may influence ecosystem services, this study reclassified projected land-use types in the Yarkant River Basin into five major categories: (1) Construction Land, (2) Unused Land, (3) Cultivated Land, (4) Grassland and Forest Land, and (5) Water Bodies. Habitat quality results were likewise standardized and reclassified into five ordinal levels ranging from 1 (very low) to 5 (very high) [28].
Subsequently, a weighted overlay analysis integrating land-use and habitat-quality layers was performed to delineate the spatial distribution of land–ecological importance grades within the basin. This composite evaluation enabled the identification of key ecological areas where high habitat quality coincides with critical land-use dynamics under future development scenarios, thereby highlighting priority zones for conservation, ecological restoration, and sustainable land management in the study area.
Figure 3 delineates the technical route for analyzing ecological responses under multi-scenarios, which outlines the core methodology and presents the resultant framework of this study.

Figure 3.
Technical route of ecological response analysis under multi-scenarios.
3. Results
3.1. Analysis of Land Use Change from 1990 to 2023
As summarized in Table 5, the Yarkant River Basin experienced pronounced structural shifts in land use between 1990 and 2023. Cultivated land expanded continuously from 4200.84 km2 to 6644.16 km2 (+2443.32 km2; +58.2% relative to 1990), with its share of the basin increasing by roughly three percentage points, consistent with intensified agricultural development and expansion of oasis-based production. In contrast, forest land contracted markedly from 1250.58 km2 to 782.18 km2 (a loss of 468.40 km2; −37.5%), implying a potential weakening of associated ecological functions. Grassland, the dominant class, remained relatively stable and persisted at approximately 37% of the basin area throughout the period, thereby maintaining its role as the ecological baseline.
Table 5.
Changes in Land Use Area in the Yarkant River Basin (1990–2023).
Water bodies and arable land exhibited pivotal transitions around 2010. Water area shrank by 887.57 km2 (−15.58%) between 2000 and 2010, declining from 5699.67 km2 to 4812.10 km2. However, a clear reversal occurred thereafter, with a net recovery of 605.17 km2 (+12.58%) by 2023, bringing the total to 5417.27 km2 (Table 5). This rebound pattern aligns with the variability in cryosphere inputs (e.g., glacier and snowmelt), although formal attribution would require dedicated hydrological analysis. In parallel, arable land—despite occupying a relatively small total area—increased rapidly during the study period, a trend indicative of accelerated urbanization and infrastructure development. Finally, unused land exhibited a persistent decline, reflecting both a general intensification of land development and the deepening footprint of human activities across the basin.
From a spatial distribution perspective, land use in the Yarkant River Basin displays clear gradient characteristics and reflects a distinct pattern of human–environment interaction. Grassland and unused land are widely distributed across the mid- to upper-mountain zones and along the outer desert margins, forming the regional background landscape. Cultivated land is primarily concentrated along riverbanks and within oasis areas in the mid- to lower reaches, creating a ribbon-shaped agricultural corridor that depends heavily on water availability. Water bodies are mainly distributed in linear and patch-like forms along major river channels and lakes, with noticeable recovery observed after 2010—likely linked to changes in glacial meltwater dynamics under a warming climate. Forest land is scattered and relatively fragmented, mostly confined to areas with favorable moisture conditions such as shaded mountain slopes, yet it shows a trend of increasing fragmentation over time. Construction land is highly concentrated in oasis towns and along transportation corridors, forming a point–axis development structure.
The recovery of water area around 2010 may be attributed to increased glacier and snowmelt under climate warming as well as the implementation of regional water transfer and ecological restoration policies. For instance, the Tarim River Basin Comprehensive Management Project and the Ecological Water Conveyance Program launched in the late 2000s in Xinjiang have contributed to the replenishment of river channels and lakes in the mid-lower reaches. In contrast, the rapid expansion of construction land after 2020 is closely linked to accelerated infrastructure development under the Belt and Road Initiative, advancing urban–rural integration, and the continued rise in urbanization rate in Xinjiang since 2016, particularly driven by the development of the Kashgar Economic Zone and surrounding areas. These changes reflect how policy interventions and natural processes jointly shape land-use patterns, suggesting that future land management should emphasize the coordination between water resource regulation and compact urban development.
Overall, this spatial configuration reflects both the fundamental influence of natural geographic constraints—such as topography and water availability on land-use patterns and the intensifying concentration of human activity within oasis regions. Together, these features illustrate the evolving human–land coupling relationship typical of arid inland river basins.
3.2. Dynamic Characteristics of Land Use from 1990 to 2040
Using the PLUS model, we simulated the 2020 land-use pattern from a 2000 baseline by incorporating natural and socio-economic driving factors and then compared the simulation with the observed 2020 map (Figure 4). The simulated spatial pattern closely matched the actual distribution of 2020 land-use types.
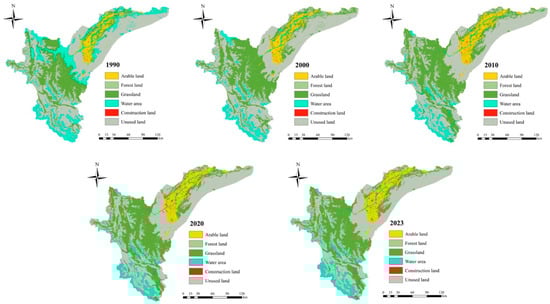
Figure 4.
Spatial Distribution of Land Use (1990–2023).
For validation, we report the Kappa coefficient and the Figure of Merit (FOM), both ranging from 0 to 1. In general, Kappa > 0.7 indicates high simulation accuracy, while FOM > 0.2 is acceptable and FOM > 0.3 denotes good performance [18].
Our results yielded Kappa = 0.792 and FOM = 0.342, demonstrating strong agreement with observations. These metrics indicate that PLUS effectively reproduces land-use change in the study area and provides reliable inputs for subsequent ecosystem-service simulations with InVEST (Figure 5).
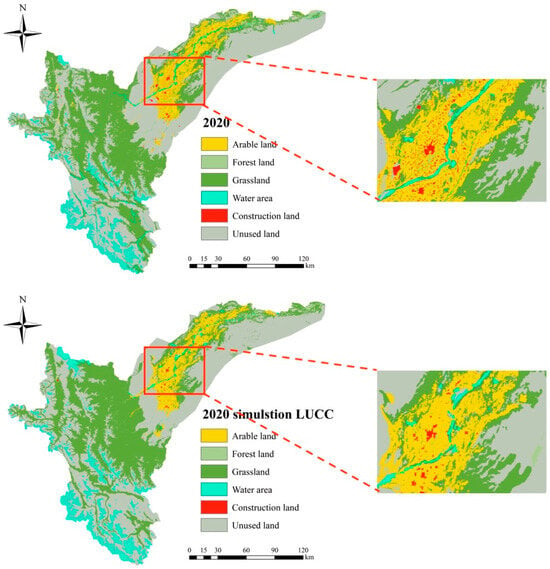
Figure 5.
Comparison of Actual and Simulated Land Use in the Yarkant River Basin, 2020.
Based on the 2040 projections summarized in Table 6, arable land, on the other hand, maintained a consistent growth trajectory. Its area increased by 27.09% (84.56 km2) from 2010 to 2020. Looking ahead, scenario projections (Table 6) highlight significant differences in post-2020 expansion rates. Under the Natural Development (ND) scenario, construction land is projected to grow at ~6.35 km2/yr, reaching 523.55 km2 by 2040 (a 32.00% increase from 2020). This expansion rate is more than double that under the Economic Development (ED) scenario (~2.80 km2/yr), which would result in an area of 452.56 km2 (a 14.10% increase from 2020). Scenario analysis reveals distinct trajectories:
Table 6.
Area and proportion of land use types in Yarkant River Basin in 2040 and under different scenarios.
- Natural Development: Cultivated (arable) land expands to 7920.33 km2 (9.66% of the basin), continuing historical agricultural growth but likely increasing pressure on limited water resources.
- Cultivated Land Protection: Cultivated land is constrained to 6570.35 km2, reflecting policy interventions aimed at sustainable agricultural development.
- Ecological Protection: Forest land and grassland show modest increases, while water bodies remain relatively stable, underscoring an emphasis on ecosystem restoration.
- Economic Development: Construction land increases notably, consistent with continued urbanization and infrastructure expansion.
Across all scenarios, the share of unused land declines, indicating intensifying land development and utilization and, more broadly, a growing human footprint on the basin environment.
Spatially, the 2040 configurations exhibit clear policy-driven contrasts. Under Natural Development, cultivated land expands markedly—often along river corridors and oasis fringes—reflecting continued dependence on water resources and a heightened risk of encroachment on ecological lands (Figure 6). The Arable Land Protection scenario curbs unregulated farmland expansion, yielding a more spatially intensive (compact) agricultural distribution that supports regional sustainability. Under Ecological Protection, forest and grassland recover to some extent, improving connectivity in ecological barrier zones and contributing to more stable water bodies, thereby reinforcing ecosystem integrity. In the Economic Development scenario, construction land grows substantially, concentrated along transportation corridors and urban peripheries, highlighting the dominant influence of urbanization and economic growth on land use. Collectively, these contrasting patterns emphasize that the trade-offs among agricultural management, ecological restoration, and urban expansion will ultimately shape the basin’s long-term sustainability.
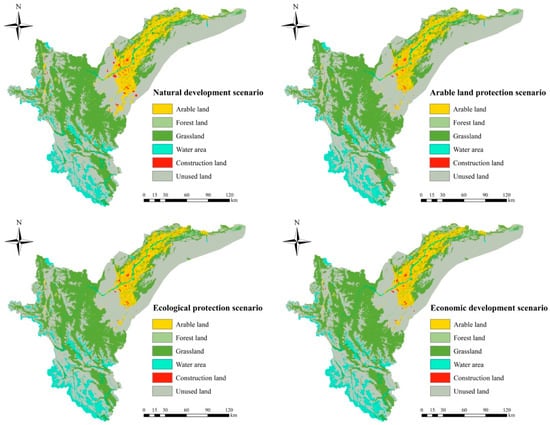
Figure 6.
Simulated Land Use Patterns in the Yarkant River Basin under Different Scenarios for 2040.
3.3. Dynamics of Habitat Quality Under Different Scenarios from 1990 to 2040
Time-series analysis for the Yarkant River Basin shows a clear decline in the habitat quality index from 0.04–0.74 in 1990 to 0.01–0.67 in 2020 (Figure 7). This degradation aligns with concurrent expansion of cultivated land, irrigated areas, and construction land, underscoring the substantial impact of intensive land use on local habitats. Although the upper bound of habitat quality remained relatively stable in 2000 and 2010, the overall downward trend indicates a gradual loss of ecological function in core areas. Moreover, the widening gap between minimum and maximum values points to increasing spatial heterogeneity, with an emerging contrast between high-quality core zones and degraded areas.
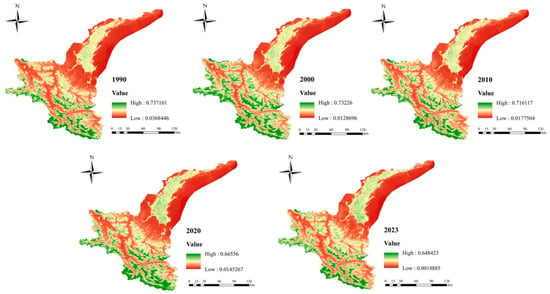
Figure 7.
Spatial Distribution of Habitat Quality in the Yarkant River Basin (1990–2023).
Spatially, habitat quality is strongly heterogeneous. High-quality habitats are concentrated in mountainous regions, natural forests, grasslands, and unused desert margins, whereas low-quality habitats cluster in oasis agricultural zones, urban and rural built-up areas, and along transportation corridors. Scenario comparisons indicate that the Ecological Protection scenario markedly reduces the extent of low-quality patches and enhances connectivity among core ecological areas, suggesting that stringent conservation measures can effectively mitigate fragmentation. In contrast, the Economic Development scenario expands low-quality habitats around urban peripheries, further fragmenting ecologically functional land. These outcomes confirm that the spatial configuration of land use decisively shapes habitat quality patterns; managing spatial conflicts between ecological conservation and economic development is therefore critical for sustainable basin management.
Table 7 summarizes the spatial distribution of habitat-quality grades in 2040 across four development scenarios. Basinwide, medium and very high grades dominate and together account for nearly 80% of the total area, establishing the fundamental ecological pattern of the region. Subtler but policy-relevant differences emerge in the areas classified as very low, low, and high quality, revealing where development strategies exert pressure or create opportunities for ecological improvement.
Table 7.
Habitat quality grades under different scenarios.
The overall decline in habitat quality from 1990 to 2020 is closely associated with continuous cultivated land expansion and point–axis sprawl of construction land, forming distinct “quality depressions” especially in oasis agricultural zones and urban–rural fringes. Although the post-2010 recovery of water bodies improved local habitats to some extent, it failed to reverse the overall degradation trend, indicating that restoration of a single landscape element cannot offset systemic development pressure. Scenario comparisons reveal that under the Ecological Protection scenario, strict conservation of mountain forests and natural grasslands coupled with restrictions on oasis expansion can significantly enhance habitat connectivity and quality stability. In contrast, the Economic Development scenario further exacerbates habitat fragmentation, particularly around urban peripheries and along transportation corridors. This highlights that the spatial configuration of land use exerts greater ecological influence than changes in the area of a single land type. Sustainable basin management should therefore focus on optimizing the spatial pattern of ecological, agricultural, and urban land, supported by policies that integrate ecological redline protection with urban growth boundary delineation.
3.4. Habitat Quality Dynamics Across Scenarios
Under the Natural Development scenario, the share of very low-quality habitat reaches 10.13%, the highest among all scenarios. This indicates that, in the absence of strong policy intervention, the path dependence of socio-economic development elevates the risk of habitat degradation—driven by urban expansion, infrastructure construction, and agricultural reclamation. In sharp contrast, the Ecological Protection scenario records the lowest proportion of very low-quality habitat (8.36%) and the highest proportion of very high-quality habitat. This dual shift—fewer low-quality areas and more high-quality areas—demonstrates that proactive measures (e.g., ecological redlines, targeted restoration) can effectively curb degradation while maintaining or even enhancing high-quality habitats, which is essential for biodiversity conservation and the delivery of ecosystem services.
The Cultivated Land Protection and Economic Development scenarios yield intermediate outcomes. Under Cultivated Land Protection, the proportion of very low-quality habitat remains relatively low, though the area of high-quality habitat is slightly below that in the Ecological Protection scenario—reflecting the delicate balance between food-security goals and ecological conservation. Under Economic Development, the proportion of low-quality habitat is the highest among all scenarios, highlighting the ecological costs of growth-oriented strategies in which intensified human activity degrades habitat quality over broader areas.
In sum, the tabulated results show that development strategy directly shapes future habitat quality trajectories, with Ecological Protection emerging as the most favorable pathway for regional ecological security and sustainable development.
Figure 8 maps the spatial distribution of habitat quality in 2040 across the four scenarios. Very high and high habitat-quality zones align strongly with core ecological features—montane forests, major watersheds, and designated protected areas—forming key ecological corridors that support critical regulatory functions, including water conservation, soil retention, and biodiversity maintenance.
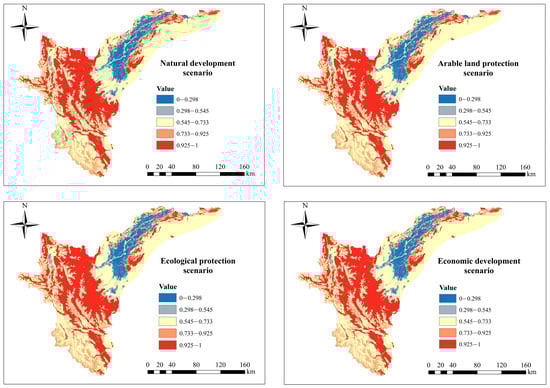
Figure 8.
Spatial Distribution of Habitat Quality in the Yarkant River Basin under Alternative Scenarios for 2040.
Conversely, areas of moderate to very low habitat quality form contiguous clusters primarily within urban settlements, intensively cultivated landscapes, and along major transportation corridors. This pronounced spatial polarization indicates a strong negative association between anthropogenic disturbance and habitat integrity. Urban expansion, industrial development, and agricultural intensification are the principal drivers of habitat fragmentation and quality decline. Scenario comparisons highlight the superior performance of the Ecological Protection pathway: it preserves the integrity of core ecological patches, substantially reduces both the extent and connectivity of very low-quality clusters, and strengthens linkages among high-quality patches to create more continuous habitat networks. Such configurations mitigate edge effects, facilitate species dispersal, and sustain key ecological processes. In contrast, the Economic Development scenario produces marked increases in low-quality habitat through dispersed peri-urban sprawl, accelerating fragmentation, promoting habitat insularization, and posing significant long-term risks to regional ecological security.
These findings provide clear spatial evidence to inform strategic land-use planning. They underscore the need for stringent ecological safeguards to protect core habitats and for the deliberate establishment of ecological corridors to enhance functional connectivity. Integrating these measures is essential to maintain ecosystem resilience and achieve sustainable regional development.
3.5. Impact of Land Use Change on Habitat Quality Under Different Scenarios
To more comprehensively evaluate the impacts of land-use change on ecosystem services, we performed an equal-weight overlay of habitat-quality change surfaces and land-use change maps. This approach reveals basin-wide responses in the Yarkant River Basin (YRB), characterizes the spatial coupling between ecological pressures associated with specific land-use types and the intrinsic ecological functions of the land, quantifies the degree to which land-use change affects habitat quality, and delineates priority areas for future habitat restoration.
A statistical synthesis of land–ecological significance grades across the four development scenarios (Table 8) shows a consistent spatial pattern and policy sensitivity. In every scenario, medium and higher ecological grades (medium, high, very high) dominate, together accounting for >89% of the basin. The medium grade is the largest component, remaining stable between 45.67% and 46.36%, indicating that overall ecological functionality is at a moderate to upper-moderate level, while clear potential remains to expand high-quality ecological spaces through targeted conservation and restoration.
Table 8.
Land–Ecological Significance Grades in the YRB.
Under the Ecological Protection scenario, high-quality ecological areas are best maintained: the “Extremely high” grade covers 30,822.24 km2 (37.57%), the largest share among all scenarios. Simultaneously, this scenario records the smallest “Extremely low” area (397.29 km2; 0.48%), underscoring the effectiveness of an ecological-priority strategy. By contrast, the Economic Development scenario, while yielding a relatively large “High” grade area (5110.16 km2), accumulates 8653.18 km2 across the combined “Extremely low” and “Low” grades—suggesting that growth-oriented development may come at the expense of ecological quality, particularly in peripheral areas.
3.6. Correspondence Between Land-Use Types and Ecological Grades
Oasis areas correspond primarily to medium and high ecological grades and function as core zones sustaining regional ecological functions. By contrast, unused land and construction land are predominantly associated with low ecological grades, indicating strong inhibitory effects on habitat quality. Accordingly, future management should prioritize elevating habitat quality within oasis landscapes for example, by optimizing agricultural landscape patterns and strengthening ecological connectivity to achieve basin-wide improvements in ecological functioning.
The spatial distribution of land–ecological significance (Figure 9 and Figure 10) further highlights pronounced heterogeneity and its tight coupling with land-use patterns. Areas of high ecological significance are concentrated in a belt-like configuration across the core oasis zones of the middle and upper reaches, showing strong spatial congruence with grassland, forest land, and selected water bodies. These regions maintain comparatively intact ecological functions and superior habitat quality, and they constitute critical components of the basin’s ecological security framework.
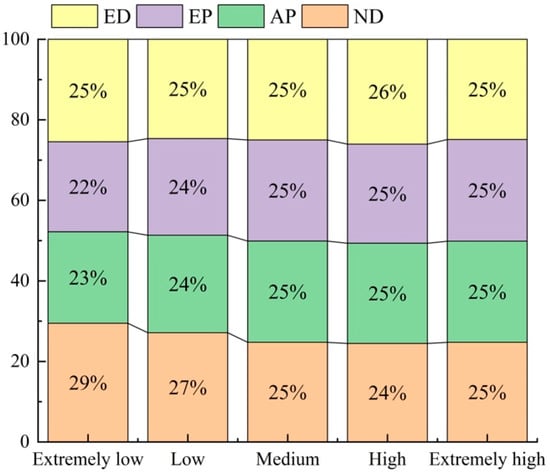
Figure 9.
Stacked Percentage Chart of Land Ecological Significance.
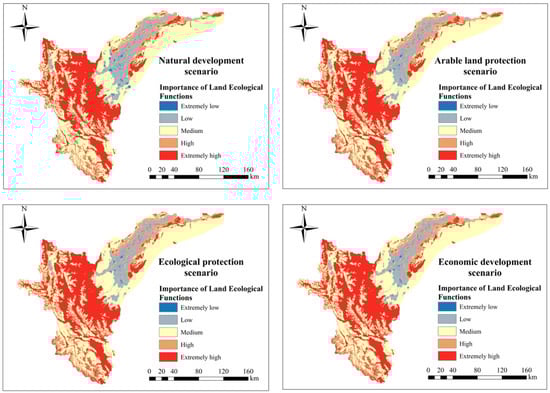
Figure 10.
Spatial Distribution of Land Ecological Significance in the YRB.
Medium-grade ecological areas are widespread across the oasis–desert transition zones and agricultural regions, exhibiting a distinctly patchy mosaic. This pattern reflects the dual effect of agriculture on ecological quality: while cultivated land supplies certain ecosystem services, its expansion can simultaneously fragment ecological landscapes.
Low-grade ecological areas cluster mainly in downstream unused lands, peri-urban construction zones, and oasis fringes. These locations combine fragile biophysical conditions with intensive human disturbance, resulting in elevated risks of habitat degradation. Scenario contrasts are pronounced: the Ecological Protection scenario achieves superior connectivity among high-grade areas, forming a relatively integrated ecological network, whereas the Economic Development scenario produces evident isolation of high-quality patches. From a land-use-change perspective, construction-land expansion is typically accompanied by declines in nearby ecological grades, while ecological restoration of unused land effectively enhances regional habitat quality.
Accordingly, future ecological restoration in the Yarkant River Basin should prioritize:
- (a)
- Oasis–desert transition zones establish ecological buffer belts to curb desertification.
- (b)
- Peri-urban areas build ring (circular) ecological corridors to mitigate urbanization pressures and improve connectivity.
- (c)
- Downstream ecologically vulnerable zones—implement vegetation restoration and related measures to strengthen ecological functions.
Targeted spatial-planning strategies focused on these priority areas can deliver basin-wide improvements in habitat quality and optimize the region’s ecological security pattern.
4. Discussion
4.1. Comparative Analysis with Different Research
Our findings exhibit both generalizable patterns and YRB-specific features relative to existing literature. The projected decline in habitat quality under Natural Development aligns with observations from other arid inland river systems, including the Amu Darya (Central Asia) and the Heihe River Basin (China), where agricultural reclamation and urban expansion drive fragmentation in oasis–desert ecotones [29,30]. What distinguishes the YRB is its glacier-fed hydrologic regime: our simulations emphasize a pronounced tele-coupling whereby downstream degradation is tightly linked to water consumption upstream, reflecting a “glacier–hydrology–ecology” continuum. This dependency implies heightened sensitivity compared with precipitation-dominated basins and echoes evidence from the Tarim River Basin that underscores the conservation urgency of glacier-dependent watersheds [31].
Methodologically, the PLUS–InVEST pairing advances beyond CA-Markov–InVEST by using the Land Expansion Analysis Strategy (LEAS) to represent patch growth and policy constraints more faithfully [32]. This capability allowed our Ecological Protection Scenario to go beyond area quotas, incorporating spatially explicit conversion probabilities derived from historical dynamics—enhancing policy relevance for spatial planning. At the same time, our study shares a recurrent limitation of InVEST 3.14.0 applications: insufficient parameter localization. Compared with studies that leverage extensive species-distribution data for calibration (e.g., in the Qinling Mountains), our parameterization relies more on literature and expert knowledge, which can affect absolute accuracy for desert riparian and plateau–desert ecosystems [33]. Addressing this gap is a priority for future work. From a management perspective, the scenario comparisons provide transparent trade-offs for planners. Crucially, in the YRB, water-resource carrying capacity must be treated as a hard constraint for any conservation or restoration strategy. This aligns with reflective work on the Loess Plateau, arguing for a shift from indiscriminate greening to precision restoration guided by water availability and nature-based solutions, a prerequisite for durable ecological security in vulnerable arid regions.
4.2. Mechanisms Through Which Land Use Change Influences Habitat Quality
In setting up the transition matrix for this study, the approach was primarily based on logical judgments derived from policy orientation and historical transition trends [34]. For instance, in the “Ecological Protection” scenario, construction land expansion into ecological land was prohibited, whereas in the “Economic Development” scenario, such expansion was allowed. While this simplified treatment can broadly distinguish different policy pathways at a macro level, it does not capture the gradient differences in transition probabilities for the same conversion type (e.g., conversion from arable land to construction land) under different scenarios [35]. More importantly, the design of these scenarios directly responds to and embodies the core objectives of key regional policies. The “Ecological Protection” scenario aligns with the strategic requirements of the national “Ecological Civilization Construction” and Xinjiang’s “Several Policies and Measures to Strengthen Ecological Environmental Protection and Resolutely Fight the Pollution Prevention and Control Battle,” prioritizing the conservation of forest, grassland, and water areas. The “Arable Land Protection” scenario reflects the bottom-line constraints of China’s “National Land Space Planning Outline (2021–2035)” and the “Xinjiang Uygur Autonomous Region Arable Land Protection Implementation Plan” on the quantity and quality of cultivated land. The “Economic Development” scenario considers the growth demands outlined in the “Kashgar Regional Central City Development Plan” and the “Comprehensive Agricultural Development Planning of the Yarkant River Basin,” simulating the potential land pressure from urbanization and oasis agriculture expansion. Our simulation results, particularly the evident degradation of habitat quality under the Economic Development scenario and its significant improvement under the Ecological Protection scenario, provide a quantitative spatial reference for these policies. They reveal the potential ecological costs of prioritizing economic growth and validate the positive effects of strict ecological conservation, offering a scientific basis for adjusting the intensity and spatial layout of future policies.
Nevertheless, PLUS model’s built-in patch-generating mechanisms, including the Patch-generating Land Use Simulation (PLUS) and the multi-type of random patch seeding mechanism, have spatially simulated the competition and randomness in the expansion of different land types, partially compensating for the simplification of the transition matrix [36]. Moreover, in designing the scenarios, this study incorporated neighborhood effect weights, total land use demand constraints, and spatial restriction layers. Together, these settings collectively influenced the final spatial distribution patterns, enabling distinct spatial differentiations to emerge across scenarios (as shown in Table 4 and Figure 5). These differentiated spatial patterns offer targeted insights for territorial spatial planning at different levels. At the basin level, the expansion of low-quality habitat around oasis–desert transition zones under the Economic Development scenario underscores the urgency of implementing the “Yarkant River Basin Comprehensive Management Plan” to establish ecological buffer zones. At the county/city level, the high fragmentation of habitat around construction land clusters highlights the need to integrate the “urban development boundaries” and “ecological protection red lines” defined in local territorial spatial plans (e.g., Kashgar City, Shache County). Specifically, our findings suggest that future urban expansion should be strictly guided away from critical ecological corridors in the middle–upper reaches and towards areas with lower ecological sensitivity, as identified in the simulation. For agricultural planning, the “Arable Land Protection” scenario demonstrates that curbing uncontrolled farmland sprawl and promoting intensive use can mitigate habitat degradation while ensuring food security, which aligns with the goal of “building high-standard farmland” in the region. Therefore, this study translates macro policy objectives into spatially explicit land-use configuration suggestions, enhancing the operability of ecological conservation and land-use planning.
Future research could be improved in the following aspects: (1) Develop gradient-based transition probability matrices by integrating historical conversion probabilities and expert knowledge to more accurately reflect transition tendencies under different policy scenarios; (2) Introduce machine learning or Bayesian network methods to dynamically calibrate transition rules based on multi-source data; (3) Adopt participatory scenario development approaches to incorporate inputs from stakeholders, enhancing the realism and policy relevance of scenario construction.
4.3. Projected Dynamics of Habitat Quality in the YRB
Using the PLUS–InVEST model chain, we projected habitat quality in the Yarkant River Basin (YRB) to 2040 under multiple development scenarios. The results show that alternative land-use management strategies yield markedly different ecological outcomes, yet the reliability and limitations of these projections warrant careful consideration.
A principal strength of this work is the integrated use of PLUS and InVEST in this basin, linking the drivers and spatial competition of land-use change to standardized, spatially explicit habitat assessments. Relative to traditional CA-Markov implementations, PLUS better represents spatial policy constraints and patch-level contagion, improving the realism of future landscape configurations [37]. The InVEST habitat quality module then enables quantitative, map-based comparison across our four scenarios Natural Development, Ecological Protection, Economic Development, and Cultivated Land Protection providing decision-oriented evidence for territorial spatial planning. It is important to note that the InVEST Habitat Quality Model is a static, snapshot-based tool that does not account for intra-annual or interannual dynamics in vegetation growth, hydrological fluxes, or species movements. This means our habitat quality scores represent a long-term average condition rather than fluctuating states. While this limits the model’s ability to predict short-term ecological responses to climatic extremes or seasonal water availability, it remains appropriate for comparing the relative outcomes of different land-use trajectories over decadal scales, which is the primary aim of this study.
Nonetheless, several uncertainties remain. First, habitat-quality estimates are sensitive to InVEST parameterization, including the weights assigned to threat factors (e.g., arable land, construction land), maximum influence distances, and decay functions. Although these parameters were informed by literature and expert judgment, they lack systematic local calibration for the YRB’s distinctive ecosystems (e.g., desert riparian forests, plateau deserts), which may bias assessments. For example, land labeled “unused” is often given low suitability, yet in hyper-arid environments certain unused surfaces can harbor rare desert biota whose sensitivity to disturbance may be underestimated [38,39]. Second, InVEST provides a static assessment and omits key eco-hydrological processes. In the YRB, water availability is the dominant limiting factor [40,41]; thus, even without land-cover conversion, declining groundwater due to upstream withdrawals can degrade habitat quality—“hidden degradation” that a static model cannot capture, potentially leading to optimistic projections under Natural and Economic Development scenarios [42]. Third, our workflow does not explicitly propagate climate-change signals (e.g., warming, precipitation shifts) into vegetation suitability and species distributions, adding another layer of uncertainty.
4.4. Limitations and Future Perspectives
Several important limitations inherent to our modeling framework must be acknowledged, as they delineate critical avenues for future research. First, the InVEST habitat quality module is a static, empirical assessment tool. It does not dynamically simulate the critical eco-hydrological processes definitive of the YRB, such as groundwater decline due to irrigation extraction or shifts in glacier–snowmelt regimes under climate change. These processes can induce “hidden degradation” whereby habitat quality deteriorates even in the absence of land-cover conversion—a phenomenon our current model cannot capture. Second, while our PLUSs incorporated scenario-specific land demand targets and spatial rules (e.g., adjusted neighborhood weights and transition matrices), the underlying socioeconomic and climatic driving factors (e.g., gridded GDP, population) were held constant based on recent historical snapshots. This setup overlooks how these core drivers themselves might evolve differentially under each policy scenario (e.g., varying population growth rates or water conservation policy intensity).
Addressing these limitations requires a concerted effort across multiple fronts in future work: (1) Enhanced parameter localization through field surveys to calibrate species- and ecosystem-specific threat sensitivities within InVEST; (2) Dynamic model coupling to integrate process-based eco-hydrological models (e.g., SWAT) with InVEST. This would allow dynamic variables like soil moisture and groundwater depth to modulate habitat suitability in real time, directly addressing the “hidden degradation” issue; (3) Full scenario integration of future climate projections (e.g., from CMIP6) as dynamic drivers in PLUS and as modifiers of habitat suitability in InVEST; and (4) Internalization of scenario-driven socioeconomic dynamics, such as using scenario-adjusted projections of population and GDP growth to replace static driver layers in PLUSs. Pursuing this integrated model chain—one that dynamically couples climate projections, socio-economic pathways, hydrological processes, land-use decisions, and habitat responses—is essential to move from comparative static assessments towards a more mechanistic, process-based understanding of habitat quality sustainability in this water-limited and policy-sensitive basin.
5. Conclusions
Using the PLUS–InVEST framework, this study simulated multi-scenario land-use trajectories and assessed their ecological consequences for the Yarkant River Basin (1990–2040). Between 1990 and 2023, cultivated land and construction land increased by 58.17% and 121.64%, respectively, while forest land declined by 37.45%. These shifts collectively contributed to an overall decline in habitat quality and an intensification of spatial heterogeneity.
Scenario analyses to 2040 reveal clear policy sensitivities. The Ecological Protection Scenario (EPS) most effectively maintains ecological conditions, yielding the highest share of very high-grade habitat (32.11%) and the lowest share of very low-grade habitat (8.36%). In contrast, the Economic Development Scenario (EDS) expands the combined area of very low + low grades to 11.17%, amplifying habitat fragmentation. Spatially, high-quality habitats remain concentrated in forest and grassland of the middle–upper reaches, whereas low-quality areas cluster around oasis–desert transition zones and urban settlements. Across scenarios, expansion of construction land and cultivated land emerges as the principal driver of habitat degradation.
The study also acknowledges its limitations, including uncertainties in model parameter localization for unique local ecosystems and the inherent constraints of static habitat assessment in capturing dynamic eco-hydrological processes. These aspects highlight priorities for future research, such as integrating field data for model calibration and coupling with process-based eco-hydrological models.
These findings support a management pathway that prioritizes ecological protection, with emphasis on: (i) enhancing habitat quality in oasis landscapes through optimized agricultural patterns and improved ecological connectivity; (ii) establishing a water-dependent ecological restoration framework that treats water-resource carrying capacity as a hard constraint; and (iii) strictly protecting core ecological spaces while guiding growth away from ecologically sensitive areas. Implemented together, these measures can safeguard ecological security and advance sustainable development in the Yarkant River Basin. This research makes a novel contribution to regional sustainability science by integrating scenario-based land-use modeling with spatial ecological assessment within a coupled human–water–ecosystem framework. The findings not only provide robust quantitative evidence for the environmental trade-offs of development pathways in a key arid region, but also offer a transferable analytical framework for planning future sustainable land systems under climate change and increasing human pressure.
Author Contributions
Conceptualization, M.T., Y.M. and Q.N.; formal analysis, A.K., P.A. and M.T.; methodology, A.K. and M.T.; data curation and validation, A.K. and Q.N.; Writing and revising the original draft, M.T., Y.M., Q.N. and P.A.; project administration and supervision, Y.M. All authors have read and agreed to the published version of the manuscript.
Funding
This study was jointly supported by the project “Tianshan Leading Talent” Program Project of the Autonomous Region Talent Development Fund (Project No. 2024TSYCLJ0013); 2023 Autonomous Region Major Science and Technology Special Project (Project No. 2023A02002-4); “Study on the Release Operation and Benefits of the Altash Reservoir” (Project No. XLZ2022-132).
Institutional Review Board Statement
Not applicable.
Informed Consent Statement
Not applicable.
Data Availability Statement
The original contributions presented in this study are included in the article. Further inquiries can be directed to the corresponding author.
Conflicts of Interest
The authors declare no conflicts of interest.
References
- Wei, W.; Zhang, Y.; Wei, X.; Xie, B.; Ma, Z.; Liu, C.; Yu, L.; Zhou, J.; Shi, W.; Liu, T.; et al. Construction. and optimization of ecological security patterns based on ecosystem service function and ecosystem sensitivity in the important ecological functional area—A case study in the yellow river basin. Ecol. Eng. 2025, 215, 107609. [Google Scholar] [CrossRef]
- Gao, X.; Hu, Y.; Zhang, Z.; Jiao, Y.; Ji, W.; Qian, Y.; He, Y.; Pei, L.; Yin, Y.; Hu, Y.; et al. Analysis of the spatiotemporal evolution of cultivated land in the Chaohu basin based on the PLUS model and multi-scenario simulation. Sustain. Futures 2025, 10, 100945. [Google Scholar] [CrossRef]
- Yang, C.; Duan, H.; Yu, X. Land use-driven shifts in shorebird habitat connectivity along the Yellow and Bohai sea coasts: Dynamics and scenario predictions. Biol. Conserv. 2024, 300, 110869. [Google Scholar] [CrossRef]
- Li, C.; Xu, H.; Du, P.; Tang, F. Predicting land cover changes and carbon stock fluctuations in Fuzhou. China: A deep learning and InVEST approach. Ecol. Indic. 2024, 167, 112658. [Google Scholar] [CrossRef]
- Obateru, R.O.; Okhimamhe, A.A.; Fashae, O.A.; Olusola, A.O.; Dragovich, D.; Conrad, C. Assessing the Status of Ecosystem Regulating Services in the Urbanising Rainforest and Guinea Savanna Ecological Regions of Nigeria Using InVEST Models. Urban Clim. 2025, 61, 102410. [Google Scholar] [CrossRef]
- Munkhtur, P.; Oostdijk, M.; Cook, D. Habitat Degradation and Quality Assessment of Khyargas Lake, Western Mongolia and Adjacent Terrestrial and Freshwater Areas. J. Environ. Manag. 2025, 394, 127325. [Google Scholar] [CrossRef]
- Zou, M.; Qiang, F.; Yu, X.; Liu, G.; Zhou, Z.; Liu, C.; Ai, N. Impact of Ecological Restoration Projects on Watershed Habitat Quality in the Loess Plateau of China: A Case Study of the Yanhe River Basin. Ecol. Indic. 2025, 180, 114351. [Google Scholar] [CrossRef]
- Manna, H.; Pramanik, M.; Pal, R.; Sarkar, S.; Zhran, M.; Halder, B. Land Use Land Cover Change and Habitat Quality Degradation in the Tropical Megacity of Bangkok: An Integrated CA–Markov and InVEST Modeling Approach (1995–2045). Environ. Sustain. Indic. 2025, 28, 101036. [Google Scholar] [CrossRef]
- Mohamed, N.; Mremi, R.; Jiang, C.; Kavana, D.J.; Mwaya, R.T.; Li, B. Spatial and Temporal Variations in Habitat Quality across the Distribution Range of the Critically Endangered East African Chelonian, Pancake Tortoise (Malacochersus tornieri). Glob. Ecol. Conserv. 2025, 62, e03773. [Google Scholar] [CrossRef]
- Lenar-Matyas, A.; Korpak, J.; Wałęga, A.; Radecki-Pawlik, A. The Impact of Anthropogenic Modification of a Mountain River Channel on the Quality of Aquatic Habitats. J. Environ. Manag. 2025, 392, 126625. [Google Scholar] [CrossRef]
- Jiao, A.; Deng, X.; Gong, Y.; Ling, H. Increasingly Enhanced Water Resources Management Effectively Promotes the Synergistic Development of Ecosystem Services in Inland River Basins in Arid Regions—A Case Study of Tarim River. Ecol. Indic. 2025, 178, 113835. [Google Scholar] [CrossRef]
- Wei’an, S.; Yue, H.; Tie, L.; Zhongxu, L.; Chanjuan, Z.; Xiaofei, W. Application of deep learning and temperature spatial field in the runoff simulation of headwaters of the Yarkant River. Prog. Geogr. 2025, 44, 631–641. [Google Scholar] [CrossRef]
- Zhang, S.; Bai, J.; Gao, J. Response of runoff to climate change in the Yarkant River Basin. China. J. Hydrol. Reg. Stud. 2021, 36, 100847. [Google Scholar]
- Zhang, J.; Zhou, J.; Chen, Y.; Wei, X.; Zeng, Y.; Sun, Y. Identifying the factors controlling surface water and groundwater chemical characteristics and irrigation suitability in the Yarkant River Basin, northwest China. Environ. Res. 2023, 223, 115452. [Google Scholar] [CrossRef] [PubMed]
- Yi, Y.; Zhu, Y.; Liu, S.-Y.; Saifullah, M.; Wu, K.-P.; Liu, Q.; Wei, J.-Y. Weakening trends of glacier and snowmelt-induced floods in the Upper Yarkant River Basin. Karakoram during 1961–2022. Adv. Clim. Change Res. 2025, 16, 512–525. [Google Scholar] [CrossRef]
- Chen Yaning Xu, C.; Chen Yapeng Li, W.; Liu, J. Response of glacial-lake outburst floods to climate change in the Yarkant River basin on northern slope of Karakoram Mountains. China. Quat. Int. 2010, 226, 75–81. [Google Scholar] [CrossRef]
- Jiajia, P.; Liping, X.; Cui, C. Spatio-temporal evolution of glacier landscape pattern in the Yarkant River Basin from 1991 to 2017. Acta Ecol. Sin. 2022, 42, 8265–8275. [Google Scholar] [CrossRef]
- Gao, Z.; Xu, Q.; Wang, S.; Ren, Q.; Li, Y. Evaluating Carbon Sink Responses to Multi-Scenario Land Use Changes in the Dianchi Lake Basin: An Integrated PLUS-InVEST Model Approach. Agriculture 2025, 15, 1286. [Google Scholar] [CrossRef]
- Nie, H.; Zhao, Y.; Zhu, J.; Ning, A.; Zheng, W. Ecological Security Pattern Construction in Typical Oasis Area Based on Ant Colony Optimization: A Case Study in Yili River Valley, China. Ecol. Indic. 2024, 169, 112770. [Google Scholar] [CrossRef]
- Wenbo, X.; Hengzhou, X.; Xiaoyan, L.; Hua, Q.; Ziyao, W. Ecosystem services response to future land use/cover change (LUCC) under multiple scenarios: A case study of the beijing-tianjin-hebei (BTH) region, China. Technol. Forecast. Soc. Change 2024, 205, 123525. [Google Scholar] [CrossRef]
- Zhang, Z.; Li, X.; Du, S.; Liu, C.; Shi, Z.; Yan, C. Spatial-temporal evolution analysis of multi-scenario land use and ecosystem services base on PLUS-invest model: A case study in beijing-tianjin-hebei region, China. Sustain. Futures 2025, 10, 101154. [Google Scholar] [CrossRef]
- Mutale, B.; Qiang, F. Modeling future land use and land cover under different scenarios using patch-generating land use simulation model. A case study of Ndola District. Front. Environ. Sci. 2024, 12, 1362666. [Google Scholar] [CrossRef]
- Hong, W.; Guo, R.; Su, M.; Tang, H.; Chen, L.; Hu, W. Sensitivity evaluation and land-use control of urban ecological corridors: A case study of shenzhen. China. Land Use Policy 2017, 62, 316–325. [Google Scholar] [CrossRef]
- Li, Y.; Liu, W.; Feng, Q.; Zhu, M.; Yang, L.; Zhang, J.; Yin, X. The role of land use change in affecting ecosystem services and the ecological security pattern of the Hexi regions, northwest China. Sci. Total Environ. 2023, 855, 158940. [Google Scholar] [CrossRef]
- Zhang, J.; Cao, P.; Roosli, R. Assessing land use and carbon storage changes using PLUS and InVEST models: A multi-scenario simulation in Hohhot. Environ. Sustain. Indic. 2025, 26, 100655. [Google Scholar] [CrossRef]
- Xu, Y.; Liu, X.; Zhao, L.; Li, H.; Zhu, P.; Liu, R.; Wang, C.; Wang, B. Spatial and temporal analysis of habitat quality in the Yellow River Basin based on land-use transition and its driving forces. Land 2025, 14, 759. [Google Scholar] [CrossRef]
- Tian, C.; Zhong, J.; You, Q.; Fang, C.; Hu, Q.; Liang, J.; He, J.; Yang, W. Land use modeling and habitat quality assessment under climate scenarios: A case study of the Poyang lake basin. Ecol. Indic. 2025, 172, 113292. [Google Scholar] [CrossRef]
- Fossile, E.; Sabbatini, A.; Spagnoli, F.; Caridi, F.; Dell’ANno, A.; De Marco, R.; Dinelli, E.; Droghini, E.; Tramontana, M.; Negri, A. Sensitivity of foraminiferal-based indices to evaluate the ecological quality status of marine coastal benthic systems: A case study of the Gulf of Manfredonia (southern Adriatic Sea). Mar. Pollut. Bull. 2021, 163, 111933. [Google Scholar] [CrossRef]
- Hou, M.; Cuo, L.; Xu, H. Hydrological response to twenty-first century climate change in the Amu Darya Basin, Central Asia. J. Hydrol. Reg. Stud. 2025, 61, 102606. [Google Scholar] [CrossRef]
- Zhao, J.; Shao, Z.; Xia, C.; Fang, K.; Chen, R.; Zhou, J. Ecosystem services assessment based on land use simulation: A case study in the Heihe River Basin, China. Ecol. Indic. 2022, 143, 109402. [Google Scholar] [CrossRef]
- Song, J.; Aishan, T.; Ma, X. Coupled Water-Habitat-Carbon Nexus and Driving Mechanisms in the Tarim River Basin: A Multi-Scenario Simulation Perspective. Ecol. Indic. 2024, 167, 112649. [Google Scholar] [CrossRef]
- Ji, X.; Sun, Y.; Guo, W.; Zhao, C.; Li, K. Land use and habitat quality change in the yellow river basin: A perspective with different CMIP6-based scenarios and multiple scales. J. Environ. Manag. 2023, 345, 118729. [Google Scholar] [CrossRef]
- He, S.; Qian, H.; Liu, Y.; Zhao, X.; Su, F.; Ma, H.; Guan, Z.; Zhang, T. Water, conservation assessment and its influencing factors identification using the InVEST and random forest model in the northern piedmont of the Qinling Mountains. J. Hydrol. Reg. Stud. 2025, 57, 102194. [Google Scholar] [CrossRef]
- Roman, O.; Adey, B.T.; Black, B.; Zeindl, E. Where Will the Change Come from? Identifying Decision-Relevant Factors in Future Land Use and Cover Change (LUCC) Scenarios to Support Planning under Uncertainty. Futures 2026, 176, 103751. [Google Scholar] [CrossRef]
- Huang, Y.; Zhang, J.; Zhang, P.; Chen, Z.; Zhang, X.; Lu, R.; Li, M.; Xing, G.; Song, Y. Construction and optimization of ecological security pattern based on landscape ecological risk assessment in the affected area of the lower yellow river. Front. Ecol. Evol. 2023, 11, 1271352. [Google Scholar] [CrossRef]
- Lee, J.-W.; Lee, S.-W.; Park, S.-R. Assessing the effect of environmental factors and land use changes on benthic macroinvertebrate communities in stream ecosystems. Ecol. Inform. 2025, 91, 103404. [Google Scholar] [CrossRef]
- Chen, M.; Samat, N.; Maghsoodi Tilaki, M.J.; Duan, L. Land Use/Cover Change Simulation Research: A System Literature Review Based on Bibliometric Analyses. Ecol. Indic. 2025, 170, 112991. [Google Scholar] [CrossRef]
- Feng, X.; Zhao, X.; Tong, L.; Wang, S.; Ding, R.; Kang, S. Impacts of land use and cover change on carbon storage: Multi-scenario projections in the arid region of Northwest China. Reg. Sustain. 2025, 6, 100248. [Google Scholar] [CrossRef]
- Li, H.; Zhang, K.; Liu, Y.; Qin, Y.; Wang, W.; Wang, M.; Liu, Y.; Li, Y. Spatiotemporal evolution of land use and carbon storage in China: Multi-scenario simulation and driving factor analysis based on the PLUS-InVEST model and SHAP. Environ. Res. 2025, 279, 121860. [Google Scholar] [CrossRef]
- Li, W.; Kang, J.; Wang, Y. Identifying the contribution and spatial effects of land use conversion on ecosystem health in chongqing: A multi-scenario simulation perspective. Ecol. Indic. 2024, 165, 112232. [Google Scholar] [CrossRef]
- Umwali, E.D.; Chen, X.; Ma, X.; Guo, Z.; Mbigi, D.; Zhang, Z.; Umugwaneza, A.; Gasirabo, A.; Umuhoza, J. Integrated SSP-RCP scenarios for modeling the impacts of climate change and land use on ecosystem services in east Africa. Ecol. Model. 2025, 504, 111092. [Google Scholar] [CrossRef]
- Broquet, M.; Campos, F.S.; Cabral, P.; David, J. Habitat quality on the edge of anthropogenic pressures: Predicting the impact of land use changes in the Brazilian upper Paraguay river basin. J. Clean. Prod. 2024, 459, 142546. [Google Scholar] [CrossRef]
Disclaimer/Publisher’s Note: The statements, opinions and data contained in all publications are solely those of the individual author(s) and contributor(s) and not of MDPI and/or the editor(s). MDPI and/or the editor(s) disclaim responsibility for any injury to people or property resulting from any ideas, methods, instructions or products referred to in the content. |
© 2026 by the authors. Licensee MDPI, Basel, Switzerland. This article is an open access article distributed under the terms and conditions of the Creative Commons Attribution (CC BY) license.