Abstract
Ensuring the safe, efficient, and economically viable operation of irrigation and drainage infrastructures is essential for long-term system resilience. This field-based study presents a comparative evaluation of the semi-quantitative William T. Fine (WF) method and a simplified probability–consequence (SM) approach applied in the Lis Valley Irrigation and Drainage Association (Leiria, Portugal). Monthly on-site observations of routine maintenance and conservation activities were conducted between January 2023 and December 2024, covering eight main operation types and resulting in 87 distinct occupational risk scenarios (N = 87). The mean Hazard Risk Score (HRS) was 88.9 ± 51.1, corresponding predominantly to “Substantial” risk levels according to the William T. Fine classification (HRS = 70–200). Both methods consistently identified the highest-risk activities—tractor rollover, work at height, and boat-based removal of aquatic plants. Quantitative differences emerged for medium and chronic hazards; WF produced a wider dispersion of risk scores across tasks, while the SM aggregated most hazards into a limited number of intervention classes (74% classified as Intervention Level II and 26% as Level III). These differences reflect complementary methodological limitations; WF requires greater data input and expert judgment but offers finer prioritization, whereas SM enables rapid field application but tends to group ergonomic and low-intensity hazards when consequences are not immediately observable. Based on these findings, a combined assessment framework is proposed, integrating the discriminative capacity of WF with the operational simplicity of SM. Recommended mitigation measures include targeted personal protective equipment, task rotation, focused training, and technology-assisted monitoring to reduce worker exposure. The methodology is readily replicable for Water Users’ Associations with similar operational contexts and supports evidence-based decision-making for sustainable irrigation management. From a sustainability perspective, this integrated risk assessment framework supports safer working conditions, more efficient maintenance planning, and informed policy decisions for the long-term management of irrigation and drainage infrastructures.
1. Introduction
The anticipation, identification, evaluation, and control of occupational risks are fundamental for worker safety and operational efficiency [1,2]. In irrigation and drainage systems, these principles are reinforced by international and national regulations, notably ILO Convention No. 155 on Occupational Safety and Health [3], European Directive 89/391/EEC [4], and the United Nations 2030 Agenda (SDG 8) [5]. In Portugal, Law No. 102/2009, as amended by Law No. 3/2014, mandates systematic occupational risk assessment and classifies non-compliance as a serious infraction [6]. However, despite this regulatory framework, the application and comparative evaluation of occupational risk assessment methods in irrigation and drainage maintenance remain limited.
Safe working conditions in irrigation and drainage are both a legal obligation and a cornerstone of sustainable water governance [7]. Occupational risk management protects workers, reduces environmental impacts such as agrochemical spills and habitat disruption [8,9], and increases the long-term resilience of rural communities [10,11,12]. Risk assessment comprises systematic techniques to identify, estimate, and manage hazards, forming the basis for preventive and corrective measures to reduce accidents and occupational disease [13,14,15,16,17,18].
Maintenance operations in irrigation and drainage present unique challenges because they are multidisciplinary and outdoors [19,20,21,22]. Natural elements (vegetation, uneven terrain), weather (wind, rain, heat), and work near water bodies complicate safety management [23,24]. These activities commonly involve mechanical equipment, agrochemicals, and manual labor—factors associated with elevated accident rates and hazardous exposures [25,26,27]. Tasks such as structure repair, cleaning, or painting share risk features with construction and industrial operations, including falls, entrapment, and electrical shock [28,29,30]. Even low-intensity hazards (poor posture, repetitive strain) may accumulate and cause long-term health impairments [31,32]. National collective agreements and technical prevention standards further frame obligations for Water Users’ Associations (WUAs) in Portugal [33].
Despite this regulatory and technical framework, systematic risk assessment in irrigation and drainage maintenance remains underapplied, and comparative evaluations of risk-assessment methods in this sector are scarce. While comparative studies of occupational risk assessment methods exist in construction, industrial maintenance, and agricultural operations, they are typically based on short-term inspections, single-method applications, or contexts not managed by Water Users’ Associations. In contrast, this study presents a field-based comparative evaluation of two complementary approaches—the semi-quantitative William T. Fine (WF) method [34] and the simplified probability–consequence (SM) method [35,36]—based on repeated observations over a two-year period within a public irrigation and drainage system managed by a Water Users’ Association (LVID, Leiria, Portugal), explicitly integrating method comparison with operational decision-making and sustainability-oriented indicators.
This study makes three principal contributions that extend beyond previous applications of occupational risk assessment in agricultural and irrigation contexts, which are often framed by regulatory compliance and incident statistics rather than comparative methodological evaluation [37,38,39]: (i) a long-term, field-based comparative application of WF and SM in irrigation and drainage maintenance operations managed by a Water Users’ Association (Section 3.2 and Section 3.3); (ii) a practical hybrid WF–SM framework that explicitly links risk discrimination with operational decision-making constraints (Section 4.1); and (iii) actionable mitigation recommendations connected to sustainability indicators to support resource allocation and policy alignment (Section 4.2).
Specifically, the study aims to (i) identify and characterize potential hazards in routine maintenance and conservation tasks, (ii) assess occupational risks using both the WF method and the SM, and compare their discriminative capacity based on predefined analytical criteria, and (iii) propose preventive and corrective measures to enhance worker safety and operational efficiency. The working hypothesis is that the WF method yields a more detailed and discriminative assessment of occupational hazards than SM, thereby supporting more precise and cost-effective interventions [40]. In this study, discriminative capacity is defined as the ability of a risk assessment method to differentiate risk levels across hazard types, generate a broader dispersion of risk scores, and avoid excessive aggregation of risks into a limited number of priority or intervention classes.
2. Materials and Methods
2.1. Site Description and Maintenance Practices
The LVID is a public irrigation system located on the Central Coast of Portugal (administrative headquarters: 39°51′22.1″ N, 8°50′56.1″ W), covering the municipalities of Leiria and Marinha Grande (Figure 1). The system spans approximately 2000 ha, characterized by modern alluvial soils of high agricultural quality, although some areas present drainage challenges. The region has a Mediterranean climate (Csb and Csa in the Köppen classification), with annual precipitation ranging from 800 to 900 mm, concentrated mainly between October and March, and an average annual temperature of 15.9 °C [41].
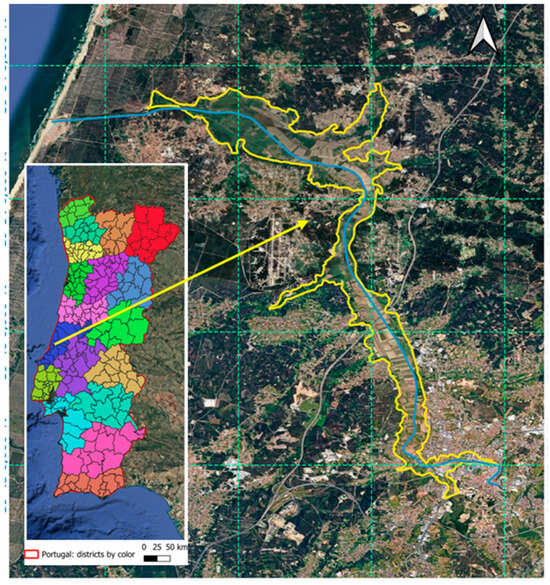
Figure 1.
Geographic location of the LVID. The yellow line indicates the LVID boundary, and the blue line traces the Lis River. Inset: Map of continental Portugal showing municipalities by district (different colors represent different districts). Source: Google Earth (https://earth.google.com, accessed on 3 September 2025).
Originally constructed in 1957, the LVID hydraulic system has undergone partial rehabilitation, including the installation of new weirs. Water losses due to canal degradation, sediment accumulation, and riparian vegetation growth persist. These issues reduce conveyance capacity and obstruct gates and hydrants. The lack of automated water-level regulation also increases labor demands and decreases overall irrigation efficiency [42].
The system is managed by a Water Users’ Association (WUA), responsible for operating and maintaining hydraulic infrastructure, including pumping stations, open canal networks, perimeter drainage structures, and field drainage systems. Drainage ditches also contribute to irrigation via pumping stations, and the system is organized into supply sectors identified by main canals (C1, C2, etc.), coordinated with local farmers to optimize water allocation [43].
During the study period, routine maintenance and conservation activities were carried out by a small, stable workforce of four WUA employees. Depending on task complexity and safety requirements, operations were typically performed by teams of two to four workers. WUA personnel—including bricklayers, assistants, and general maintenance workers—perform routine maintenance tasks such as canal and ditch cleaning, dredging, repair of hydraulic structures (weirs, gates, gutters), pipeline cleaning, vegetation management along canals (manually and with tractors), and control of invasive aquatic plants such as water hyacinth (Eichhornia crassipes) and parrot’s feather (Myriophyllum aquaticum) [44] (Table 1).

Table 1.
Calendar of tasks performed in irrigation and drainage infrastructures; ‘x’ denotes months in which the operation was regularly observed or performed according to WUA logs and field observations.
Field observations were conducted monthly from January 2023 to December 2024 without interfering with operations. From these observations, 87 distinct risk categories (N = 87) were identified, encompassing mechanical, ergonomic, physical, electrical, and chemical/biological hazards; these categories were systematically classified and scored to support risk prioritization. Across the two-year observation period, each operation type was observed repeatedly, with observation frequency varying according to operational recurrence and seasonality. Assembly and disassembly of weirs were typically observed approximately ten times per year, while canal and ditch cleaning operations—among the most recurrent tasks—were observed more frequently, with around twenty observation sessions per year. Other maintenance activities were observed opportunistically whenever performed in the normal operational schedule. The aim was not to quantify task frequency statistically, but to capture stable and recurrent hazard patterns under real operating conditions.
In this study, the unit of analysis was the risk category, defined as a unique combination of task, hazard type, and operational context. Accordingly, N = 87 represents distinct occupational risk scenarios identified across routine maintenance and conservation activities, rather than individual workers or repeated time-based measurements. Hazards were recorded at each observation session; however, the analytical dataset was constructed as a cumulative risk register. For each task–hazard combination, a single representative score was assigned based on recurring conditions observed across multiple visits and seasons, rather than on isolated events.
Both WF and SM assessments relied on expert judgment for score attribution. The two evaluators involved in this study had complementary and relevant expertise; one evaluator (S.F.) is a senior occupational safety and health (OSH) technician with formal training in hazard identification and risk assessment, while the second evaluator (R.E.) is a co-author and operational manager of the Lis Valley Water Users’ Association, with over 15 years of experience supervising maintenance activities and field operations. Before fieldwork, evaluators harmonized scoring criteria through joint review of the assessment tables, valuation scales, and structured checklists.
During data collection, hazards were identified through repeated field observations and initially assessed independently by each evaluator using standardized checklists. Assigned scores were subsequently compared and discussed, and final values reflect consensus ratings that synthesize recurring conditions observed across multiple visits and seasons, rather than single-event assessments. Disagreements were infrequent and resolved through discussion grounded in technical criteria and operational experience. Although formal inter-rater reliability statistics (e.g., kappa coefficients) were not calculated, the consistency of consensus scores across tasks and seasons supports the qualitative reliability of the assessment. Photographs further illustrate key maintenance activities (Figure 2).
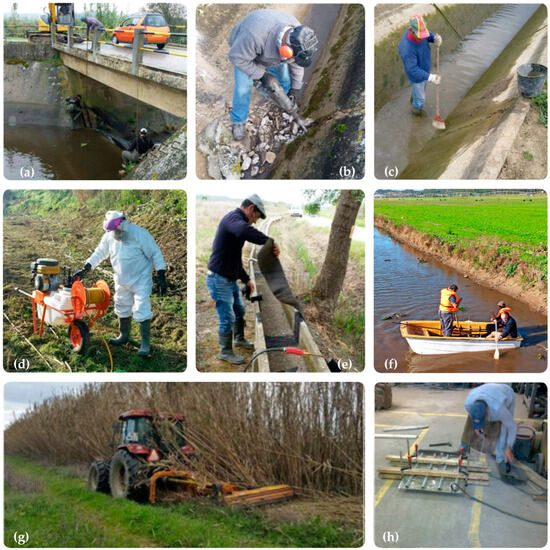
Figure 2.
Photographic documentation of key maintenance activities by LVID WUA workers (S.F; R.E.): (a) assembly/disassembly of demountable weirs; (b) repair of irrigation canals; (c) pipeline cleaning; (d) manual herbicide application; (e) repair of gutters at height; (f) control of invasive aquatic plants; (g) vegetation cutting with tractor; (h) gate repairs.
Maintenance operations were typically performed by small work teams, depending on task requirements; however, the focus of the assessment was on task-level hazards rather than individual worker performance, in line with the study’s objective of organizational risk prioritization. The sampling strategy was purposive, covering all key operational areas of the irrigation system to ensure representativeness across different types of hazards and environmental conditions. Although formal ethical approval was not required, written informed consent was obtained from all workers for participation and for the use of photographic documentation, in accordance with good ethical practice. Photographs were used solely for illustrative purposes.
To ensure methodological transparency, all data collection followed a structured observation checklist adapted from national occupational safety guidelines [6,12]. This structured approach aligns the field data directly with the study’s objectives of identifying, quantifying, and prioritizing occupational risks, while supporting environmental protection and sustainable operational management.
2.2. Occupational Risk Assessment by William Fine (Semi-Quantitative) Method
The William T. Fine (WF) method, first introduced in 1971 [34] and later adapted by various authors—including Portuguese translations with modifications [45] and adoption in NTP 101 [31]—is a semi-quantitative approach widely used to assess occupational hazards. This method evaluates the severity and probability of each risk arising from identified hazards, considering preventive measures and their associated costs, time, and effort. In this study, we followed the approach proposed by Cabral et al. [46], while formulas, explanations, and respective valuations were adopted from Santos et al. and Moloudpourfard & Pouyajian [47,48].
In WF, the Hazard Risk Score (HRS) is calculated as the product of the consequence (C), exposure (E), and probability (P) of the risk:
- Consequence (C): The potential damage resulting from the materialization of a risk (Table A1).
- Exposure (E): The frequency with which a hazardous situation occurs (Table A2).
- Probability (P): The likelihood that, once exposed to a hazard, the sequence of events will lead to the consequence (Table A3).
All WF parameters (C, E, P, DC, and CF) were independently assigned by the same two evaluators described in Section 2.1, both with formal training and extensive field experience in occupational safety and irrigation system management. Scoring was harmonized through prior joint review of valuation tables, followed by independent attribution and consensus discussion.
A classification of HRS values is provided in Table A4, which may be adjusted according to factor valuations, economic criteria, and the number of action types implemented for risk mitigation.
When a risk is identified, corrective measures should be planned and evaluated. Estimated costs are compared to the HRS using the cost factor (CF) and degree of correction (DC). The Justification Index (J) is calculated as
- Cost factor (CF): Estimated value of the corrective action. CF values were assigned using standardized categories from Table A5, reflecting order-of-magnitude estimates commonly applied in occupational risk assessment, rather than detailed accounting-based cost calculations specific to individual interventions.
- Degree of correction (DC): Effectiveness of the proposed measure in eliminating, reducing, or preventing the risk (Table A6). Intermediate values are obtained through interpolation.
A threshold of J = 10 is set as the critical value [49]; if J ≥ 10, the cost of corrective action is justified, while J < 10 indicates it is not.
This method was selected because it enables a semi-quantitative yet cost-sensitive prioritization of risks, directly supporting the development of practical and defensible decision-support tools for Water Users’ Associations (WUAs). By combining frequency, severity, and cost-efficiency, the WF method allows precise identification of critical hazards and optimal allocation of preventive resources.
2.3. Occupational Risk Assessment by Simplified (Quantitative) Method
The SM was developed by INSHT—Instituto Nacional de Seguridad e Higiene en el Trabajo, based on the work of Kinney & Wiruth [40], and is explained in NTP 330 [35]. This quantitative approach evaluates the magnitude of risks associated with identified hazards and establishes a hierarchy for implementing preventive and corrective actions. For each hazard, the probability of occurrence and expected severity are assessed separately. In this study, the procedure proposed by Cabral et al. [46] was followed, while formulas and tables were adopted from Santos et al. [47] and Canivell [50].
The materialization of a risk may result in different consequences (Ci), each with an associated probability (Pi):
This method uses categorical levels rather than absolute values: risk level (RL), probability level (PL), and consequences level (CL). The risk level is calculated as
To obtain PL, the deficiency level (DL) is first calculated, reflecting the severity of risk factors and their causal relationship with potential consequences (Table A7). The Exposure Level (EL) is also determined, representing the frequency of exposure to the hazard, based on time spent in a hazardous environment, such as specific work areas or during machinery operation (Table A8).
Once numerically assessed, the PL is computed as
PL and EL are subsequently combined according to Table A9. The CL is classified into four levels based on both personal injury and material damage (Table A10), with personal injury weighted higher due to its greater impact. This weighting reflects established occupational safety principles prioritizing irreversible human harm over material losses in risk classification frameworks. If only material damage occurs, the same consequence levels apply. Emphasizing CL over PL highlights the more critical effects of consequences in risk assessment. DL, El, and CL were attributed by the same two evaluators described in Section 2.1, using standardized INSHT tables and consensus-based scoring following independent initial assessments.
Table A11 determines RL according to Equation (4), and the obtained values are grouped into four priority levels (I, II, III, IV). Table A12 then maps RL to Intervention Level (IL), categorizing risks based on urgency. This framework allows calculation of IL for each occupational risk individually, supporting targeted and timely interventions.
The SM was chosen for its operational simplicity, wide acceptance, and rapid applicability among Portuguese safety practitioners. When combined with the WF method, it enables efficient identification of acute hazards while complementing the more discriminative, semi-quantitative analysis of WF.
As highlighted by Gul and Ak [51] and Marhavilas et al. [52], structured comparisons between occupational risk assessment methods enhance methodological transparency and support the selection of context-appropriate tools. Table 2 presents a comparative synthesis of WF and SMs, outlining their respective components, analytical depth, and operational applicability. This comparative framework reinforces the rationale for adopting a hybrid WF–SM approach, combining the strategic precision of WF with the operational agility of SM. Such integration facilitates both long-term planning and immediate hazard mitigation, aligning with sustainability-driven engineering practices and evidence-based decision-making. For example, a canal-cleaning task with DL = 6, EL = 3, and CL = 10 results in PL = 18, RL = 180, and an Intervention Level II, illustrating the practical application of the SM framework.
Table 2.
Comparative overview of the WF and SM occupational risk assessment methods.
2.4. Risk Management
Risk management is the integrated process of risk assessment and control, encompassing the systematic application of policies, procedures, and best practices to analyze, evaluate, and mitigate occupational hazards. Ni et al. [53] emphasize that risk assessment constitutes the cornerstone of risk management, as effective control relies on accurate identification and quantification of hazards. Burriel Lluna, as cited by Roxo [54], notes that unacceptable risks must be mitigated through corrective measures, which should be periodically reviewed and adapted based on updated information.
To enhance methodological triangulation and comparability, both WF and SMs were applied to the same set of field observations. This dual application allowed cross-validation and highlighted differences in sensitivity to chronic versus immediate hazards, thereby isolating methodological variability from contextual factors.
Based on the results, preventive and corrective measures were proposed for LVID WUA, aiming to reduce or eliminate occupational hazards. These included task rotations, use of personal protective equipment, targeted training, and monitoring of high-risk activities.
2.5. Risk Assessment and Statistical Analysis
Descriptive statistics (mean, standard deviation, minimum, maximum) were computed for all primary variables of WF and SM (Appendix A and Appendix B). Full PCA outputs are reported in Appendix C (WF) and Appendix D (SM). Although WF and SM variables are derived from ordinal rating scales, they were treated as quasi-continuous for multivariate and comparative analyses, a practice commonly adopted in occupational risk assessment when ordered scales are bounded and consistently applied. Specifically, PCA was applied to explore whether hazard attributes cluster along underlying dimensions related to consequence severity versus exposure and probability, providing added insight beyond univariate descriptive statistics. Derived indicators (e.g., PL, RL for SM; J for WF) were excluded from PCA and ANOVA to avoid redundancy. These analyses directly address the research question regarding the discriminative capacity of the WF and SMs by testing whether risk scores differ significantly across hazard types and cluster along interpretable dimensions of consequence, exposure, and correction priority.
Sampling adequacy and inter-variable correlations were assessed using the Kaiser–Meyer–Olkin (KMO) measure and Bartlett’s test of sphericity, with Individual Measures of Sampling Adequacy (MSA) checked to ensure factorability. Variables were standardized (z-scores) prior to analysis. Standardization ensured comparability among variables expressed on different ordinal scales and prevented disproportionate influence of higher-range scores in multivariate analyses. Principal Component Analysis (PCA) with Promax oblique rotation identified latent structures, retaining components with eigenvalues > 1. Loadings exceeding unity resulted from the use of oblique (Promax) rotation and correlated components; these values reflect the structure matrix rather than estimation errors. For clarity of presentation, loadings were rounded and capped at ±1.00 in the tables. WF data yielded two interpretable components, while SM data produced a single dominant component.
Differences among hazard types were tested using ANOVA, with Levene’s test assessing homoscedasticity. In ANOVA, sample size corresponds to the number of distinct risk categories (N = 87) within each hazard type, rather than to repeated measurements or individual workers. When heteroscedasticity occurred, Games–Howell post hoc tests were applied. Non-parametric Kruskal–Wallis tests with Dunn’s multiple comparisons validated results for non-normal variables.
All analyses were conducted at a 95% confidence level using JASP 0.19.1 (University of Amsterdam, The Netherlands), allowing robust comparison of WF and SM outcomes and identification of key occupational risk patterns. Combining parametric and non-parametric tests ensured reliability across data distributions. PCA reduced dimensionality and clarified inter-variable relationships. Cross-checking outputs reinforced convergent validity, providing a coherent and transparent comparative framework for applied occupational risk assessment. Data consistency was verified through independent review, ensuring full traceability.
These analyses support the comparative evaluation of the discriminative capacity of WF and SM by examining score dispersion, differentiation among hazard types, and the structure of risk and intervention classes generated by each method. Supporting methodological tables and full multivariate outputs are provided in Appendix A, Appendix B, Appendix C and Appendix D, while complete task-level risk scoring tables for WF and SM are reported in Appendix E and Appendix F.
3. Results
3.1. Observation of Dangerous Conditions (Hazard), Occupational Risks, and Consequences by Type of Operation
Maintenance and water management operations conducted by WUA workers in the LVID under routine field conditions were systematically evaluated for occupational risks. Table 3 summarizes the key hazards across operations. Mechanical hazards are particularly prominent in pipeline cleaning (Figure 2c) and tractor-based vegetation cutting (Figure 2g), due to the simultaneous occurrence of cuts, amputations, and falling objects. Ergonomic hazards are widespread, primarily linked to awkward postures and over-exertion during manual handling or lifting tasks.
Table 3.
Summary of occupational hazards identified for key irrigation and maintenance operations. Each cell indicates the presence of risks associated with the hazard type: mechanical, ergonomic, physical, electrical, and chemical/biological. Risks are expressed as concise descriptors (e.g., “cuts/falling objects” for Mechanical).
Physical risks, including exposure to vibrations, noise, extreme temperatures, and other environmental stressors, are especially notable during the assembly and disassembly of weirs (Figure 2a) and aquatic plant removal (Figure 2f). Electrical hazards, while less frequent, are associated with the operation of powered equipment or contact with energized lines. Chemical and biological hazards encompass exposure to herbicides, fuels, oils, solvents, paints, polluted water and insect bites, posing potential risks of infections, burns or skin irritation, particularly during manual herbicide application (Figure 2d) and aquatic plant removal (Figure 2f).
Operations such as repair of irrigation canals (Figure 2b), gutters at height (Figure 2e), and gates (Figure 2h) present a combination of mechanical, ergonomic, and physical hazards. These can result in a spectrum of injuries, from minor cuts and strains to severe accidents. Overall, mechanical and ergonomic hazards dominate, underscoring the necessity of implementing rigorous safety protocols and preventive measures across all operations. These findings pinpoint high-priority risk areas for targeted intervention and continuous monitoring.
Figure 3 illustrates the quantification of occupational hazards across the assessed operations. Mechanical risks are highest in pipeline cleaning and tractor-based vegetation cutting (4 hazards each), followed by assembly/disassembly of weirs, gutter repair, and gate repair (3 hazards each). Ergonomic risks are consistently present (2 hazards per operation), highlighting the prevalence of poor posture and over-exertion across activities. Physical risks are particularly notable in assembly/disassembly of weirs (4 hazards), reflecting the combination of slips, falls, cold exposure and noise. Electrical hazards, although limited, appear in mechanized or elevated operations, emphasizing the importance of safe equipment handling. Chemical risks peak during manual herbicide application (4 hazards), while biological risks are most prominent in aquatic plant removal (2 hazards), due to exposure to polluted water and insects.
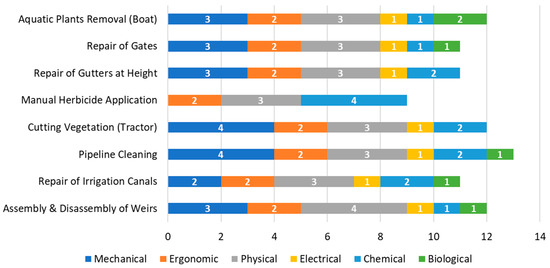
Figure 3.
Quantification of occupational hazards per operation. Bars indicate the number of hazards identified in each category (Mechanical, Ergonomic, Physical, Electrical, Chemical, Biological).
Across all operations, mechanical hazards consistently rank highest, followed by ergonomic risks, indicating that physical handling tasks pose the greatest threat. In contrast, electrical and chemical/biological hazards are more operation-specific, peaking in mechanized or specialized tasks. These trends provide practical guidance for prioritizing safety interventions across different types of maintenance and water management activities. Continuous monitoring and periodic reassessment of occupational hazards are recommended to ensure the timely implementation of safety interventions and to maintain protection for all field personnel.
3.2. Evaluation of Hazard, Risk Analysis, and Consequences by William Fine Method
Maintenance and water management tasks performed by WUA workers in the LVID were assessed using the William Fine occupational risk method. Across the 87 identified risk categories, no task exceeded the operational interruption threshold (HRS > 400). However, several activities reached high (HRS = 300) or substantial risk levels, requiring prioritized corrective measures rather than immediate cessation.
Mechanical hazards consistently generated the highest risk scores, particularly in tasks involving heavy equipment, work at height, and boat-based operations. Ergonomic and chemical/biological hazards were also frequent but typically associated with intermediate risk levels. Detailed task-by-task hazard scoring, including consequences, exposure, probability, and economic justification, is provided in Appendix E (Table A15).
Descriptive statistics for the occupational risk variables across 87 tasks are summarized in Table 4. Mean values indicate moderate to high risk levels, with consequences (C) and cost factor (CF) contributing most to overall risk. Exposure (E) and probability (P) showed lower variability, while the degree of correction (DC) was relatively stable. Sampling adequacy was marginal (KMO = 0.696); to mitigate this limitation, we triangulated PCA results with non-parametric tests and inspection of raw distributions. Bartlett’s test confirmed sufficient inter-variable correlations (χ2 = 295.14, p < 0.001), allowing PCA.
Table 4.
Descriptive statistics (mean ± SD, minimum, maximum) and PCA loadings (PC1–PC2) for main maintenance and water management tasks (N = 87).
PCA with Promax rotation extracted two main components explaining 85.8% of the total variance. Full PCA outputs, including eigenvalues, explained variance, and rotated loadings, are reported in Appendix C (Table A13). PC1 (50.4%) is primarily associated with consequence (C), cost factor (CF), and exposure (E), with the negative loading of exposure indicating an inverse contribution within this component. PC2 (35.5%) is dominated by the degree of correction (DC) and probability (P). For interpretative purposes, these components are discussed as ‘risk–exposure’ and ‘correction–probability’ dimensions, respectively, in the Discussion section.
Table 5 presents PC1 and PC2 scores by hazard type, with ANOVA and Kruskal–Wallis post hoc results confirming significant differences. For PC1, the effect of hazard type was large (η2p = 0.237), while for PC2, the effect was very large (η2p = 0.495), indicating that hazard type explains a substantial proportion of variance in both principal components.
Table 5.
PC1 and PC2 scores (mean ± SD) by hazard type, post hoc results.
Across all tasks, mechanical hazards consistently exhibit the highest PC1 scores, reflecting combined high consequence and exposure, while ergonomic and chemical/biological hazards show higher PC2 scores, indicating a greater need for corrective measures. Physical and electrical hazards present intermediate values. These patterns highlight that tasks involving heavy equipment or moving parts are most critical for immediate risk mitigation, whereas ergonomic and chemical exposures require systematic intervention and procedural controls.
Overall, the William Fine analysis provides a quantitative foundation for prioritizing occupational safety interventions, guiding allocation of resources towards tasks with the highest potential impact, and supporting data-driven decision-making for WUA managers.
3.3. Evaluation of Hazard, Risk Analysis, and Consequences by the Simplified Method
Detailed Simplified Method hazard-level scoring is provided in Appendix F (Table A16), including DL, EL, PL, CL, RL, and IL values with brief justifications for each risk. Several activities, including tractor operation, work at height, and boat-based removal of aquatic plants, reached critical risk levels (IL = I), emphasizing the need for targeted interventions and safety precautions. Overall, 74% of identified risks were classified as Level II, requiring corrective measures, while 26% were Level III, suggesting improvements where feasible. Mechanical hazards consistently dominated the risk profiles, confirming the consistency of the William Fine prioritization and highlighting areas for immediate action.
Table 6 presents KMO and Bartlett’s tests, confirming the adequacy of the dataset for multivariate analysis (overall MSA = 0.69; individual MSA values: DL = 0.765, EL = 0.697, CL = 0.638) and sufficient inter-variable correlations for PCA (χ2 = 108.83, df = 3, p < 0.001). PCA with Promax oblique rotation identified a single interpretable component (PC1, eigenvalue = 2.27), explaining 75.8% of the total variance. The complete PCA output supporting this structure is reported in Appendix D (Table A14). PC1 is primarily associated with danger and consequence levels, with a negative contribution of exposure; for interpretative clarity, this component is discussed as an ‘exposure–severity’ dimension in the Discussion section. Derived indicators PL and RL were excluded from PCA.
Table 6.
Descriptive statistics (mean ± SD, minimum, maximum) of simplified occupational-risk-assessment variables and loadings on the first principal component (PC1, Promax rotation) for main maintenance and water-management tasks (N = 87).
Table 7 presents PC1 scores by hazard type, representing the “exposure–severity” dimension. ANOVA revealed significant differences among hazard types (F(5,81) = 8.952, p < 0.001), with a large effect size (η2p = 0.356), indicating a strong influence of hazard type on the ‘exposure–severity’ dimension derived from the Simplified Method. Kruskal–Wallis analysis confirmed these differences (χ2(5) = 24.78, p < 0.001). Post hoc analyses (Games–Howell and Dunn tests) indicated that Mechanical hazards had significantly higher PC1 scores than Chemical/Biological, Ergonomic, and Physical hazards. Other hazard types did not differ significantly, reflecting lower combined danger and consequence levels.
Table 7.
PC1 scores (mean ± SD) by hazard type, with ANOVA and Kruskal–Wallis post hoc results. Significant differences (p < 0.05) are indicated by different letters.
Overall, the comparative application of the WF and SM revealed marked differences in their discriminative capacity. The WF method generated a wider dispersion of risk scores across tasks and hazard types, producing multiple intermediate priority levels rather than concentrating risks into a limited number of categories. In contrast, the SM tended to aggregate most hazards into Intervention Level II, with fewer distinctions among medium and chronic risks. Furthermore, hazard-type analyses and PCA results demonstrated that WF more effectively differentiated mechanical, ergonomic, and chemical/biological hazards along distinct analytical dimensions, whereas SM primarily emphasized acute and high-severity events. These patterns provide empirical support for the study hypothesis that WF offers a more detailed and discriminative assessment of occupational hazards under the examined field conditions.
4. Discussion
4.1. Comparative Discussion of Occupational Risk Assessment Methods
The present study applied both the WF and SM to assess occupational hazards in irrigation and drainage maintenance tasks. WF, a semi-quantitative framework integrating probability (P), exposure (E), and consequences (C, CF), provides a structured ranking of hazards to support decision-making [55,56,57]. SM, in contrast, is quantitative, focusing on observable non-conformities, allowing rapid application but tending to group ergonomic and low-intensity or chronic hazards into lower intervention levels, particularly when consequences are not immediately observable [58,59]. Similar semi-quantitative and quantitative approaches have been successfully applied in industrial and agricultural safety contexts [60].
Both methods consistently identified the highest-risk tasks, including working at height, tractor operations, and removal of invasive vegetation from canals, confirming the validity of the assessments. Divergences occurred for medium-level hazards; WF often clustered slips, trips, ergonomic loads, noise, and vibration within the ‘Substantial’ category, whereas SM tended to assign lower or intermediate risk levels, emphasizing immediate and observable hazards. Comparable patterns of divergence have been reported in construction and industrial safety assessments, e.g., using semi-quantitative approaches in construction works [61,62]. Recent studies in occupational safety assessment have similarly highlighted that semi-quantitative approaches provide greater discrimination for chronic and medium-severity hazards, while simplified or checklist-based methods tend to prioritize immediately observable risks, particularly in infrastructure maintenance and agricultural contexts [63,64].
The updated PCA (Table 4) provides further insight. The KMO value (0.696) indicates marginal but acceptable sampling adequacy, while Bartlett’s test (χ2 = 295.14, p < 0.001) confirms strong inter-variable correlations, justifying PCA application. Two components were extracted: PC1 (50.4%), associated with CF, C, and E (with E negative), represents a “risk–exposure” dimension, capturing hazard impact and worker exposure; PC2 (35.5%), dominated by DC and P, represents “correction–probability,” reflecting the need for corrective measures and likelihood of occurrence. Scores by hazard type (Table 5) align with these interpretations; mechanical hazards scored highest on PC1, while chemical/biological and ergonomic hazards scored higher on PC2. ANOVA and Kruskal–Wallis tests confirmed statistically significant differences, indicating that the principal components capture real variability among risk types.
The Simplified Method (Table 6) complements PCA findings, identifying critical risks (IL = I) in mechanical tasks, work at height, and canal vegetation removal—consistent with PC1. The distribution of risk levels (II vs. III: 74% vs. 26%) suggests that while most hazards require intervention, only a subset is critical. This distribution is consistent with previous occupational risk assessments in agricultural and infrastructure maintenance contexts, where most hazards tend to cluster in intermediate priority classes, while a smaller proportion concentrates high-severity risks requiring urgent action [58,59,60]. Detailed reporting of DL, EL, PL, CL, RL, and IL supports targeted mitigation measures.
Importantly, occupational risk assessment methods can promote sustainable engineering practices. By identifying critical tasks and prioritizing interventions, WUAs can optimize human and financial resources, reduce chemical use, minimize environmental impacts, and ensure the long-term viability of irrigation systems. WF’s detailed prioritization allows nuanced management of medium- and high-consequence hazards, while SM provides a rapid operational overview for day-to-day sustainability planning.
A hybrid assessment strategy is recommended, combining WF and SM strengths: (i) qualitative flagging of chronic or high-consequence hazards; (ii) empirical calibration using incident reports and worker feedback; (iii) perception integration to highlight strongly aversive hazards; (iv) mandatory low-cost mitigation (PPE, signage, training); and (v) hybrid or fuzzy extensions integrating semi-quantitative scores with multi-criteria decision-making tools (e.g., AHP, TOPSIS) to improve discrimination and support sustainable decision-making [56,65]. From a sustainability perspective, this dual-approach framework allows WUAs to reduce resource waste, enhance operational efficiency, and implement proactive, environmentally conscious risk management. These findings provide WUAs with practical guidance for prioritizing interventions and allocating resources effectively in day-to-day operations.
4.2. Risk Management: Suggested Improvement Measures
Urgency and cost ratings were assigned based on expert judgment by the two evaluators, considering observed risk severity, frequency, feasibility of implementation, and typical budgetary constraints of WUA operations. Cost classes represent qualitative order-of-magnitude estimates rather than detailed accounting values.
Based on the findings, a comprehensive set of preventive and corrective measures is proposed for LVID WUA operations to minimize occupational risks while promoting sustainability and operational efficiency (Table 8). Some measures listed in Table 8 (e.g., use of PPE, basic training, and routine equipment checks) are already partially implemented at LVID, whereas others represent proposed enhancements intended to further reduce residual risks and improve long-term sustainability. Each measure includes the targeted hazards, indicative urgency, qualitative cost, and estimated qualitative impact to support decision-making. Measures can be linked to measurable sustainability indicators (e.g., m3/ha of water saved, kg of herbicide avoided, incidents per 1000 working hours) to monitor progress and justify investments.
Table 8.
Prioritized risk-management measures for LVID WUA.
4.3. Limitations
Limitations of the study should be acknowledged. First, the analysis is based on a single case study conducted within one Portuguese Water Users’ Association, which may limit the direct generalization of results to other irrigation districts with different organizational structures or environmental contexts. Second, risk scores rely on expert judgment using semi-quantitative and simplified methods and were not validated against recorded accident or incident rates, which may influence absolute risk magnitudes. Third, the assessment focused on technical and operational hazards and did not explicitly include psychosocial or organizational risks, such as staffing levels, shift organization, or management culture, which may also affect occupational safety. Finally, although field observations were conducted over a two-year period, the risk assessment represents a cumulative, cross-sectional synthesis of recurring hazards rather than a time-series analysis of risk evolution. These limitations highlight the need for future studies incorporating longitudinal incident data, broader risk domains, and multi-site comparisons.
5. Conclusions
This study provides a field-based assessment of occupational hazards in irrigation and drainage maintenance, applying the William T. Fine (WF) and Simplified Method (SM) at the district scale. Four main conclusions can be drawn: (i) mechanical and height-related hazards, together with tractor and boat-based operations, represent the most critical occupational risks, while ergonomic hazards are pervasive across all maintenance activities; (ii) the WF method offers a more nuanced prioritization of risks, particularly for chronic and medium-severity hazards, whereas the SM supports rapid screening and identification of acute and high-severity risks during routine inspections; (iii) a hybrid WF–SM framework enhances decision-making by combining strategic risk discrimination with operational simplicity, supporting efficient allocation of preventive resources; (iv) the prioritized risk management measures proposed for the LVID—covering PPE, task organization, training, equipment control, and environmental monitoring—provide actionable guidance for improving occupational safety while supporting sustainable irrigation management in Water Users’ Associations. Overall, the proposed WF–SM hybrid framework provides a pragmatic and transferable tool to support safer operations, more efficient resource allocation, and sustainability-oriented decision-making in irrigation and drainage management.
Future research should extend this framework to additional irrigation districts, integrate longitudinal incident and near-miss data, and perform formal cost–benefit analyses of prioritized measures. The application of remote sensing, machine learning, and drone-based tools may further support large-scale monitoring of exposure-prone activities, but these developments fall beyond the scope of the present study.
Author Contributions
S.F., T.F., J.M.S. and J.M.G. conceptualize and design the study; S.F., J.M.G., R.E. and H.D. performed the field observations; S.F., T.F., J.M.S. and J.M.G. analyzed and validated the data; S.F. wrote the paper with contributions from the other authors. All authors have read and agreed to the published version of the manuscript.
Funding
This research was funded by the Portuguese Foundation for Science and Technology, grant number 2020.07088.BD; and Program PDR2020, co-funded by FEDER under the Innovation Measure, Portugal, grant number PDR2020-1.0.1-FEADER-030911.
Institutional Review Board Statement
Not applicable.
Informed Consent Statement
Not applicable.
Data Availability Statement
The data presented in this study are available upon request from the corresponding author.
Acknowledgments
The authors would like to thank the Lis Valley Water Users’ Association workers for their collaboration during the data collection.
Conflicts of Interest
The authors declare no conflicts of interest.
Abbreviations
The following abbreviations are used in this manuscript:
| CF | Cost factor (monetary value, euros) |
| CL | Consequences level |
| Csb/Csa | Köppen climate classifications (Mediterranean) |
| DC | Degree of correction |
| DL | Deficiency level |
| EEC | European Economic Community (Directive 89/391/EEC) |
| EL | Exposure level |
| F | Frequency |
| HRS | Hazard risk score |
| J | Justification Index |
| KMO | Kaiser–Meyer–Olkin test |
| LVID | Lis Valley Irrigation District |
| ML | Machine learning |
| MSA | Measures of sampling adequacy |
| N | Number of observations |
| NTP | Technical prevention standards |
| PCA | Principal component analysis |
| PC | Principal component |
| PPE | Personal protective equipment |
| RS | Overall risk severity |
| RL | Risk level |
| SD | Standard deviation |
| SDG | Sustainable Development Goal |
| SM | Simplified method |
| WUA | Water Users’ Association |
| WF | William T. Fine method |
Appendix A. William Fine Method: Scales and Classifications
Table A1.
Numeric values of consequences (C).
Table A1.
Numeric values of consequences (C).
| C | Consequences |
|---|---|
| 100 | Catastrophic breakdown or end-of-business activity |
| 50 | Severe-Damages |
| 25 | Grave |
| 15 | Moderate |
| 5 | Lightweight |
| 1 | None or small impact |
Table A2.
Numeric values of exposure (E).
Table A2.
Numeric values of exposure (E).
| E | Exposure |
|---|---|
| 10 | Several times a day |
| 6 | Once a day, often |
| 3 | Once a week or a month, occasionally |
| 2 | Once a year or a month, irregularly |
| 1 | Rarely possible, but not infrequently known |
| 0.5 | Remotely possible, do not know if it has already occurred |
Table A3.
Numeric values of probability (P).
Table A3.
Numeric values of probability (P).
| P | Probability |
|---|---|
| 10 | Expected to happen |
| 6 | Completely possible (50% chance) |
| 3 | Coincidence if it happens |
| 1 | Remote coincident |
| 0.5 | Extremely remote but possible |
| 0.1 | Practically impossible |
Table A4.
Classification of risk score (RS).
Table A4.
Classification of risk score (RS).
| Risk Score (RS) | Classification | Measures/Priorities |
|---|---|---|
| ≥400 | Very High | Interrupt |
| [200–400] | High | Immediate correction |
| [70–200] | Substantial | Correction as soon as possible |
| [20–70] | Possible | Must be eliminated, but not urgent |
| <20 | Acceptable | Situation to maintain |
Table A5.
Numeric values of cost factor (CF), in euros.
Table A5.
Numeric values of cost factor (CF), in euros.
| Cost (EUR) | Cost Factor (CF) |
|---|---|
| ≥50,000 | 10 |
| [25,000–50,000] | 6 |
| [10,000–25,000] | 3 |
| [1000–10,000] | 3 |
| [100–1000] | 2 |
| [25–100] | 1 |
| <25 | 0.5 |
Table A6.
Numeric values of degree of correction (DC).
Table A6.
Numeric values of degree of correction (DC).
| Degree of Correction (DC) | Description |
|---|---|
| 1 | The risk is completely eliminated (100%) |
| 2 | At least 75% of the risk is eliminated |
| 3 | 75–50% of the risk is eliminated |
| 4 | 50–25% of the risk is eliminated |
| 6 | Less than 25% of the risk is eliminated |
Appendix B. Simplified Method (INSHT/NTP 330): Scales and Matrices
Table A7.
Numeric values of DL and meaning.
Table A7.
Numeric values of DL and meaning.
| Deficiency Level | DL | Meaning |
|---|---|---|
| Very Deficient | 10 | Existence of significant risk factors. |
| Deficient | 6 | Existence of some risk factors that need to be corrected. |
| Improvable | 2 | Minor risk factors. |
| Acceptable | --- | Anomalies are not detected. |
Table A8.
Numeric values of EL and meaning.
Table A8.
Numeric values of EL and meaning.
| Exposure Level | DL | Meaning |
|---|---|---|
| Continued | 4 | Several times throughout the working day and in a prolonged way. |
| Frequent | 3 | Several times throughout the journey, for short periods of time. |
| Occasional | 2 | Sometimes along the journey, for short periods of time. |
| Sporadic | 1 | Irregularly. |
Table A9.
Combination of DL and EL and its meaning.
Table A9.
Combination of DL and EL and its meaning.
| Exposure Level (EL) | |||||
|---|---|---|---|---|---|
| 4 | 3 | 2 | 1 | ||
| Deficiency Level (DL) | 10 | VH–40 | VH–30 | H–20 | H–10 |
| 6 | VH–24 | H–18 | H–12 | A–6 | |
| 2 | A–8 | A–6 | L–4 | L–2 | |
VH—Very High (40–24): Deficient situation with continued exposure or very deficient with frequent exposure. Usually, the materialization of risk occurs frequently. H—High (20–10): Deficient situation with frequent or occasional exposure. The materialization of risk may occur several times during the workday. M—Average (8–6): Deficient situation with sporadic exposure. It is possible that the damage will ever materialize. L—Low (4–2): Improbable situation with occasional or sporadic exposure. The risk is not expected to materialize.
Table A10.
Numeric values of CL and their meaning.
Table A10.
Numeric values of CL and their meaning.
| Consequences Level | CL | Meaning | |
|---|---|---|---|
| Personal Damages | Material Damages | ||
| Mortal or Catastrophic | 100 | 1 fatal victim or more | Total system destruction |
| Very Serious | 60 | Serious injuries | Partial destruction of the system |
| Severe | 25 | Injuries with temporary work disability | Requires process stop |
| Slight | 10 | Small injuries without hospitalization | Repair without stopping |
Table A11.
Determination of RL by combination of PL and CL.
Table A11.
Determination of RL by combination of PL and CL.
| Probability Level (PL) | |||||
|---|---|---|---|---|---|
| 40–24 | 20–10 | 8–6 | 4–2 | ||
| Consequences Level (CL) | 100 | I 4000–2400 | I 2000–1200 | I 800–600 | II 400–200 |
| 60 | I | I | II | II 240 | |
| 2400–1440 | 1200–600 | 480–360 | III 120 | ||
| 25 | I 1000–600 | II 500–250 | II 200–150 | III 100–50 | |
| 10 | II | II 200 | III | III 40 | |
| 400–240 | III 100 | 80–60 | IV 20 | ||
Table A12.
Numeric values of CL and their meaning.
Table A12.
Numeric values of CL and their meaning.
| Intervention Level | RL | Material Damages |
|---|---|---|
| I | 4000–600 | Critical situation. Urgent correction |
| II | 500–150 | Correct and adopt control measures |
| III | 120–40 | It can be improved if possible. |
| IV | >20 | There is no need to intervene, unless a more demanding analysis justifies it. |
Appendix C. PCA Output (William Fine Variables)
Table A13.
PCA eigenvalues, explained variance, and rotated loadings (Promax rotation).
Table A13.
PCA eigenvalues, explained variance, and rotated loadings (Promax rotation).
| Variable | PC1 Loading | PC2 Loading | Uniqueness |
|---|---|---|---|
| Consequence (C) | 0.983 | — | 0.096 |
| Exposure (E) | −0.737 | — | 0.089 |
| Probability (P) | — | 0.815 | 0.263 |
| Cost Factor (CF) | 0.993 | — | 0.109 |
| Degree of Correction (DC) | — | 0.976 | 0.152 |
| Eigenvalues and explained variance | |||
| Component | Eigenvalue | Explained variance (%) | Cumulative (%) |
| PC1 | 3.062 | 50.4 | 50.4 |
| PC2 | 1.229 | 35.5 | 85.8 |
KMO = 0.696; Bartlett’s test: χ2 = 295.14, p < 0.001. Loadings shown correspond to the structure matrix after Promax rotation.
Appendix D. PCA Output (Simplified Method Variables)
Table A14.
PCA eigenvalues, explained variance, and rotated loadings for SM variables (Promax rotation).
Table A14.
PCA eigenvalues, explained variance, and rotated loadings for SM variables (Promax rotation).
| Variable | PC1 Loading | Uniqueness |
|---|---|---|
| Danger Level (DL) | 0.83 | — |
| Exposure Level (EL) | −0.87 | — |
| Consequence Level (CL) | 0.91 | — |
| Eigenvalues and explained variance | ||
| Component | Eigenvalue | Cumulative (%) |
| PC1 | 2.27 | 75.8 |
KMO = 0.69; Bartlett’s test: χ2 = 108.83, df = 3, p < 0.001. Loadings correspond to the structure matrix after Promax rotation.
Appendix E. Detailed William Fine Hazard Scoring
Table A15.
PCA eigenvalues, explained variance, and rotated loadings for SM variables (Promax rotation).
Table A15.
PCA eigenvalues, explained variance, and rotated loadings for SM variables (Promax rotation).
| Dangerous Conditions (Hazard) | Risk Category | C | E | P | HRS | Risk Level | CF (EUR) | DC | J | Justification Status |
|---|---|---|---|---|---|---|---|---|---|---|
| Assembly & Disassembly of Demountable Weirs | ||||||||||
| Removal and elevation of wooden beams | Mechanical (falling objects) | 15 | 2 | 3 | 90 | Substantial | 3 | 2 | 15 | Justified |
| Mechanical (cuts, bruises, crushing) | 1 | 3 | 1 | 3 | Acceptable | 2 | 3 | 0.5 | Not justified | |
| Mechanical (entrapment) | 15 | 2 | 3 | 90 | Substantial | 3 | 2 | 15 | Justified | |
| Ergonomic (awkward postures) | 5 | 3 | 6 | 90 | Substantial | 3 | 4 | 7.5 | Not justified | |
| Ergonomic (over-exertion) | 5 | 3 | 6 | 90 | Substantial | 3 | 4 | 7.5 | Not justified | |
| Exercise of activity inside the river | Physical (cold water exposure) | 1 | 3 | 3 | 9 | Acceptable | 2 | 4 | 1.1 | Not justified |
| Physical (slips/trips) | 5 | 3 | 6 | 90 | Substantial | 3 | 4 | 7.5 | Not justified | |
| Physical (noise) | 5 | 3 | 6 | 90 | Substantial | 3 | 4 | 7.5 | Not justified | |
| Physical (fall into water) | 15 | 2 | 3 | 90 | Substantial | 6 | 2 | 7.5 | Not justified | |
| Electrical (contact with equipment) | 5 | 3 | 6 | 90 | Substantial | 3 | 4 | 7.5 | Not justified | |
| Chemical/Biological (water pollutants) | 5 | 3 | 6 | 90 | Substantial | 3 | 4 | 7.5 | Not justified | |
| Cutting of Vegetation Using Tractor | ||||||||||
| Mechanical handling | Mechanical (moving parts) | 15 | 2 | 3 | 90 | Substantial | 3 | 2 | 15 | Justified |
| Mechanical (falling objects) | 15 | 2 | 3 | 90 | Substantial | 3 | 2 | 15 | Justified | |
| Mechanical (tractor rollover) | 100 | 1 | 3 | 300 | High | 6 | 2 | 25 | Justified | |
| Mechanical (flying debris) | 5 | 3 | 3 | 45 | Possible | 3 | 3 | 5 | Not justified | |
| Ergonomic (awkward posture) | 5 | 3 | 6 | 90 | Substantial | 3 | 4 | 7.5 | Not justified | |
| Ergonomic (over-exertion) | 5 | 3 | 6 | 90 | Substantial | 3 | 4 | 7.5 | Not justified | |
| Physical (vibrations) | 5 | 3 | 6 | 90 | Substantial | 3 | 4 | 7.5 | Not justified | |
| Physical (noise) | 5 | 3 | 6 | 90 | Substantial | 3 | 4 | 7.5 | Not justified | |
| Physical (heat/sun exposure) | 5 | 3 | 6 | 90 | Substantial | 3 | 4 | 7.5 | Not justified | |
| Electrical handling | Electrical (faulty components) | 5 | 3 | 6 | 90 | Substantial | 3 | 4 | 7.5 | Not justified |
| Chemical exposure | Chemical/Biological (fuel/oil exposure) | 5 | 3 | 6 | 90 | Substantial | 3 | 4 | 7.5 | Not justified |
| Chemical/Biological (dust) | 5 | 3 | 6 | 90 | Substantial | 3 | 4 | 7.5 | Not justified | |
| Physical (contact with water pollutants) | 5 | 3 | 6 | 90 | Substantial | 3 | 4 | 7.5 | Not justified | |
| Repair of Irrigation Canals | ||||||||||
| Usage of electric hammer | Physical (noise) | 5 | 3 | 6 | 90 | Substantial | 3 | 4 | 7.5 | Not justified |
| Electrical (contact with faulty tools) | 5 | 3 | 6 | 90 | Substantial | 3 | 4 | 7.5 | Not justified | |
| Ergonomic (working posture) | 5 | 3 | 6 | 90 | Substantial | 3 | 4 | 7.5 | Not justified | |
| Manual handling of materials | Mechanical (falling objects) | 15 | 2 | 3 | 90 | Substantial | 3 | 2 | 15 | Justified |
| Mechanical (cuts) | 5 | 3 | 3 | 45 | Possible | 3 | 3 | 5 | Not justified | |
| Ergonomic (over-exertion) | 5 | 3 | 6 | 90 | Substantial | 3 | 4 | 7.5 | Not justified | |
| Physical (slips/trips) | 5 | 3 | 3 | 45 | Possible | 3 | 3 | 5 | Not justified | |
| Physical (vibrations) | 5 | 3 | 6 | 90 | Substantial | 3 | 4 | 7.5 | Not justified | |
| Physical (noise) | 5 | 3 | 6 | 90 | Substantial | 3 | 4 | 7.5 | Not justified | |
| Chemical/Biological (dust) | 5 | 3 | 6 | 90 | Substantial | 3 | 4 | 7.5 | Not justified | |
| Chemical/Biological (oils/grease) | 5 | 3 | 6 | 90 | Substantial | 3 | 4 | 7.5 | Not justified | |
| Chemical/Biological (contact with water) | 5 | 3 | 6 | 90 | Substantial | 3 | 6 | 5 | Not justified | |
| Pipeline Cleaning | ||||||||||
| Mechanical handling | Mechanical (moving parts) | 15 | 2 | 3 | 90 | Substantial | 3 | 2 | 15 | Justified |
| Mechanical (falling objects) | 15 | 2 | 3 | 90 | Substantial | 3 | 2 | 15 | Justified | |
| Mechanical (entrapment) | 15 | 2 | 3 | 90 | Substantial | 3 | 2 | 15 | Justified | |
| Mechanical (sharp tools) | 5 | 3 | 3 | 45 | Possible | 3 | 3 | 5 | Not justified | |
| Ergonomic (awkward posture) | 5 | 3 | 6 | 90 | Substantial | 3 | 4 | 7.5 | Not justified | |
| Ergonomic (over-exertion) | 5 | 3 | 6 | 90 | Substantial | 3 | 4 | 7.5 | Not justified | |
| Physical (vibrations) | 5 | 3 | 6 | 90 | Substantial | 3 | 4 | 7.5 | Not justified | |
| Physical (noise) | 5 | 3 | 6 | 90 | Substantial | 3 | 4 | 7.5 | Not justified | |
| Physical (low temperatures) | 5 | 3 | 3 | 45 | Possible | 3 | 3 | 5 | Not justified | |
| Physical (confined space) | 15 | 2 | 3 | 90 | Substantial | 3 | 2 | 15 | Justified | |
| Electrical (faulty equipment) | 5 | 3 | 6 | 90 | Substantial | 3 | 4 | 7.5 | Not justified | |
| Chemical/Biological (cleaning chemicals) | 5 | 3 | 6 | 90 | Substantial | 3 | 4 | 7.5 | Not justified | |
| Chemical/Biological (dust) | 5 | 3 | 6 | 90 | Substantial | 3 | 4 | 7.5 | Not justified | |
| Chemical/Biological (contact with animals) | 5 | 3 | 6 | 90 | Substantial | 3 | 4 | 7.5 | Not justified | |
| Manual Application of Herbicide | ||||||||||
| Use of herbicide | Chemical (herbicide exposure) | 15 | 2 | 3 | 90 | Substantial | 6 | 4 | 3.75 | Not justified |
| Chemical (spillage) | 5 | 3 | 3 | 45 | Possible | 3 | 4 | 3.75 | Not justified | |
| Chemical (environmental contamination) | 5 | 3 | 3 | 45 | Possible | 6 | 4 | 1.88 | Not justified | |
| Manual application | Ergonomic (poor posture) | 5 | 3 | 6 | 90 | Substantial | 3 | 4 | 7.5 | Not justified |
| Ergonomic (over-exertion) | 5 | 3 | 6 | 90 | Substantial | 3 | 4 | 7.5 | Not justified | |
| Physical (heat) | 5 | 3 | 3 | 45 | Possible | 2 | 4 | 5.63 | Not justified | |
| Physical (slips/trips) | 5 | 3 | 3 | 45 | Possible | 3 | 3 | 5 | Not justified | |
| Physical (noise) | 5 | 3 | 6 | 90 | Substantial | 3 | 4 | 7.5 | Not justified | |
| Repair of Gutters at Height | ||||||||||
| Height repair | Mechanical (fall from height) | 100 | 1 | 3 | 300 | High | 10 | 4 | 7.5 | Not justified |
| Mechanical (falling objects) | 15 | 2 | 3 | 90 | Substantial | 3 | 4 | 7.5 | Not justified | |
| Mechanical (over-exertion) | 5 | 3 | 6 | 90 | Substantial | 3 | 4 | 7.5 | Not justified | |
| Ergonomic (awkward posture) | 5 | 3 | 6 | 90 | Substantial | 3 | 4 | 7.5 | Not justified | |
| Physical (slips/trips) | 5 | 3 | 3 | 45 | Possible | 3 | 4 | 3.75 | Not justified | |
| Physical (weather exposure) | 5 | 3 | 3 | 45 | Possible | 3 | 4 | 3.75 | Not justified | |
| Electrical (contact with power lines) | 15 | 2 | 3 | 90 | Substantial | 6 | 3 | 5 | Not justified | |
| Chemical/Biological (asphalt/fumes) | 5 | 3 | 6 | 90 | Substantial | 3 | 4 | 7.5 | Not justified | |
| Chemical/Biological (gas torch use) | 15 | 2 | 3 | 90 | Substantial | 6 | 3 | 5 | Not justified | |
| Repair of Gates | ||||||||||
| Use of welding devices | Mechanical (fall from height) | 100 | 1 | 3 | 300 | High | 10 | 4 | 7.5 | Not justified |
| Mechanical (falling objects) | 15 | 2 | 3 | 90 | Substantial | 3 | 4 | 7.5 | Not justified | |
| Mechanical (unexpected gate movement) | 15 | 2 | 3 | 90 | Substantial | 6 | 3 | 5 | Not justified | |
| Ergonomic (awkward posture) | 5 | 3 | 6 | 90 | Substantial | 3 | 4 | 7.5 | Not justified | |
| Ergonomic (over-exertion) | 5 | 3 | 6 | 90 | Substantial | 3 | 4 | 7.5 | Not justified | |
| Physical (slips/trips) | 5 | 3 | 3 | 45 | Possible | 3 | 4 | 3.75 | Not justified | |
| Physical (weather exposure) | 5 | 3 | 3 | 45 | Possible | 3 | 4 | 3.75 | Not justified | |
| Physical (fall into water) | 15 | 2 | 3 | 90 | Substantial | 6 | 3 | 5 | Not justified | |
| Electrical (contact with power lines) | 15 | 2 | 3 | 90 | Substantial | 6 | 3 | 5 | Not justified | |
| Chemical/Biological (paints/solvents) | 5 | 3 | 6 | 90 | Substantial | 3 | 4 | 7.5 | Not justified | |
| Aquatic Plants Removal (Boat-Based) | ||||||||||
| Boat-based removal | Mechanical (fall from boat) | 100 | 1 | 3 | 300 | High | 10 | 4 | 7.5 | Not justified |
| Mechanical (entanglement) | 15 | 2 | 3 | 90 | Substantial | 3 | 4 | 7.5 | Not justified | |
| Mechanical (sharp tools) | 5 | 3 | 3 | 45 | Possible | 3 | 4 | 3.75 | Not justified | |
| Ergonomic (awkward posture) | 5 | 3 | 6 | 90 | Substantial | 3 | 4 | 7.5 | Not justified | |
| Ergonomic (over-exertion) | 5 | 3 | 6 | 90 | Substantial | 3 | 4 | 7.5 | Not justified | |
| Physical (sun exposure) | 5 | 3 | 3 | 45 | Possible | 3 | 4 | 3.75 | Not justified | |
| Physical (cold water exposure) | 5 | 3 | 3 | 45 | Possible | 3 | 4 | 3.75 | Not justified | |
| Electrical (malfunctioning boat equipment) | 15 | 2 | 3 | 90 | Substantial | 6 | 3 | 5 | Not justified | |
| Chemical/Biological (polluted water) | 5 | 3 | 6 | 90 | Substantial | 3 | 4 | 7.5 | Not justified | |
| Chemical/Biological (insect bites) | 5 | 3 | 3 | 45 | Possible | 3 | 4 | 3.75 | Not justified | |
Abbreviations: C = consequence; E = exposure; P = probability; HRS = overall risk score; CF (EUR) = cost factor; DC = degree of correction; J = justification index. Risk categories indicate the type of hazard (mechanical, ergonomic, physical, electrical, chemical/biological). Justification status indicates whether corrective action cost is justified (J ≥ 10) or not. Risk levels classified as “High” risks are highlighted in red, “Substantial” risks in orange, and J ≥ 10 is also highlighted in red.
Appendix F. Detailed Simplified Method Hazard Scoring
Table A16.
Full task-by-task SM hazard, risk, and intervention table.
Table A16.
Full task-by-task SM hazard, risk, and intervention table.
| Dangerous Conditions (Hazard) | Risk Category | DL | EL | PL | CL | RL | IL | Intervention Category |
|---|---|---|---|---|---|---|---|---|
| Assembly & Disassembly of Demountable Weirs | ||||||||
| Removal and elevation of wooden beams | Mechanical (falling objects) | 6 | 2 | 12 | 60 | 720 | II | Correct and adopt measures |
| Mechanical (cuts, bruises, crushing) | 6 | 3 | 18 | 10 | 180 | II | Correct and adopt measures | |
| Mechanical (entrapment) | 6 | 2 | 12 | 60 | 720 | II | Correct and adopt measures | |
| Ergonomic (awkward postures) | 6 | 3 | 18 | 25 | 450 | II | Correct and adopt measures | |
| Ergonomic (over-exertion) | 6 | 3 | 18 | 25 | 450 | II | Correct and adopt measures | |
| Exercise of activity inside the river | Physical (cold water exposure) | 6 | 3 | 18 | 10 | 180 | II | Correct and adopt measures |
| Physical (slips/trips) | 6 | 3 | 18 | 60 | 1080 | II | Correct and adopt measures | |
| Physical (noise) | 6 | 3 | 18 | 25 | 450 | II | Correct and adopt measures | |
| Physical (fall into water) | 6 | 2 | 12 | 10 | 120 | III | Improve if possible | |
| Electrical (contact with equipment) | 6 | 3 | 18 | 25 | 450 | II | Correct and adopt measures | |
| Chemical/Biological (water pollutants) | 6 | 3 | 18 | 25 | 450 | II | Correct and adopt measures | |
| Cutting of Vegetation Using Tractor | ||||||||
| Mechanical handling | Mechanical (moving parts) | 6 | 2 | 12 | 60 | 720 | II | Correct and adopt measures |
| Mechanical (falling objects) | 6 | 2 | 12 | 60 | 720 | II | Correct and adopt measures | |
| Mechanical (tractor rollover) | 10 | 1 | 10 | 100 | 1000 | I | Critical | |
| Mechanical (flying debris) | 6 | 3 | 18 | 10 | 180 | II | Correct and adopt measures | |
| Ergonomic (awkward posture) | 6 | 3 | 18 | 25 | 450 | II | Correct and adopt measures | |
| Ergonomic (over-exertion) | 6 | 3 | 18 | 25 | 450 | II | Correct and adopt measures | |
| Physical (vibrations) | 6 | 3 | 18 | 25 | 450 | II | Correct and adopt measures | |
| Physical (noise) | 6 | 3 | 18 | 25 | 450 | II | Correct and adopt measures | |
| Physical (heat/sun exposure) | 6 | 3 | 18 | 25 | 450 | II | Correct and adopt measures | |
| Electrical handling | Electrical (faulty components) | 6 | 3 | 18 | 25 | 450 | II | Correct and adopt measures |
| Chemical exposure | Chemical/Biological (fuel/oil exposure) | 6 | 3 | 18 | 25 | 450 | II | Correct and adopt measures |
| Chemical/Biological (dust) | 6 | 3 | 18 | 25 | 450 | II | Correct and adopt measures | |
| Physical (contact with water pollutants) | 6 | 3 | 18 | 25 | 450 | II | Correct and adopt measures | |
| Repair of Irrigation Canals | ||||||||
| Usage of electric hammer | Physical (noise) | 6 | 3 | 18 | 25 | 450 | II | Correct and adopt measures |
| Electrical (contact with faulty tools) | 6 | 3 | 18 | 25 | 450 | II | Correct and adopt measures | |
| Ergonomic (working posture) | 6 | 3 | 18 | 25 | 450 | II | Correct and adopt measures | |
| Manual handling of materials | Mechanical (falling objects) | 6 | 2 | 12 | 60 | 720 | II | Correct and adopt measures |
| Mechanical (cuts) | 6 | 3 | 18 | 10 | 180 | II | Correct and adopt measures | |
| Ergonomic (over-exertion) | 6 | 3 | 18 | 25 | 450 | II | Correct and adopt measures | |
| Physical (slips/trips) | 6 | 3 | 18 | 10 | 180 | II | Correct and adopt measures | |
| Physical (vibrations) | 6 | 3 | 18 | 25 | 450 | II | Correct and adopt measures | |
| Physical (noise) | 6 | 3 | 18 | 25 | 450 | II | Correct and adopt measures | |
| Chemical/Biological (dust) | 6 | 3 | 18 | 25 | 450 | II | Correct and adopt measures | |
| Chemical/Biological (oils/grease) | 6 | 3 | 18 | 25 | 450 | II | Correct and adopt measures | |
| Chemical/Biological (contact with water) | 6 | 3 | 18 | 25 | 450 | II | Correct and adopt measures | |
| Pipeline Cleaning | ||||||||
| Mechanical handling | Mechanical (moving parts) | 6 | 2 | 12 | 60 | 720 | II | Correct and adopt measures |
| Mechanical (falling objects) | 6 | 2 | 12 | 60 | 720 | II | Correct and adopt measures | |
| Mechanical (entrapment) | 6 | 2 | 12 | 60 | 720 | II | Correct and adopt measures | |
| Mechanical (sharp tools) | 6 | 2 | 12 | 10 | 120 | III | Improve if possible | |
| Ergonomic (awkward posture) | 6 | 3 | 18 | 25 | 450 | II | Correct and adopt measures | |
| Ergonomic (over-exertion) | 6 | 3 | 18 | 25 | 450 | II | Correct and adopt measures | |
| Physical (vibrations) | 6 | 3 | 18 | 25 | 450 | II | Correct and adopt measures | |
| Physical (noise) | 6 | 3 | 18 | 25 | 450 | II | Correct and adopt measures | |
| Physical (low temperatures) | 6 | 2 | 12 | 10 | 120 | III | Improve if possible | |
| Physical (confined space) | 6 | 2 | 12 | 60 | 720 | II | Correct and adopt measures | |
| Electrical (faulty equipment) | 6 | 3 | 18 | 25 | 450 | II | Correct and adopt measures | |
| Chemical/Biological (cleaning chemicals) | 6 | 3 | 18 | 25 | 450 | II | Correct and adopt measures | |
| Chemical/Biological (dust) | 6 | 3 | 18 | 25 | 450 | II | Correct and adopt measures | |
| Chemical/Biological (contact with animals) | 6 | 3 | 18 | 25 | 450 | II | Correct and adopt measures | |
| Manual Application of Herbicide | ||||||||
| Use of herbicide | Chemical (herbicide exposure) | 6 | 2 | 12 | 60 | 720 | II | Correct and adopt measures |
| Chemical (spillage) | 6 | 3 | 18 | 10 | 180 | II | Correct and adopt measures | |
| Chemical (environmental contamination) | 6 | 3 | 18 | 10 | 180 | II | Correct and adopt measures | |
| Manual application | Ergonomic (poor posture) | 6 | 3 | 18 | 25 | 450 | II | Correct and adopt measures |
| Ergonomic (over-exertion) | 6 | 3 | 18 | 25 | 450 | II | Correct and adopt measures | |
| Physical (heat) | 6 | 3 | 18 | 10 | 180 | II | Correct and adopt measures | |
| Physical (slips/trips) | 6 | 3 | 18 | 10 | 180 | II | Correct and adopt measures | |
| Physical (noise) | 6 | 3 | 18 | 25 | 450 | II | Correct and adopt measures | |
| Repair of Gutters at Height | ||||||||
| Height repair | Mechanical (fall from height) | 10 | 1 | 10 | 100 | 1000 | I | Critical |
| Mechanical (falling objects) | 6 | 2 | 12 | 60 | 720 | II | Correct and adopt measures | |
| Mechanical (over-exertion) | 6 | 3 | 18 | 25 | 450 | II | Correct and adopt measures | |
| Ergonomic (awkward posture) | 6 | 3 | 18 | 25 | 450 | II | Correct and adopt measures | |
| Physical (slips/trips) | 6 | 3 | 18 | 10 | 180 | II | Correct and adopt measures | |
| Physical (weather exposure) | 6 | 3 | 18 | 10 | 180 | II | Correct and adopt measures | |
| Electrical (contact with power lines) | 6 | 2 | 12 | 60 | 720 | II | Correct and adopt measures | |
| Chemical/Biological (asphalt/fumes) | 6 | 3 | 18 | 25 | 450 | II | Correct and adopt measures | |
| Chemical/Biological (gas torch use) | 6 | 2 | 12 | 60 | 720 | II | Correct and adopt measures | |
| Repair of Gates | ||||||||
| Use of welding devices | Mechanical (fall from height) | 10 | 1 | 10 | 100 | 1000 | I | Critical |
| Mechanical (falling objects) | 6 | 2 | 12 | 60 | 720 | II | Correct and adopt measures | |
| Mechanical (unexpected gate movement) | 6 | 2 | 12 | 60 | 720 | II | Correct and adopt measures | |
| Ergonomic (awkward posture) | 6 | 3 | 18 | 25 | 450 | II | Correct and adopt measures | |
| Ergonomic (over-exertion) | 6 | 3 | 18 | 25 | 450 | II | Correct and adopt measures | |
| Physical (slips/trips) | 6 | 3 | 18 | 10 | 180 | II | Correct and adopt measures | |
| Physical (weather exposure) | 6 | 3 | 18 | 10 | 180 | II | Correct and adopt measures | |
| Physical (fall into water) | 6 | 2 | 12 | 60 | 720 | II | Correct and adopt measures | |
| Electrical (contact with power lines) | 6 | 2 | 12 | 60 | 720 | II | Correct and adopt measures | |
| Chemical/Biological (paints/solvents) | 6 | 3 | 18 | 25 | 450 | II | Correct and adopt measures | |
| Aquatic Plants Removal (Boat-Based) | ||||||||
| Boat-based removal | Mechanical (fall from boat) | 10 | 2 | 20 | 100 | 2000 | I | Critical |
| Mechanical (entanglement) | 6 | 2 | 12 | 60 | 720 | II | Correct and adopt measures | |
| Mechanical (sharp tools) | 6 | 2 | 12 | 10 | 120 | III | Improve if possible | |
| Ergonomic (awkward posture) | 6 | 3 | 18 | 25 | 450 | II | Correct and adopt measures | |
| Ergonomic (over-exertion) | 6 | 3 | 18 | 25 | 450 | II | Correct and adopt measures | |
| Physical (sun exposure) | 6 | 2 | 12 | 10 | 120 | III | Improve if possible | |
| Physical (cold water exposure) | 6 | 2 | 12 | 10 | 120 | III | Improve if possible | |
| Electrical (malfunctioning boat equipment) | 6 | 2 | 12 | 25 | 300 | III | Improve if possible | |
| Chemical/Biological (polluted water) | 6 | 2 | 12 | 25 | 300 | III | Improve if possible | |
| Chemical/Biological (insect bites) | 6 | 2 | 12 | 10 | 120 | III | Improve if possible | |
Abbreviations: DL = deficiency level; EL = exposure level; PL = probability level; CL = consequences level; RL = risk level; IL = intervention level. Risk categories indicate the type of hazard (mechanical, ergonomic, physical, electrical, chemical/biological). Intervention category describes the recommended action: I = critical; II = correct and adopt measures; III = improve if possible. IL: “Critical” risks (I) are highlighted in red; other levels (II, III) are not colored.
References
- International Labour Organization (ILO). OSH Management System: A Tool for Continual Improvement; World Day for Safety and Health at Work, 28 April 2011; Supported by the International Social Security Association. Available online: https://www.ilo.org/safeday (accessed on 17 November 2025).
- British Occupational Hygiene Society (BOHS). Exposure Assessment Tools. Available online: https://www.bohs.org/information-guidance/technical-guidance/ (accessed on 7 December 2024).
- International Labour Organization (ILO). C155—Occupational Safety and Health Convention, 1981. Available online: https://www.ilo.org/dyn/normlex/en/f?p=NORMLEXPUB:12100:0::NO::P12100_ILO_CODE:C155 (accessed on 19 February 2025).
- European Economic Community (EEC). Council Directive 89/391/EEC. In Official Journal of the European Communities; European Economic Community: Brussels, Belgium, 1989; Volume 183, p. 1. Available online: https://eur-lex.europa.eu/legal-content/PT/TXT/PDF/?uri=CELEX:31989L0391&from=EN (accessed on 21 February 2025).
- United Nations (UN). Transforming Our World: The 2030 Agenda for Sustainable Development. 2015. Available online: https://sdgs.un.org/2030agenda (accessed on 20 February 2025).
- Diário da República (DR). Law No. 3/2014. In Diário da República; 1st Series; Diário da República: Lisbon, Portugal, 2014; No. 19; Available online: https://dre.pt/pesquisa/-/search/571052/details/maximized (accessed on 20 February 2025).
- Rasul, F.; Munir, H.; Wajid, A.; Safdar, M.; Ayub, M.S.; Shahzad, S.; Mehmood, R.; Shahid, M.A.; Sarwar, A.; Majeed, M.D.; et al. Sustainable irrigation management for higher yield. In Irrigation and Drainage—Recent Advances; Sultan, M., Ahmad, F., Eds.; IntechOpen: London, UK, 2022. [Google Scholar] [CrossRef]
- Milea, A.; Moraru, R.-I.; Cioca, L.-I. Occupational risk management through the lens of the sustainable development goals (SDGs): An integrated approach to promoting sustainability in the workplace. Sustainability 2025, 17, 1864. [Google Scholar] [CrossRef]
- Kuricová, A.; Hudáková, M.; Kočkár, S.; Hollá, K. An innovative approach to occupational risk assessment in OHS: A case study on the verification of the ALrisk model in manufacturing enterprises in Slovakia. Int. J. Environ. Res. Public Health 2025, 22, 757. [Google Scholar] [CrossRef]
- Zavala-Alcívar, A.; Verdecho, M.-J.; Alfaro-Saiz, J.-J. A conceptual framework to manage resilience and increase sustainability in the supply chain. Sustainability 2020, 12, 6300. [Google Scholar] [CrossRef]
- Adhikari, S.; Khanal, A.R. Economic sustainability and multiple risk management strategies: Examining interlinked decisions of small American farms. Sustainability 2021, 13, 1741. [Google Scholar] [CrossRef]
- International Labour Organization (ILO). Risk Management and Occupational Safety and Health: A Practical Guide. Available online: https://www.ilo.org/sites/default/files/wcmsp5/groups/public/@ed_protect/@protrav/@safework/documents/publication/wcms_222333.pdf (accessed on 17 November 2025).
- Hollá, K.; Kuricová, A.; Kočkár, S.; Prievozník, P.; Dostál, F. Risk assessment industry driven approach in occupational health and safety. Front. Public Health 2024, 12, 1381879. [Google Scholar] [CrossRef]
- Zakaria, A. Hazard Analysis and Risk Assessment; Alexandria University: Alexandria, Egypt, 2009. [Google Scholar] [CrossRef]
- Boariu, D.I.; Armean, P. Role of risk assessment in prevention of work-related accidents and diseases in hospital staff. J. Med. Life 2020, 13, 410–417. [Google Scholar] [CrossRef]
- Macdonald, D.; Mackay, S. Introduction to hazard studies. In Practical Hazops, Trips and Alarms; Newnes: Oxford, UK, 2004; pp. 1–30. [Google Scholar] [CrossRef]
- Canadian Centre for Occupational Health and Safety (CCOHS). Risk Assessment. Available online: https://www.ccohs.ca/oshanswers/hsprograms/hazard/risk_assessment.pdf (accessed on 17 November 2025).
- Taibi, Y.; Metzler, Y.A.; Bellingrath, S.; Neuhaus, C.A.; Müller, A. Applying risk matrices for assessing the risk of psycho-social hazards at work. Front. Public Health 2022, 10, 965262. [Google Scholar] [CrossRef]
- Ritzema, H.P. Advances in Drainage Design and Management for Irrigated Agriculture; Wageningen University: Wageningen, The Netherlands, 2024; ISBN 978-1-83545-174-8. [Google Scholar]
- Murray-Rust, D.; Svendsen, M.; Burton, M.; Molden, D. Irrigation and drainage systems maintenance: Needs for research and action. Irrig. Drain. Syst. 2003, 17, 129–140. [Google Scholar] [CrossRef]
- International Commission on Irrigation and Drainage. Planning the Management, Operation, and Maintenance of Irrigation and Drainage Systems: A Guide for the Preparation of Strategies and Manuals; World Bank Technical Paper No. WTP 389; World Bank: Washington, DC, USA, 1998; Available online: http://documents.worldbank.org/curated/en/832711468765924633 (accessed on 17 November 2025).
- Huppert, W.; Svendsen, M.; Vermillion, D.L. Maintenance in irrigation: Multiple actors, multiple contexts, multiple strategies. Irrig. Drain. Syst. 2003, 17, 5–22. [Google Scholar] [CrossRef]
- Wang, J.; Jiang, C.; Yang, G.; Bai, G.; Yu, S. Study on thermal health and its safety management mode for the working environment. Front. Public Health 2023, 11, 1227630. [Google Scholar] [CrossRef]
- Tzioutzios, D.; Pacevicius, M.; Cruz, A.M.; Paltrinieri, N. Vegetation: A risk influencing factor for natech scenarios. In Proceedings of the 2023 International Conference on Natural Hazards and Risk Management, Rome, Italy, 10–12 July 2023; pp. 2173–2180. [Google Scholar] [CrossRef]
- Gadd, S.A.; Keeley, D.M.; Balmforth, H.F. Pitfalls in risk assessment: Examples from the UK. Saf. Sci. 2004, 42, 841–857. [Google Scholar] [CrossRef]
- European Agency for Safety and Health at Work (OSHA). Factsheet 81—Risk Assessment: The Key to Healthy Workplaces; European Agency for Safety and Health at Work: Bilbao, Spain, 2008; Available online: https://osha.europa.eu/en/publications/factsheet-81-risk-assessment-key-healthy-workplaces (accessed on 20 February 2025).
- Carvalho, F. Comparative Study Between Different Methods of Risk Evaluation in Real Work Situation. Master’s Thesis, Universidade Técnica de Lisboa, Lisboa, Portugal, 2007. (In Portuguese). [Google Scholar]
- Lind-Kohvakka, S.; Nenonen, S. Occupational risks in industrial maintenance. J. Qual. Maint. Eng. 2008, 14, 194–204. [Google Scholar] [CrossRef]
- Singh, R.; Pundir, A.; Iqbal, R. Occupational physical stress faced by construction workers & painters and improvement of their work activity: A literature review. Int. J. Eng. Sci. Res. 2019, 3, 1–10. [Google Scholar]
- Timofeeva, S.S.; Ulrikh, D.V.; Tsvetkun, N.V. Professional risks in construction industry. Procedia Eng. 2017, 206, 911–917. [Google Scholar] [CrossRef]
- Kumaresan, M.; Darivemula, S.B.; Bala, S.; Kadas, S. Musculoskeletal disorders among long-standing workers working for more than 6-hours a day in an automobile factory in South India. J. Emerg. Trauma Shock 2025, 18, 119–125. [Google Scholar] [CrossRef]
- Leder Horina, J.; Blašković Zavada, J.; Slavulj, M.; Budimir, D. Ergonomics study of musculoskeletal disorders among tram drivers. Appl. Sci. 2025, 15, 8348. [Google Scholar] [CrossRef]
- Donham, M.; Thelin, A. Agricultural Medicine: RURAL Occupational and Environmental Health, Safety and Prevention, 2nd ed.; John Wiley & Sons: Hoboken, NJ, USA, 2016; ISBN 978-1-118-64720-2. [Google Scholar]
- Fine, W.T. Occupational risk assessment: A semi-quantitative method. J. Saf. Res. 1971, 3, 157–166. [Google Scholar]
- National Institute for Safety and Health at Work (INSST, Spain). NTP 330: Sistema Simplificado de Evaluación de Riesgos de Accidente; Bestratén Belloví, M., ParejaMalagón, F., Eds.; National Center for Working Conditions: Madrid, Spain, 1993. (In Spanish) [Google Scholar]
- National Institute for Safety and Health at Work (INSST, Spain). NTP 101: Comunicación de Riesgos en la Empresa; Bestratén Belloví, M., Ed.; Instituto Nacional de Condiciones de Trabajo: Madrid, Spain, 1984. (In Spanish) [Google Scholar]
- Ministry of Labour, Solidarity and Social Security (Portugal). Boletim do Trabalho e Emprego, No. 37, 8 October 2023. Available online: https://bte.gep.msess.gov.pt/completos/2023/bte37_2023.pdf (accessed on 19 February 2025). (In Portuguese)
- Jadhav, R.; Achutan, C.; Haynatzki, G.; Rajaram, S.; Rautiainen, R. Review and meta-analysis of emerging risk factors for agricultural injury. J. Agromedicine 2016, 21, 284–297. [Google Scholar] [CrossRef] [PubMed]
- Eurostat. Accidents at Work—Statistics by Economic Activity. In Statistics Explained; Eurostat: Luxembourg, Luxembourg, 2024; Available online: https://ec.europa.eu/eurostat/statistics-explained/index.php?title=Accidents_at_work_-_statistics_by_economic_activity (accessed on 10 January 2025).
- Kinney, G.F.; Wiruth, A.D. Practical Risk Analysis for Safety Management; Technical Publication 5865; Naval Weapons Center: Ridgecrest, CA, USA, 1976. [Google Scholar]
- Ferreira, S.; Oliveira, F.; Silva, F.G.; Teixeira, M.; Gonçalves, M.; Eugénio, R.; Damásio, H.; Gonçalves, J.M. Assessment of factors constraining organic farming expansion in Lis Valley, Portugal. AgriEngineering 2020, 3, 111–127. [Google Scholar] [CrossRef]
- Gonçalves, J.M.; Ferreira, S.; Nunes, M.; Eugénio, R.; Damásio, H.; Ferreira, I. Water saving on a gravity-flow irrigation district: Challenges and issues on Lis Valley, Portugal. Sci. Eaux Territ. 2020, 34, 38–43. [Google Scholar]
- Gonçalves, J.M.; Ferreira, S.; Nunes, M.; Eugénio, R.; Amador, P.; Filipe, O.; Duarte, I.M.; Teixeira, M.; Vasconcelos, T.; Oliveira, F.; et al. Developing irrigation management at district scale based on water monitoring: Study on Lis Valley, Portugal. AgriEngineering 2020, 2, 78–95. [Google Scholar] [CrossRef]
- Ferreira, S.; Sánchez, J.M.; Gonçalves, J.M.; Eugénio, R.; Damásio, H. Monitoring Eichhornia crassipes and Myriophyllum aquaticum in irrigation systems using high-resolution satellite imagery: Impacts on water quality and management strategies. AgriEngineering 2025, 7, 151. [Google Scholar] [CrossRef]
- Santos, M.; Almeida, C.; Lopes, C.; Oliveira, T. Methodologies for risk assessment: William Fine. Rev. Port. Saúde Ocup. 2018, 6, 1–3. (In Portuguese) [Google Scholar] [CrossRef]
- Cabral, F. Occupational Health and Safety—Occupational Risk Prevention Manual; Verlag Dashofer: Lisboa, Portugal, 2012. (In Portuguese) [Google Scholar]
- Santos, M.; Almeida, C.; Lopes, C.; Oliveira, T. Methods for the evaluation of labor risks: Simplified method, MARAT (Methodology of Evaluation of Risks and Accidents at Work) or NTP 330. Rev. Port. Saúde Ocup. Online 2019, 6, s37–s39. (In Portuguese) [Google Scholar] [CrossRef]
- Moloudpourfard, B.; Pouyakian, M. Application of cost justification index of safety control measures in William Fine’s method in the Iranian studies: A systematic review. Int. J. Occup. Hyg. 2020, 2, 162–175. [Google Scholar]
- Fine, W.T. Mathematical Evaluation for Controlling Hazards; Naval Ordnance Laboratory: White Oak, MD, USA, 1971. [Google Scholar]
- Canivell, J. Characterization methodology to efficiently manage the conservation of historical rammed-earth buildings. In Proceedings of the First International Conference on Rammed Earth Conservation, Valencia, Spain, 21–23 June 2012. [Google Scholar]
- Gul, M. A review of occupational health and safety risk assessment approaches based on multi-criteria decision-making methods and their fuzzy versions. Hum. Ecol. Risk Assess. 2018, 24, 1723–1760. [Google Scholar] [CrossRef]
- Marhavilas, P.K.; Koulouriotis, D.E.; Gemeni, V. Risk analysis and assessment methodologies in the work sites: On a review, classification and comparative study of the scientific literature of the period 2000–2009. J. Loss Prev. Process Ind. 2011, 24, 477–523. [Google Scholar] [CrossRef]
- Ni, H.; Chen, A.; Chen, N. Some extensions on risk matrix approach. Saf. Sci. 2010, 48, 1269–1278. [Google Scholar] [CrossRef]
- Roxo, M. Safety and Health at Work: Risk Assessment and Control, 2nd ed.; Almedina: Coimbra, Portugal, 2006. (In Portuguese) [Google Scholar]
- Gul, M.; Ak, M.F.; Celik, E. A fuzzy Fine–Kinney risk assessment method: An application in a steel industry. Hum. Ecol. Risk Assess. 2017, 23, 1879–1896. [Google Scholar]
- Dogan, I.; Ozkan, B.; Karasan, A. A hybrid fuzzy Fine–Kinney and AHP/TOPSIS methodology for occupational risk assessment. Environ. Sci. Pollut. Res. 2022, 29, 72693–72706. [Google Scholar] [CrossRef]
- Food and Agriculture Organization of the United Nations (FAO); WHO. Semi quantitative risk characterization. In Chapter 4 of Risk Characterization of Microbiological Hazards in Food; FAO: Rome, Italy; WHO: Rome, Italy, 2009; Available online: https://www.fao.org/4/i1134e/i1134e04.pdf (accessed on 20 February 2025).
- Price, J. Simplified risk assessment. Eng. Manag. J. 2015, 10, 19–24. [Google Scholar] [CrossRef]
- Fathifazl, G.; Lounis, Z.; Cai, Z. Semi-quantitative classification of consequences of failure for seismic risk management of existing buildings. Struct. Infrastruct. Eng. 2020, 17, 664–675. [Google Scholar] [CrossRef]
- Chiasson, M.-È.; Imbeau, D.; Aubry, K.; Delisle, A. Comparing the results of eight methods used to evaluate risk factors associated with musculoskeletal disorders. Int. J. Ind. Ergon. 2012, 42, 478–488. [Google Scholar] [CrossRef]
- Carpio-de Los Pinos, A.J.; González-García, M.L.N. Development of the protocol of the occupational risk assessment method for construction works: Level of preventive action. Int. J. Environ. Res. Public Health 2020, 17, 6369. [Google Scholar] [CrossRef] [PubMed]
- Zhasmukhambetova, A.; Evdorides, H.; Davies, R.J. Integrating risk assessment and scheduling in highway construction: A systematic review of techniques, challenges, and hybrid methodologies. Future Transp. 2025, 5, 85. [Google Scholar] [CrossRef]
- Nalmpant-Sarikaki, D.M.; Theocharis, A.I.; Koukouzas, N.C.; Zevgolis, I.E. A Comparative Analysis of Semi-Quantitative Multi-Hazard Methodologies with an Application to a Post-Mining Area. Nat. Hazards 2025, 121, 12327–12352. [Google Scholar] [CrossRef]
- Noronha, A.R.; Costa, S.L.; Ferreira, A.S.; Faria, B.M.; Silva, M.V.; Rodrigues, M.A. Semi-Quantitative Methods for Assessing the Risk of Occupational Accidents: A Literature Review. In Occupational and Environmental Safety and Health IV; Arezes, P.M., Ferreira, A.S., Eds.; Studies in Systems, Decision and Control; Springer: Cham, Switzerland, 2023; Volume 449, pp. 1–12. [Google Scholar] [CrossRef]
- Madanchian, M.; Taherdoost, H. A comprehensive guide to the TOPSIS method for multi-criteria decision making. Sustain. Soc. Dev. 2023, 1, 2220. [Google Scholar] [CrossRef]


Disclaimer/Publisher’s Note: The statements, opinions and data contained in all publications are solely those of the individual author(s) and contributor(s) and not of MDPI and/or the editor(s). MDPI and/or the editor(s) disclaim responsibility for any injury to people or property resulting from any ideas, methods, instructions or products referred to in the content. |
© 2026 by the authors. Licensee MDPI, Basel, Switzerland. This article is an open access article distributed under the terms and conditions of the Creative Commons Attribution (CC BY) license.