Article

Towards Sustainable Historic Waterfront Streets: Integrating Semantic Segmentation and sDNA for Visual Perception Evaluation and Optimization in Liaocheng City, China

1
School of Architecture and Urban Planning, Shandong Jianzhu University, Jinan 250101, China
2
Shandong Wanfang Architectural Engineering Design Co., Ltd., Jinan 250101, China
*
Author to whom correspondence should be addressed.
Sustainability 2026, 18(2), 1099; https://doi.org/10.3390/su18021099
Submission received: 24 November 2025 / Revised: 29 December 2025 / Accepted: 30 December 2025 / Published: 21 January 2026
(This article belongs to the Special Issue Socially Sustainable Urban and Architectural Design)

Abstract

Historic waterfront streets are not only an important component of urban public spaces but also highlight the distinctive features and historical contexts of the city. High-quality streetscape visual perception plays a crucial role in advancing the cultural, social, environmental, and economic sustainability of the urban street space. This study was initiated to construct a multi-dimension and multi-scale comprehensive evaluation framework to assess the visual quality of waterfront streets, taking “Water City” Liaocheng as a typical case. Technical methods of semantic segmentation, sDNA (Spatial Design Network Analysis), GIS (Geographic Information System), and statistical analysis were utilized. Following the extraction and classification of street space elements, a multi-dimensional evaluation index system of natural coordination, artificial comfort, and historical culture for the visual assessment was established. Space syntax was performed on waterfront streets by sDNA to quantify macro-level scale spatial structure and meso-level scale pedestrian accessibility. The results of micro-scale visual perception, meso-scale behavioral walkability, and macro-scale spatial structure, were integrated to construct a multi-scale diagnostic framework for eight classifications. This framework provides a scientific basis to put forwards the refined and sustainable optimization strategies for historic waterfront streets.

1. Introduction

Streets serve as important space for several daily activities for both tourists and residents, such as commuting, socializing, and leisure [1]. They constitute key settings where people perceive and interact with the urban environment. In particular, people can experience natural, ecological, historical, and cultural elements in waterfront streets [2]. Numerous cases demonstrate that enhancing the environmental quality of urban waterfront streets has successfully attracted residents and tourists. For instance, the enhancement of the Cheonggyecheon Stream in South Korea [3] and the San Antonio Riverwalk in the United States [4] has reshaped riverside public spaces, revitalized urban vitality, and achieved sustainable development of urban spaces.
However, during the rapid urbanization process in China over the past four decades, many towns that originally developed in close interaction with water systems have experienced extensive loss of waterfront landscapes. Policy documents such as China’s “Guidelines on Strengthening Urban Infrastructure Construction” have put forward specific requirements for the protection and sustainable development of urban water systems [5]. Improving waterfront streets’ quality can contribute to ecological, cultural, and social sustainability of urban spatial environments [6].
According to the perspective of scholars such as Matthew Carmona, street space planning is undergoing a transformation from efficiency enhancement to place-making [7]. Streets are not merely spaces for movement and passage; the visual interactions along their interfaces are equally important [7]. However, current research tends to focus more on the perceptual evaluation of street space itself, often without situating it within the overall street network context, thereby lacking a comprehensive spatial-structural analytical perspective. Space syntax provides a detailed analysis of the spatial structure network, particularly revealing aspects of social structure [8]. Some studies regard the accessibility measured by space syntax as physical accessibility [9], primarily referring to spatial reachability at the material level. This study proposes that the corresponding concept is psychologically-perceived accessibility generated through visual perception. Therefore, integrating visual perception measurement with spatial accessibility analysis will address both place and movement dimensions, while simultaneously incorporating physical and psychological aspects of accessibility.
In summary, this study seeks to address the following research objectives:
  • To develop a unified evaluation system for the visual perception of historic waterfront streets;
  • To construct an integrated multi-scale diagnostic model integrating multiple scales, employing space syntax analysis for structural evaluation and visual perception assessment to conduct overlay analysis and problem diagnosis;
  • To establish a pathway from evaluation to strategic intervention by developing a strategy-oriented framework and proposing targeted revitalization priorities based on the overlay analysis results.

2. Literature Review

2.1. Visual Perception Evaluation

Environmental perception, which encompasses visual, auditory, and tactile dimensions, plays a crucial role in the sustainable development of urban spaces, with visual perception being the dominant factor [6]. Research progress on street visual perception can be described from two aspects: data sources and analytical methods. Regarding data sources, early studies primarily relied on photographs for data collection. The development of big data further introduced novel data types like crowdsourced data [10] and street view imagery, which overcome the limitations of traditional manual photography—high cost and time-intensiveness [11]. Especially since GSV (Google Street View) emerged in 2007, it was applied to the research of visual perception around 2010 [11]. Early studies often focused on comparing the validity of manually captured data and GSV data [11,12,13], while subsequent empirical research has demonstrated the reliability and effectiveness of the GSV [12,14]. Based on the existing research, street view data remain one of the most effective sources for visual perception studies of street spaces [15]. In terms of analytical methods for streetscape perception, early research largely depended on traditional approaches such as manual observation and counting. While effective to some extent, these methods are evidently inadequate for processing and analyzing large-scale datasets [16]. Artificial intelligence technologies, particularly machine learning, have proven highly valuable for image processing and element analysis in visual streetscape assessment [17,18]. Deep learning techniques, in particular, when combined with street view imagery, enable automatic identification and classification of streetscape elements [19]. Due to their significant improvements in accuracy and efficiency for image analysis, deep learning has become a widely adopted technical approach in visual streetscape perception research.
In the field of visual perception evaluation, existing studies have confirmed that quantifiable indicators of visual elements based on street view imagery can be used to assess subjective visual perception and are directly linked to visual psychology [20,21,22]. As early as 1989, the concept of the GVI (Green View Index) was introduced [23]. Sergio Porta et al. pioneered the use of quantitative visual indicators, such as sky exposure, facade continuity, and visual complexity to evaluate visual perception of street spaces [16]. Various specialized dimensions have emerged, including perceived safety [24], street greenery [25,26,27], restorative potential [28], color perception [29], and walkability [21], contributing to a more comprehensive research framework. Among street spatial elements, greenery has been a central focus of research [30], and its quantitative assessment is relatively well-developed, with key metrics such as the GVI, enclosure, and openness [31]. However, few studies have conducted detailed analyses of aquatic elements in streetscapes. Moreover, existing research tends to focus on common street elements, with relatively limited attention to perceptual evaluation of historical and cultural elements such as cultural symbols and historical buildings.

2.2. Space Syntax Measurement

Space syntax, which reveals the topological structure and compositional relationships of urban spatial networks, has garnered significant attention in urban planning and architectural design since its introduction by Hillier and Hanson in 1984 [9,32]. This method not only provides technical support for the quantitative measurement of street network structures but also illustrates spatial configurations through graphical representations [9], thereby expressing the relationship between human behavior, movement, and sightlines [33]. Researchers have implemented this approach in urban cases worldwide, accumulating substantial empirical evidence for its practical application. Notably, space syntax has been extensively employed in studies of historic districts, particularly in uncovering historical spatial structures through analyses of street network configurations [34]. Over the past three years, space syntax continues to be widely utilized in urban studies, demonstrating its effectiveness and potential in the conservation and regeneration of historic districts [35]. Despite the abundance of research on space syntax, relatively few studies have integrated it with GIS for further spatial analysis [36]. The sDNA tool addresses this gap by enabling seamless integration with GIS, facilitating advanced data computation and visualization.

2.3. Integrating Assessment with Visual Perception and Space Syntax

Although a limited number of studies have demonstrated the applicability and effectiveness of integrating visual perception assessment with street network structure analysis, such integrated approaches remain relatively underexplored. In 2022, Lei Wang et al. pioneered the incorporation of space syntax into streetscape visual perception evaluation [37]. By combining deep learning with space syntax, they established a linkage between visual perception and street accessibility, thereby achieving a fine-grained spatial perception assessment [37]. Subsequently, in 2024, Yunfei Wu et al. proposed an analytical framework integrating deep learning, and space syntax, and conducted an empirical study on restorative perception [28]. In recent years, a small number of scholars have continued this line of inquiry with further empirical explorations [38,39,40], though most remain within the established research framework. The current study has several limitations. (1) Current research has only explored the walking scale domain (e.g., 500 m), as its local accessibility corresponds to the perception of street space in terms of walkability [37,38,41]. However, the waterfront streets in Liaocheng serve not only local communities but also function at the city-wide level. Therefore, this study aims to construct a multi-scale diagnostic framework for evaluating street space quality across three levels. (2) Current research often identifies streets with high renovation potential, but seldom lead directly to optimization strategies. (3) There is a lack of in-depth analysis regarding the correlation between space syntax indices and visual perception metrics. Such correlational analyses can help elucidate the underlying mechanisms connecting visual perception, street structure, and human behavior.

3. Study Area and Methods

3.1. Study Area

3.1.1. General Situation

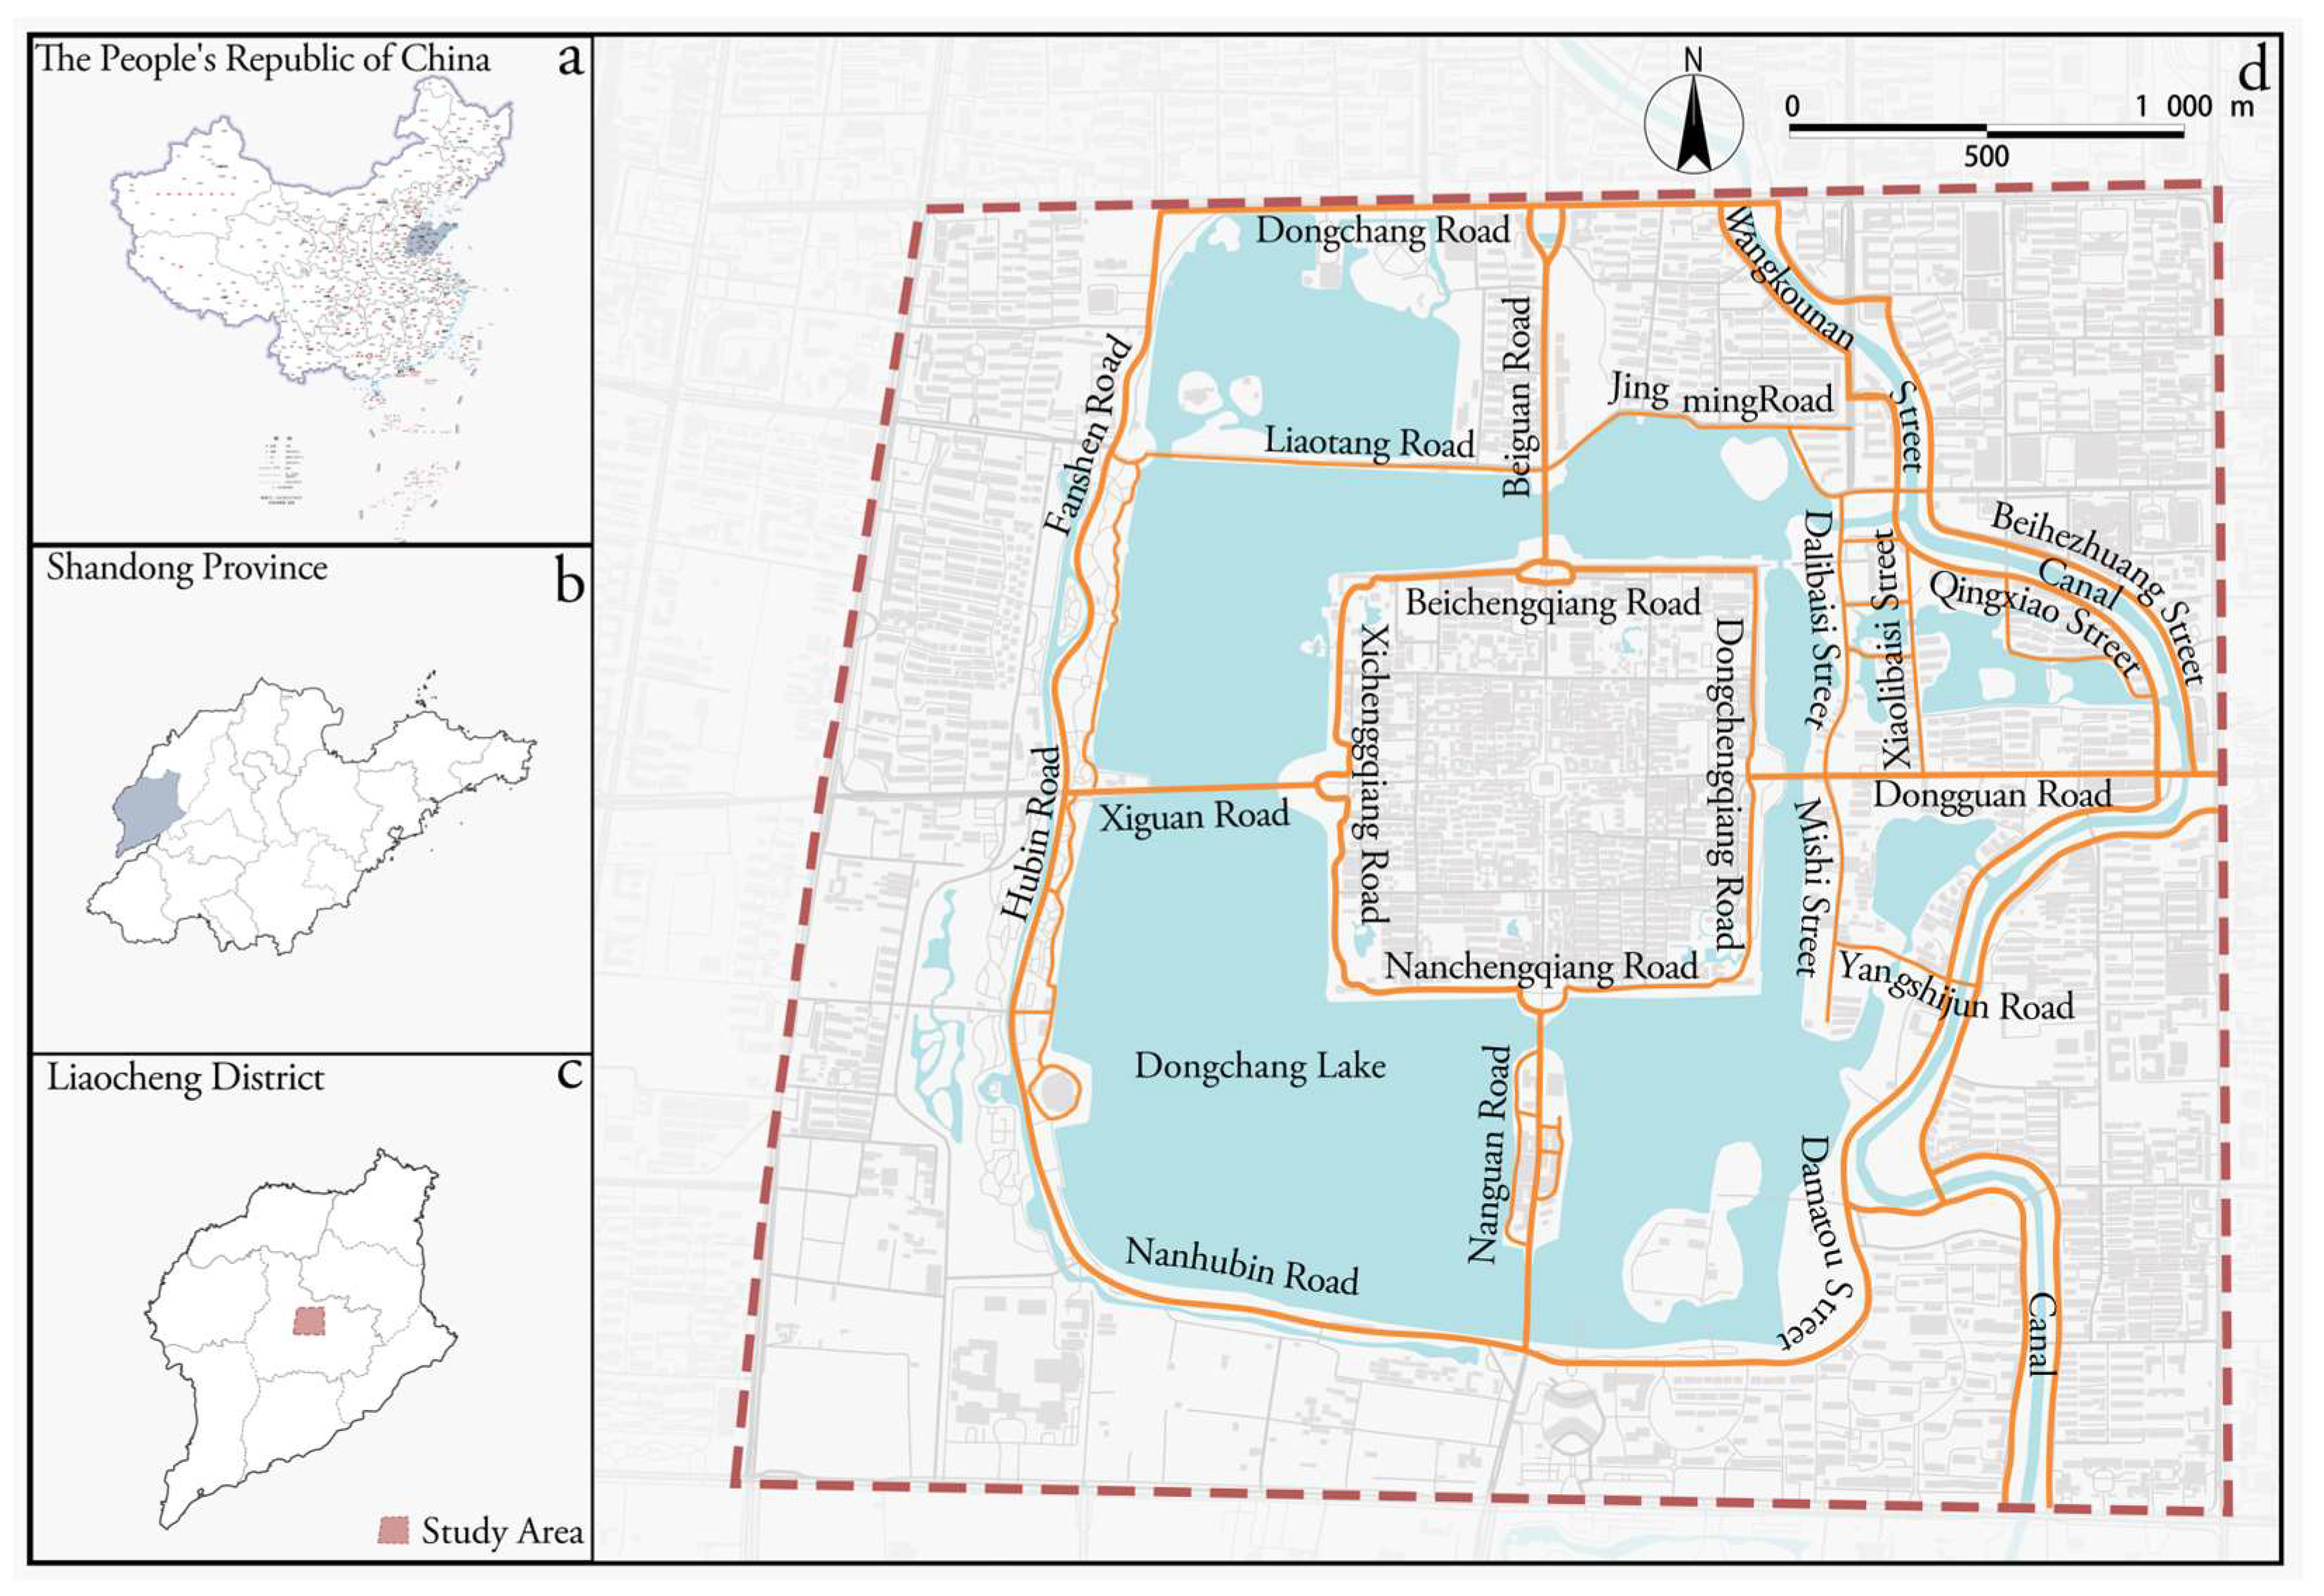
Located in western Shandong Province, Liaocheng is one of the major cities in the lower reaches of the Yellow River and an important urban center along the Grand Canal (Figure 1). The city currently covers an area of approximately 8628 square kilometers with a population of 5.8 million [42]. Renowned as the Water City and the Ancient Capital of the Grand Canal, Liaocheng exhibits pronounced urban-water interdependence resulting from its unique geographical setting within the Yellow River floodplain and its historical role as a canal city [43]. Consequently, water has consistently played a critical role throughout Liaocheng’s urban construction, redevelopment, and renewal processes. The city contains the largest urban lake in northern China [42], while several districts directly border the canal, making water a defining element in its modern urban development and character formation.
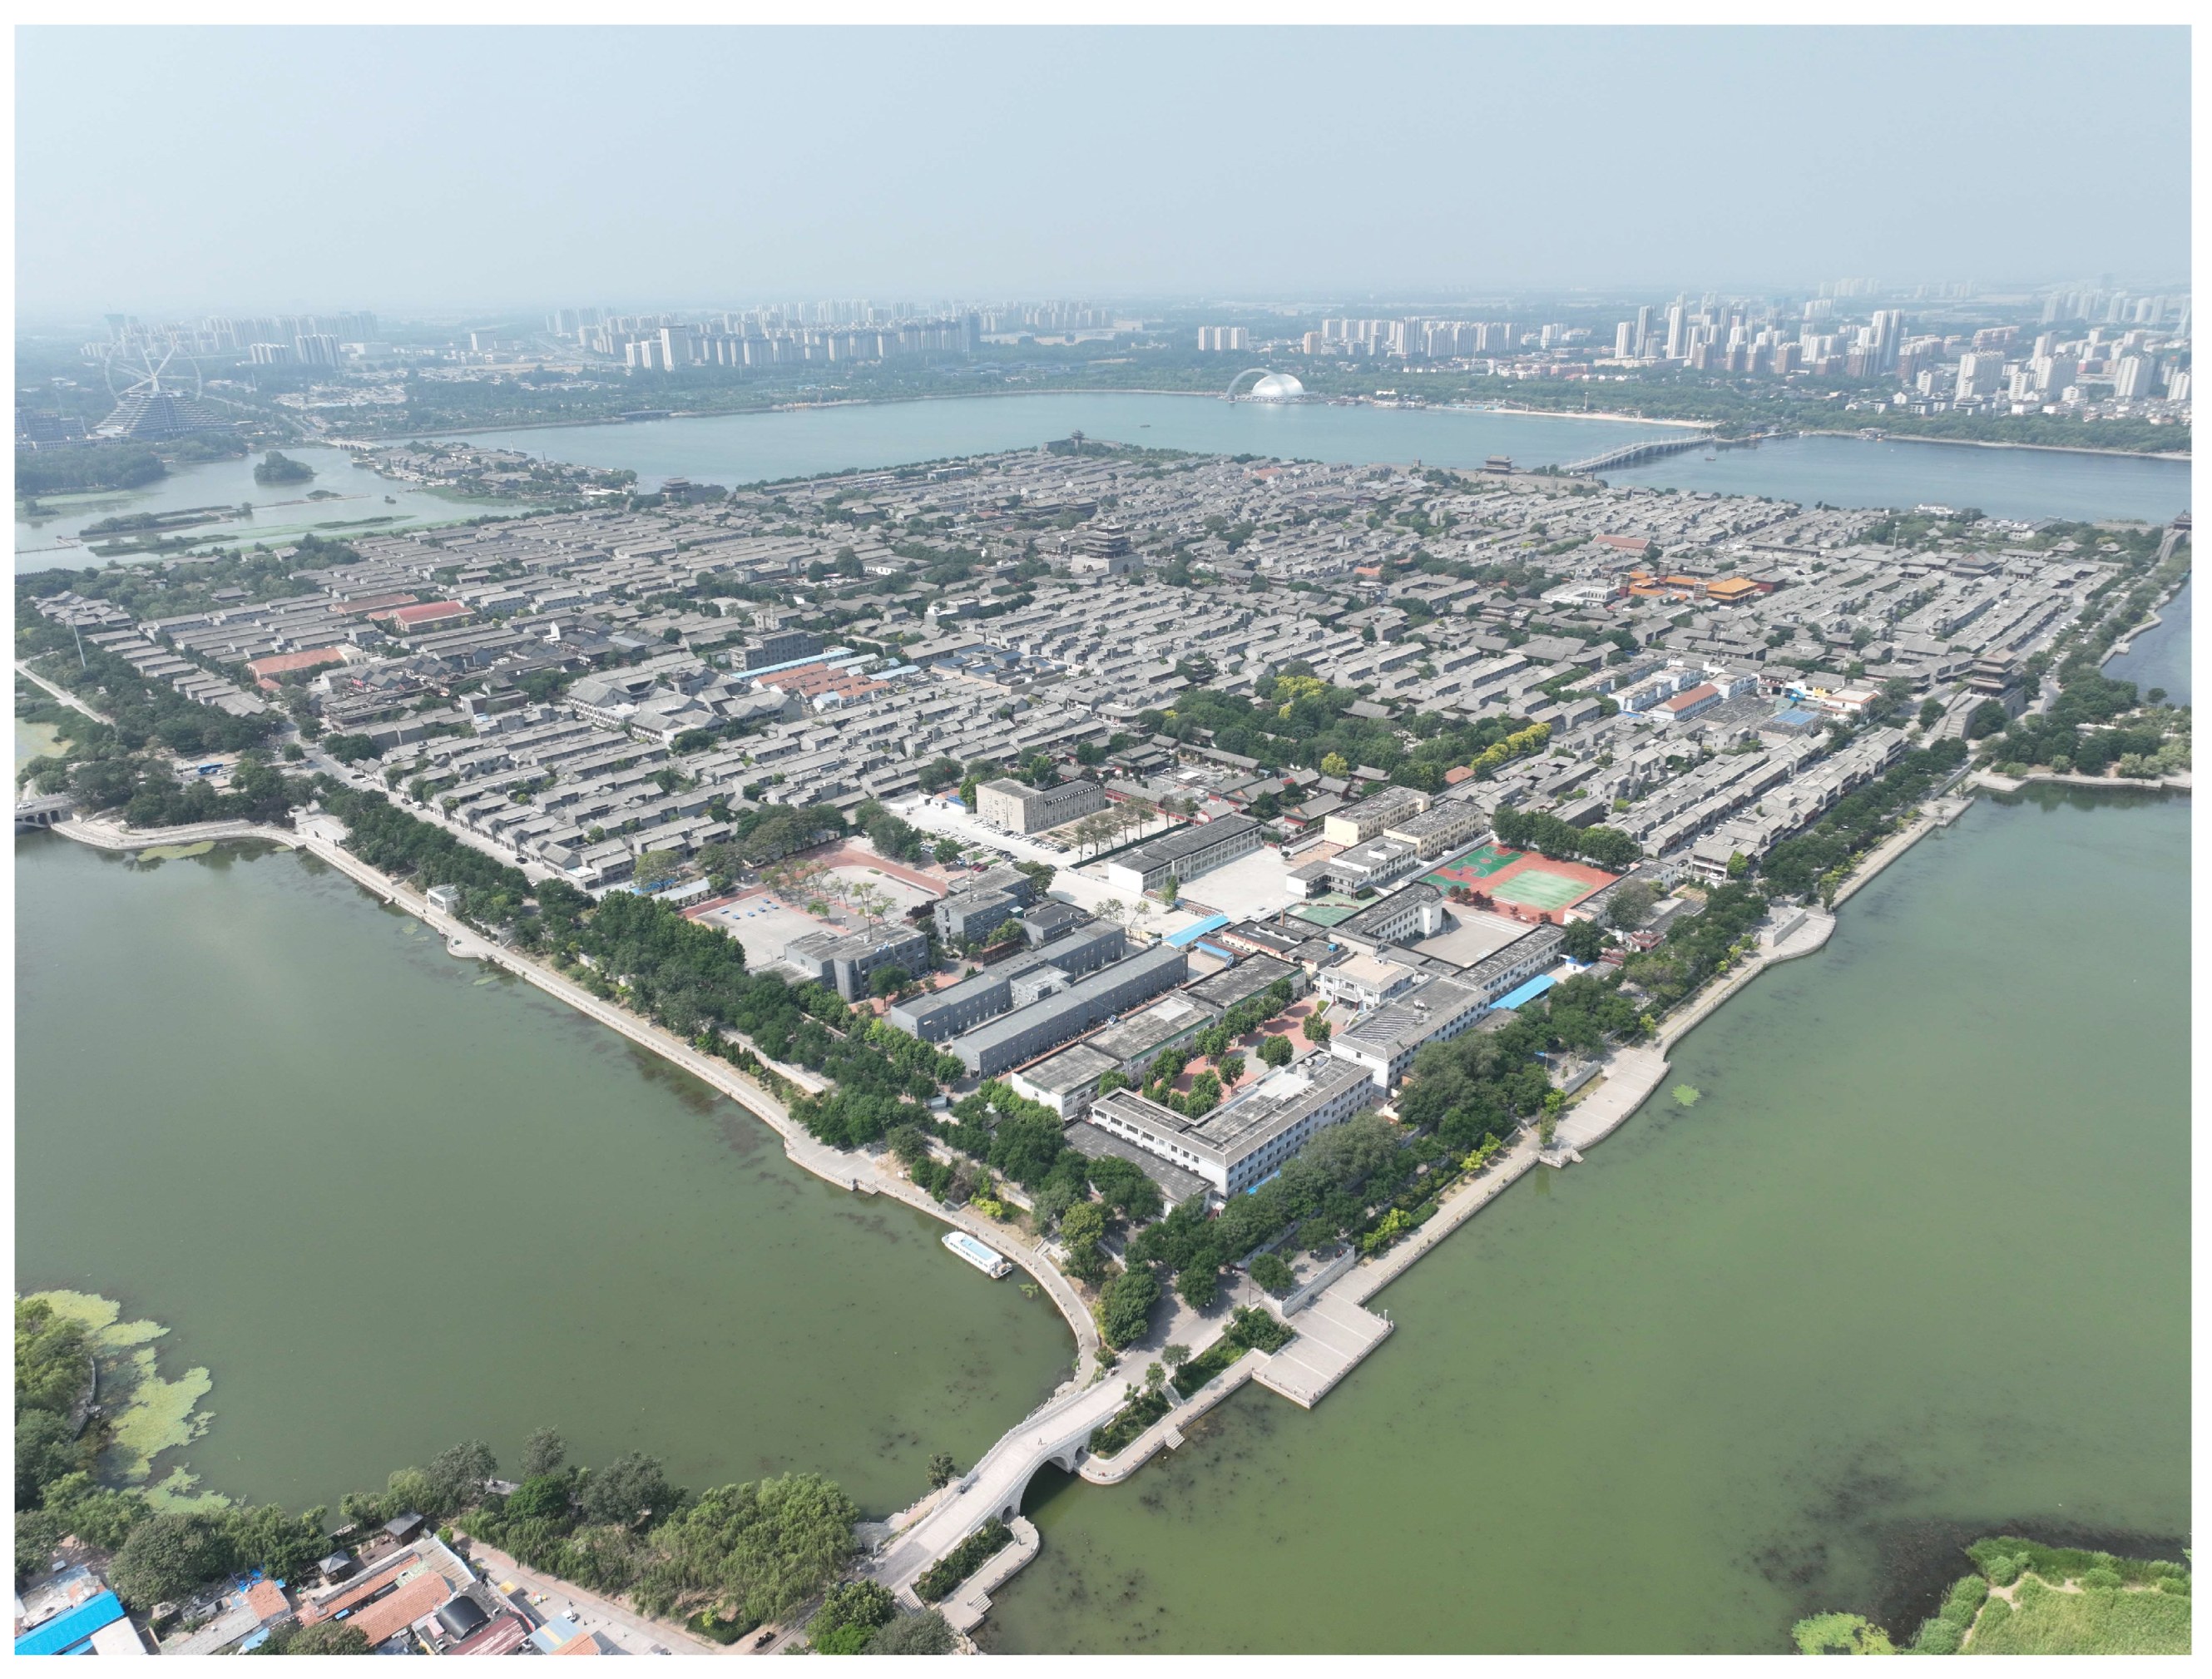
Liaocheng is a nationally designated historic and cultural city, boasting a profound historical and cultural heritage dating back 2500 years [42] (Figure 2). For this study, we selected a historic district with the closest association to the water system and a rich historical and cultural heritage as our research subject, covering an approximate area of 11.28 km2 (Figure 1). Following a systematic screening process, 22 waterfront streets within the study area were identified as key subjects for analysis. Some of these streets border Dongchang Lake, while others are adjacent to the Canal (Figure 1).

3.1.2. Data Sources and Processing

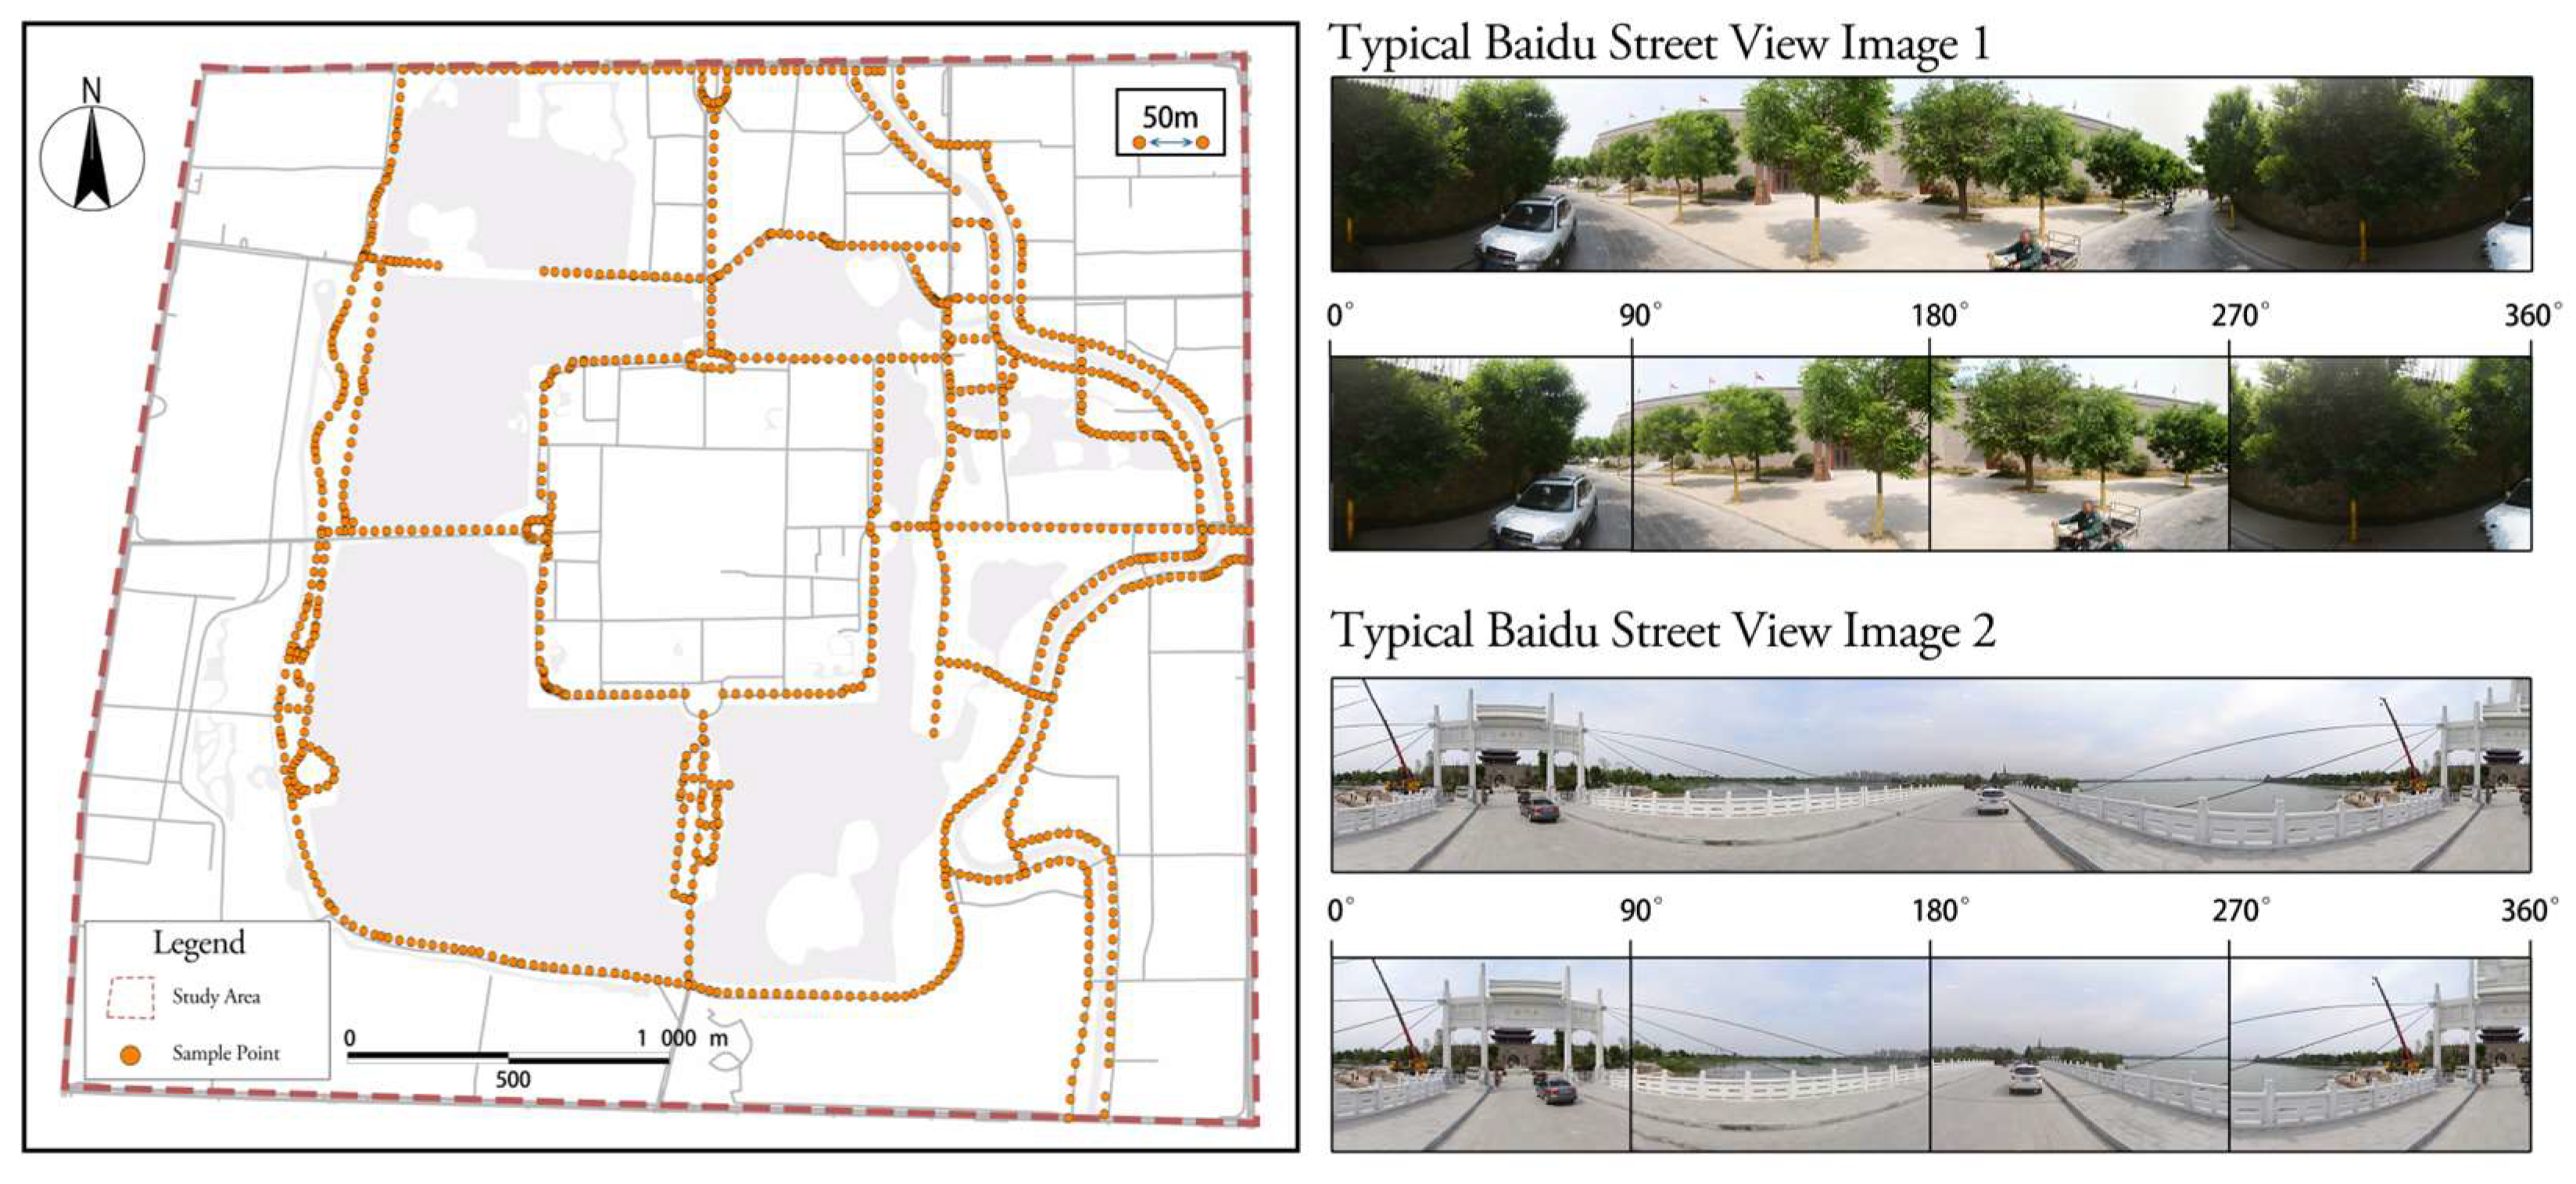
The vector street map of Liaocheng was acquired from Open Street Map (OSM). The data were filtered according to the defined scope and boundaries of the study area, resulting in the identification of 22 target streets. Sampling points for street view imagery were systematically established along each waterfront street at 50-m intervals via GIS, resulting in a total of 1208 sampling points. This interval was adopted based on existing studies demonstrating its effectiveness as a sampling standard for streetscape analysis [44] (Figure 3).
Baidu Maps, as one of China’s leading online map providers, offers researchers readily accessible street view imagery that closely approximates the human eye-level perspective [45]. Corresponding to the aforementioned 1208 sampling points, geographic coordinates (longitude and latitude) were used to retrieve approximately 4832 BSV (Baidu Street View) images. These images were captured from four cardinal directions (0°, 90°, 180°, and 270°). Subsequently, the four images from each sampling point were stitched together to form a composite image for integrated analysis. A sample of the collected street view data is presented below (Figure 3).

3.2. Research Method

3.2.1. Semantic Segmentation

Semantic segmentation enables the identification, classification, and quantification of elements within street view imagery. Owing to its efficiency and relative accuracy, this technique has been widely adopted in streetscape visual perception research [45]. The emergence of models such as FCN (Fully Convolutional Network) [46], U-Net [47], SegNet [38,48], PSPNet [14,45], and DeeplabV3+ [21] has provided essential technical support for visual perception studies. Meanwhile, datasets including Place Pulse [20] and ADE20k [38] have offered structured categorical foundations for the identification of streetscape elements.
This study adopts a widely validated FCN-based semantic segmentation tool developed and tested by Yao et al. (2019), which is trained on the ADE20K dataset, to identify and classify elements in street-view images [49]. The model adopts the FCN-8s network architecture, which achieves a favorable balance between computational efficiency and semantic recognition capability, making it suitable for large-scale batch processing and analysis of street-view images. This approach has been widely applied and validated in previous studies [50]. The ADE20K dataset contains more than 150 fine-grained semantic categories, covering a wide range of urban scene elements such as buildings, roads, vegetation, water bodies, and culturally related features. It therefore provides an appropriate foundation for conducting fine-grained visual perception analysis of waterfront street spaces in this study.

3.2.2. Indicator System

Based on a literature review of existing quantitative indicators for street landscapes and the unique characteristics of the study area, this study aims to construct a three-dimensional analytical framework comprising 15 indicators [50] (Table 1). Analysis of prior studies reveals that commonly used indicators are generally categorized into natural and artificial dimensions, with limited attention given to the historically and culturally significant elements as a separate dimension. Building upon this foundation, this study incorporates the dimension of historical and cultural elements. Within the natural dimension, evaluation indicators specifically addressing water system elements remain relatively underdeveloped.

3.2.3. Analytic Hierarchy Process

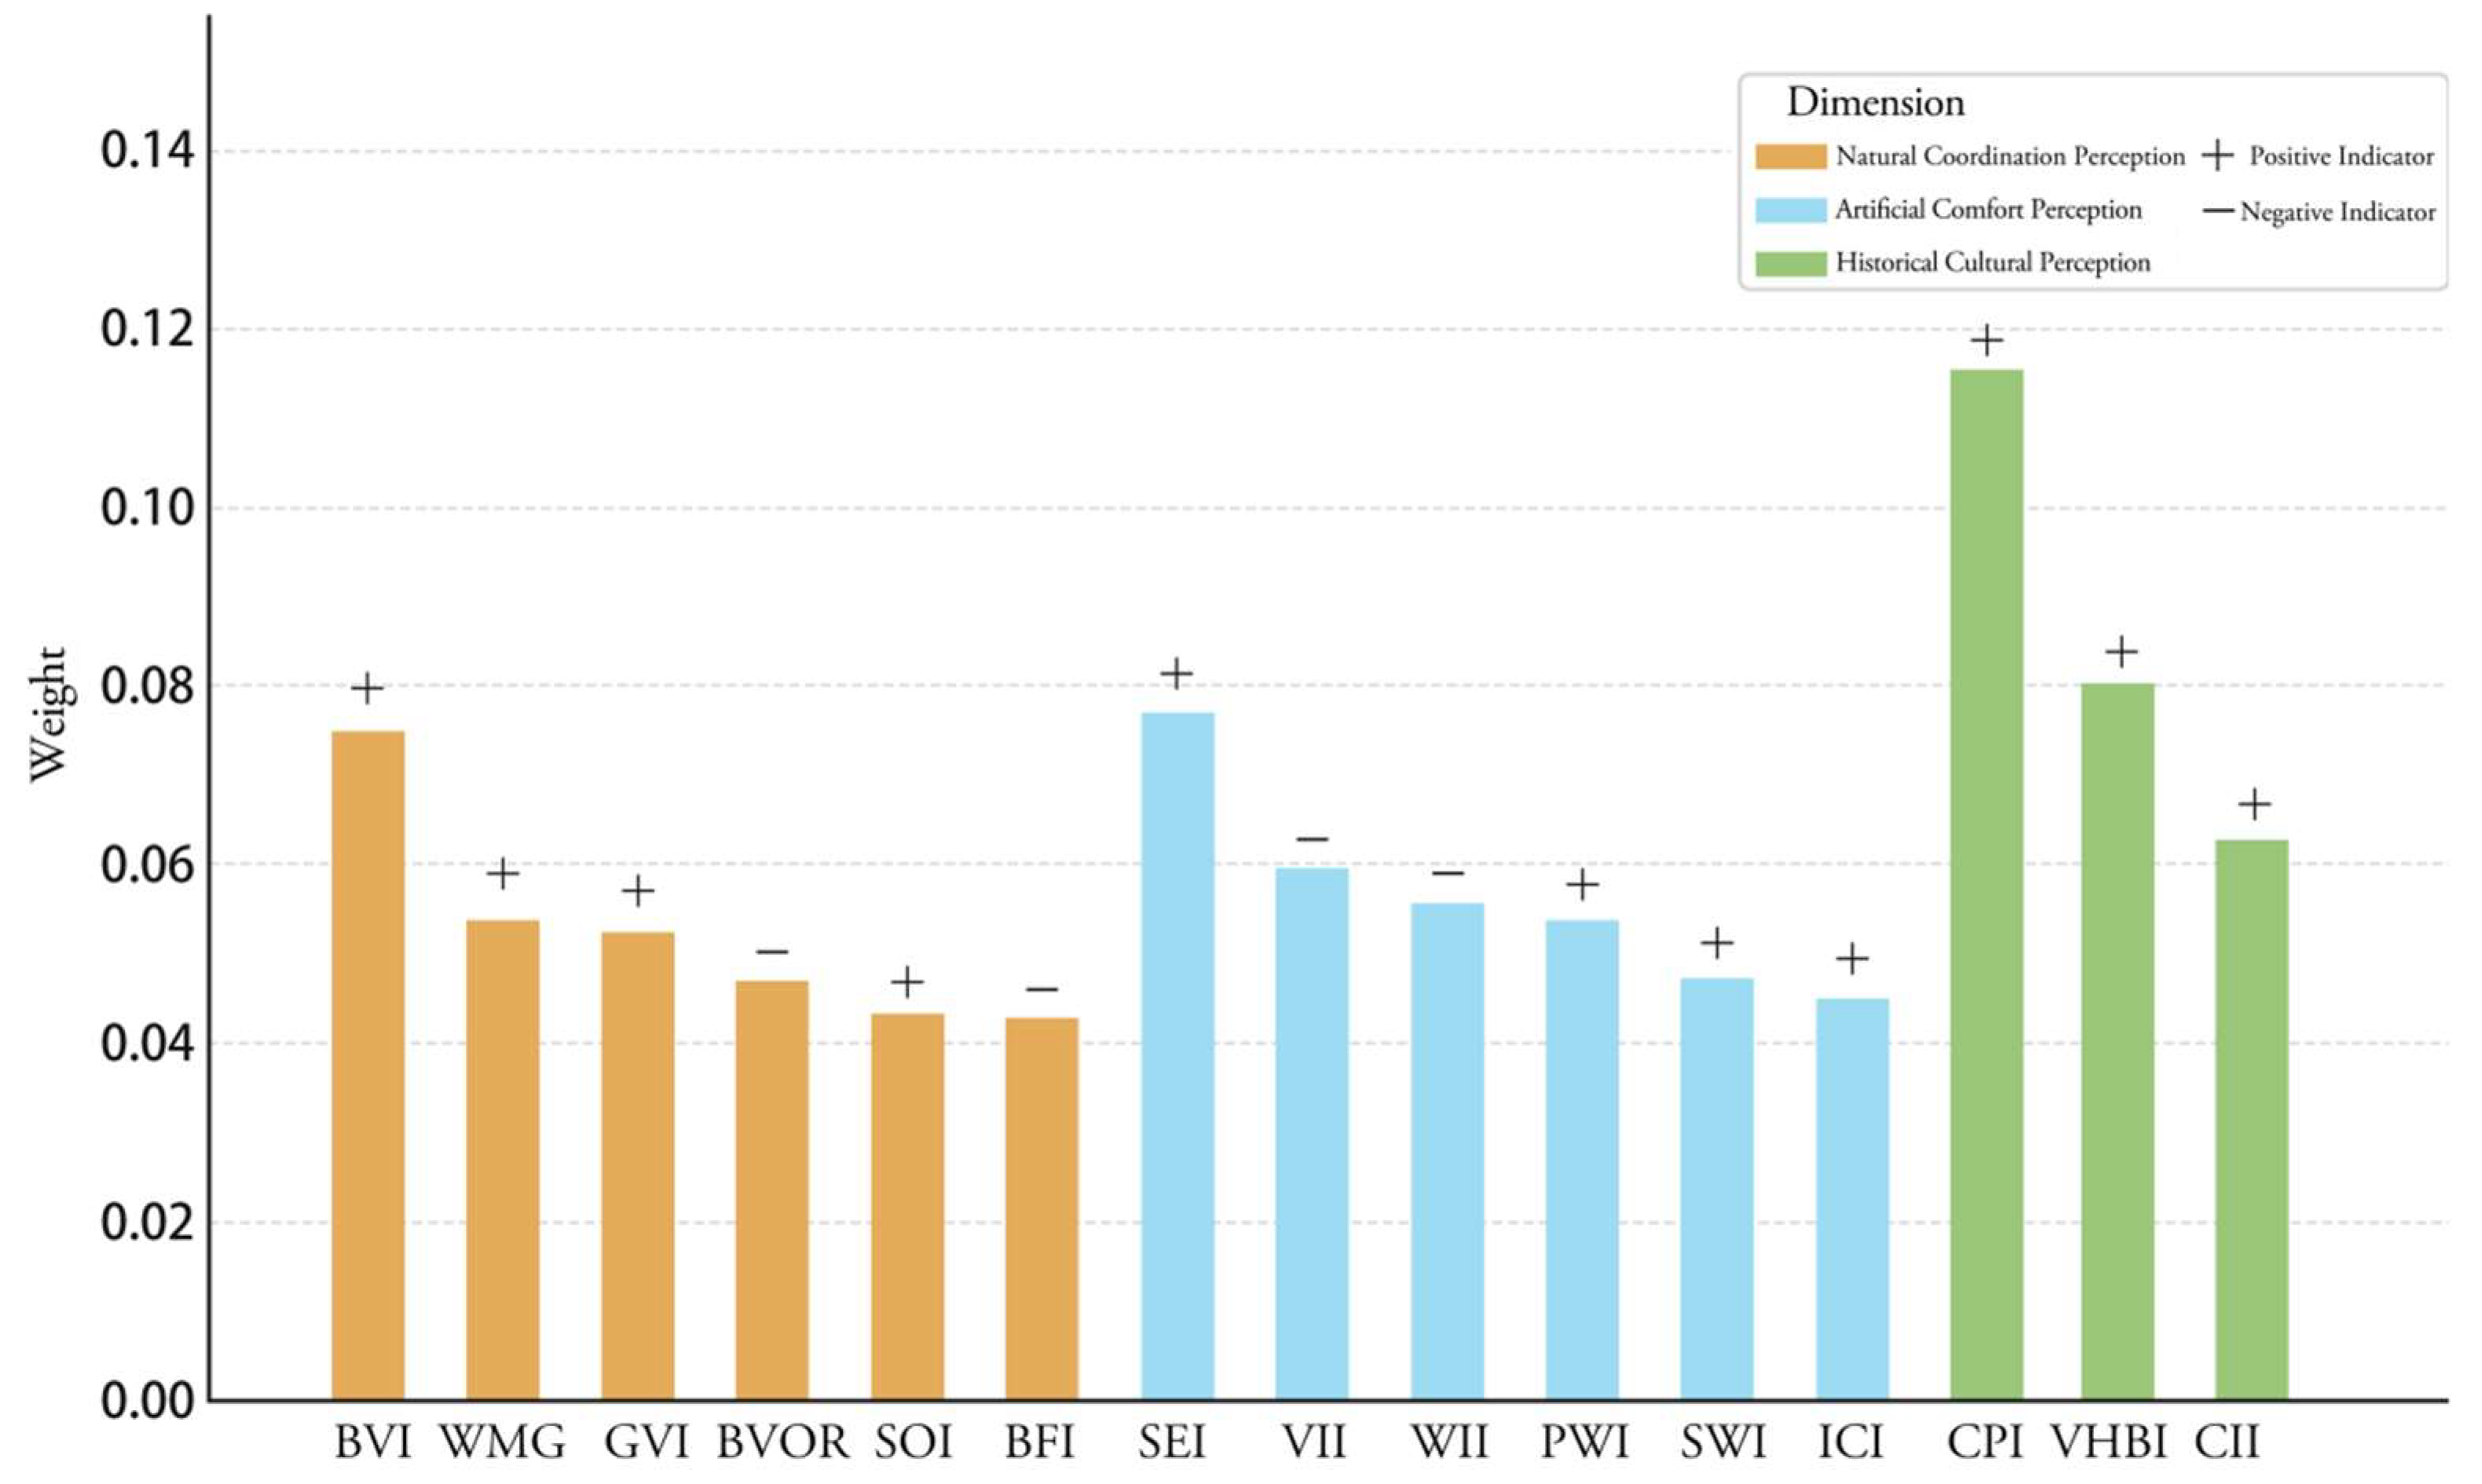
For determining indicator weightings and conducting evaluations, this study adopted the Analytic Hierarchy Process (AHP), referencing established research methodologies [54,59]. AHP is a structured technique for organizing and analyzing complex decisions by constructing a hierarchical model of the decision elements, and is widely used to assess the relative importance of various indicators [60,61]. Specifically, 35 experts in the field were invited to perform pairwise comparisons and assign importance scores to elements across the hierarchical levels, forming the basis for the analytical measurements. The model comprised three levels: the objective layer (evaluation of visual perception for the waterfront streets in Liaocheng’s historic district), the criterion layer (3 dimensions), and the sub-criterion layer (15 indicators). A 1–9 scale was employed for the pairwise comparisons, and judgment matrices were constructed to derive the final weightings for each indicator at the sub-criterion layer. The AHP calculations yielded the final weightings (Figure 4). Overall, the weightings of the three dimensions were relatively close. Historical cultural perception received the highest weighting (0.343), followed by artificial comfort perception (0.341), while natural coordination perception was slightly lower (0.316). This suggests that the experts generally considered historical and cultural elements to have the most significant impact on the perceptual experience within the waterfront street spaces of Liaocheng’s historic district.
Within the natural coordination dimension, the Blue View Index (BVI, 0.0752) and Waterfront Maintenance Grade (WMG, 0.0541) received relatively high weights. Regarding artificial comfort, Street Enclosure Index (SEI, 0.0771) and Vehicle Interference Index (VII, 0.0601) were assigned the highest weights. In the historical cultural dimension, the Cultural Place Index (CPI, 0.1158) emerged as the most weighted indicators.

3.2.4. Spatial Design Network Analysis

This study employs sDNA to evaluate street network structure and analyze spatial accessibility. A segment model was adopted, with NQPDA value serving as the primary indicator. Existing literature has predominantly adopted a 500-m radius to define walkable areas in segment-based analyses [28,37,38,40,41,62], aligning with pedestrian-oriented research objectives. However, other indicators such as overall NQPDA [63] also effectively capture spatial network relationships. Our study incorporates overall NQPDA alongside local measures, establishing a multi-scalar analytical framework. The compatibility between sDNA and GIS facilitates enhanced statistical and visual analysis, enabling effective spatial representation of the results.

3.3. Research Framework

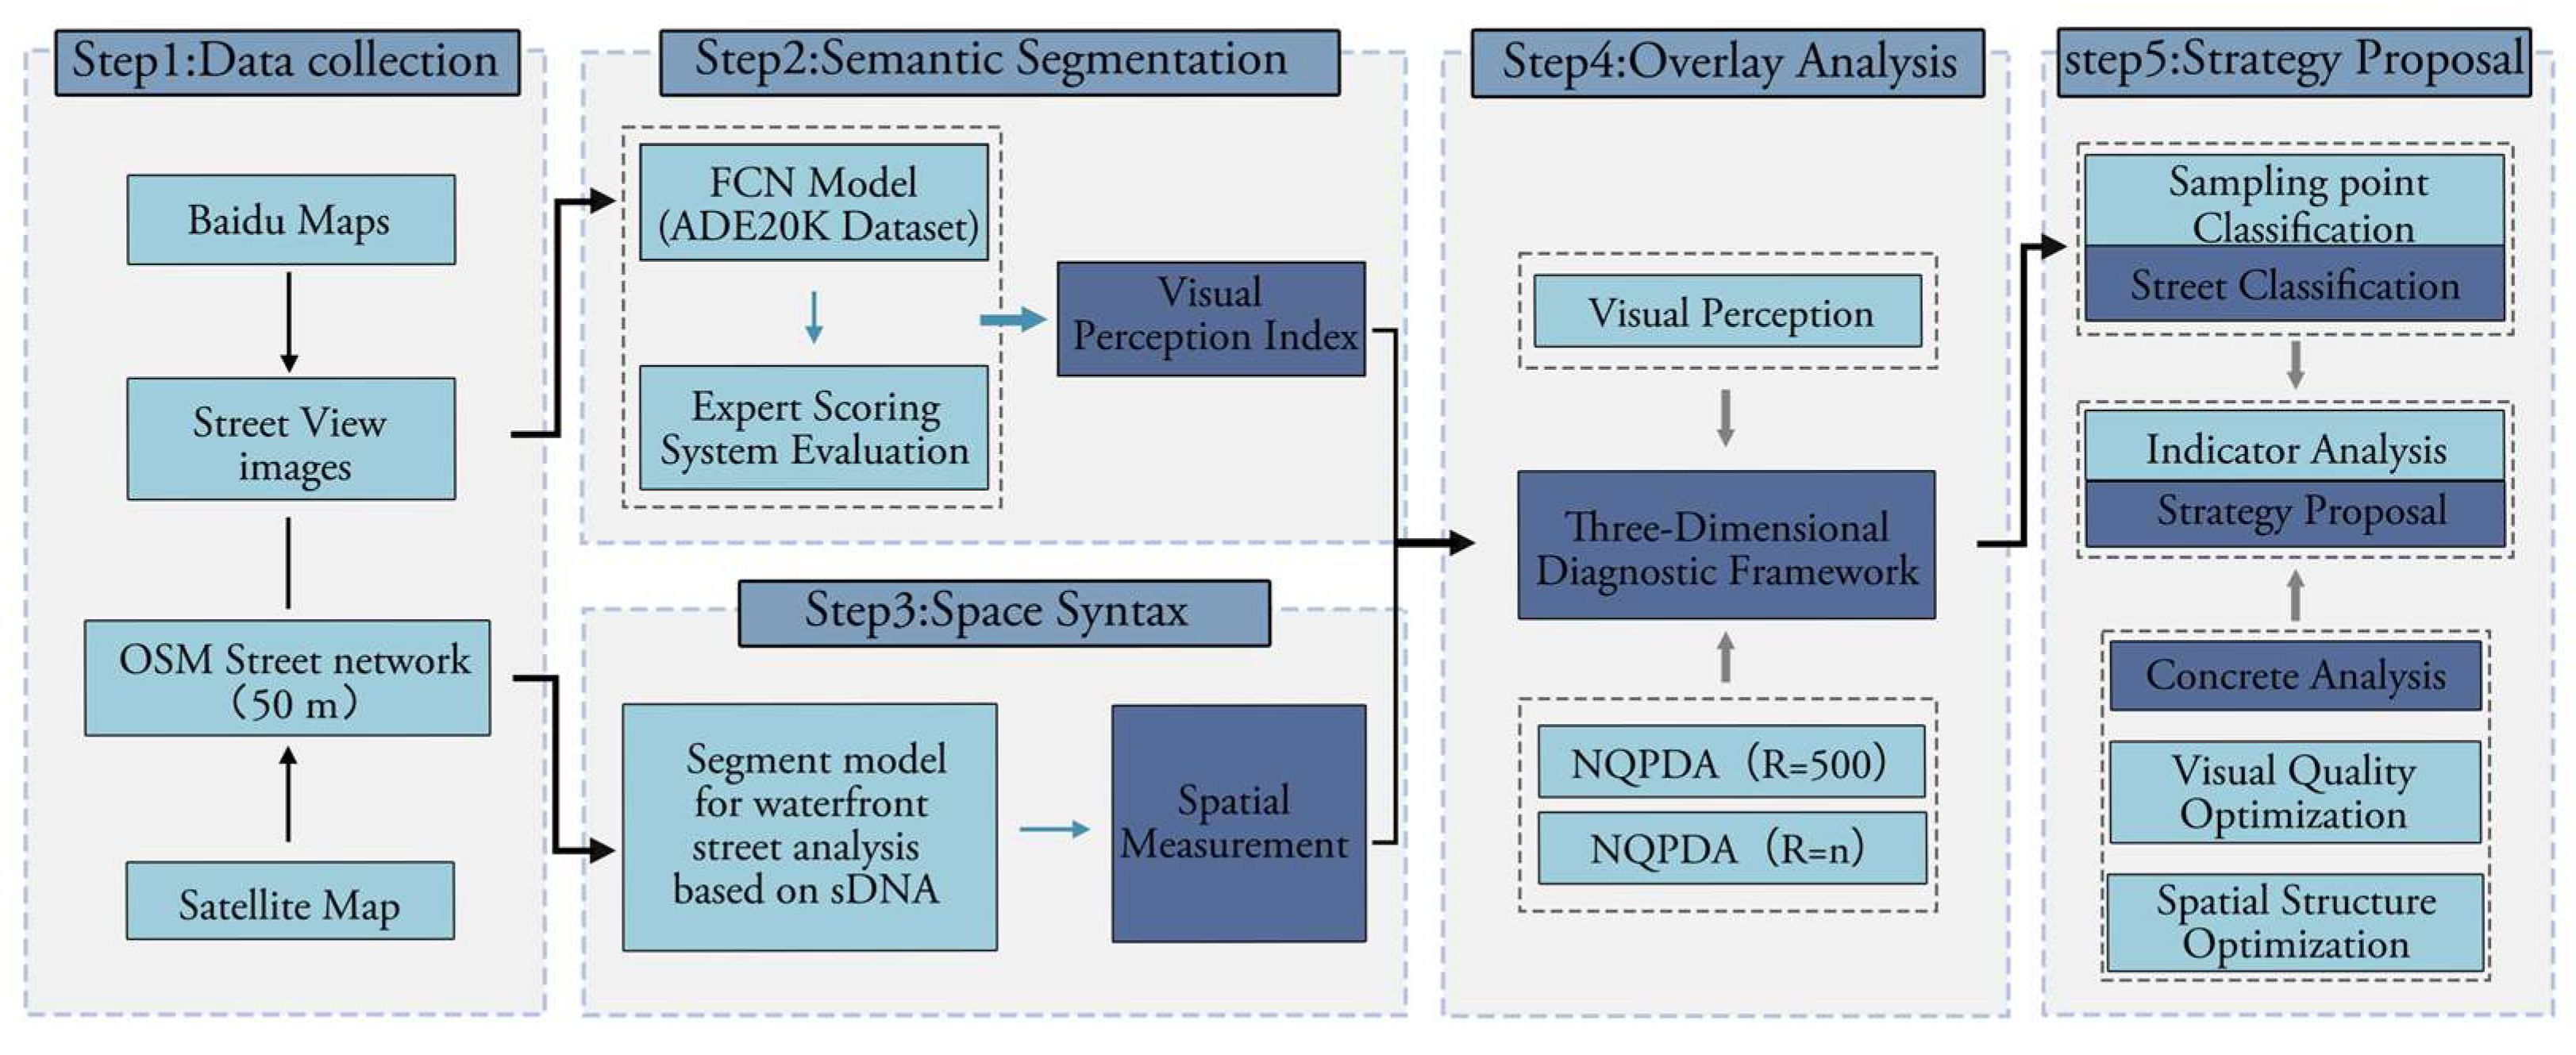
The framework of this study comprises five main components (Figure 5). The first component involves the collection and processing of fundamental data, including road network data and street view imagery. The second and third focus on spatial measurements of both streetscape visual perception and spatial syntactic measurement. Visual perception is assessed through a systematic evaluation indicator system combined with an expert scoring mechanism. The fourth entails an overlay analysis of the visual perception and spatial behavior measurements. The finale involves proposing targeted street strategies based on the evaluation outcomes.

4. Spatial Measurement of Different Scales

4.1. Micro Scale-Perception: Analysis of Visual Elements in Waterfront Streets

4.1.1. Basic Composition of Visual Elements

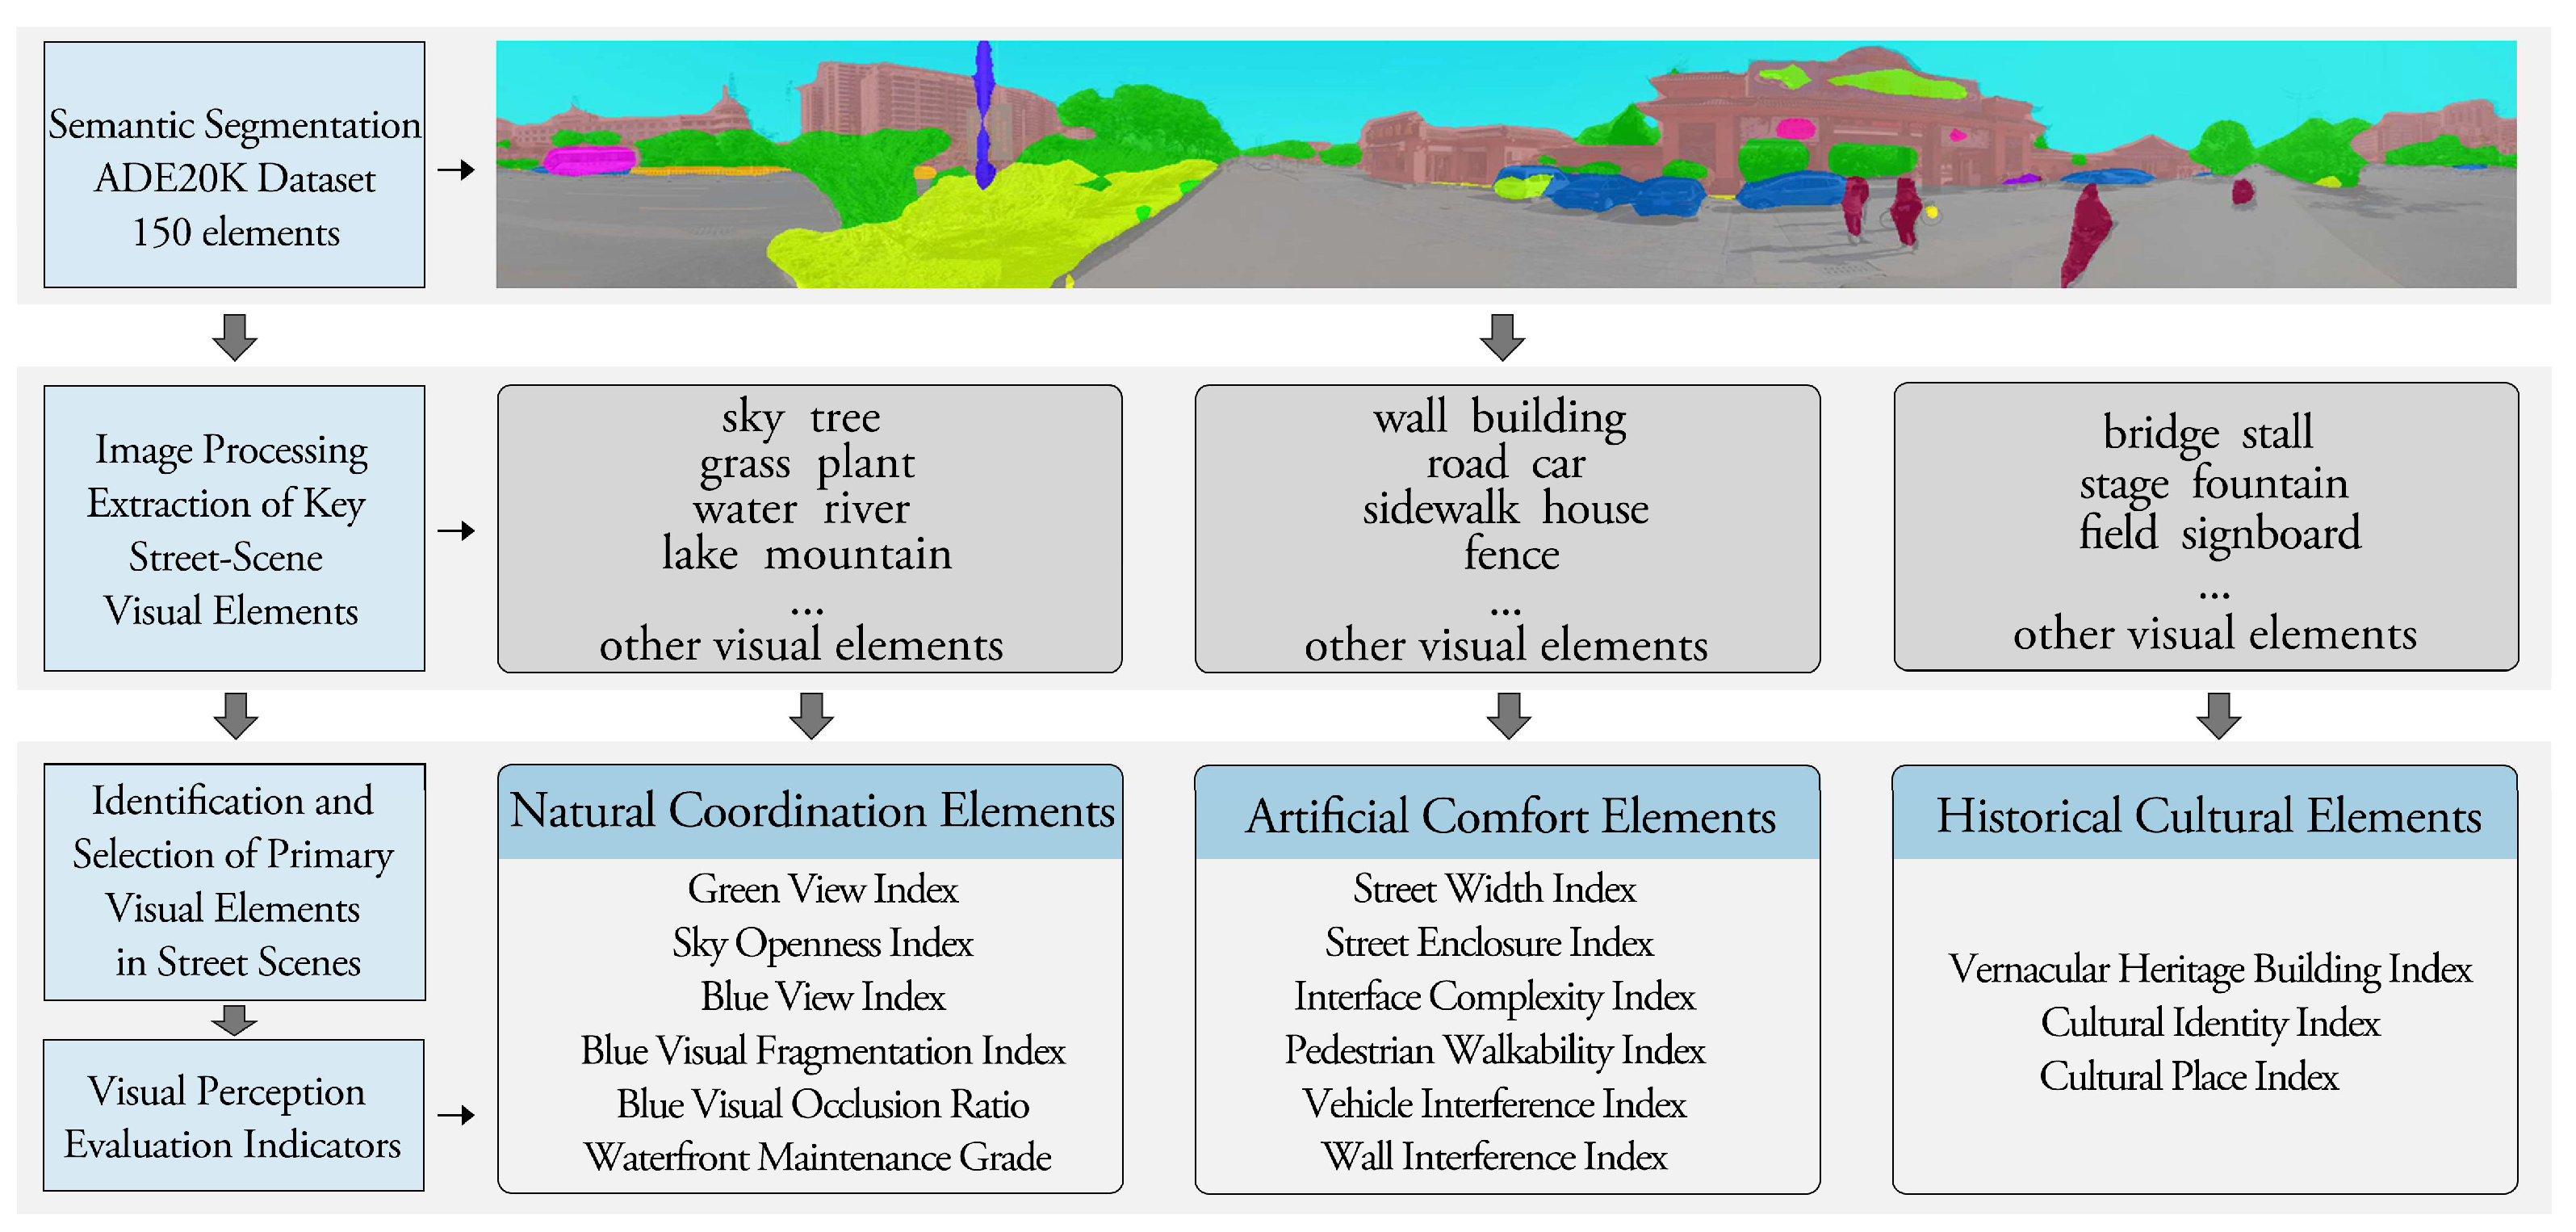
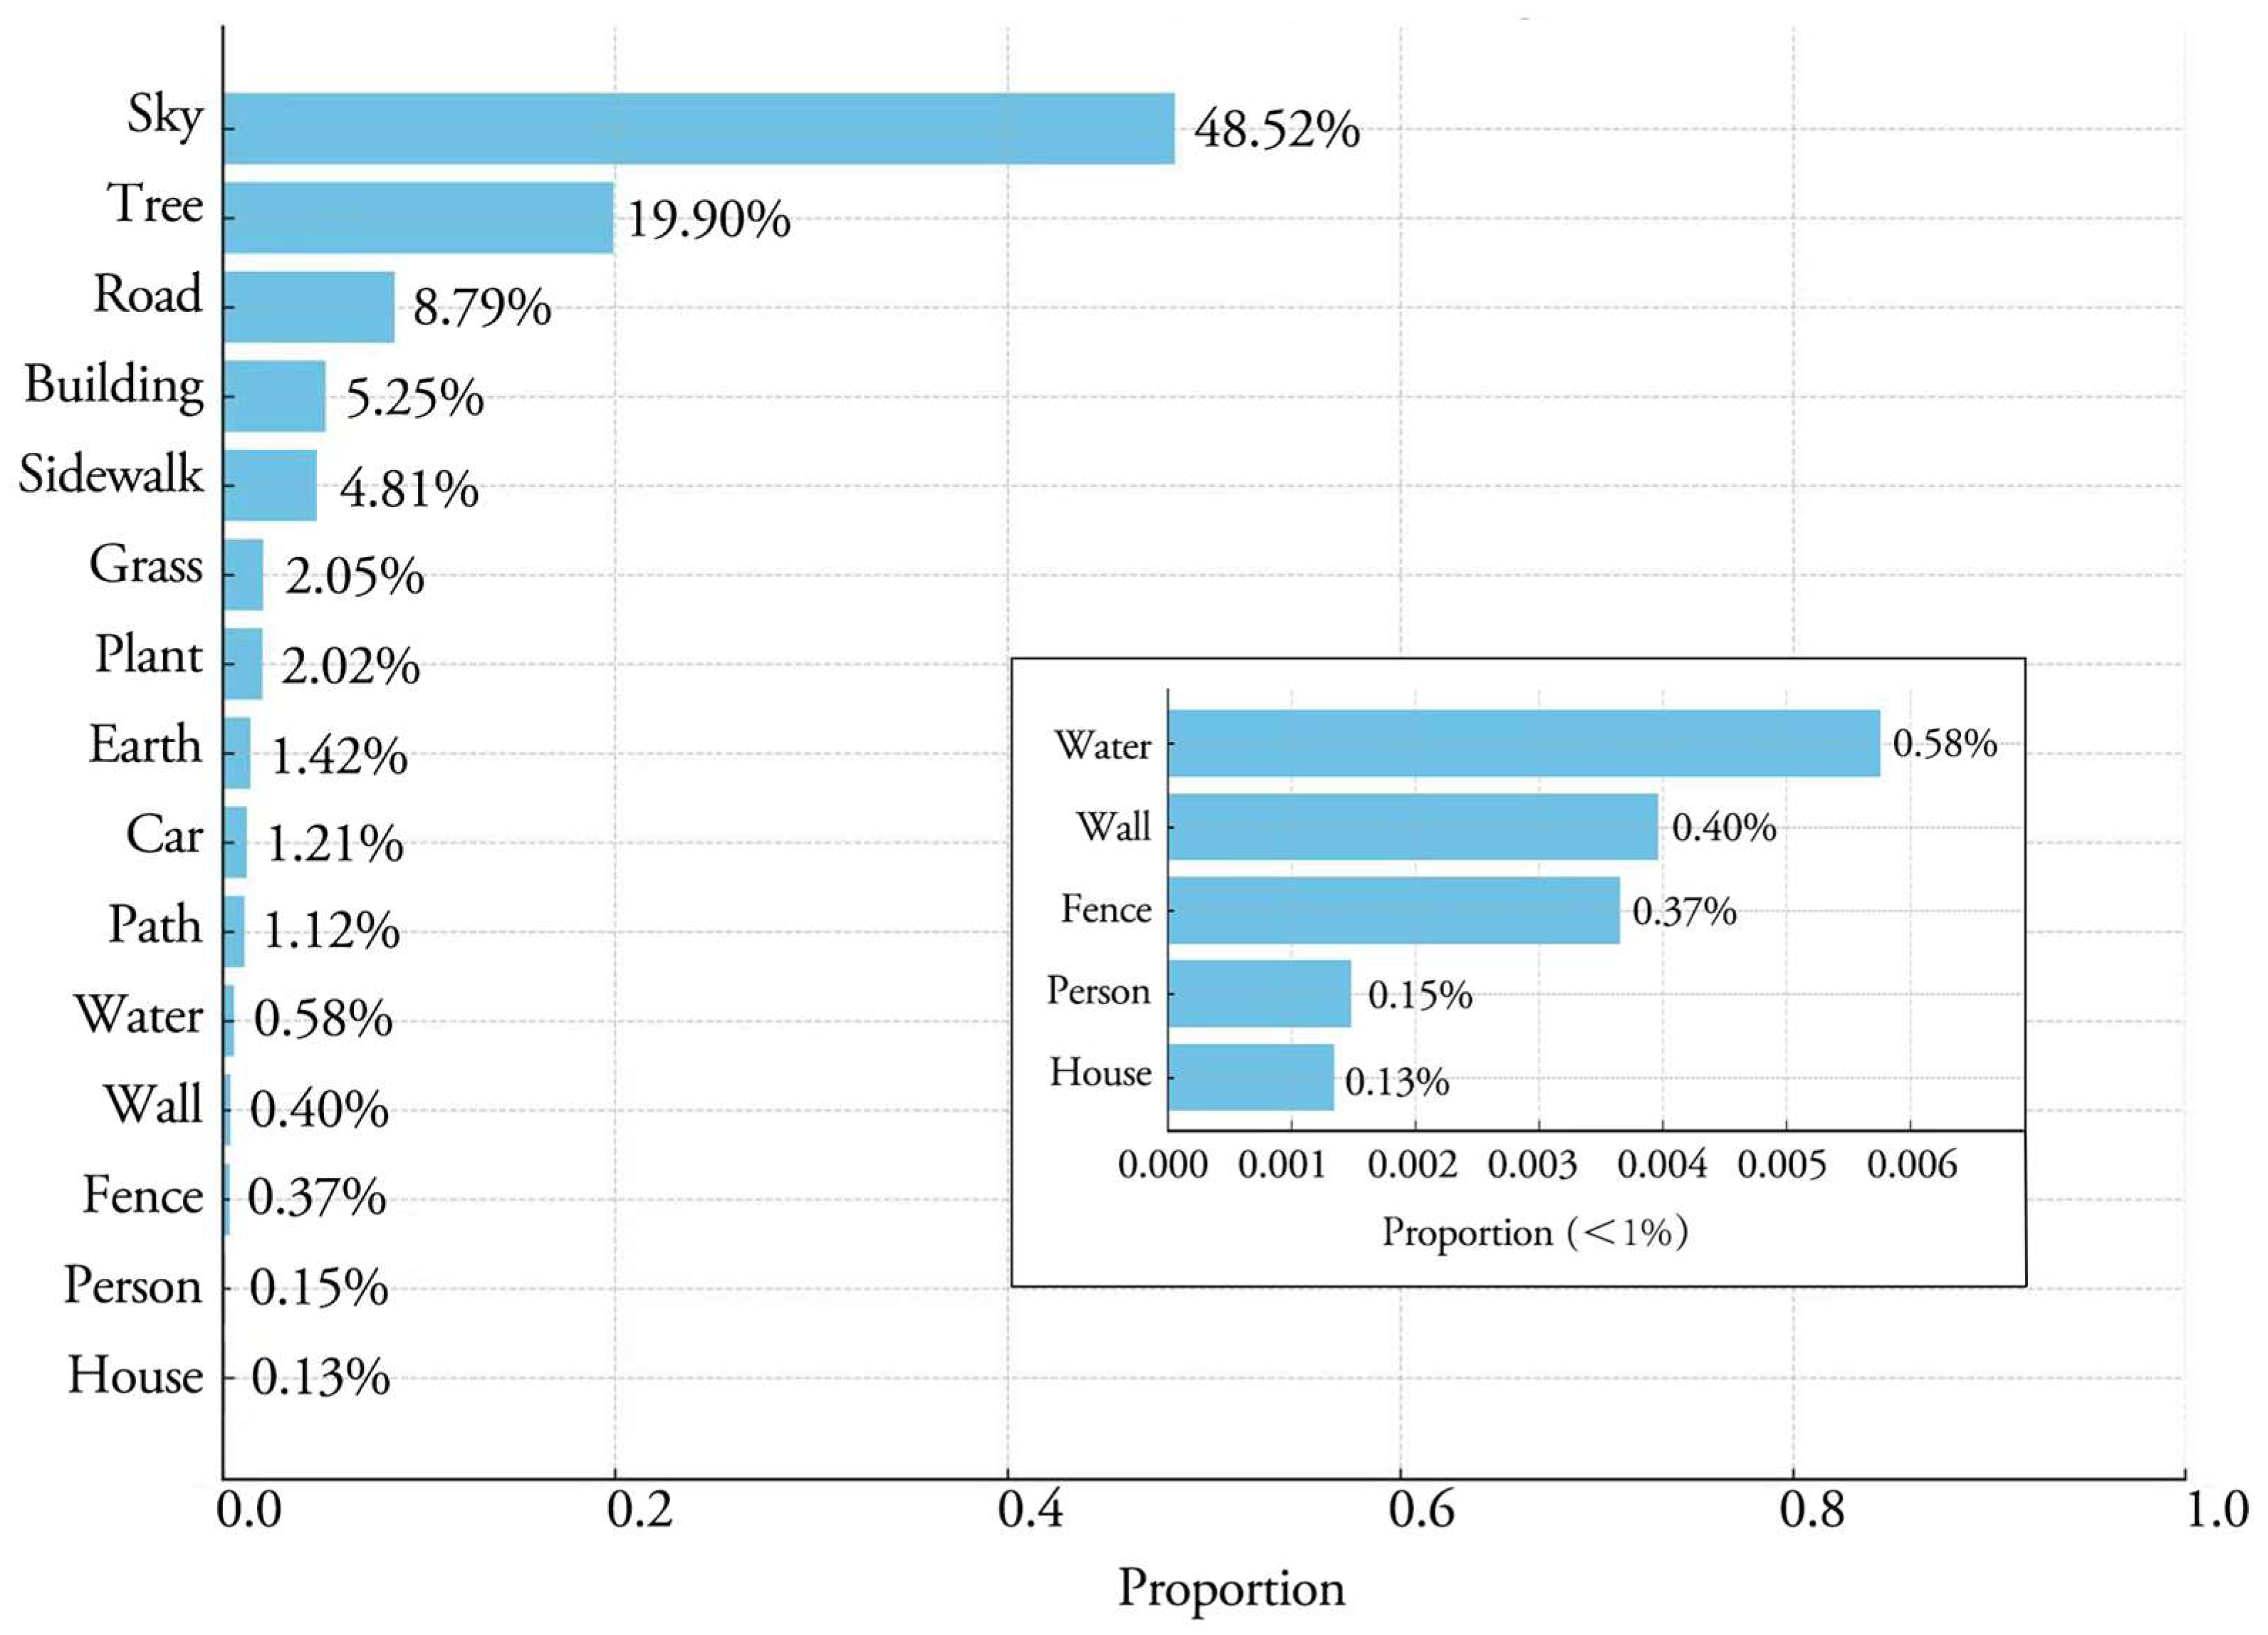
The semantic segmentation elements were systematically categorized according to the previously established visual quality indicator system, aligning with the dimensions of natural coordination, artificial comfort, and historical cultural characteristics (Figure 6). To further understand the visual composition of waterfront streets in Liaocheng’s historic district, pixel proportion analysis was conducted for the identified elements. The 15 most prevalent elements, measured by their percentage of total image pixels, are presented in Figure 7. These elements primarily encompass natural and artificial types, with natural elements collectively dominating the visual field. Among natural elements, sky, tree, grass, plant, earth, and water show relatively high proportions. The sky constitutes the most significant single element at approximately 48.52%. In contrast, water account for a comparatively lower proportion than other natural features, indicating a relatively weak visual interaction between the waterfront streets and adjacent water systems. Regarding artificial elements, road, sidewalk, building, vehicle, and path emerge as dominant components, collectively forming the primary artificial interfaces within the streetscapes.

4.1.2. Quantitative Measurement of Visual Indicators

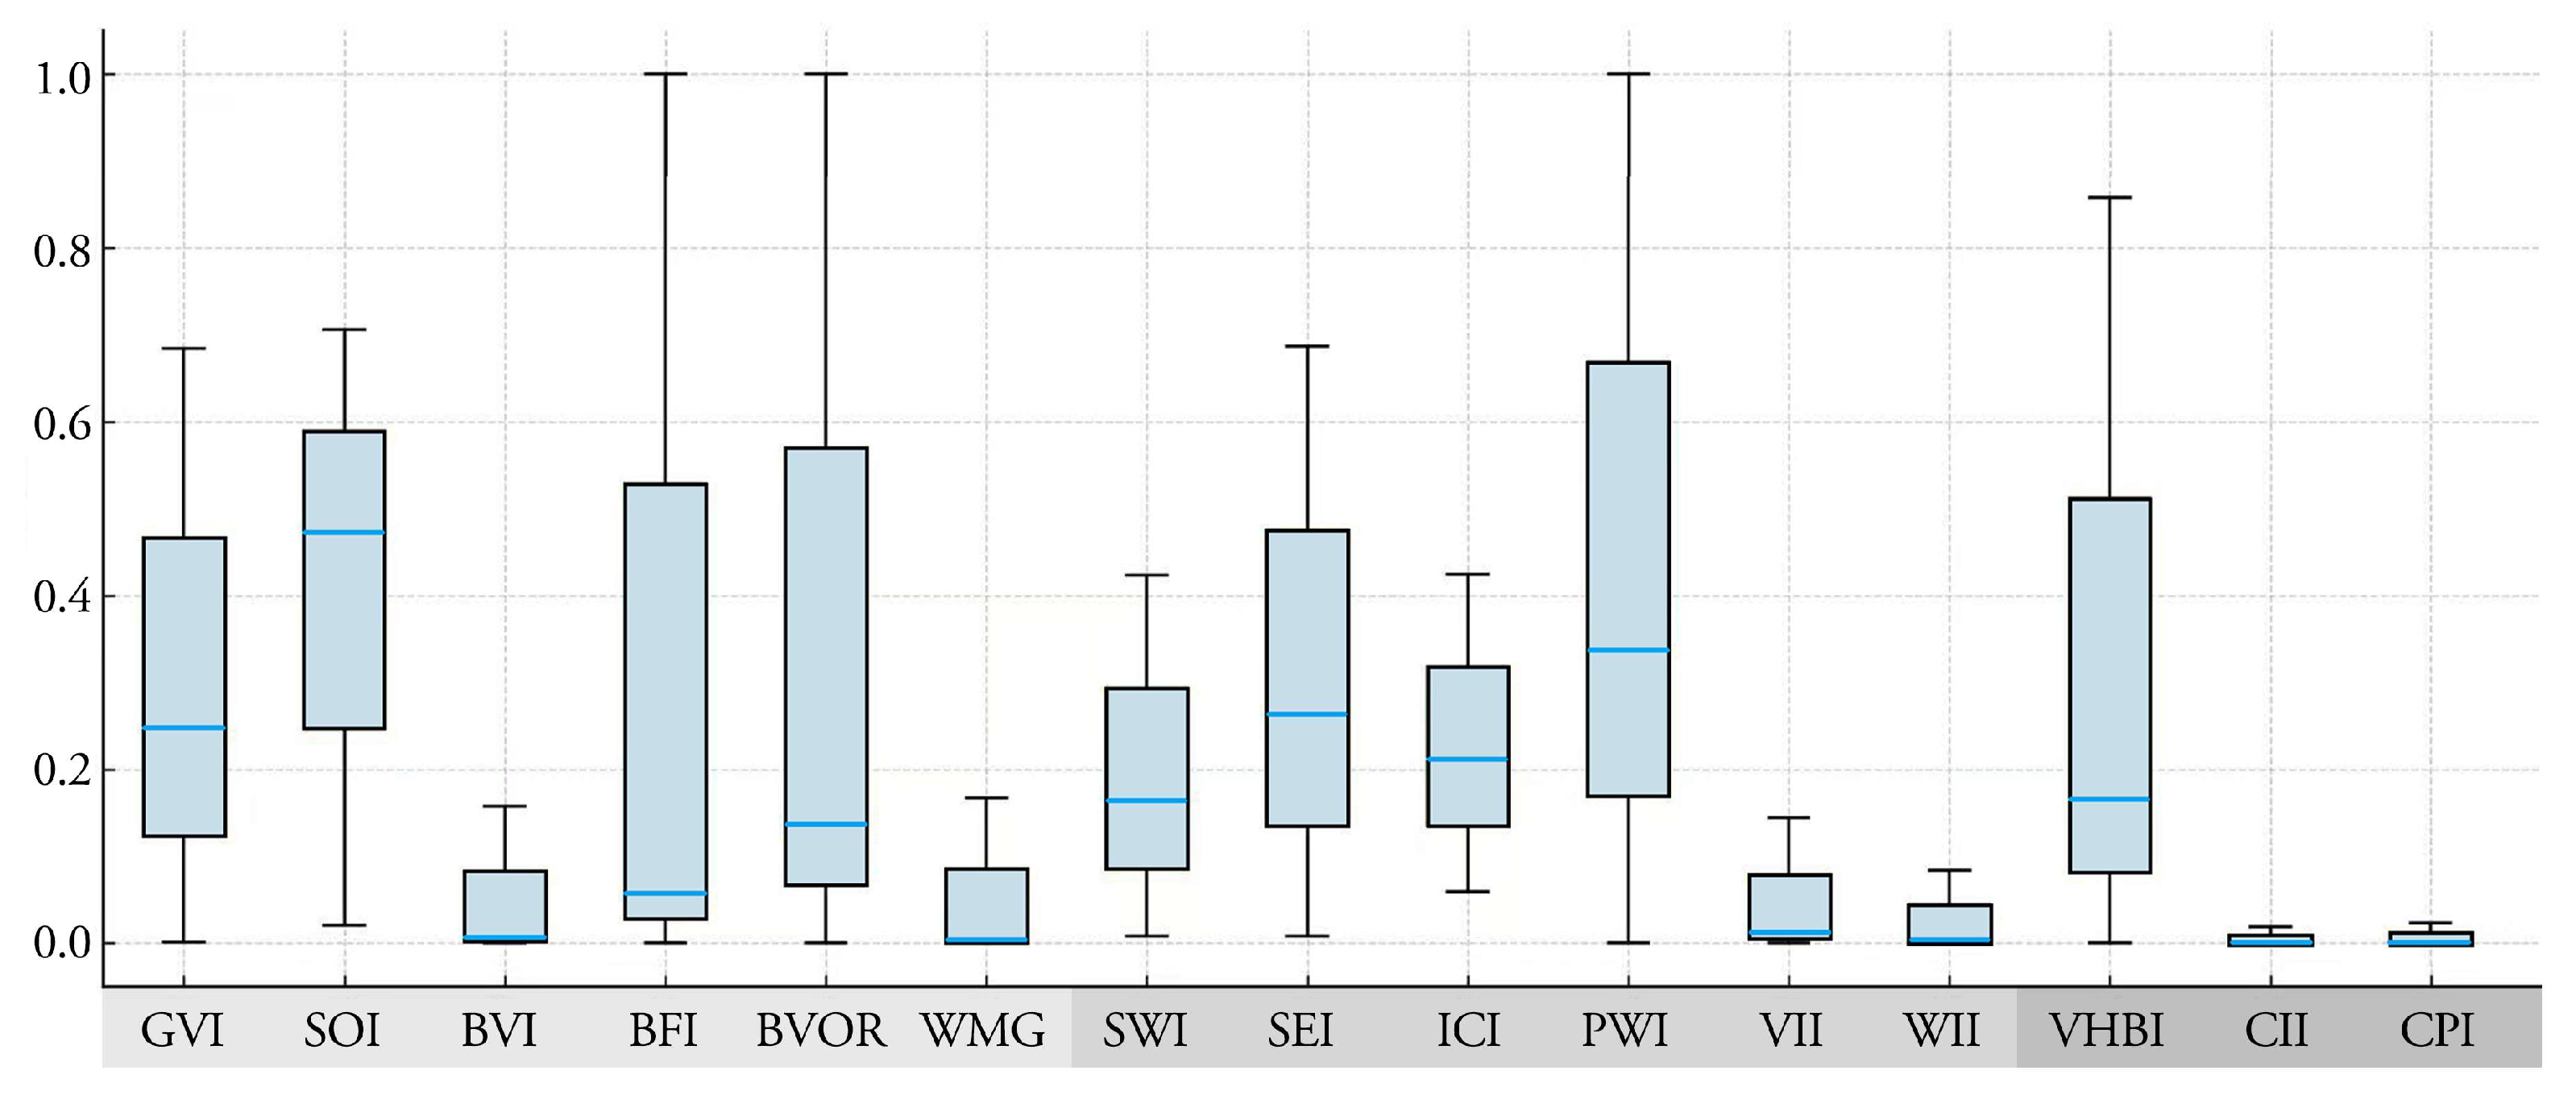
Based on the visual element data and the previously established 15-indicator visual evaluation system for Liaocheng’s historic waterfront streets, each sampling point was quantitatively assessed (Figure 8), resulting in 15 corresponding datasets per point. The calculated values reveal fundamental characteristics of each visual indicator. Although the various indicators cannot be compared across the board due to their differing evaluation methods, they can illustrate the distribution of sampling points within each indicator.
Overall, the distribution ranges and dispersion degrees of the 15 indicators vary significantly, indicating notable differences in the perceived intensity of various visual elements. Indicators such as GVI, SOI, BFI, and BOVR exhibit relatively long box lengths, suggesting considerable variation in their values across sampling points. In contrast, indicators including BVI, WMG, VII, and WII show low median values and short box lengths, implying limited overall variation but consistently low values across all sampling points. These indicators will be integrated into a unified evaluation framework as foundational data for subsequent analysis.
Specifically, within the natural coordination dimension, GVI demonstrates substantial variation between its maximum and minimum values, indicating significant differences in greenery coverage across sampling points. BVI remains generally low (0–0.158), with a median value of approximately 0.007, suggesting limited visibility of water landscapes in most sampled scenes. In the artificial comfort dimension, the average SWI is relatively low, while SEI are generally high, reflecting the overall narrow and consistent width of streets in the study area. Within the historical cultural dimension, indicators display considerable variation. VHBI has a relatively high median (0.186) and a wide distribution range (0–0.884), indicating a generally high but uneven presence of historical buildings across sampling points.

4.1.3. Spatial Characteristics of Visual Indicators

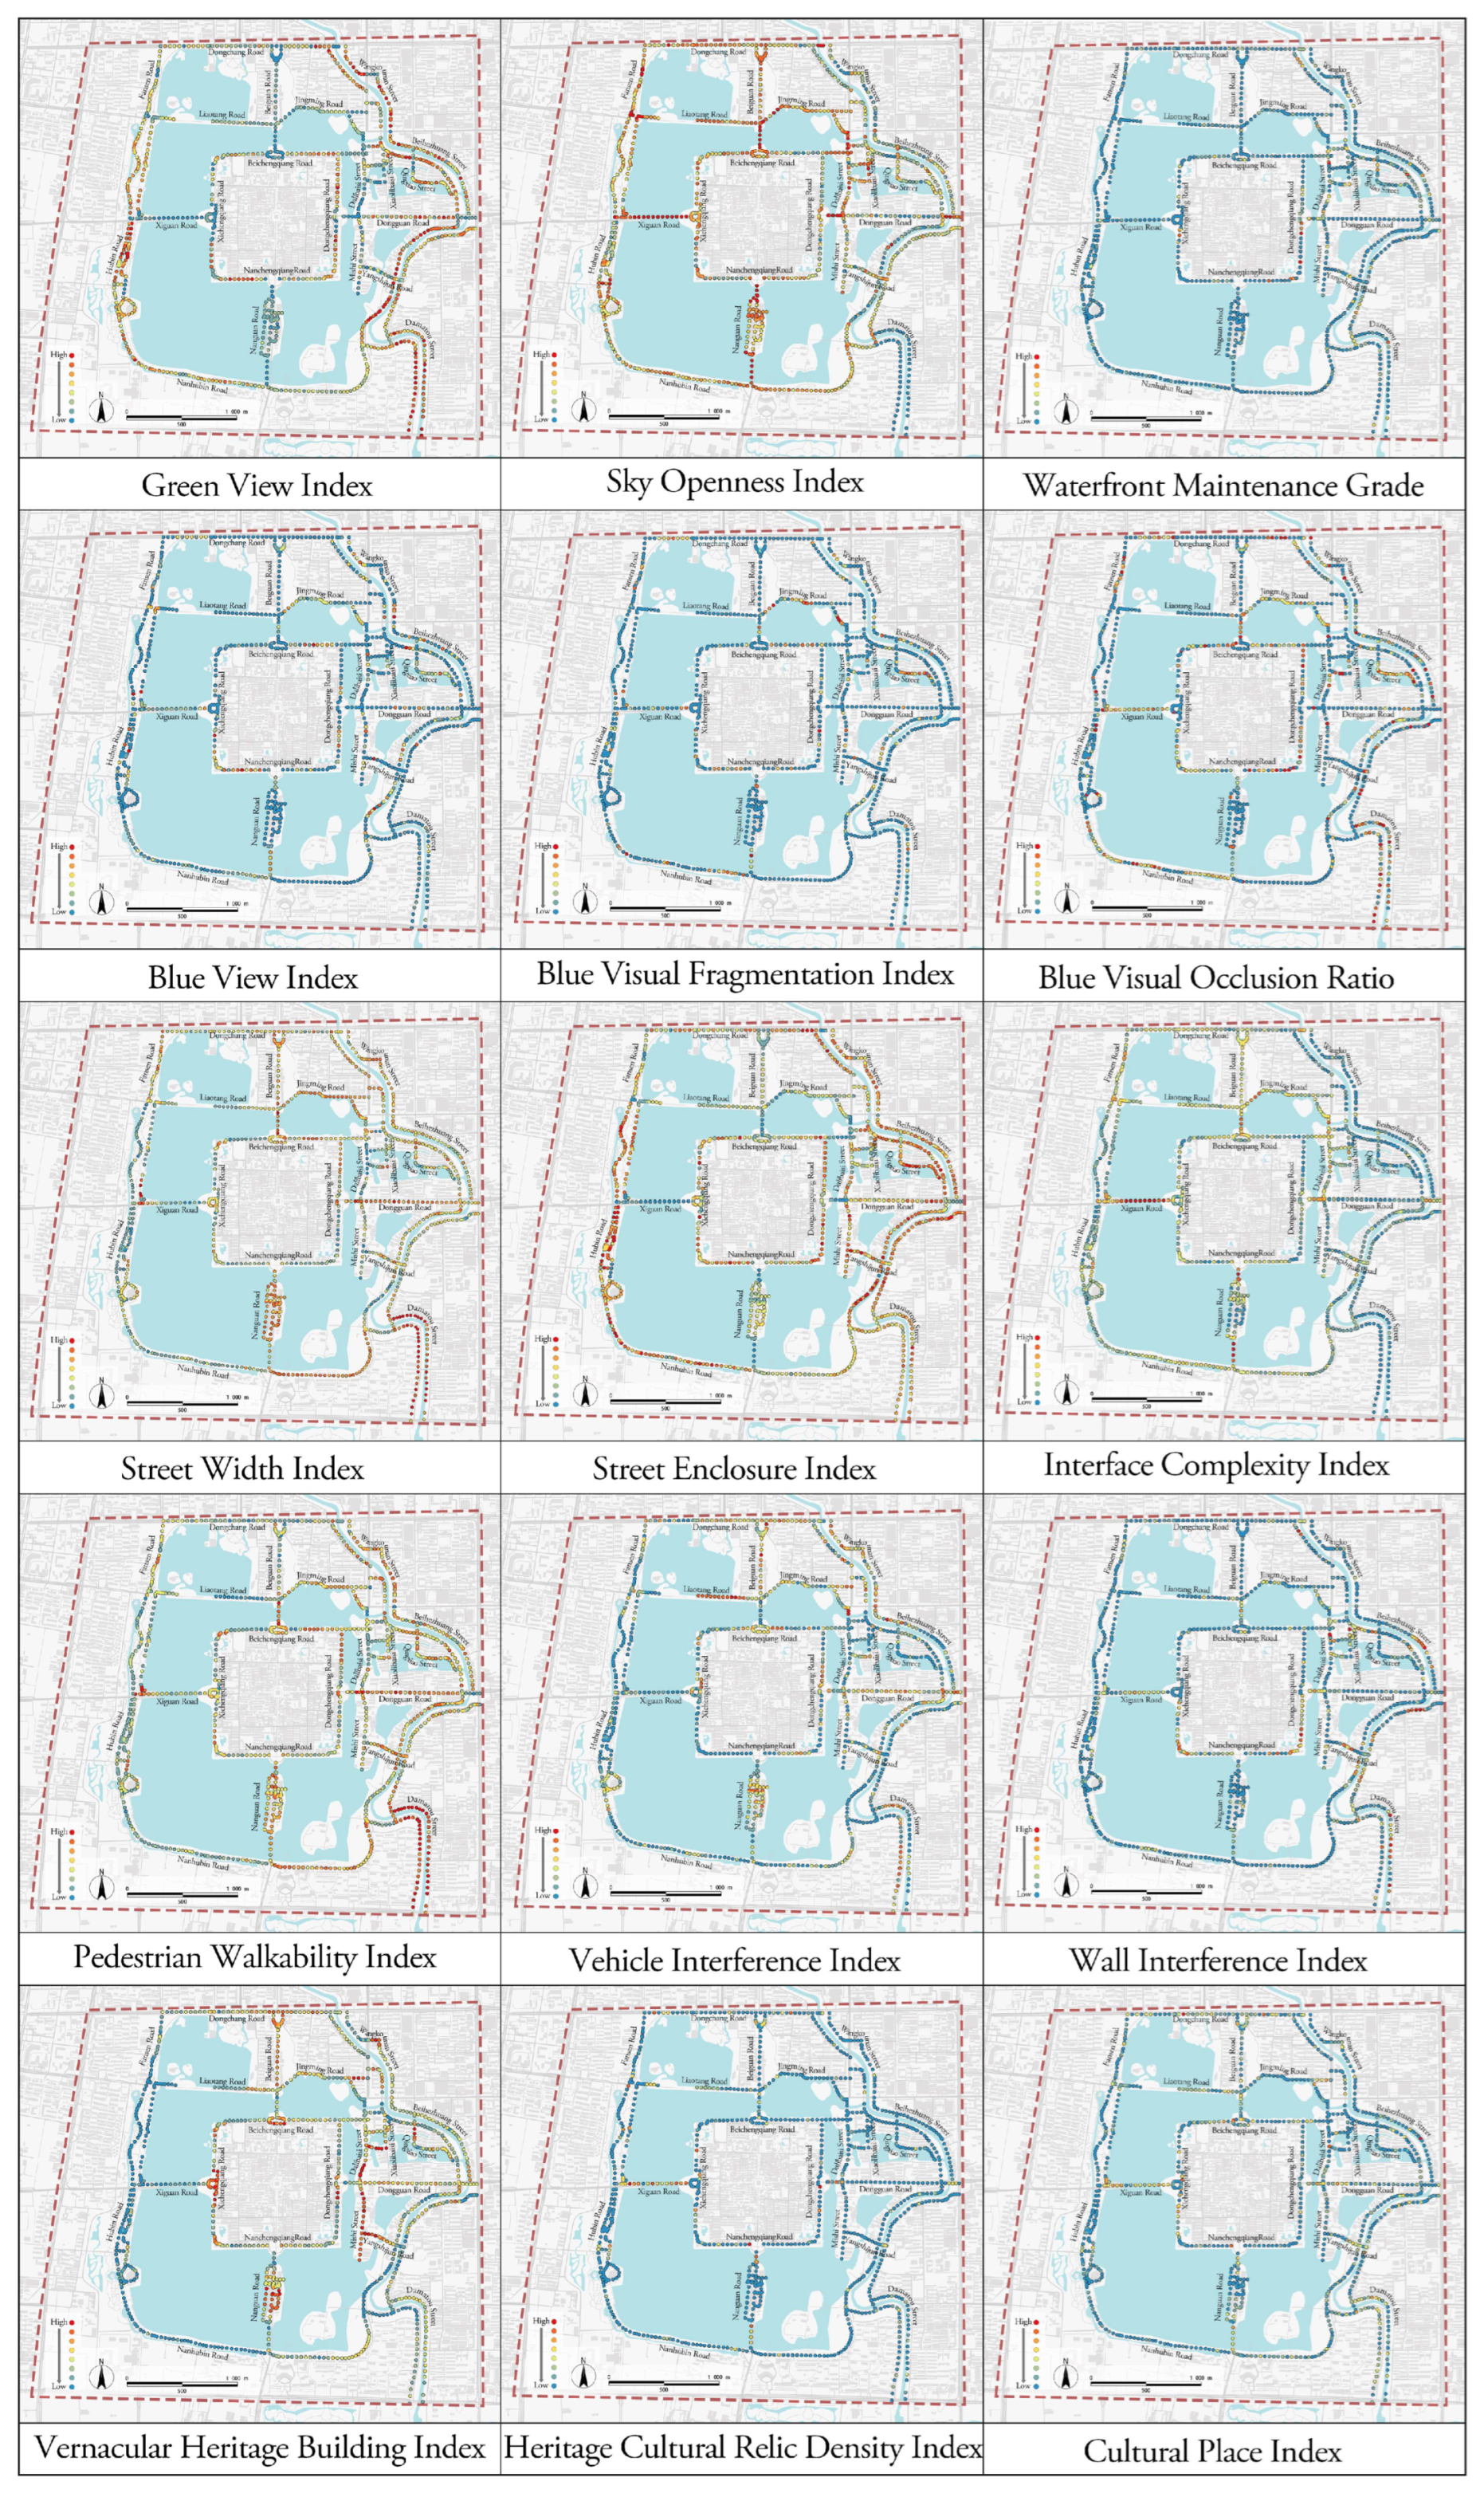
To further elucidate the spatial distribution of visual characteristics and perceptual variations in the waterfront streets of Liaocheng’s historic district, this study conducted a spatial analysis of the visual perception indicators. Based on the computational results, 15 indicators were spatially mapped. Using geographic coordinates, the street view sampling points were geolocated and visualized via GIS to express the spatial patterns of perceptual elements (Appendix A).
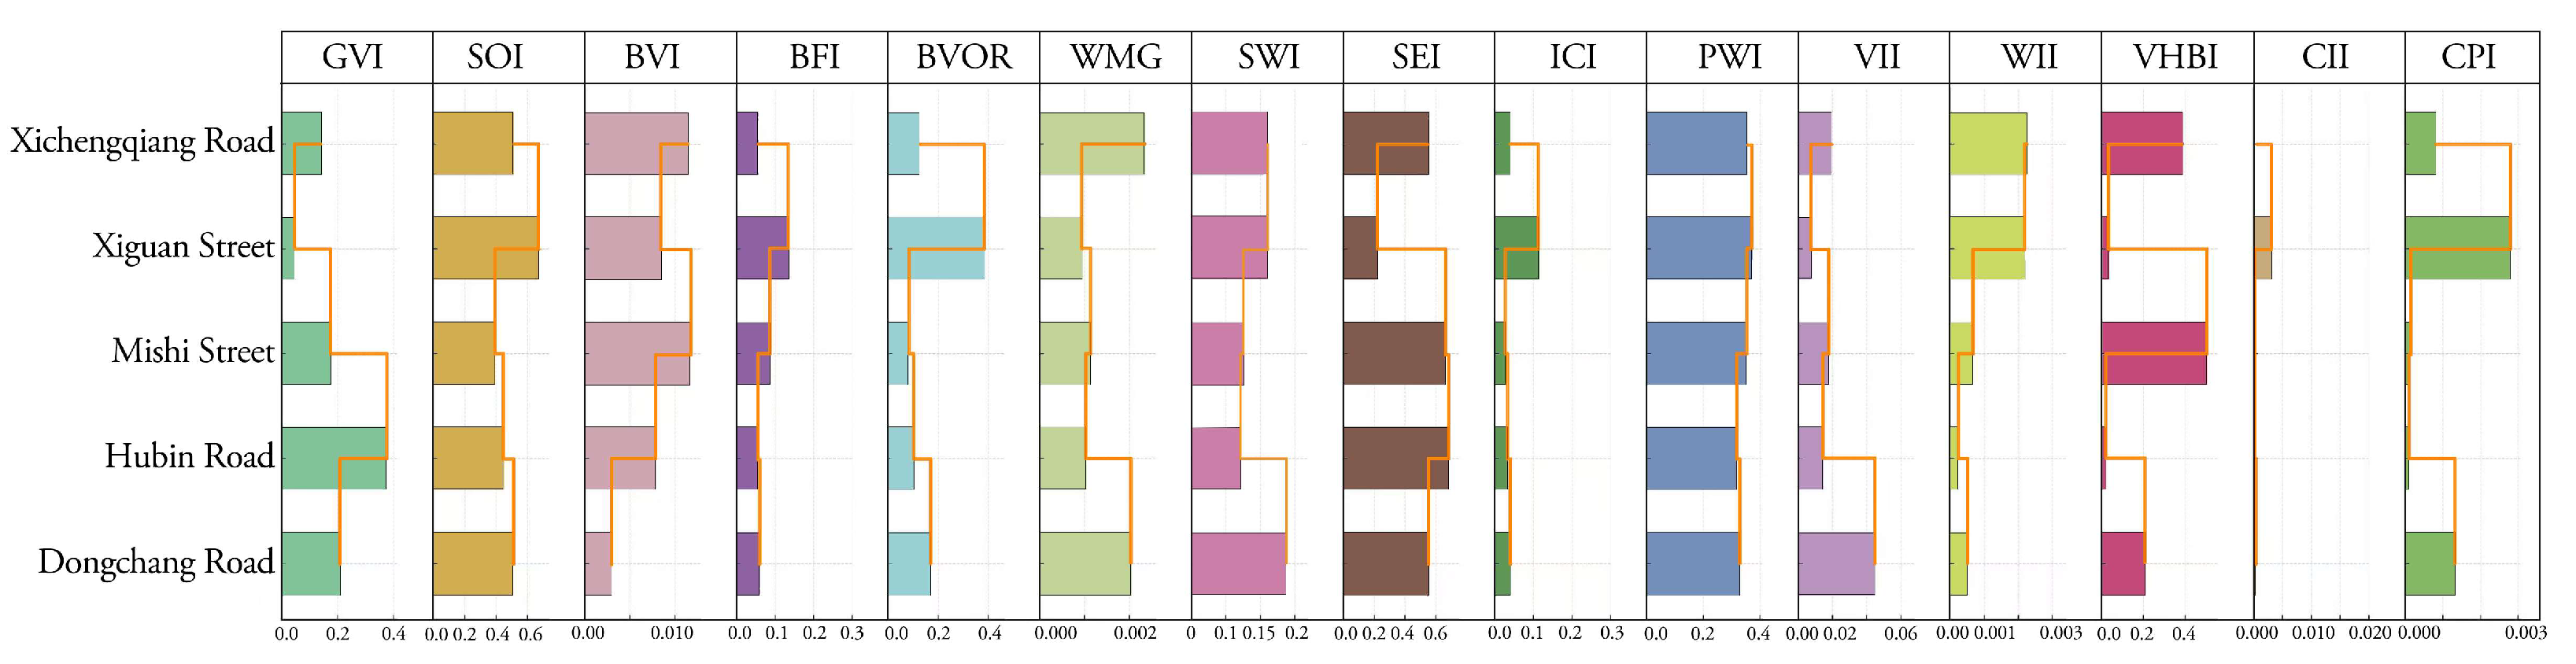
Based on the results of the above measurement and spatial analyses, five representative streets were selected for comparative analysis. The findings reveal significant differences in the performance of various visual elements across these streets (Figure 9). These five street types are characterized as follows: one preserves the original urban fabric of the ancient city, one serves as a transition between inner and outer areas of the old town, one features a concentration of cultural spaces, one is notable for its ecological waterfront landscape, and one functions as an urban transportation corridor.
From the natural coordination perception, Hubin Road demonstrates high GVI, indicating abundant natural landscapes. Xiguan Road exhibits high SOI, providing broad spatial sightlines. Xichengqiang Road shows elevated BVI and WMG, reflecting continuous waterfront landscapes and strong water visibility. In contrast, Xiguan Road has higher BFI and BOVR, suggesting significant visual interference with its water. Regarding artificial comfort, Dongchang Road, as an urban arterial, achieves the highest SWI. Hubin Road scores highest in SEI, forming strong visual boundaries along its interfaces. Mishi Street leads in ICI, featuring diverse street elevations, and also achieves the highest PWI, indicating superior pedestrian-friendly conditions. In the historical cultural dimension, both Xichengqiang Road and Mishi Street exhibit high VHBI, demonstrating strong historical continuity. Xiguan Road scores highest in CPI, indicating concentrated cultural facilities.

4.2. Meso Scale-Behavior: Walkability Analysis of Waterfront Streets

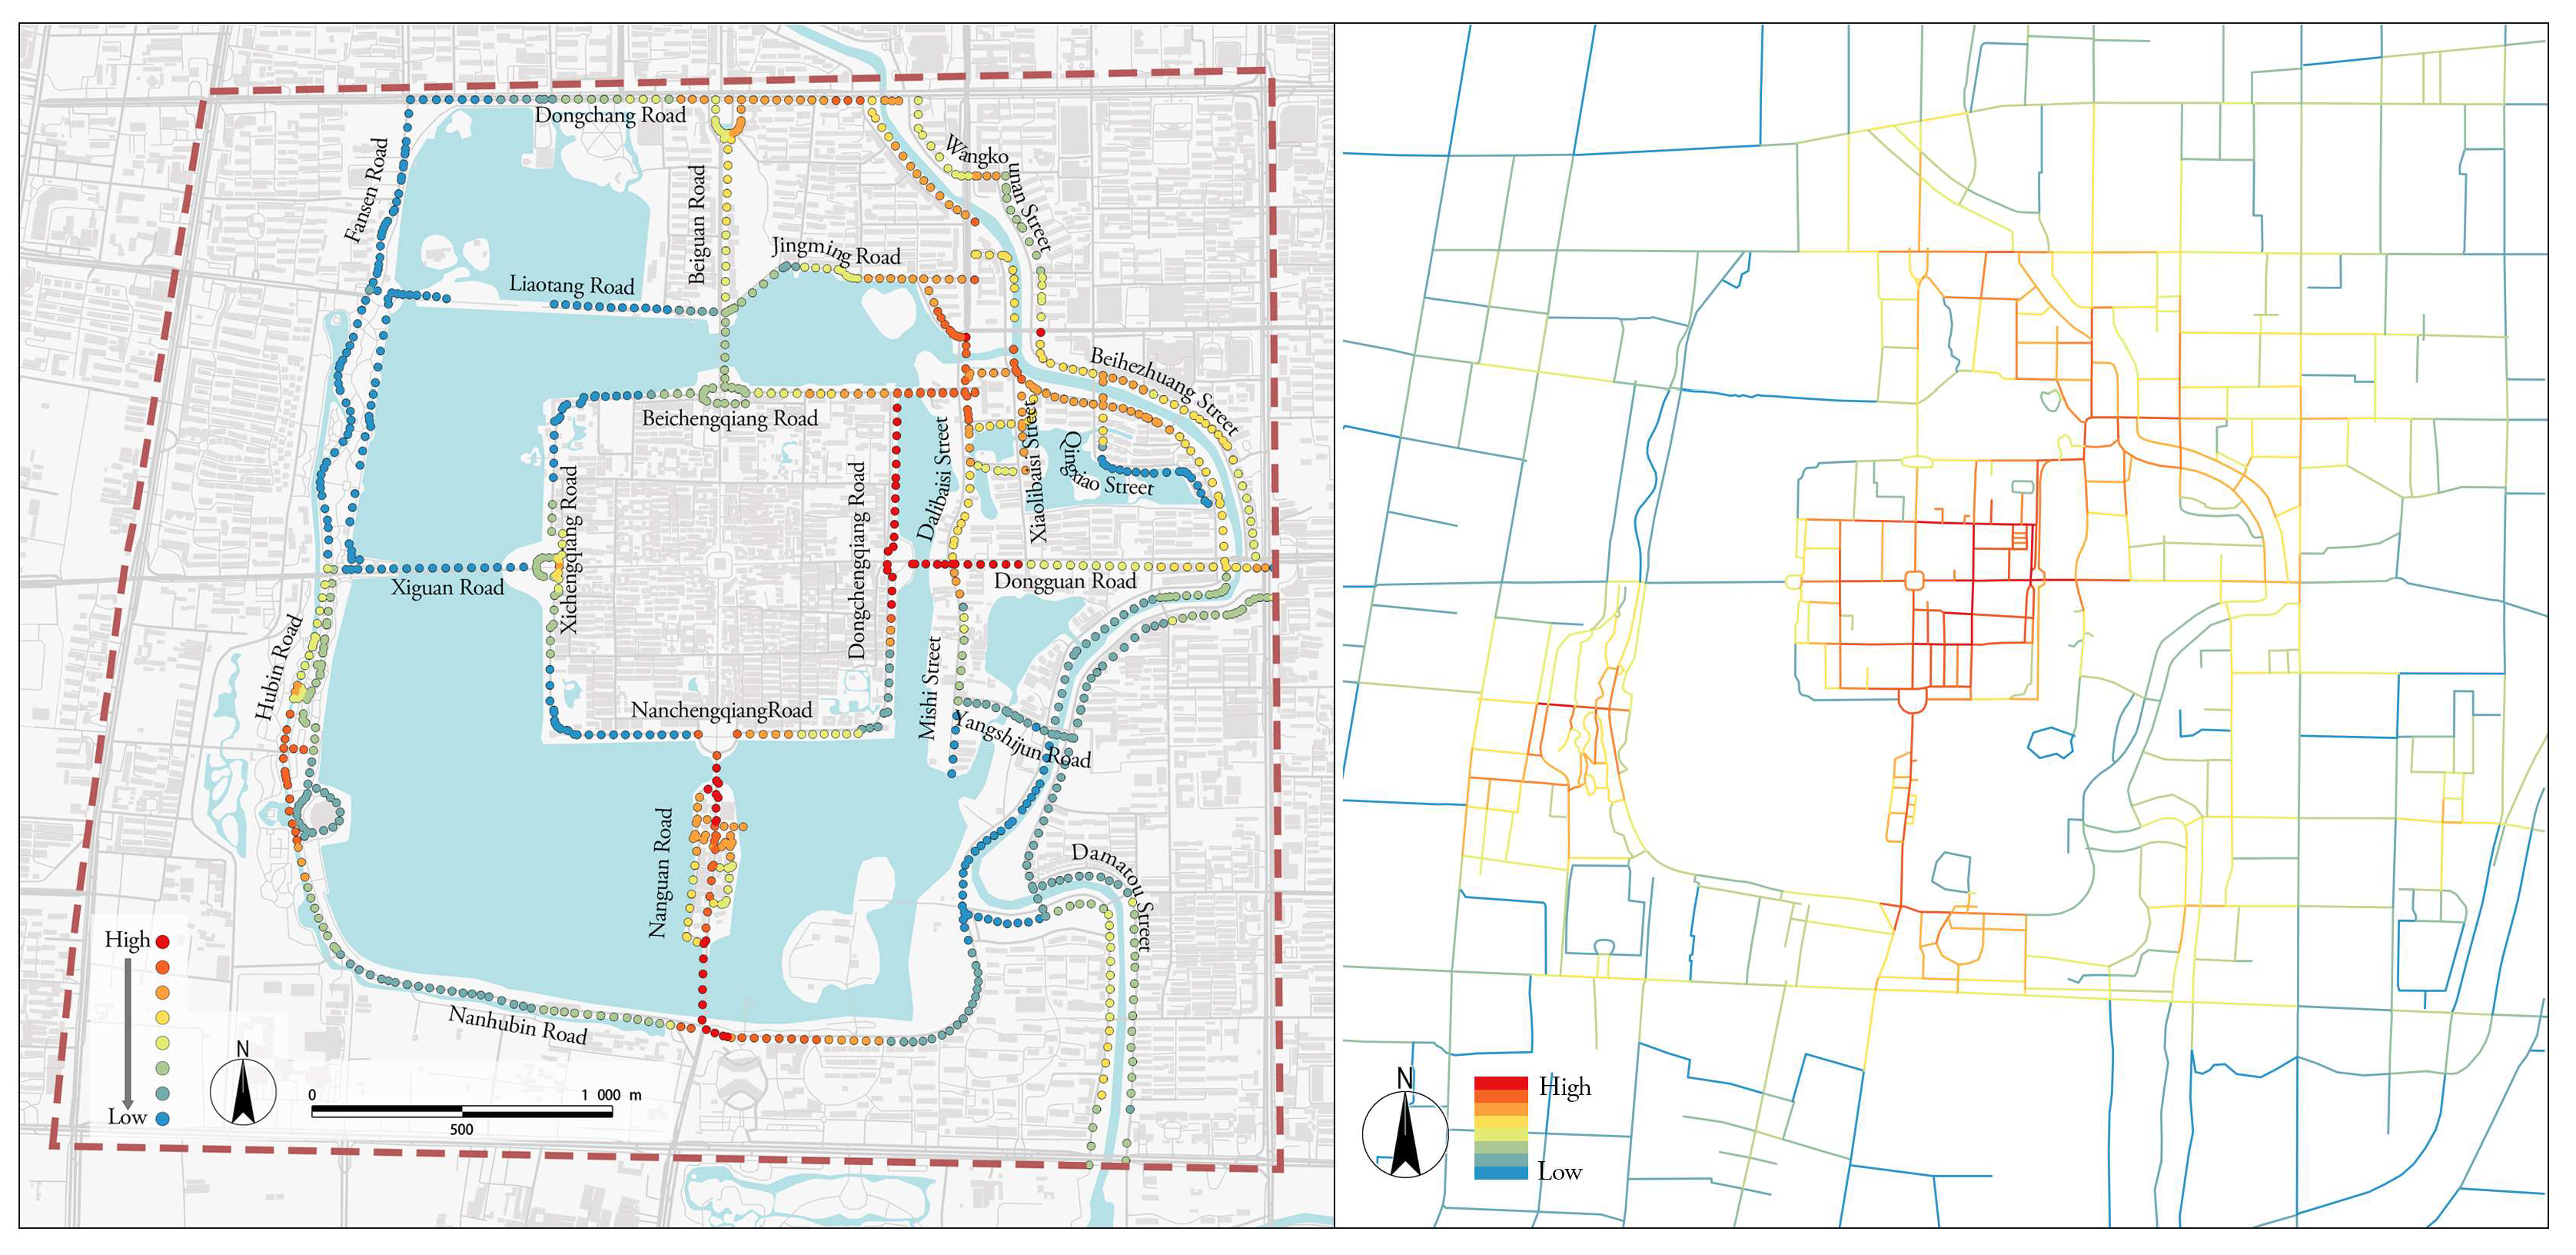
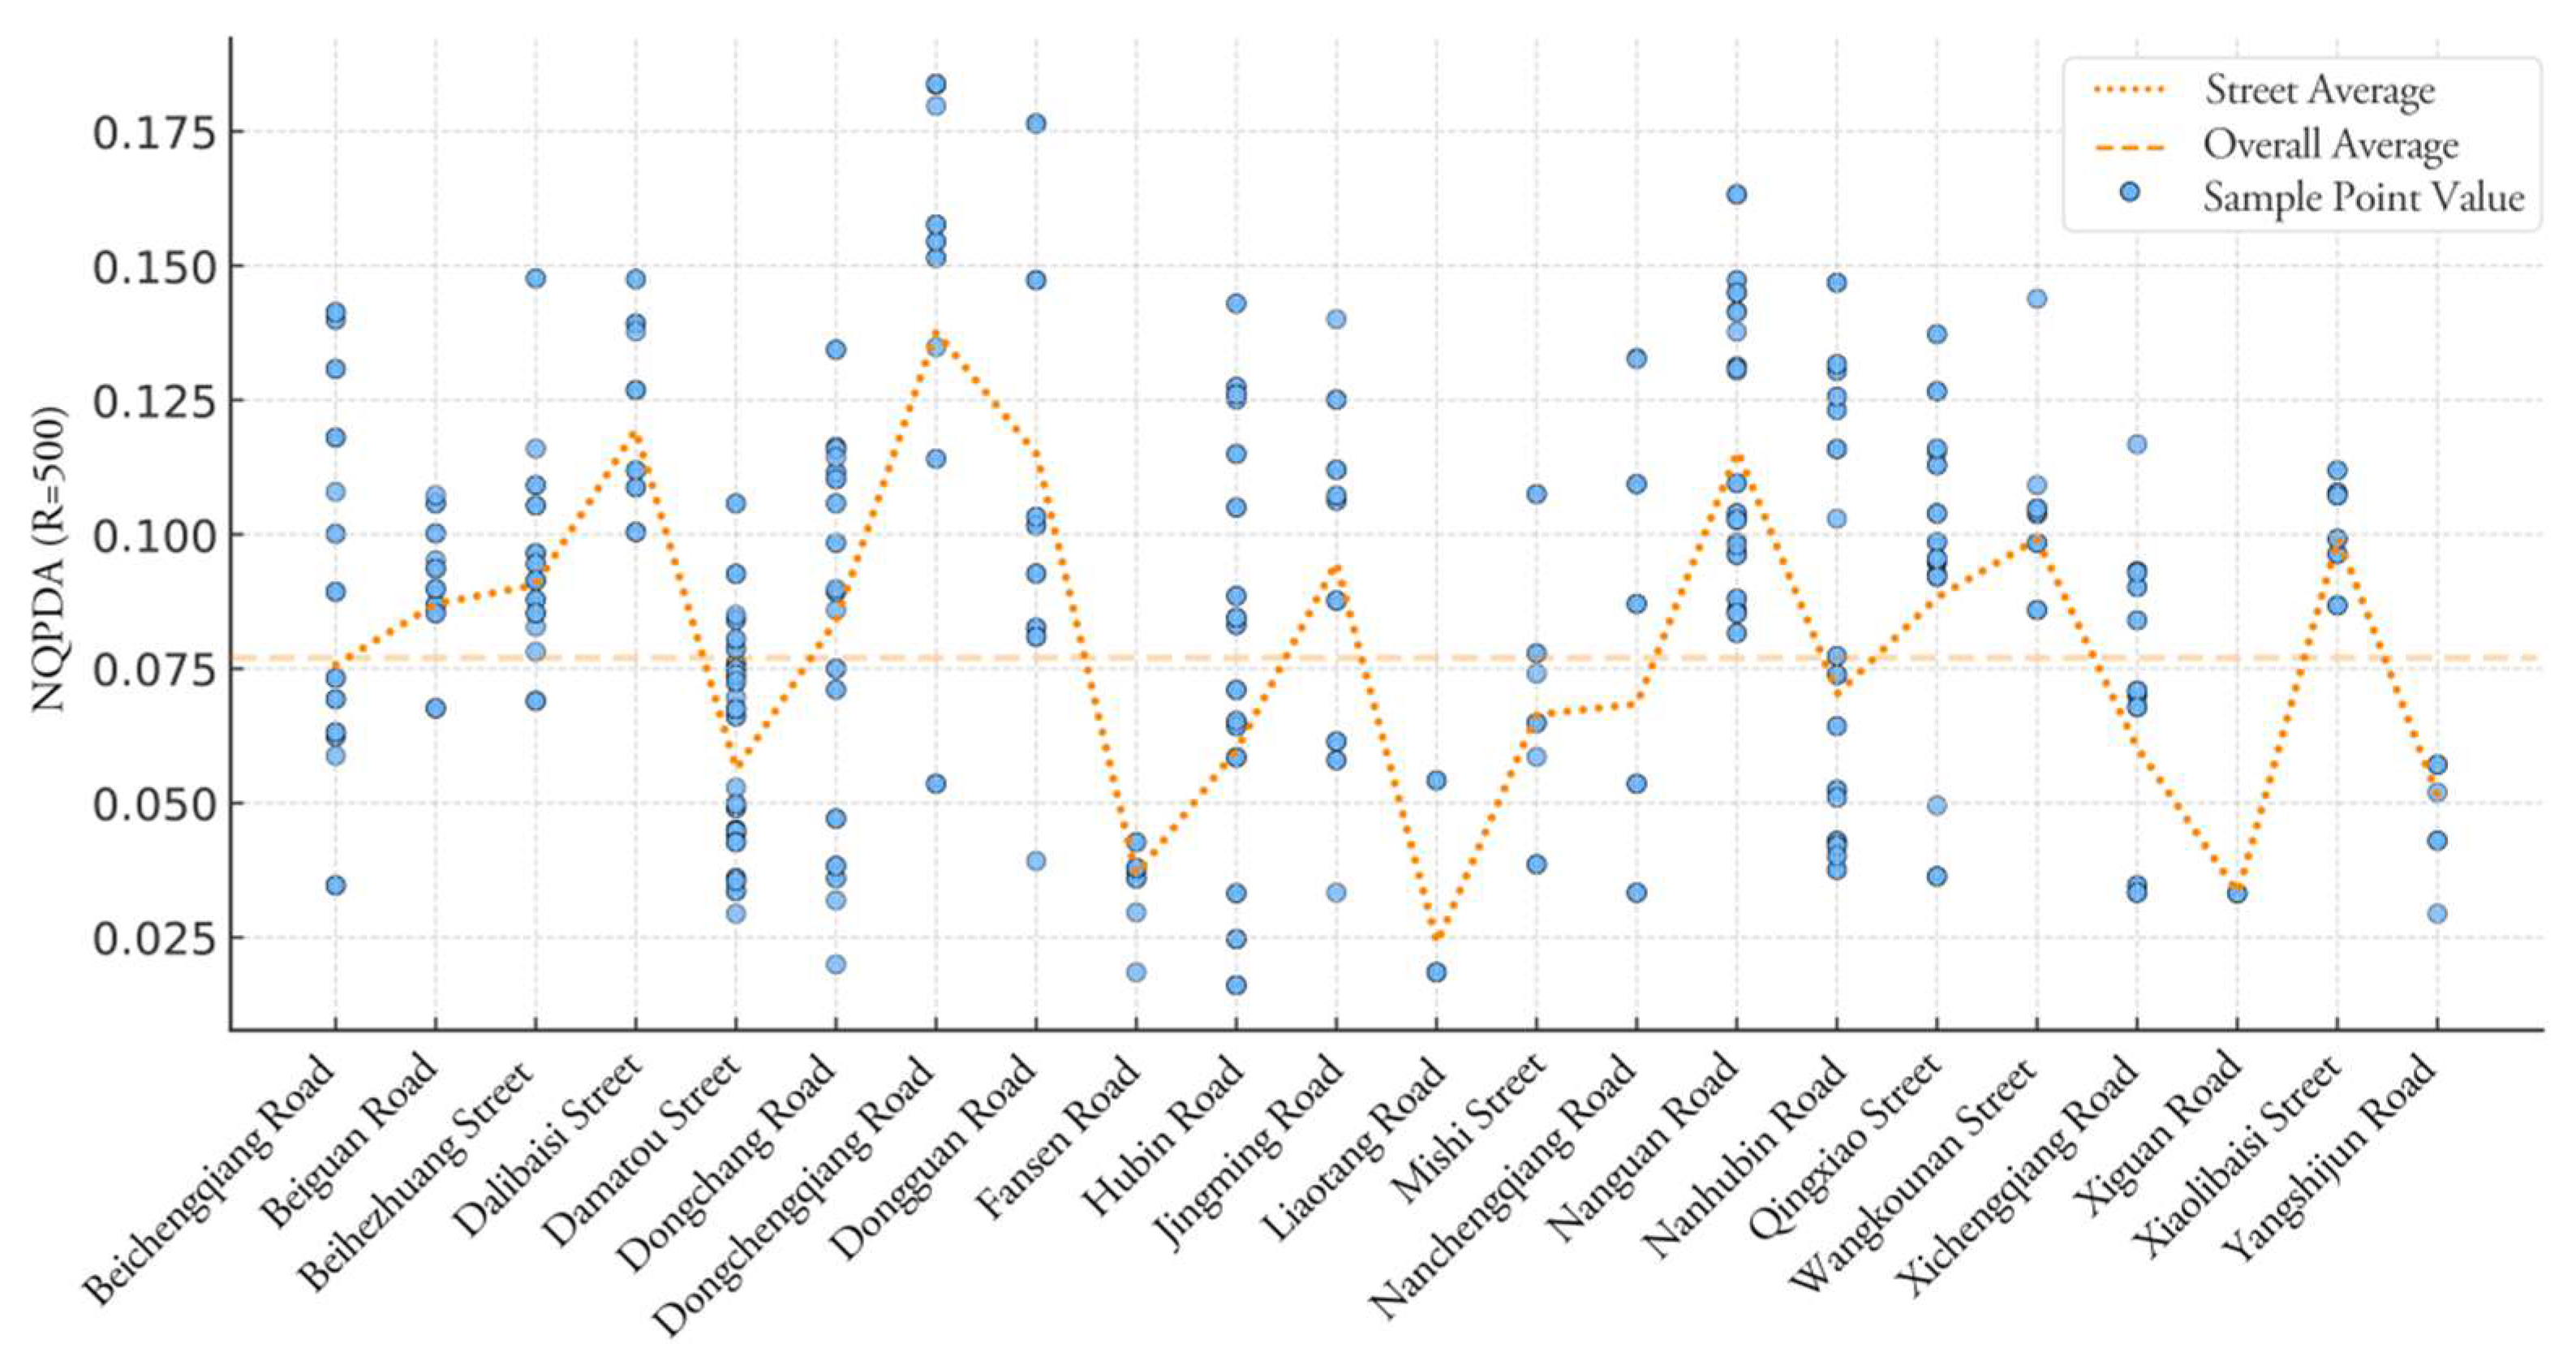
Local NQPDA measures the spatial connectivity and accessibility of streets within a walkable radius [64], serving as a key indicator of pedestrian-scale spatial characteristics. Combined with visual perception evaluation, this analysis offers behavioral-perceptual insights to support street space quality improvement [65]. Overall, the local NQPDA values of the selected streets range between 0.016 and 0.184, with an average of 0.076 (Figure 10). Dongchengqiang Road shows the highest value, while Liaotang Road records the lowest. Considerable variation exists among streets, reflecting distinct spatial connectivity patterns. Spatially, high-value areas concentrate around eastern and southern part of the old city, indicating strong pedestrian-scale connectivity and good accessibility. In contrast, low-value areas include Fansen Road, Nanhubin Road, and Damatou Street, where pedestrian connectivity is relatively weak, local network structure is underdeveloped, and accessibility remains limited (Figure 11).

4.3. Macro Scale-Structure: Spatial Structure Analysis of Waterfront Streets

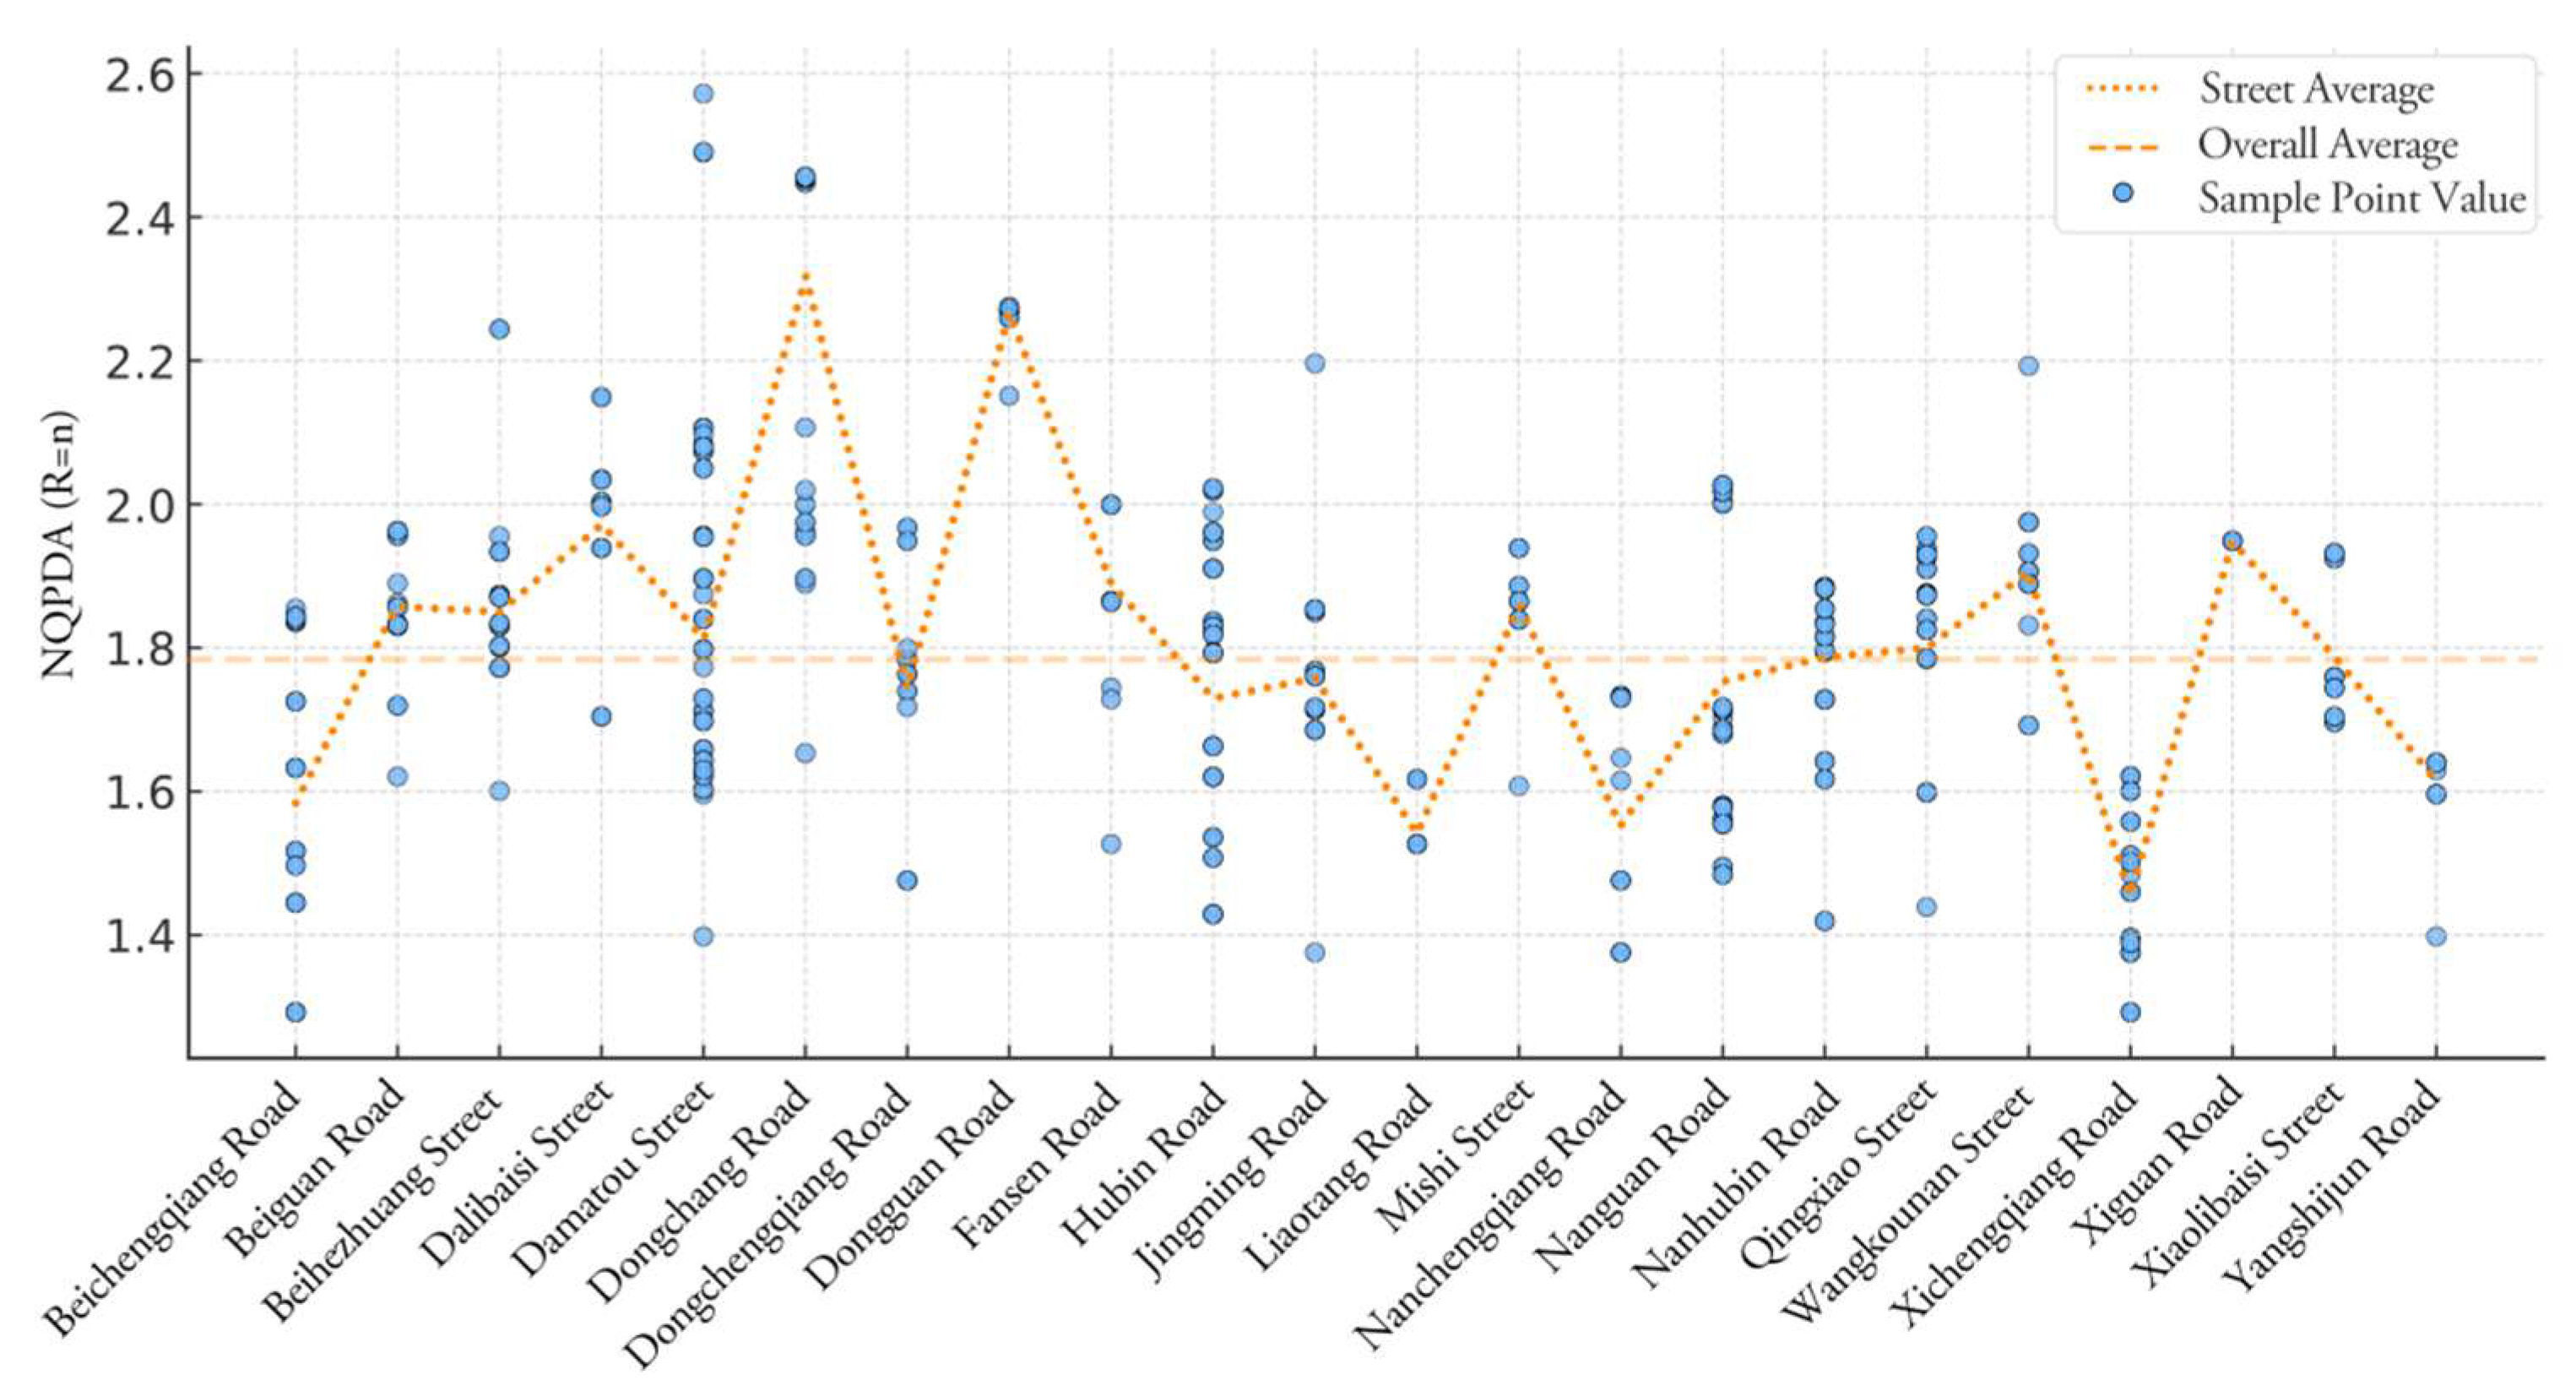
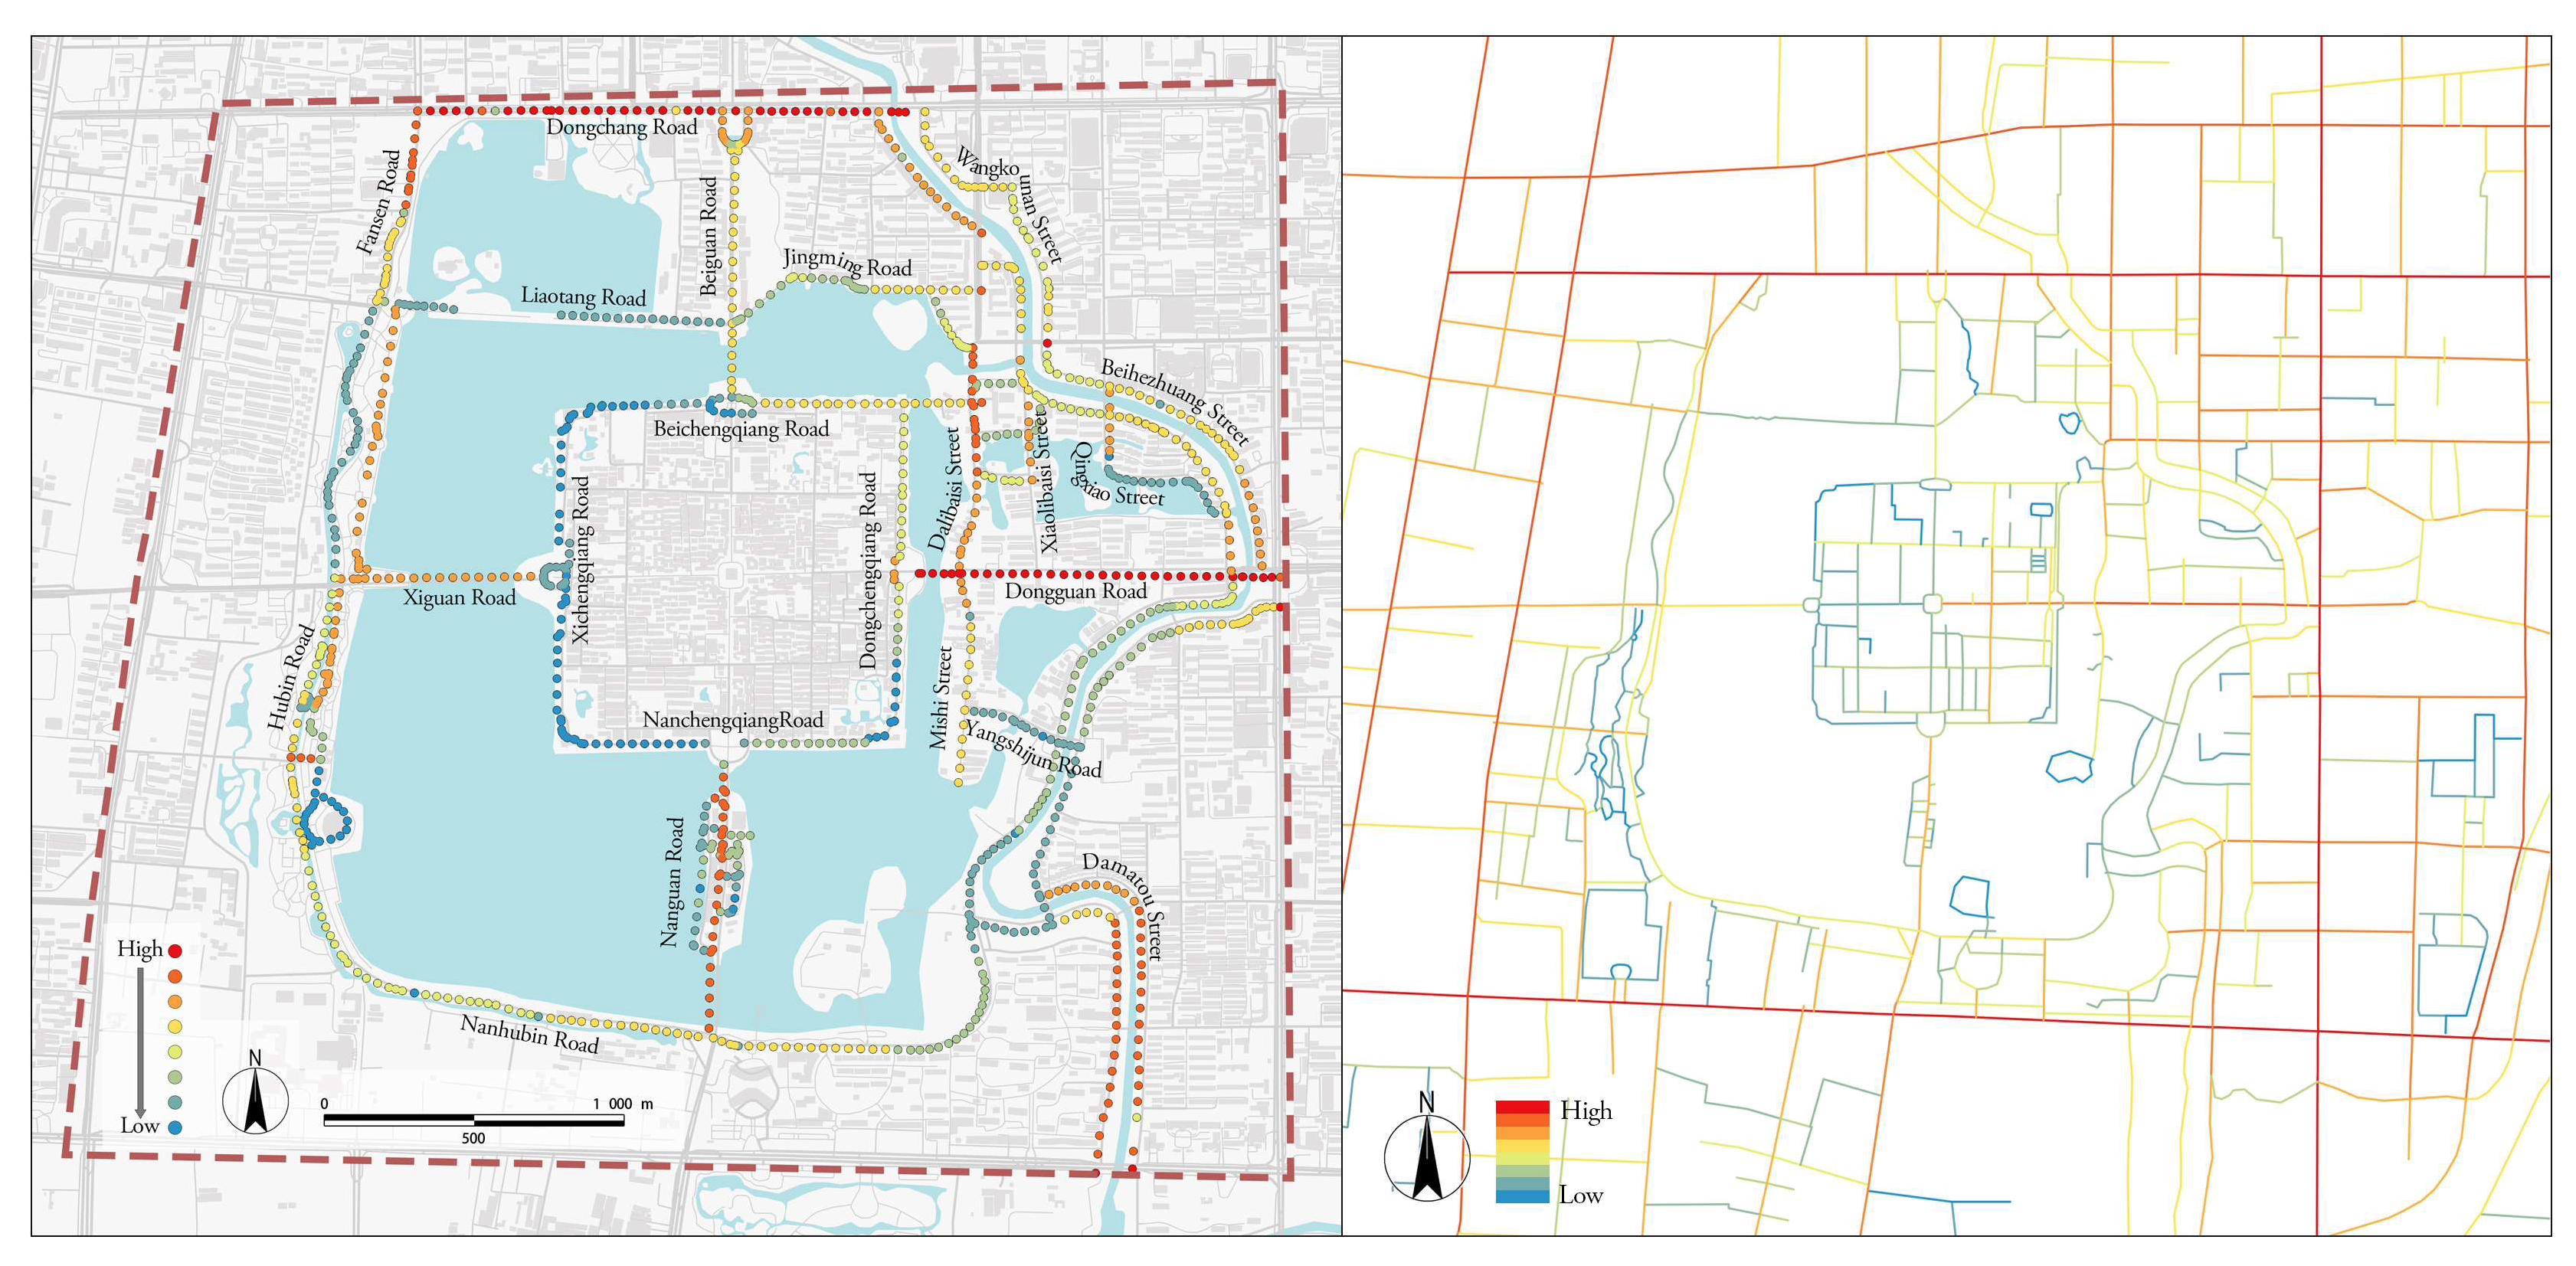
Analysis of street overall NQPDA values reveals distinct spatial patterns across the study area (Figure 12). Compared to the sample-wide mean (1.79), streets such as Dongchang Road, Dongguan Road, Dalibaisi Street, and Xiguan Road demonstrate notably higher overall NQPDA. These streets function as primary connectors between the historic district’s network and the external road system, serving as structural backbones that support significant pedestrian and vehicular flows. In contrast, streets including Xichengqiang Road, Liaotang Road, and Nanchengqiang Road show consistently low overall NQPDA values. This indicates their peripheral roles within the overall network, often functioning as dead-end segments or enclosed alleys with limited connectivity and poor accessibility at the global scale (Figure 13). The space syntax analysis at the overall scale effectively identifies core streets within the macro-level structure. Streets with strong structural properties require higher standards for visual perception quality, while those with weaker connectivity need corresponding improvements in both spatial configuration and perceptual experience.

4.4. Correlation Analysis

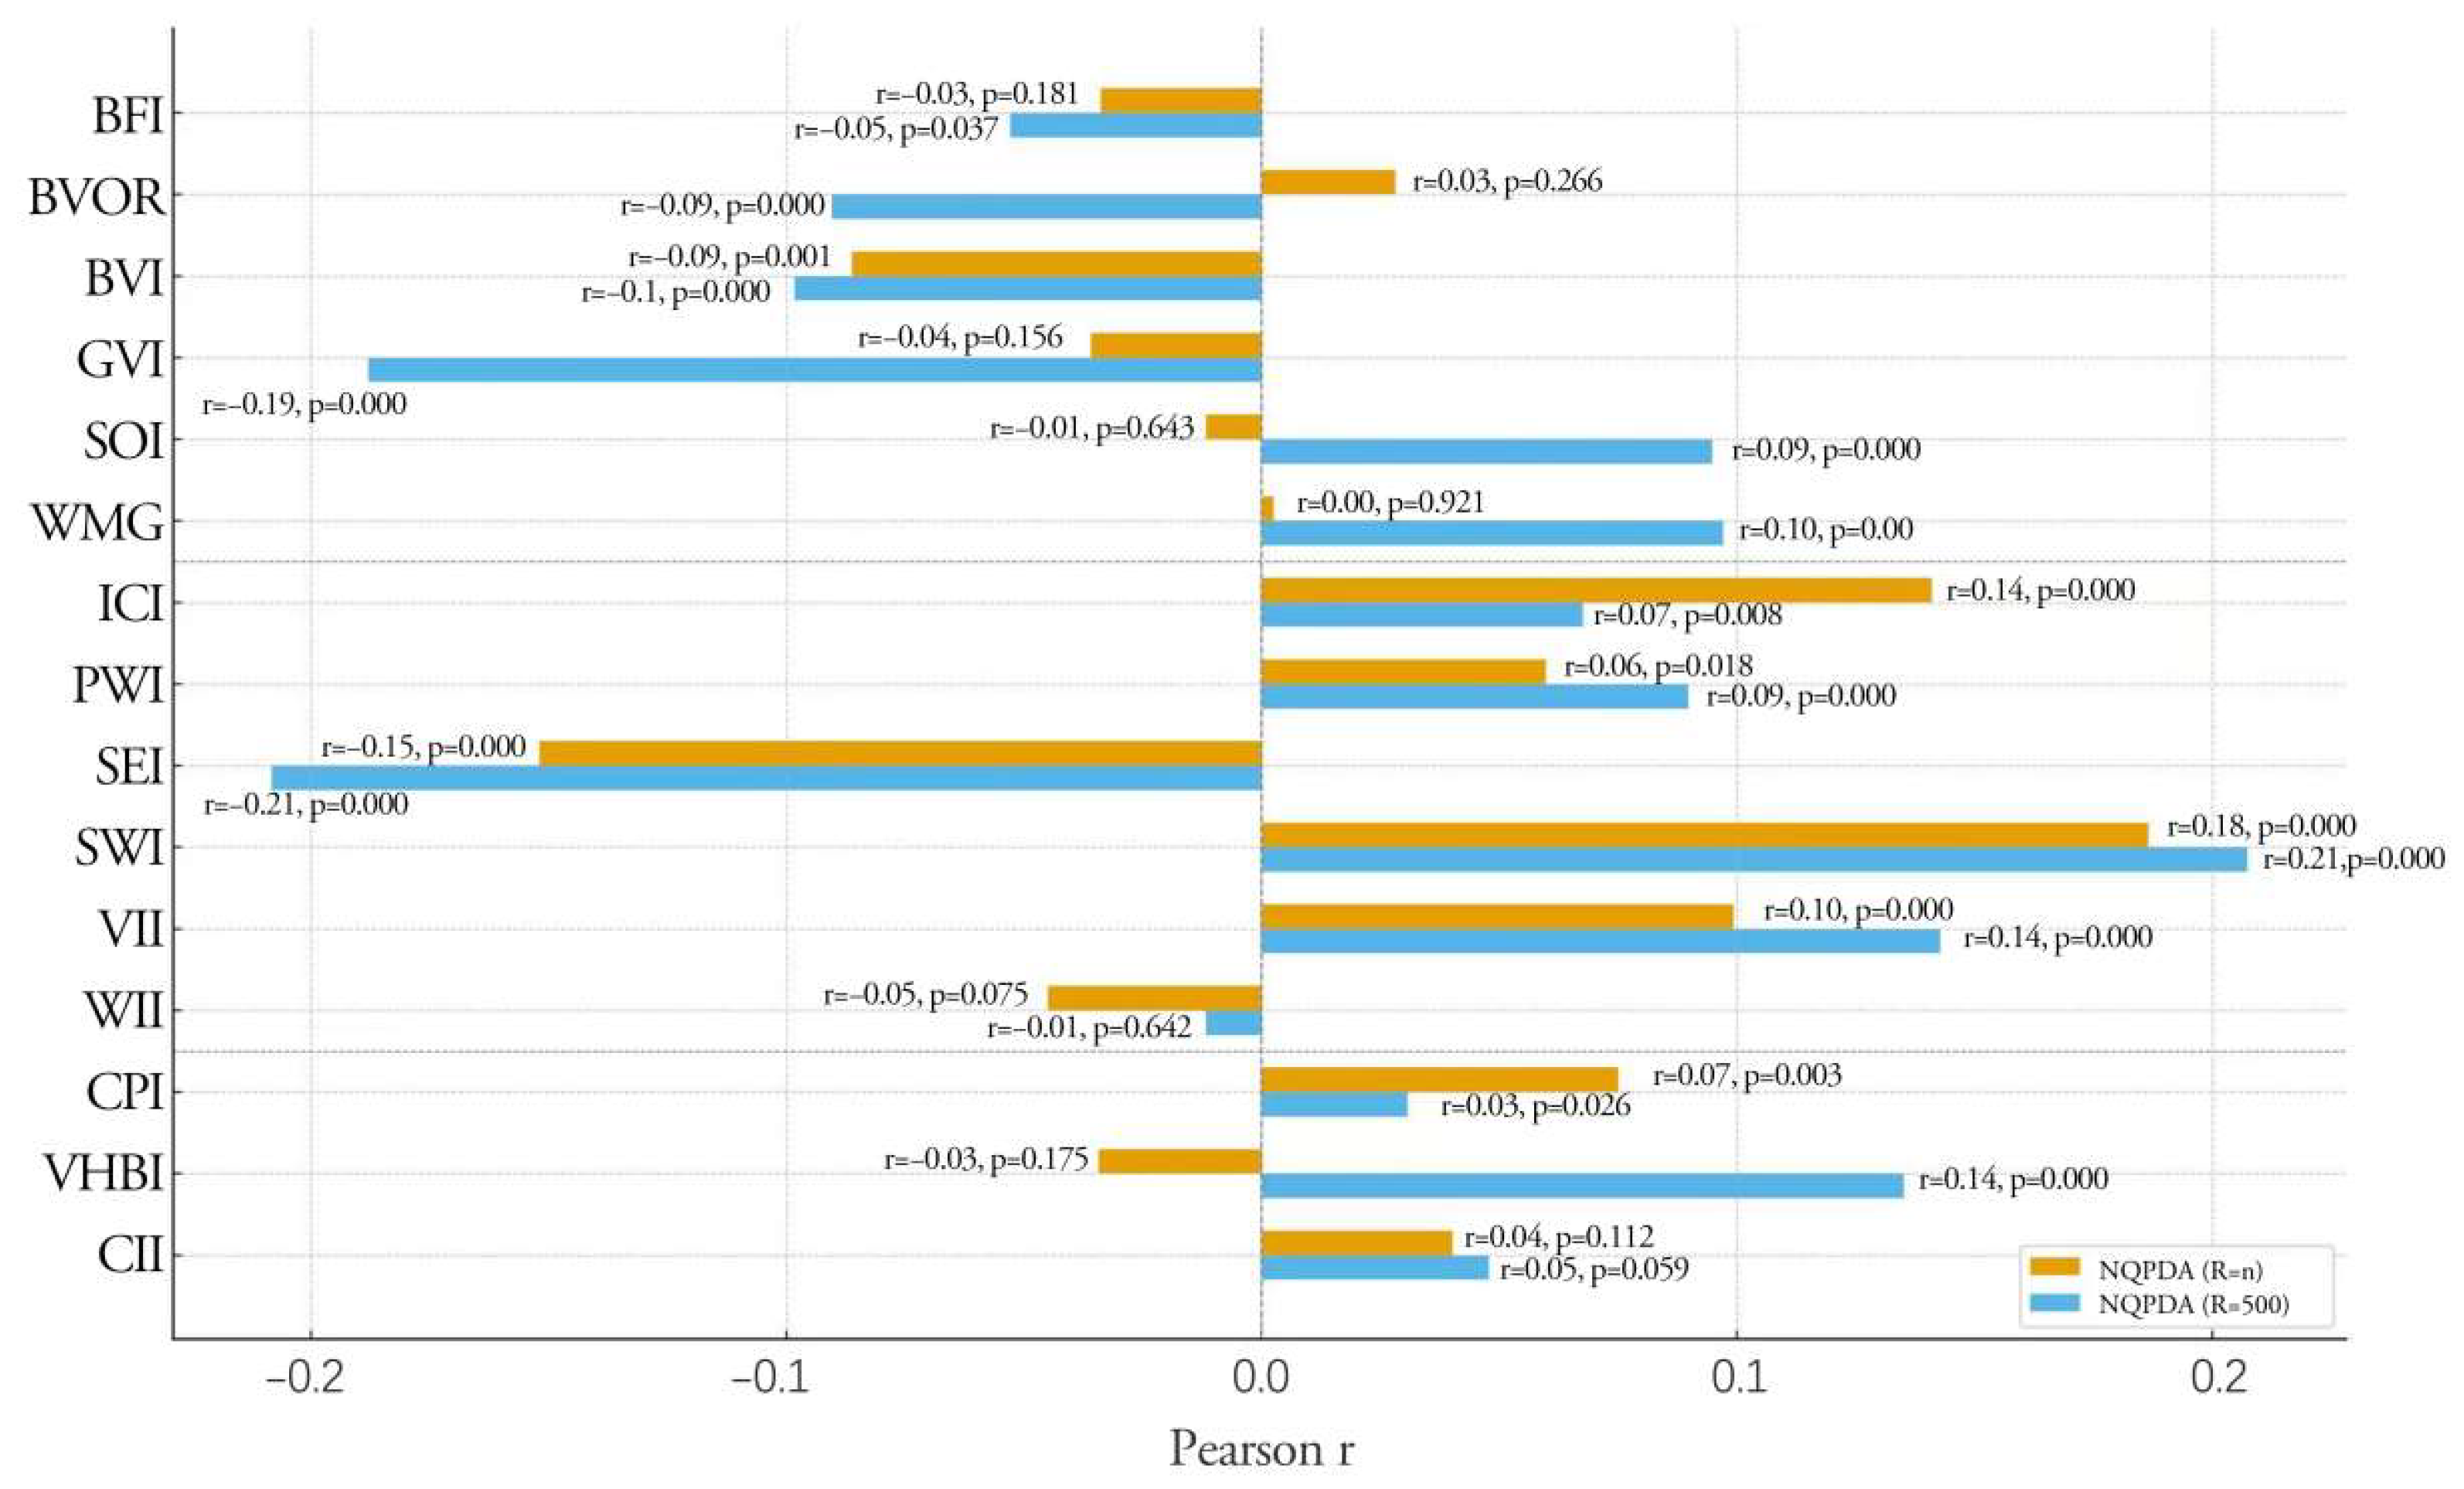
To further investigate the relationship between human behavior and visual perception across different scales, the study systematically examined the correlations between various visual perception indicators and NQPDA values at both overall and local levels. This analysis aims to quantitatively explore the degree of association between street spatial accessibility interacts with different types of visual elements (natural, artificial, and historical cultural). Figure 14 presents the correlation results between streetscape visual perception indicators and both overall and local NQPDA values. Overall, the correlation coefficients (r) range between −0.25 and 0.2, indicating generally weak relationships between spatial integration and visual indicators. This suggests that street accessibility and visual environment characteristics exhibit relatively independent variation patterns, with only a few indicators showing noticeable positive or negative trends.
Specifically, both the GVI and SOI demonstrate negative correlations with NQPDA, with the GVI (r = −0.19, p = 0.000) showing a more pronounced negative correlation at the local level. This indicates that streets with higher vegetation proportions are often associated with lower NQPDA values. The BVI (r = −0.009, p = 0.001) exhibits a slight negative correlation with overall NQPDA, while BFI (r = −0.03, p = 0.181) and BOVR (r = 0.03, p = 0.266) show minimal correlation, suggesting a limited degree of association between water-related visual elements and street accessibility. SEI displays the strongest negative correlation with NQPDA, indicating that highly enclosed streets are frequently observed together with lower local accessibility values. Meanwhile, PWI (r = 0.09, p = 0.000), ICI (r = 0.07, p = 0.008), and VII (r = 0.14, p = 0.000) show positive correlations with local NQPDA, reflecting that streets with higher NQPDA values tend to co-occur with stronger indicators of spatial vitality. Conversely, the WII (r = −0.01, p = 0.642) correlates negatively, suggesting that continuous street walls are associated with reduced spatial proximity. VHBI (r = 0.03, p = 0.175) demonstrates a relatively stronger correlation with overall NQPDA, whereas CII (r = 0.04, p = 0.112) and CPI (r = 0.07, p = 0.003) show weaker relationships. This indicates that areas with a higher concentration of historical buildings tend to coincide with better accessibility within the overall urban structure.

5. Comprehensive Evaluation

5.1. Comprehensive Measurement of Visual Perception

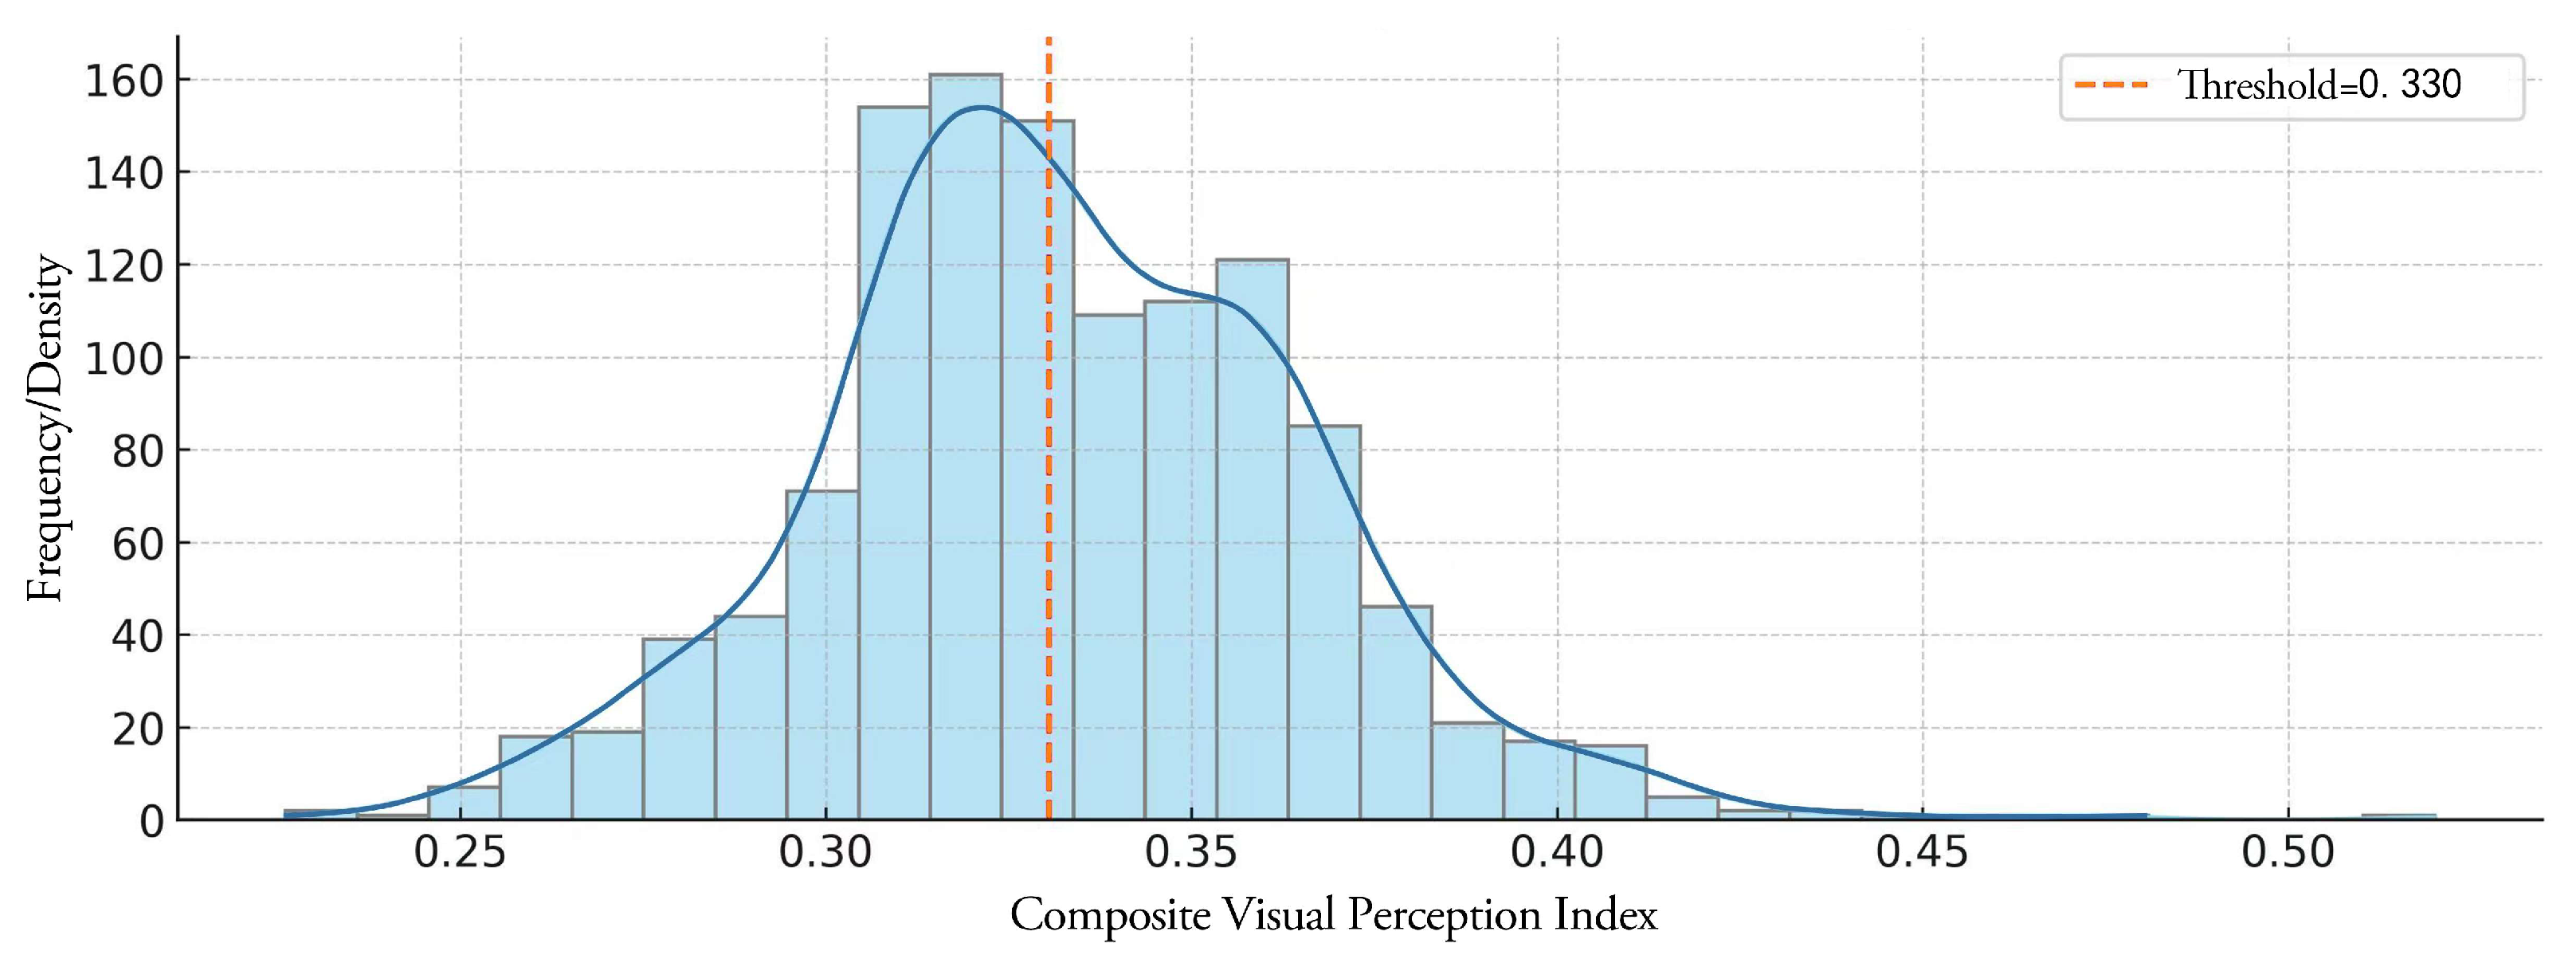
Based on the weightings of visual indicators determined by experts, each indicator was normalized and aggregated through weighted summation to calculate a comprehensive visual perception index for each sampling point. The calculation process is detailed as follows. Statistical analysis of the composite visual perception indices across all sampling points is presented in Figure 15. The overall distribution of the data exhibits a unimodal pattern, with the predominant peak concentrated in the 0.30–0.35 range. This indicates that most sampling points demonstrate a moderate level, reflecting relatively balanced visual quality across the study area. Furthermore, the number of sampling points below the mean value slightly exceeds those with higher perception scores, suggesting there remains potential for enhancing the visual perception quality of Liaocheng’s waterfront streets (Figure 15).
Normalization Formula [66]:
X j i = X j i m i n ( X j ) m a x ( X j ) m i n ( X j )
CVPI (Composite Visual Perception Index) Calculation Formula:
S i = j = 1 n W j × X j i
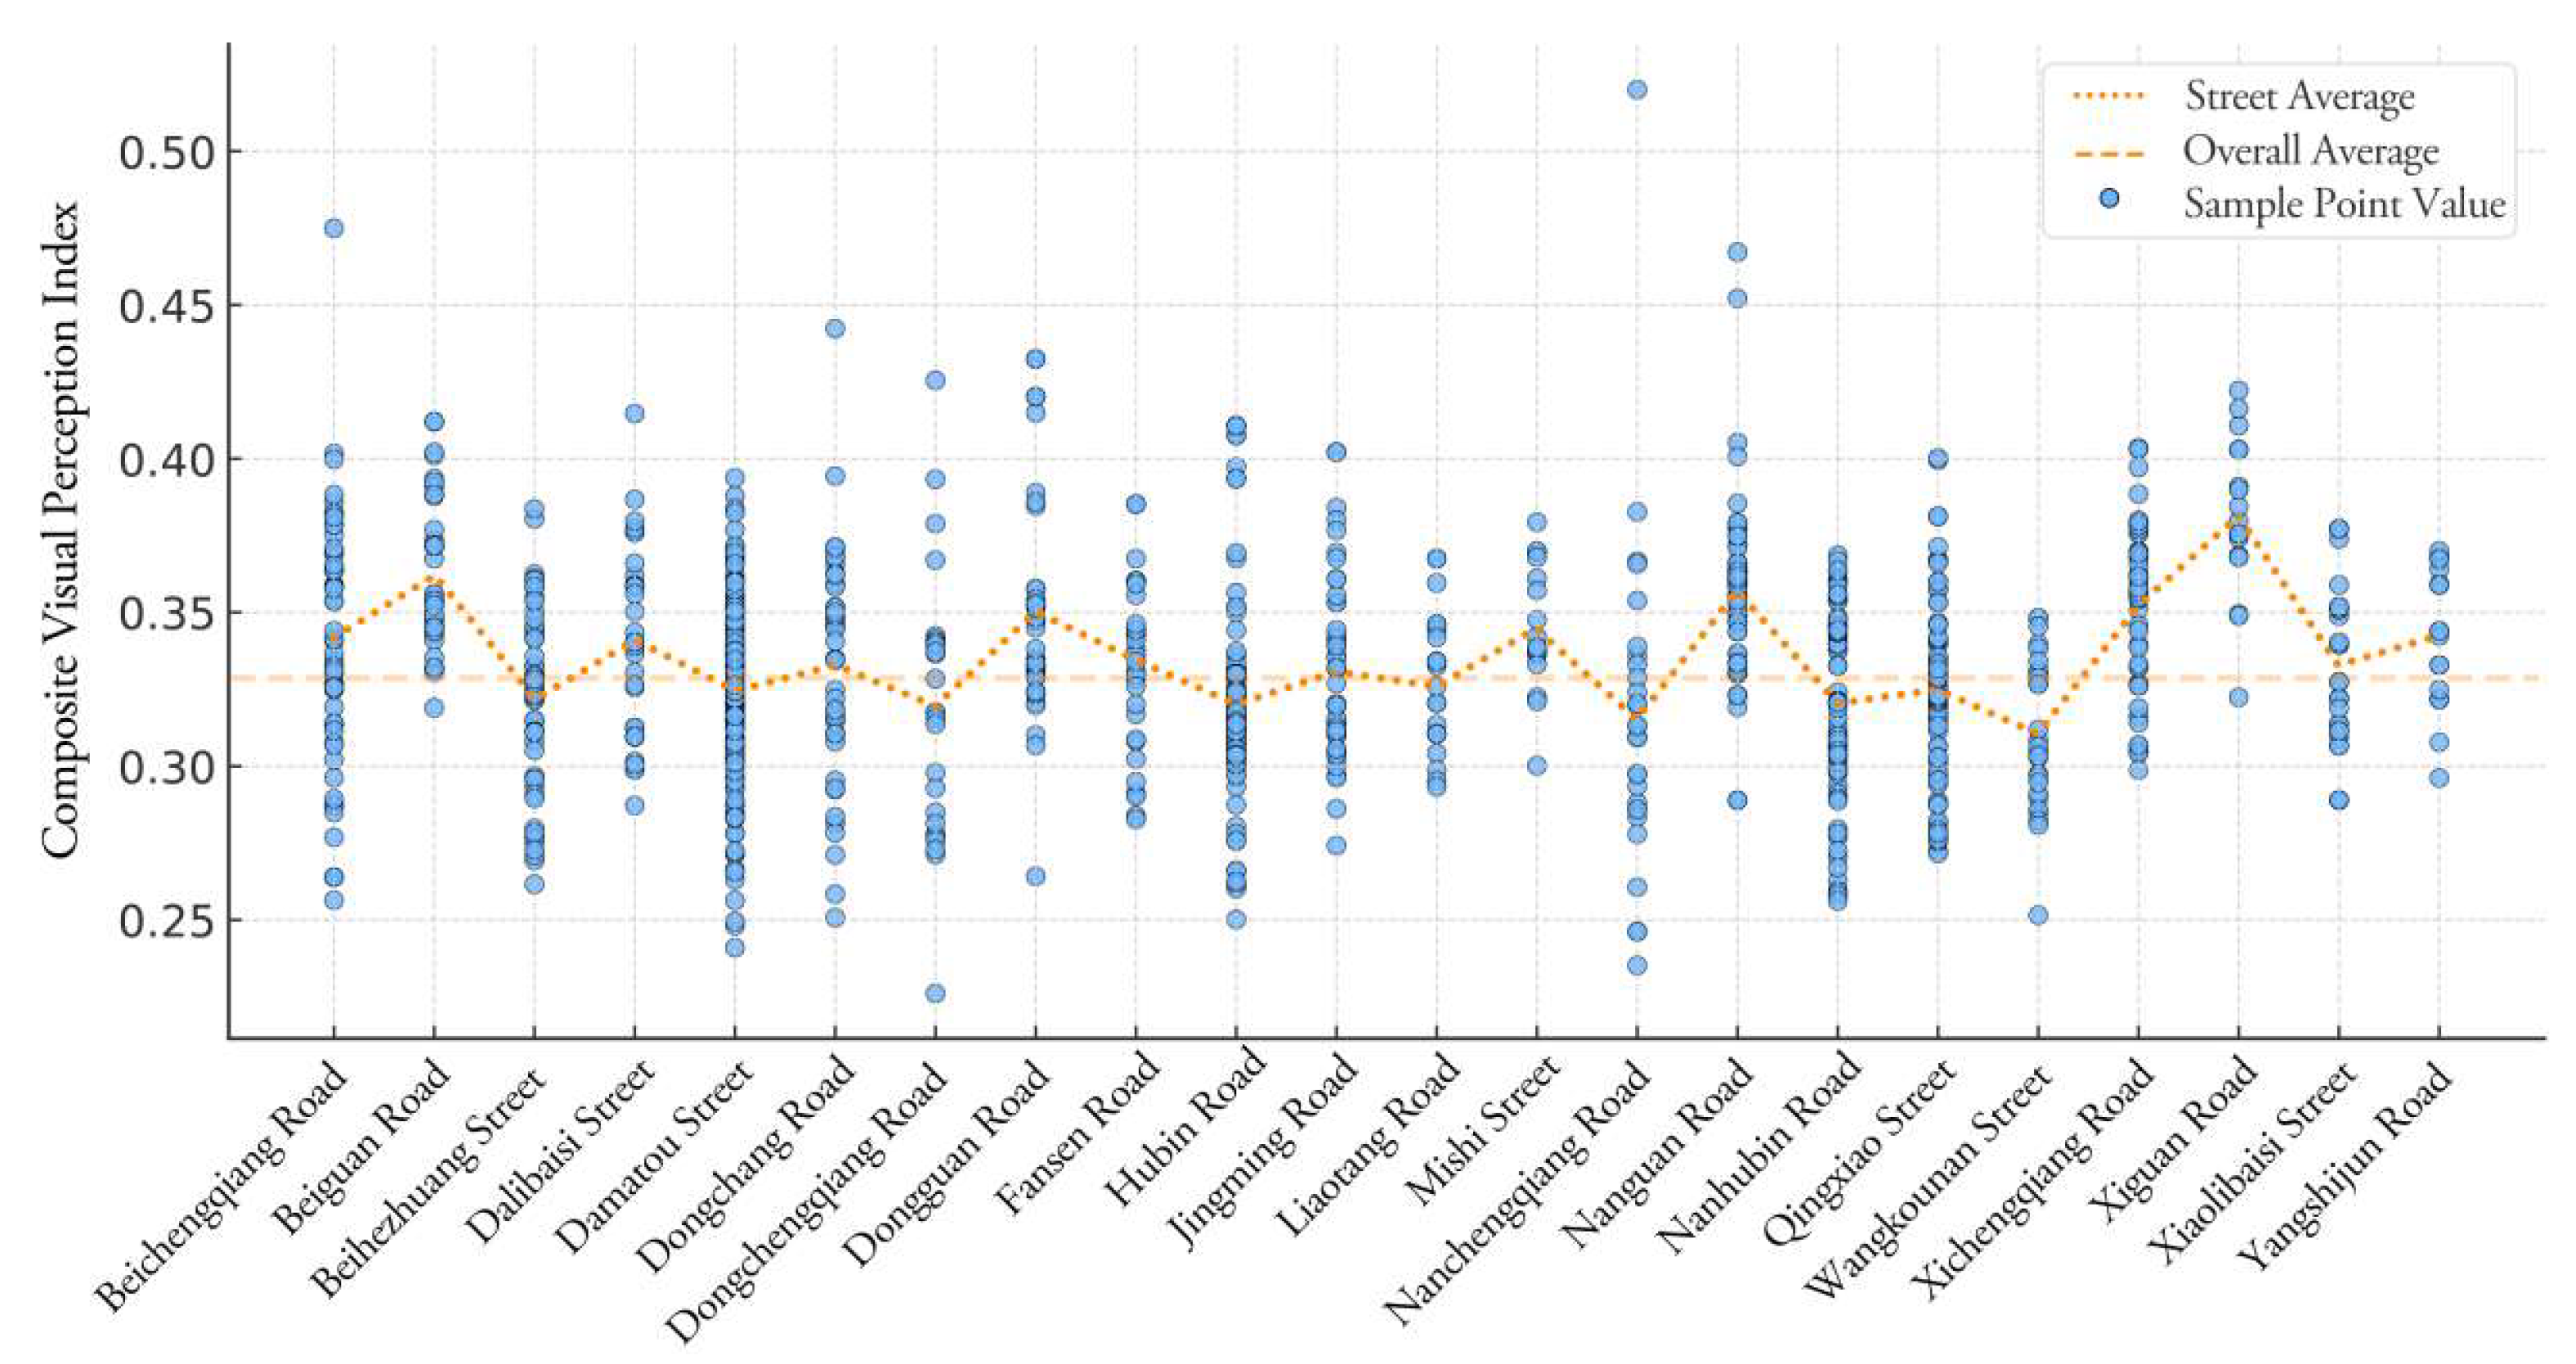
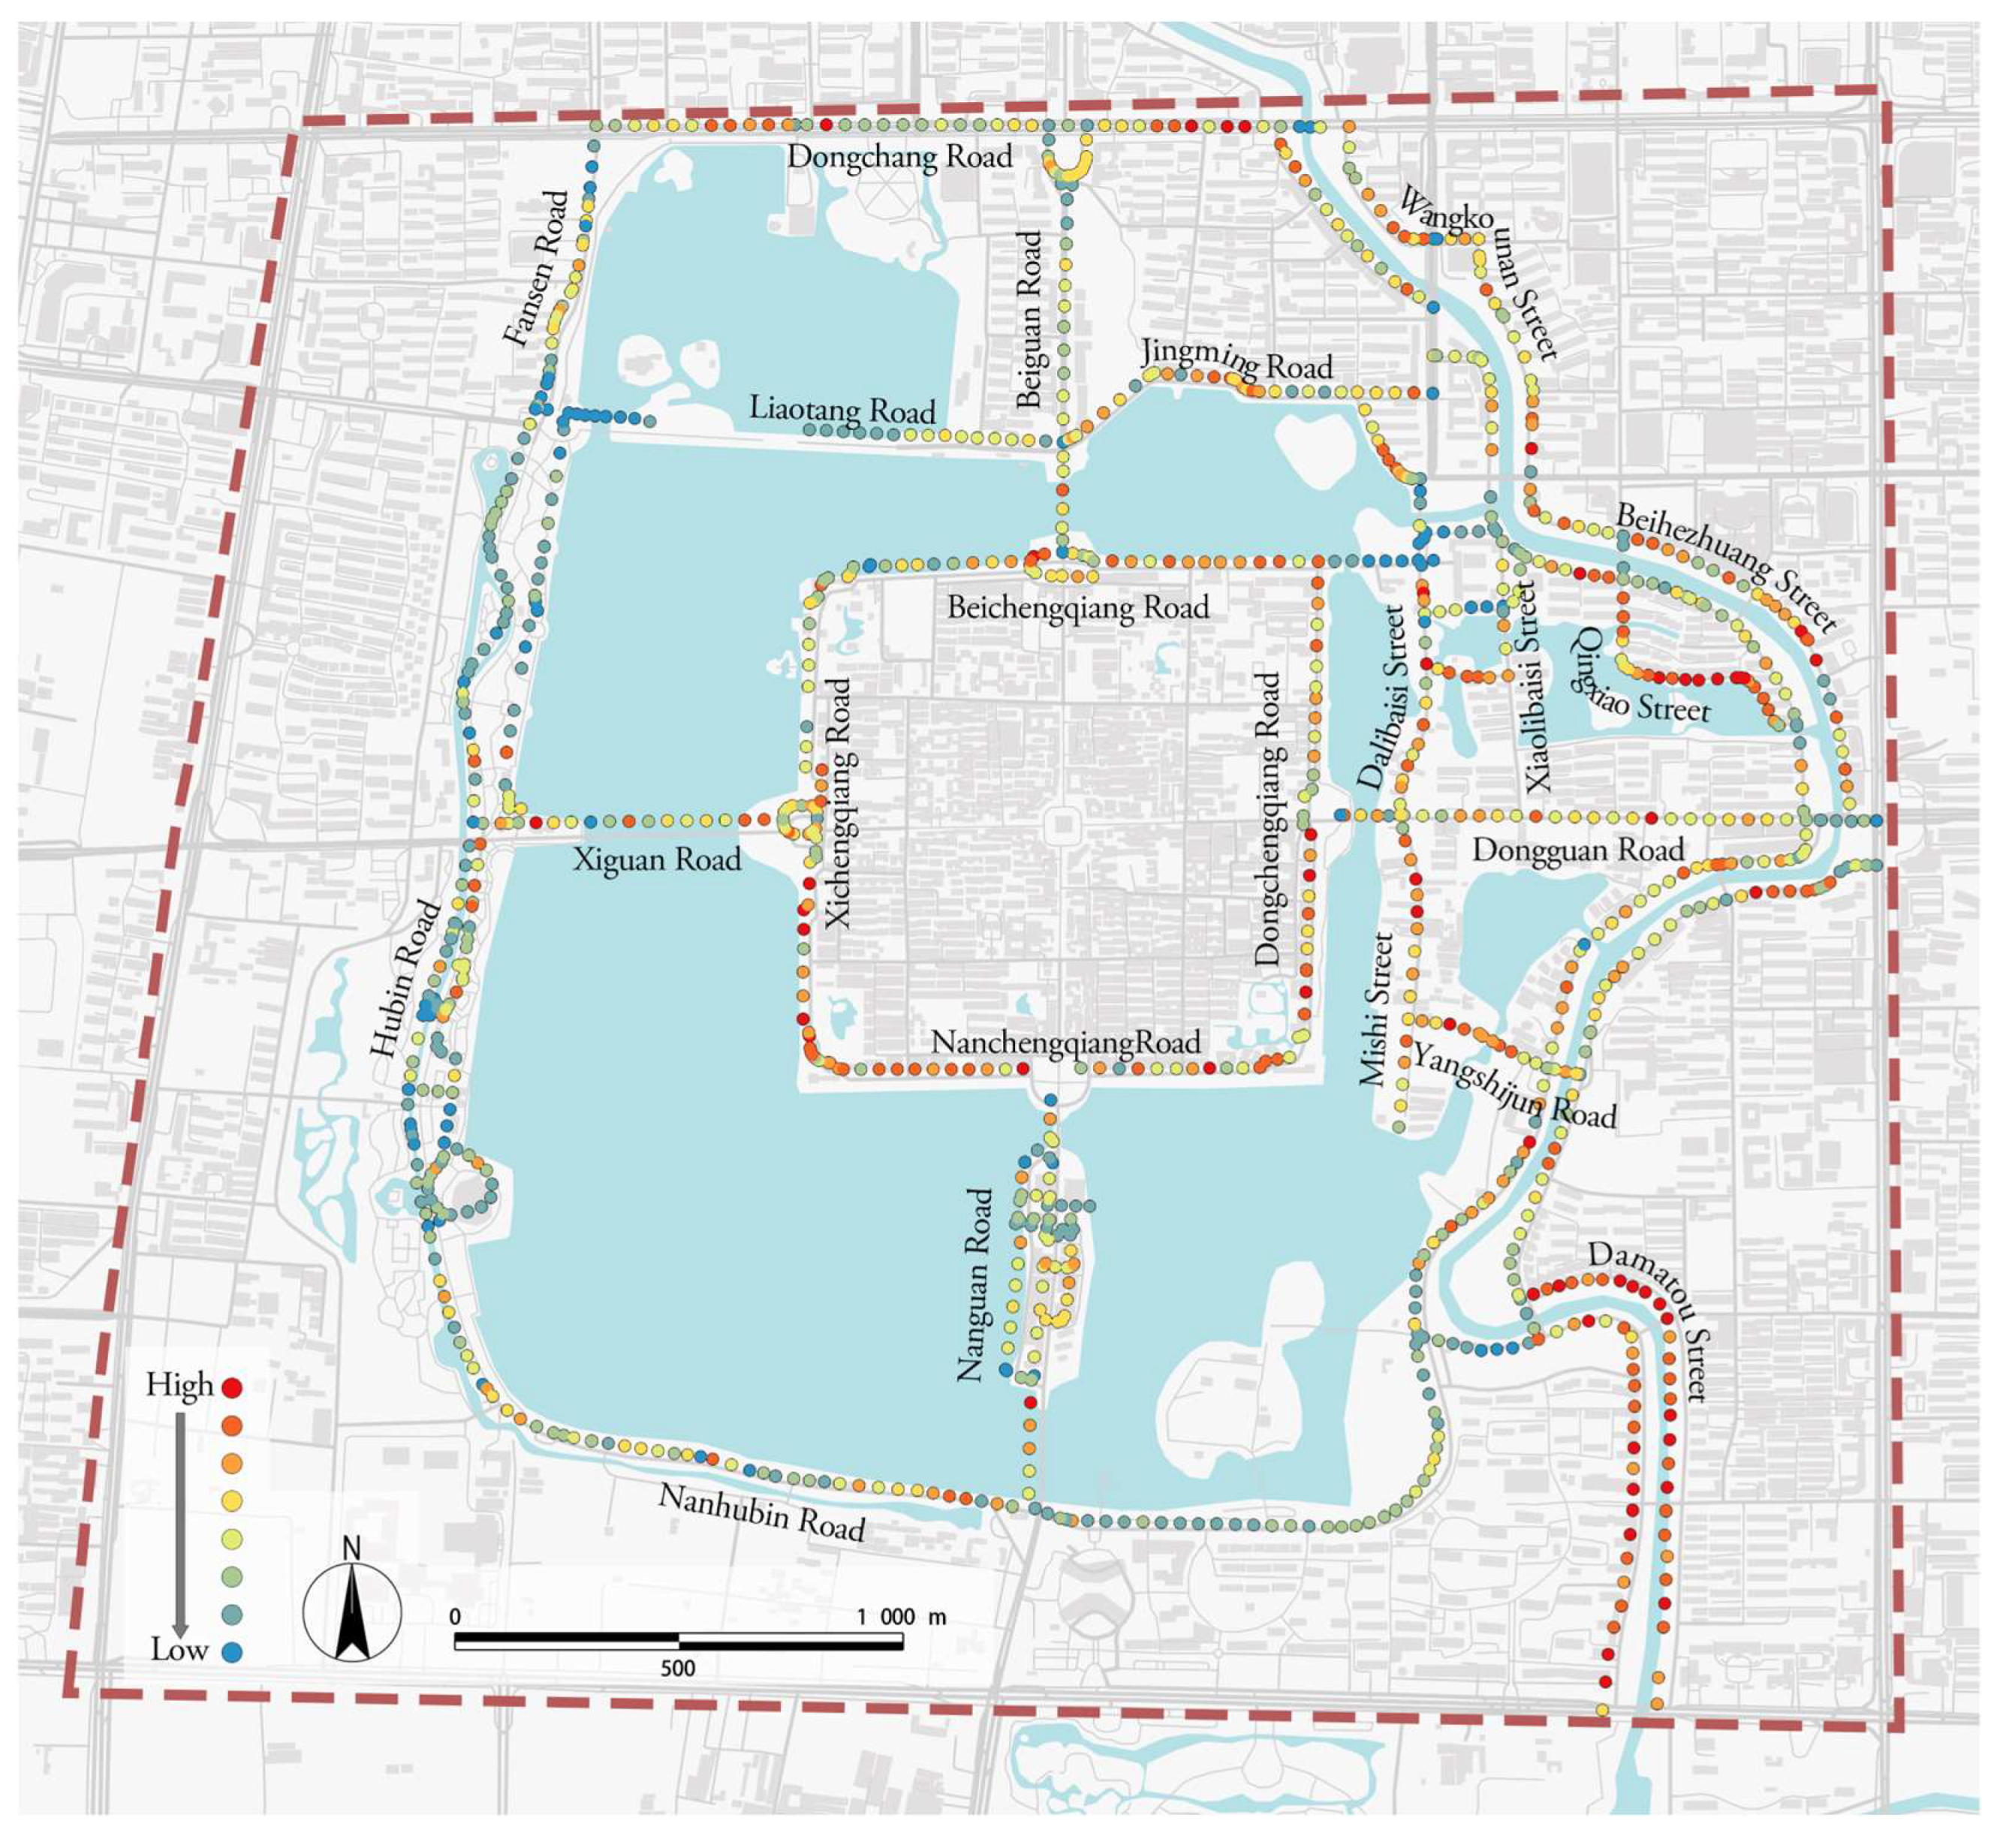
By analyzing the CVPI values at the sampling point level and aggregating them by street, the overall visual perception quality of each street can be assessed (Figure 16). This analysis is further supported by spatial mapping and classification based on score levels (Figure 17). The results indicate that streets such as Xiguan Road, Nanguan Road, Beiguan Road, and Xichengqiang Road exhibit relatively high average Composite visual perception indices. These streets demonstrate favorable overall visual quality, characterized by abundant natural landscape elements, satisfactory artificial comfort, and a rich historical cultural atmosphere. Specifically, most of these streets are closely associated with natural elements like greenery and water systems, and are lined with historical buildings, often representing old urban lanes with long evolutionary histories. Streets including Mishi Street, Beichengqiang Road, and Xichengqiang Road show concentrated value distributions, indicating relatively uniform perception levels along these streets and high spatial environmental consistency. However, some streets contain individual sampling points with abnormally low values, identifying specific locations requiring focused attention. Peripheral streets such as Wangkou South Street and Hubin Road demonstrate lower values, reflecting generally poorer visual quality in these areas.

5.2. Correlation Analysis

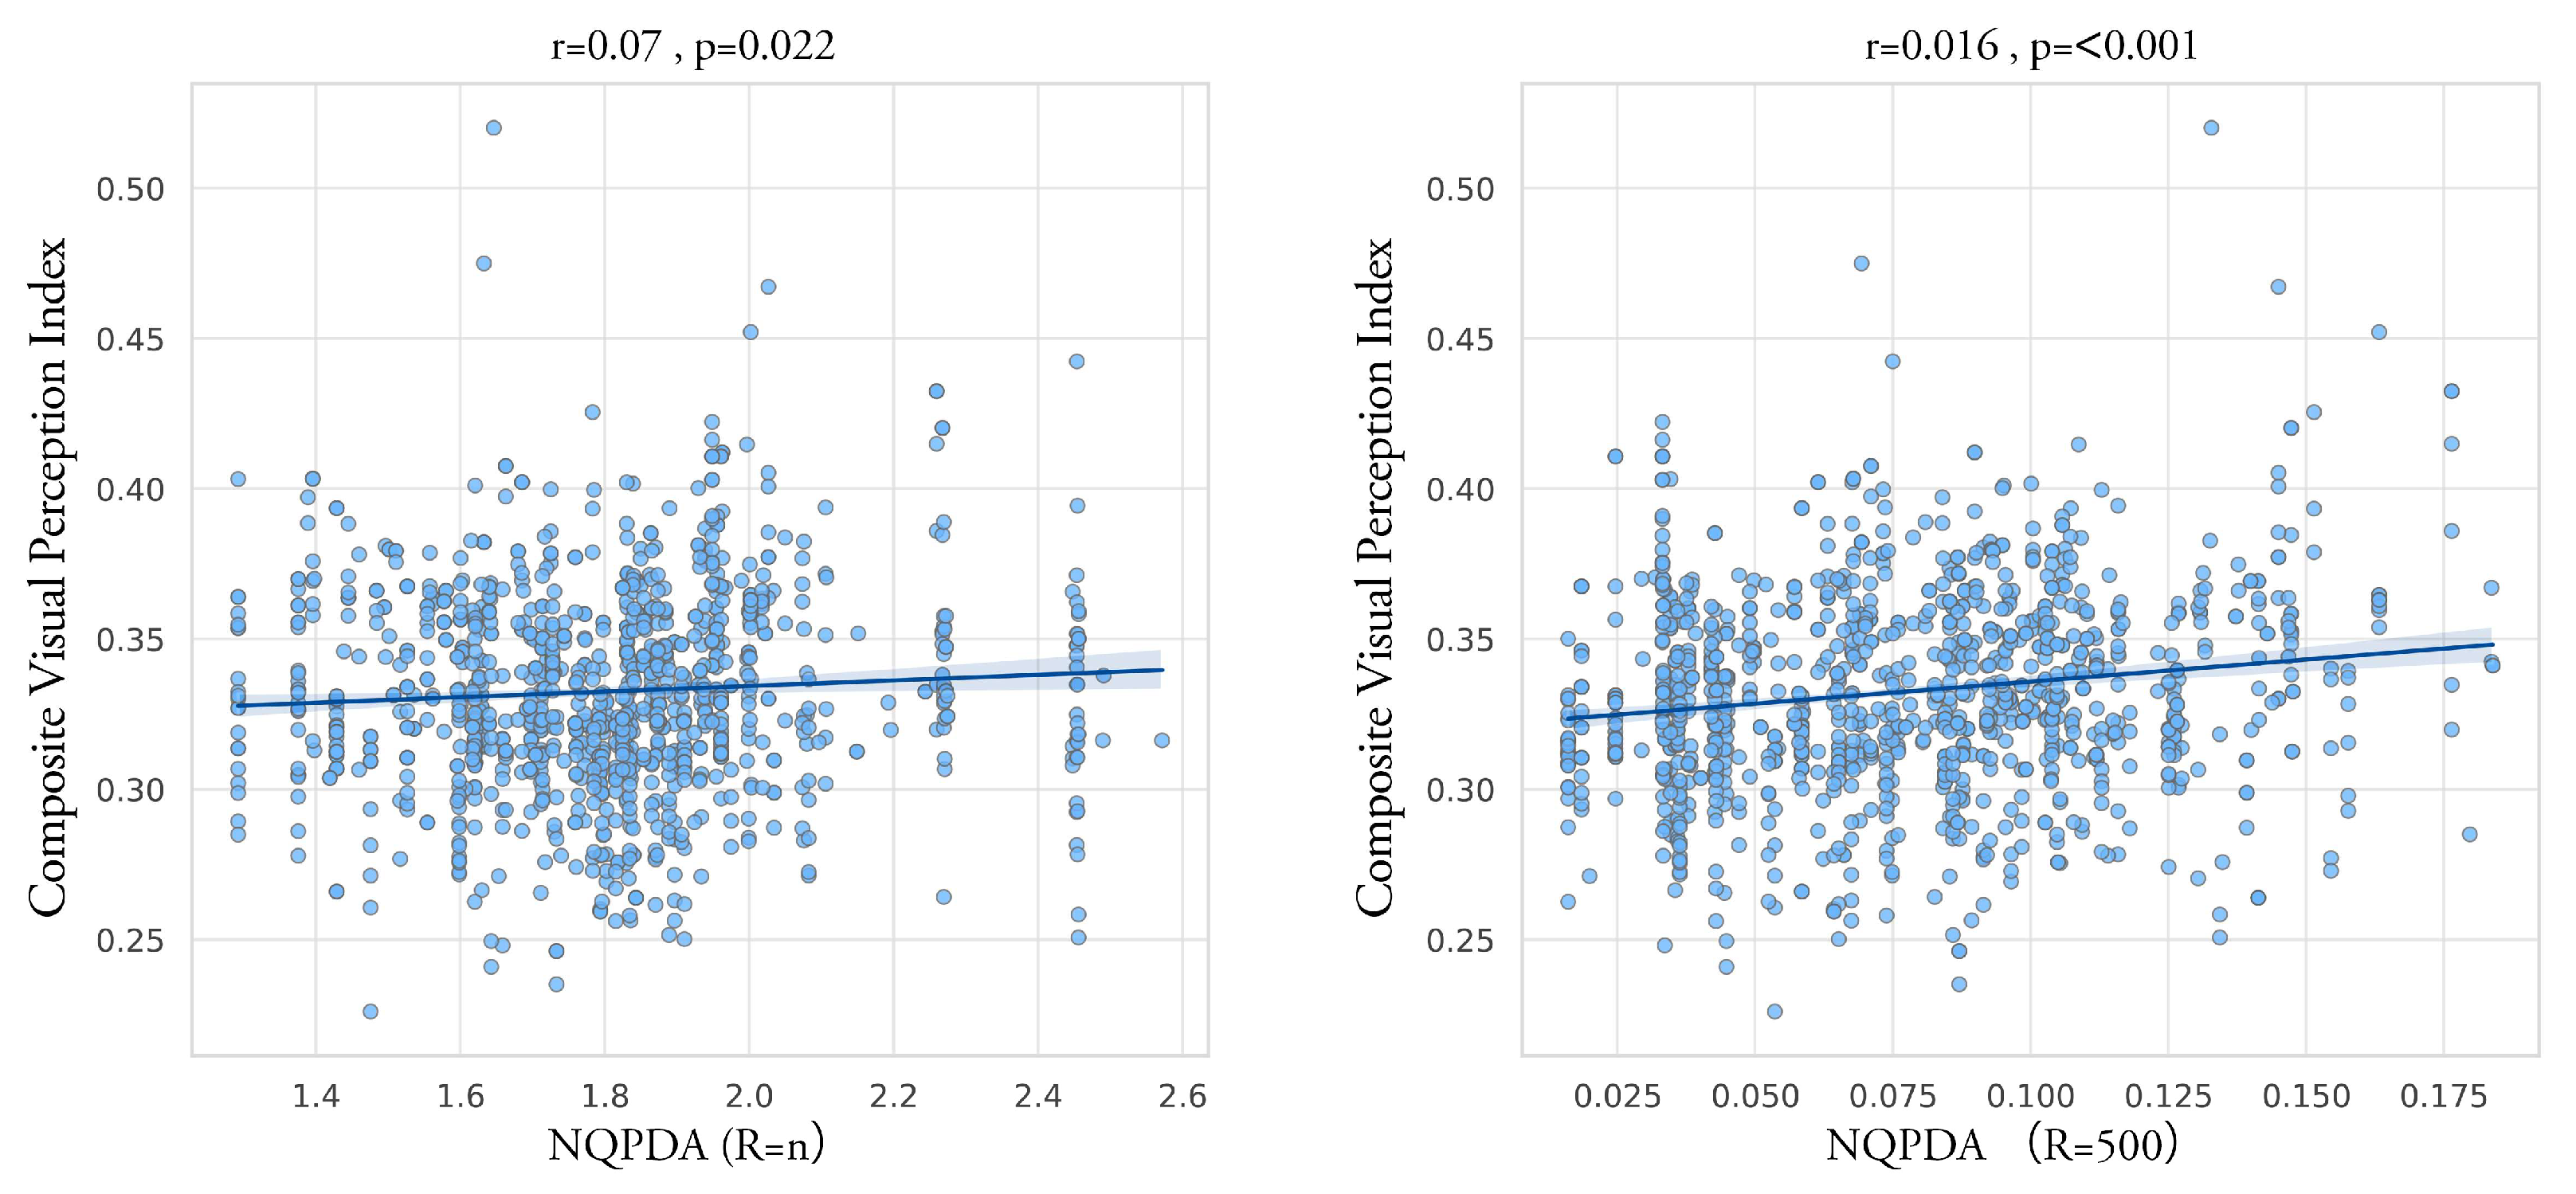
To explore the relationship, a Pearson correlation analysis was conducted among three indicators: overall NQPDA, local NQPDA, and CVPI. Pearson correlation analysis was primarily employed in this study to identify structural association patterns between visual perception and spatial accessibility, rather than to establish causal relationships. The results are shown in Figure 18.
A weak but statistically significant positive correlation was observed between overall NQPDA and CVPI (r > 0, p < 0.05). This indicates that, from a spatial-structural perspective, streets with higher levels of global spatial configuration quality tend to be associated with relatively better visual perceptual performance. However, the limited strength of this correlation suggests that spatial accessibility alone provides insufficient explanatory power for variations in streetscape visual perception quality. Similarly, local NQPDA also exhibited a statistically significant but weak positive correlation with CVPI (p < 0.01). This result implies that, at the pedestrian scale, local spatial accessibility and visual quality may demonstrate a tendency toward coordination, although no strong linear relationship is evident between the two.
From a strictly statistical standpoint, the observed weak correlations do not conform to the typical expectation of correlation analysis aimed at identifying clear causal relationships between variables. Nevertheless, from a theoretical perspective, these findings still offer important research insights. First, the results suggest that the formation and performance of streetscape visual quality are governed by non-linear and complex mechanisms, jointly influenced by multiple variables, including historical and cultural accumulation as well as socio-economic development. Moreover, the weak association between spatial accessibility and visual perception highlights a lack of integrated consideration in current street development, indicating the need to further enhance their coordinated relationship. Accordingly, achieving improvements in streetscape visual spatial quality requires a combined and coordinated approach through typological classification and targeted diagnosis.

5.3. Overlay Analysis

5.3.1. Three-Dimensional Comprehensive Diagnosis and Evaluation

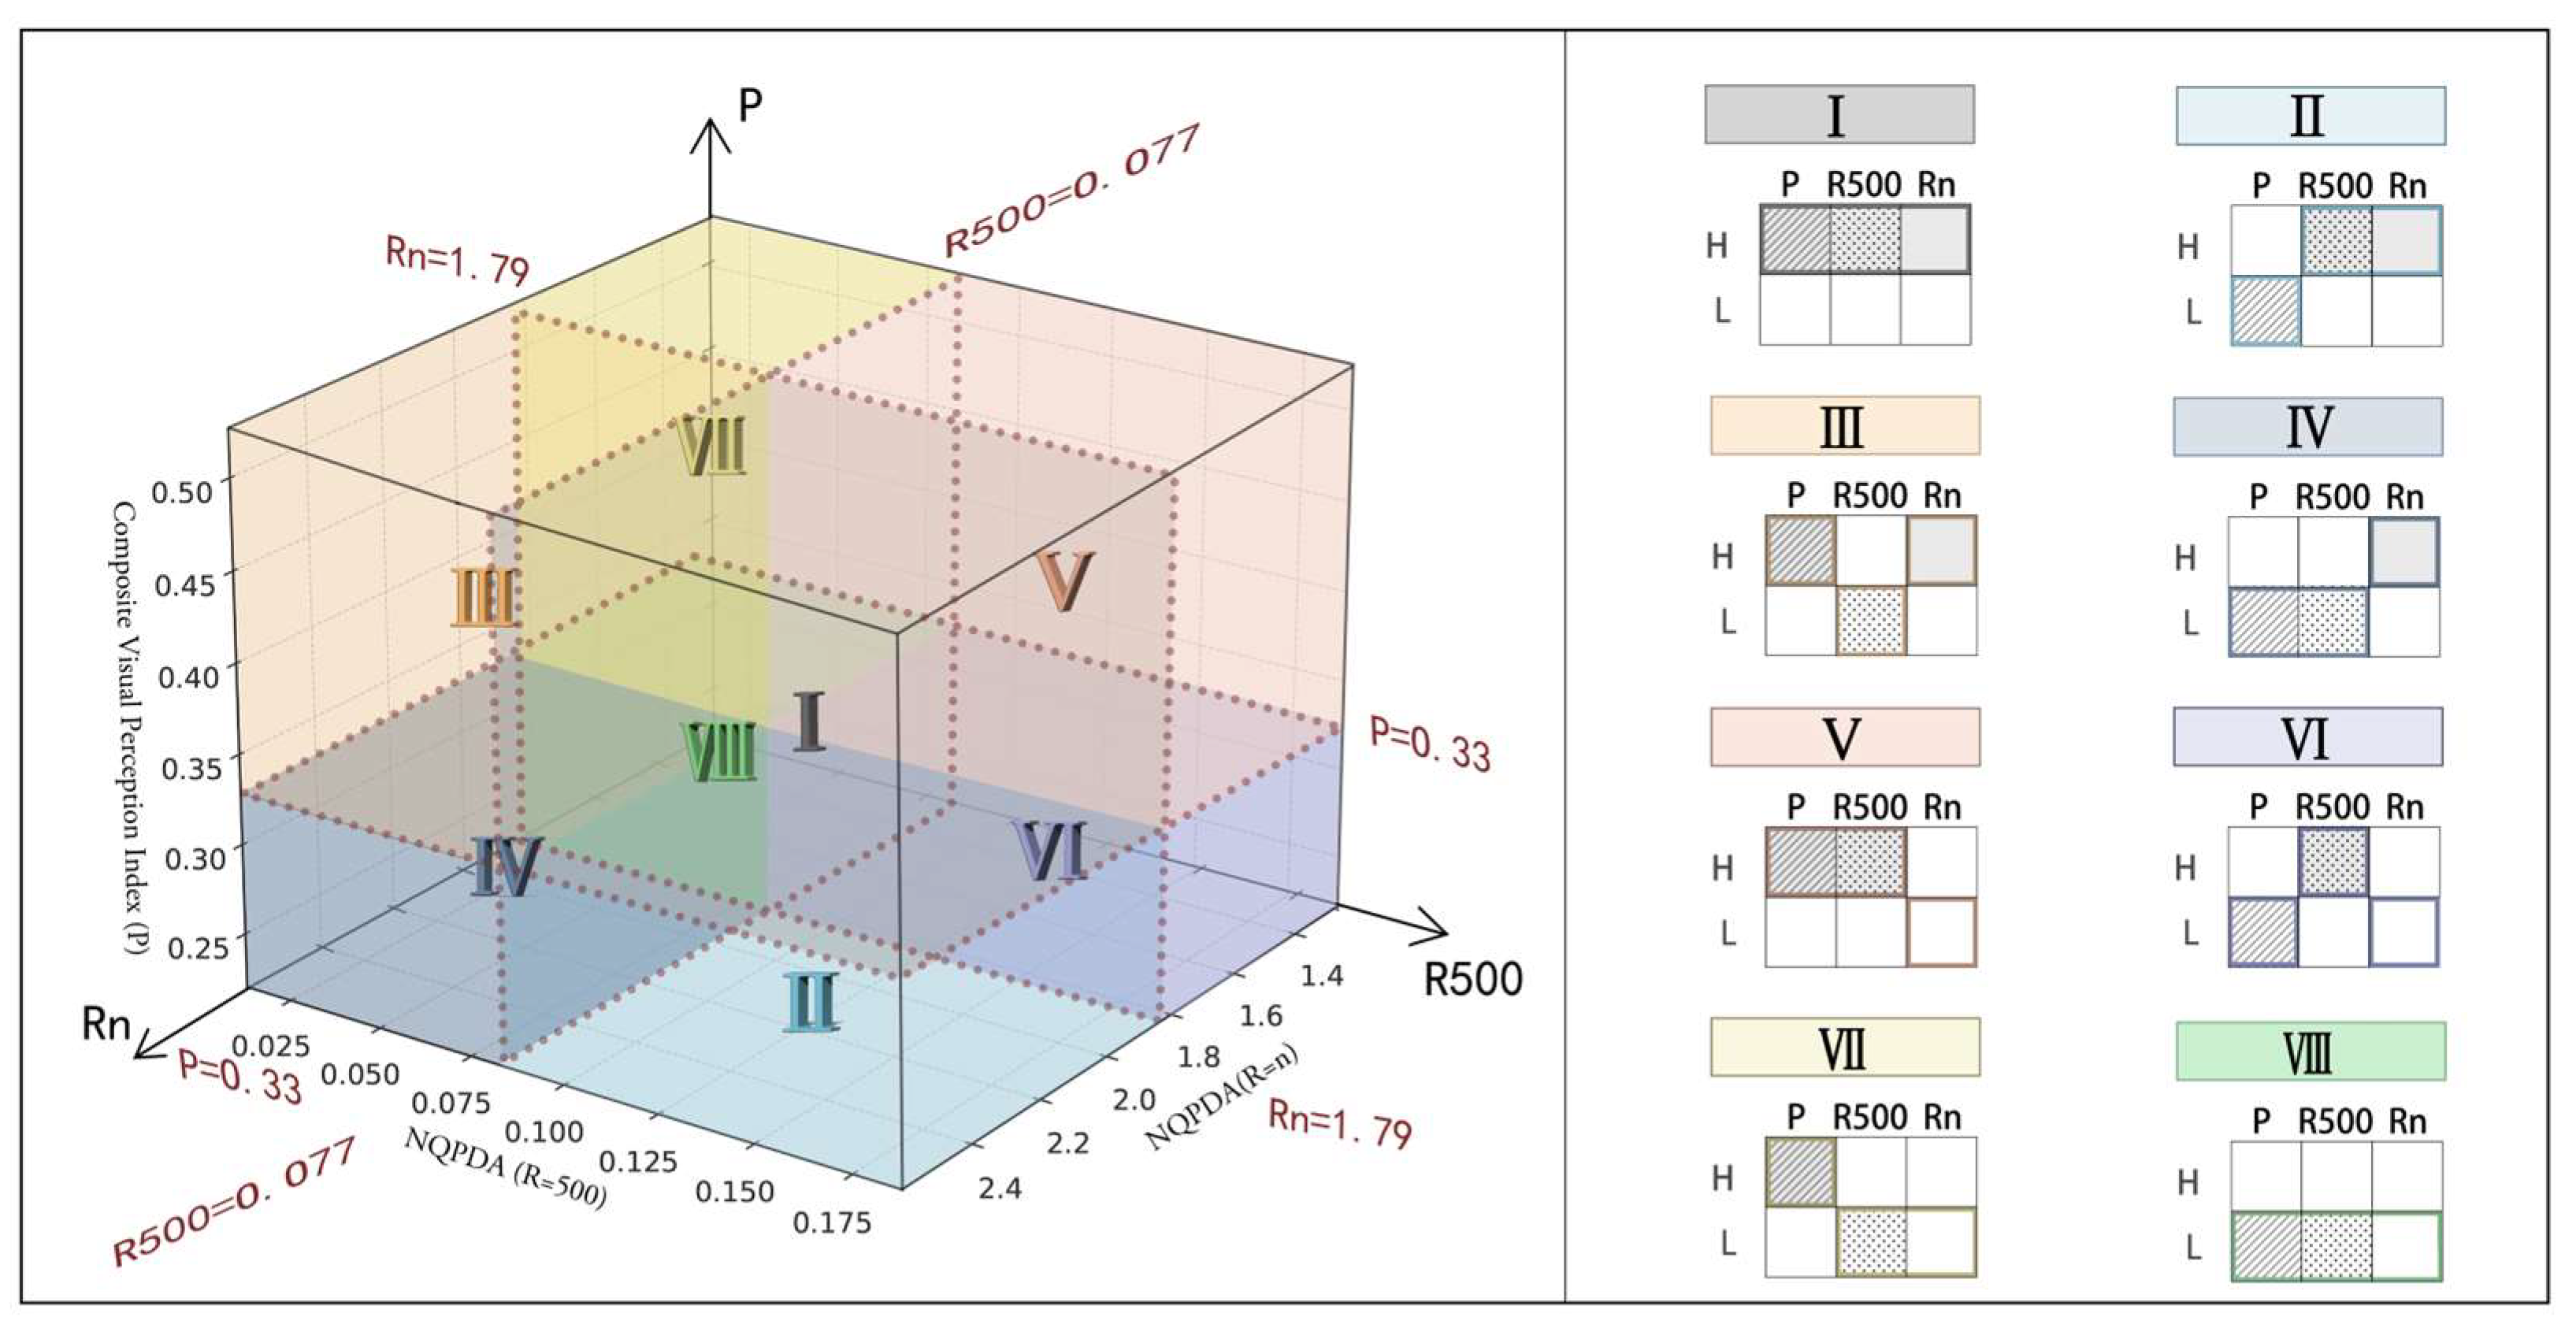
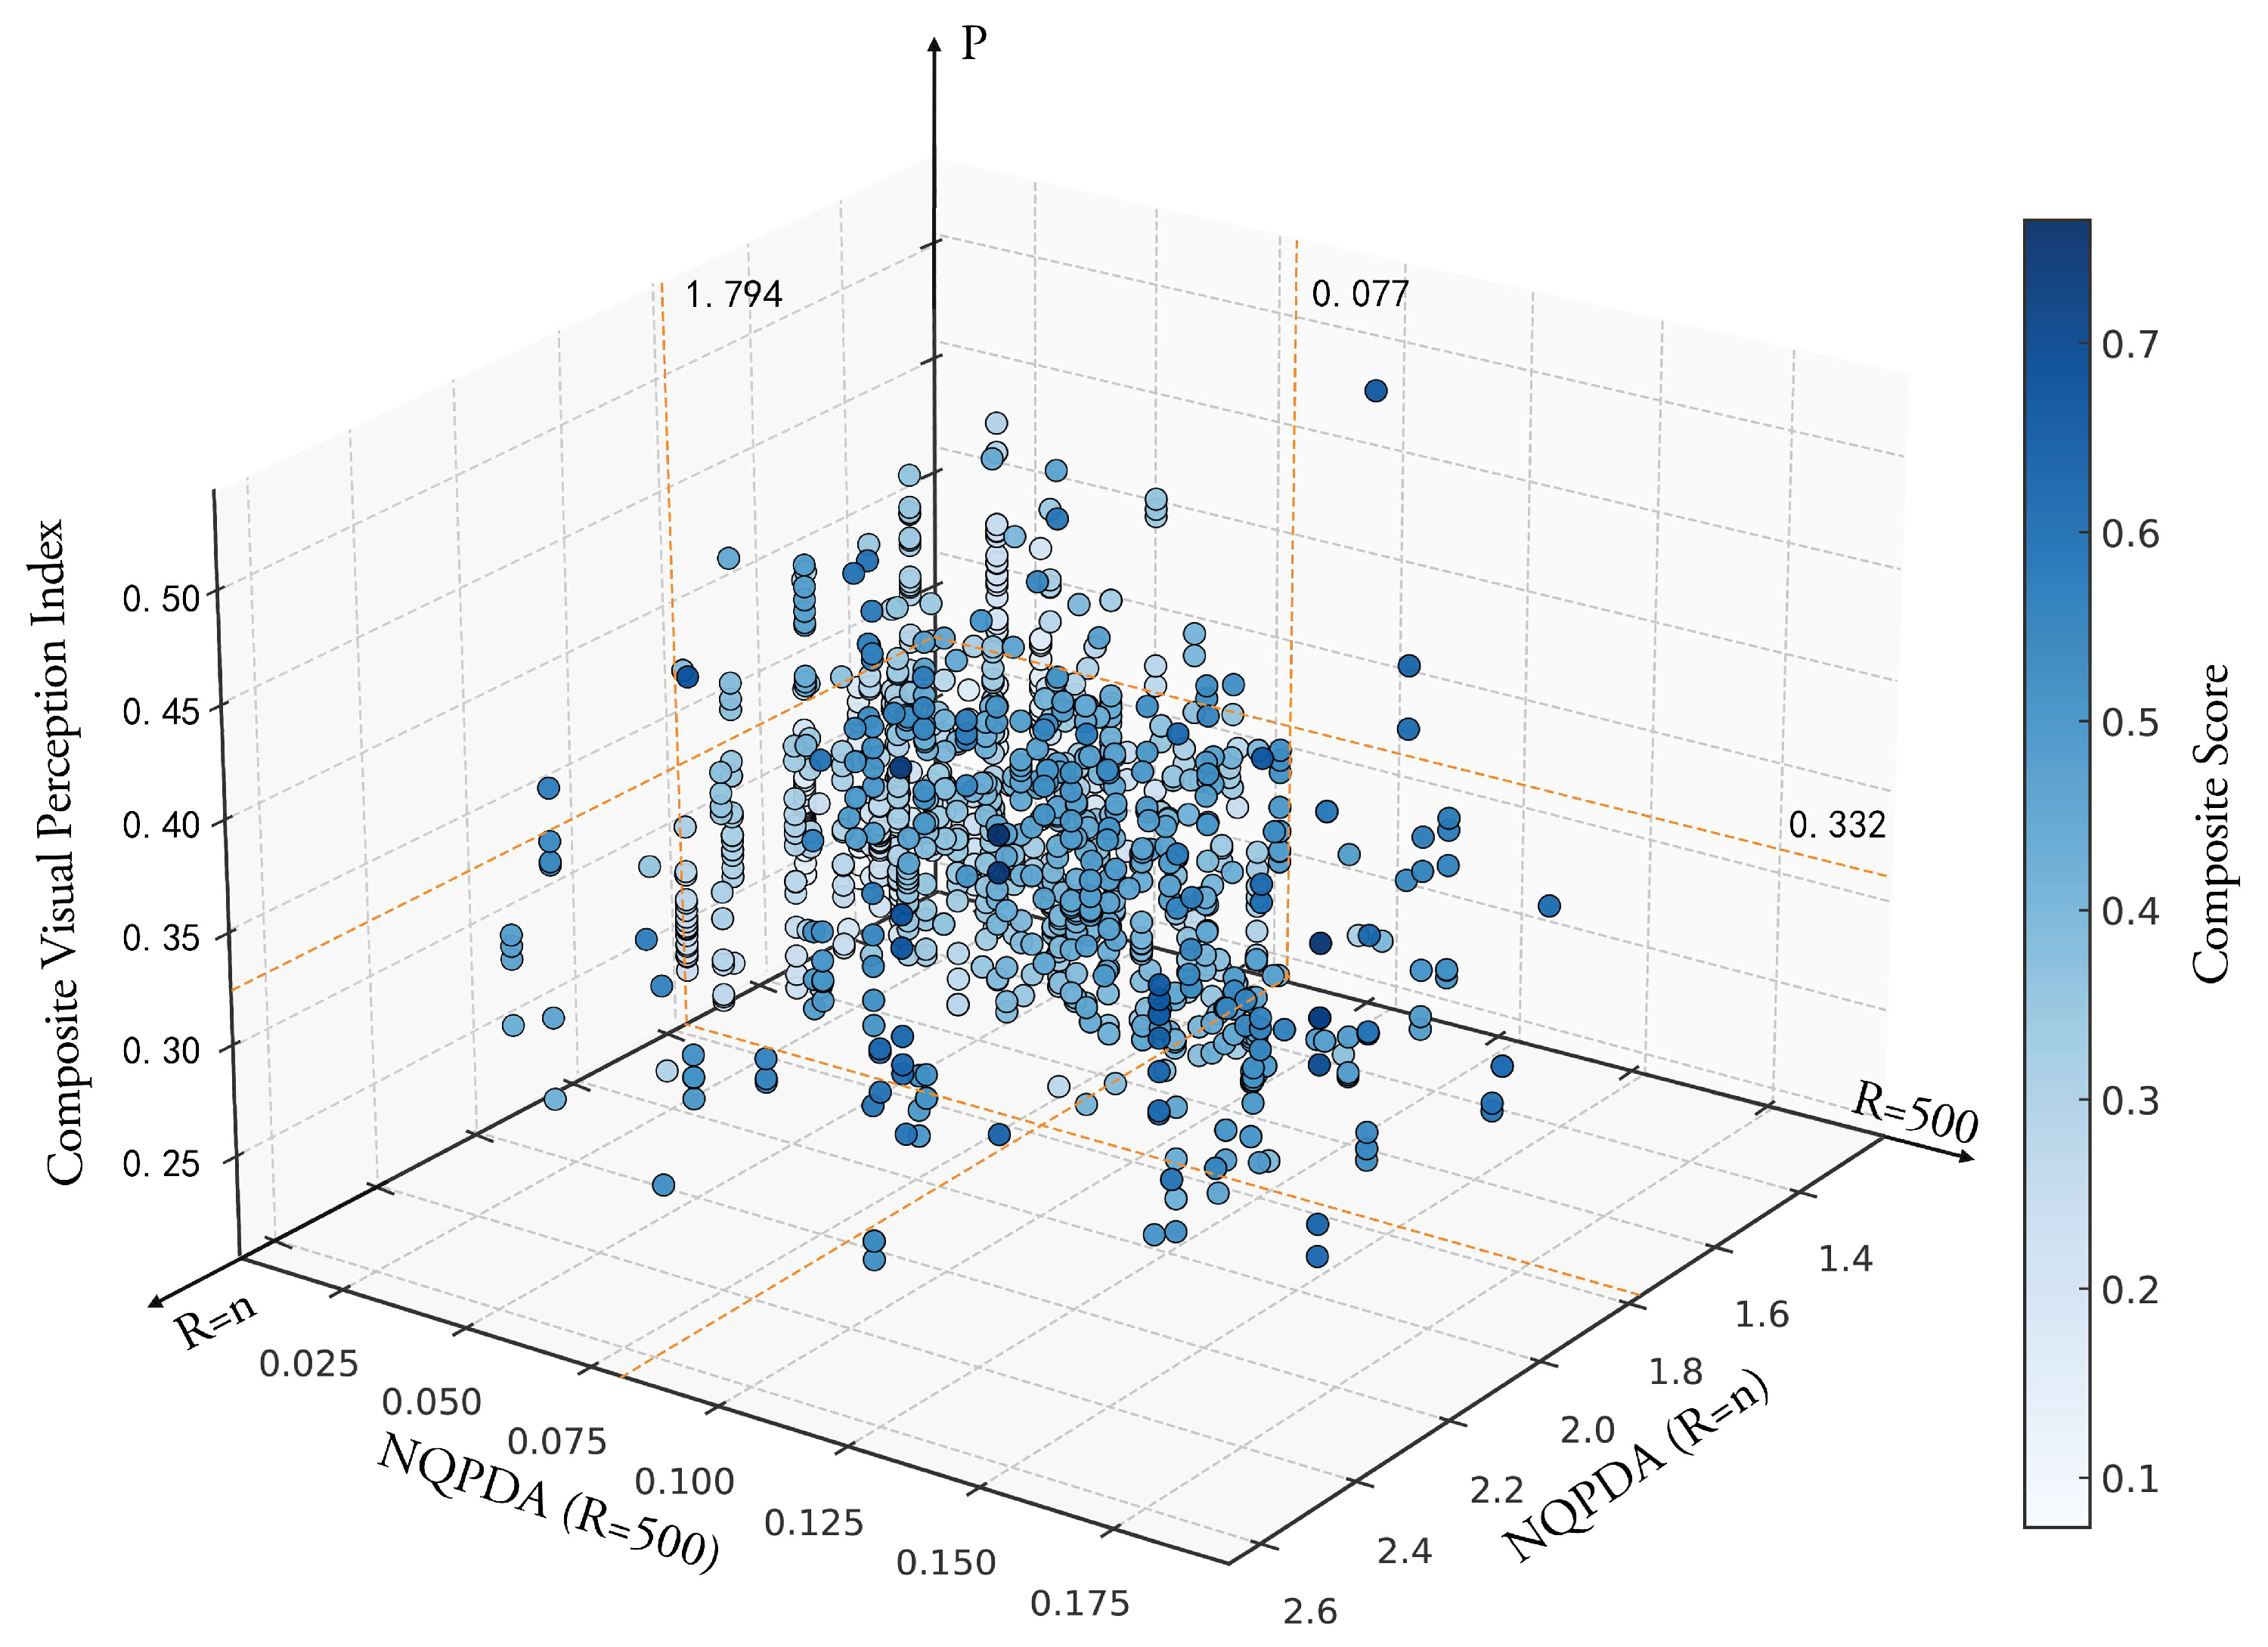
A three-dimensional diagnostic framework was constructed using overall NQPDA, local NQPDA, and CVPI. The spatial distribution of sampling points within this framework reveals the relationships among spatial structure, walkability, and visual perception. In the visualization, each point represents a sampling location, and its position in the three-dimensional quadrant indicates the relative values of the three metrics. The points are colored based on a normalized, equally weighted composite index. Darker shades indicate higher levels of NQPDA and visual perception (Figure 19). Statistical analysis of the point distribution shows that approximately 50% of sampling points score above the average for each of the three metrics. This suggests a relatively balanced distribution without extreme outliers among the sampled locations.
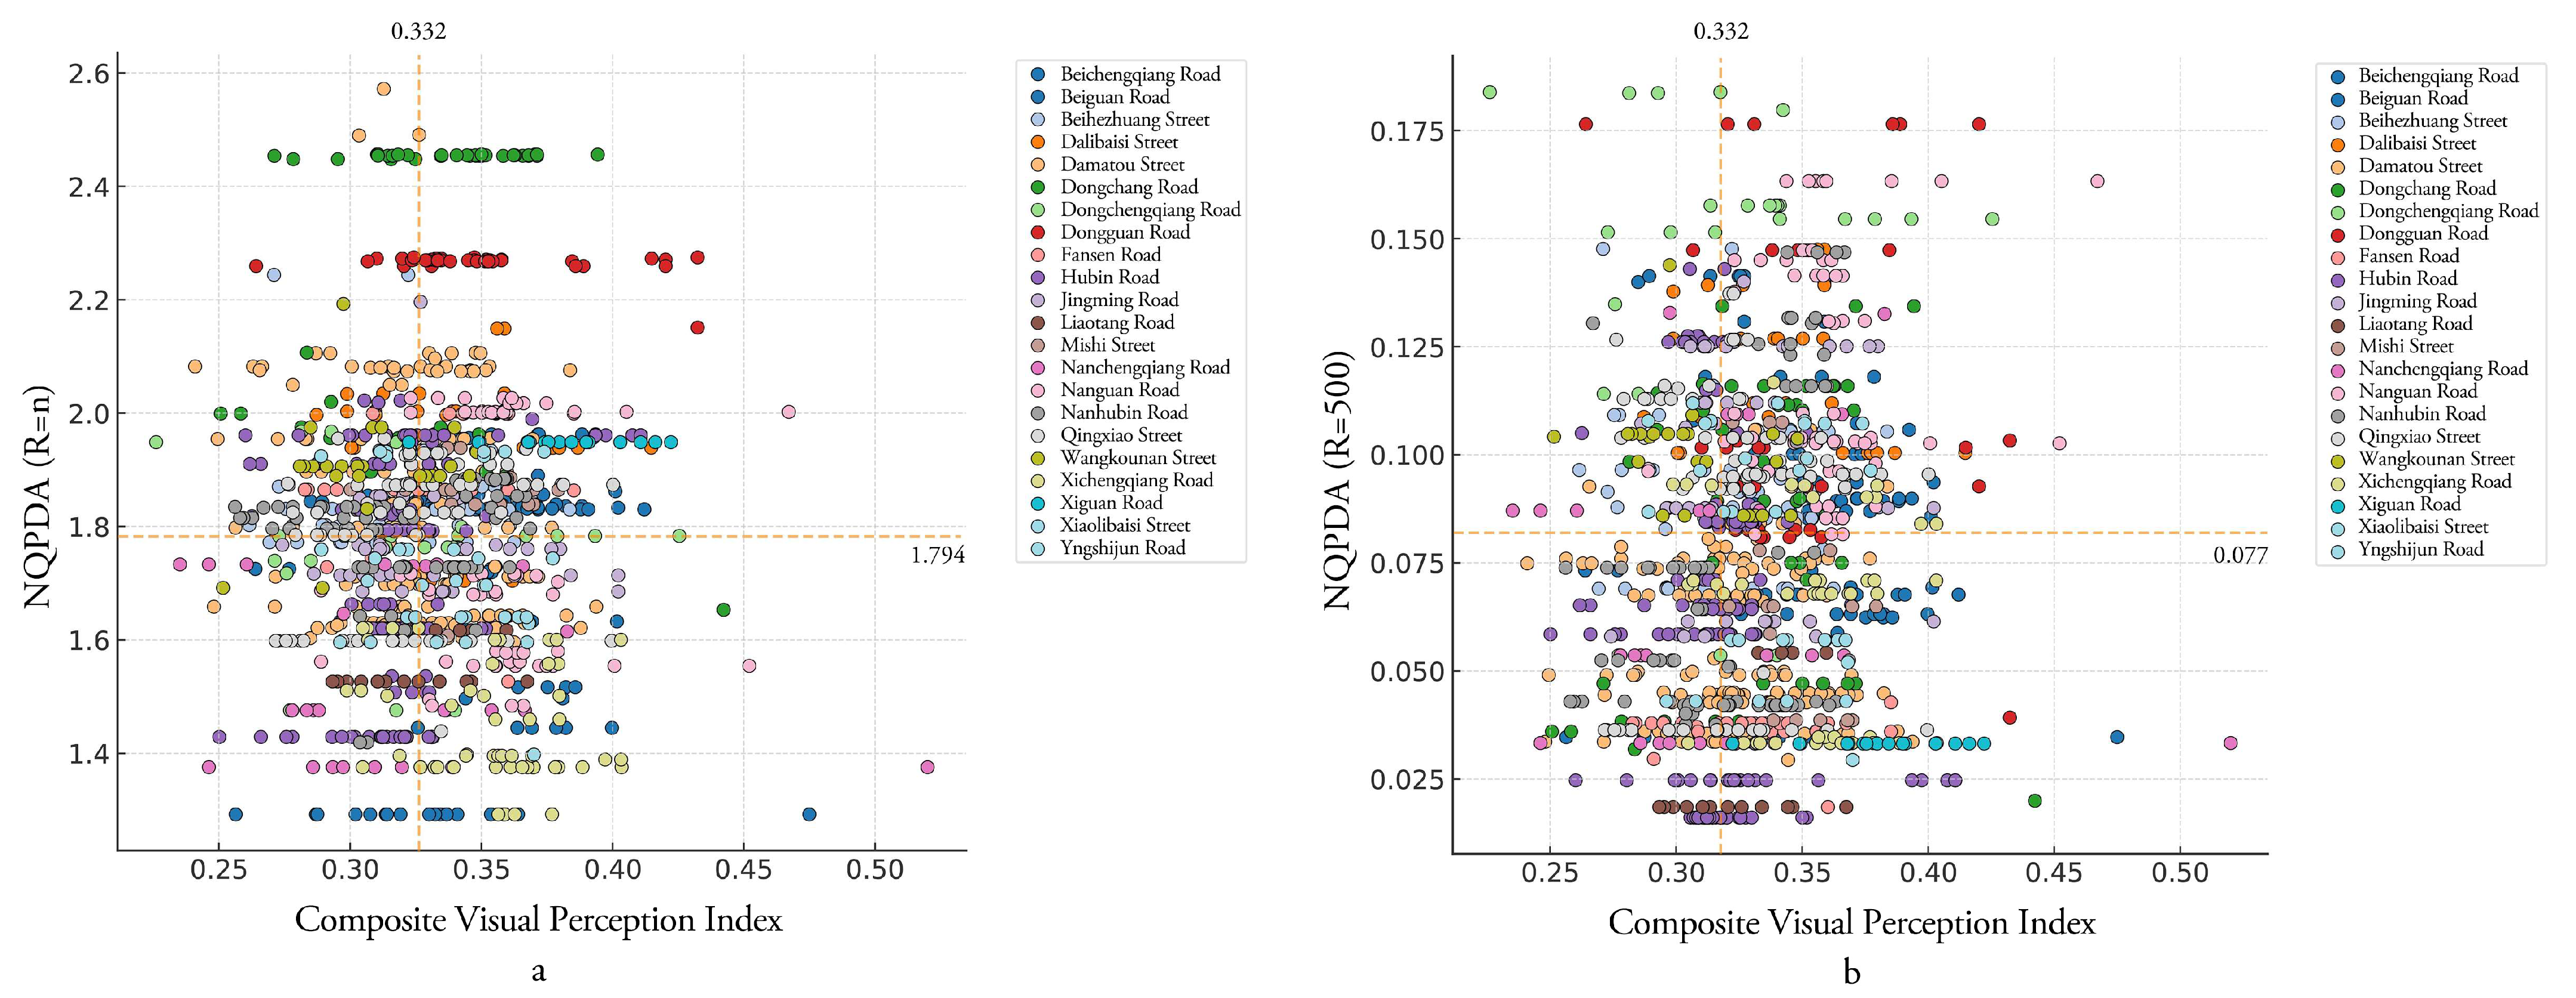
A two-dimensional analysis is the relationships between the CVPI and NQPDA metric separately (Figure 20). Figure 20a illustrates the relationship between overall NQPDA and visual perception. Streets such as Dongchang Road and Dongguan Road perform well in both dimensions, functioning as core structural elements of the urban network with high openness, vitality, and favorable visual experiences. Figure 20b depicts the relationship between local NQPDA and visual perception, indicating a closer association between pedestrian-scale accessibility and visual environmental elements. For instance, Dongchengqiang Road and Nanguan Road demonstrate strong performance in both visual perception and local accessibility.

5.3.2. Intervention Typology and Priority Classification

Based on the three-scale, three-dimensional comprehensive evaluation framework, a detailed classification of all samples was conducted at the level of sampling-point diagnostic units. The mean values of the three indicators derived from statistical calculations at the sampling-point level were adopted as the threshold criteria. According to the high–low hierarchical relationships among the CVPI, overall NQPDA, and local NQPDA, a diagnostic decision matrix was constructed, resulting in eight spatial diagnostic quadrants. These eight quadrants correspond to a gradient of eight typological conditions, ranging from “high composite visual perception–high overall NQPDA–high local NQPDA” to “low composite visual perception–low overall NQPDA–low local NQPDA” (Figure 21).
Type I exhibit high values in both overall and local integration, indicating strong accessibility within the urban spatial network. Their high CVPI further reflects excellent performance in visual landscape, spatial experience, and cultural atmosphere. Type II demonstrate high overall NQPDA but low visual perception scores. Although structurally positioned within the city’s main arterial system, they lack sufficient natural and cultural elements to support a satisfying perceptual experience. Type III show strong overall NQPDA and good city-wide accessibility, yet relatively low local NQPDA reveals discontinuities in neighborhood-scale spatial organization. Their high CVPI indicates that environmental quality and landscape features compensate for structural weaknesses. Type IV performs well at the overall structural level, however, it shows poorer local accessibility and visual perception. Type V, despite low overall NQPDA, achieve high local NQPDA and strong visual perception. This reflects close community-level connections and a high-quality environmental experience. Type VI possess high local NQPDA, indicating good connectivity and walkability at the neighborhood scale, but score low in visual perception. Although internally well-connected, this type of street shows limited openings on walls, lack of visual anchors, and absence of resting areas result in a weak perceptual experience. Type VII perform poorly in both overall and local NQPDA, often located on the urban fringe or periphery of the ancient city. However, their high visual perception scores highlight significant advantages in visual environment and landscape resources. Type VIII rank low in NQPDA and visual perception, typically featuring enclosed spatial structures, poor accessibility, and inferior environmental quality.
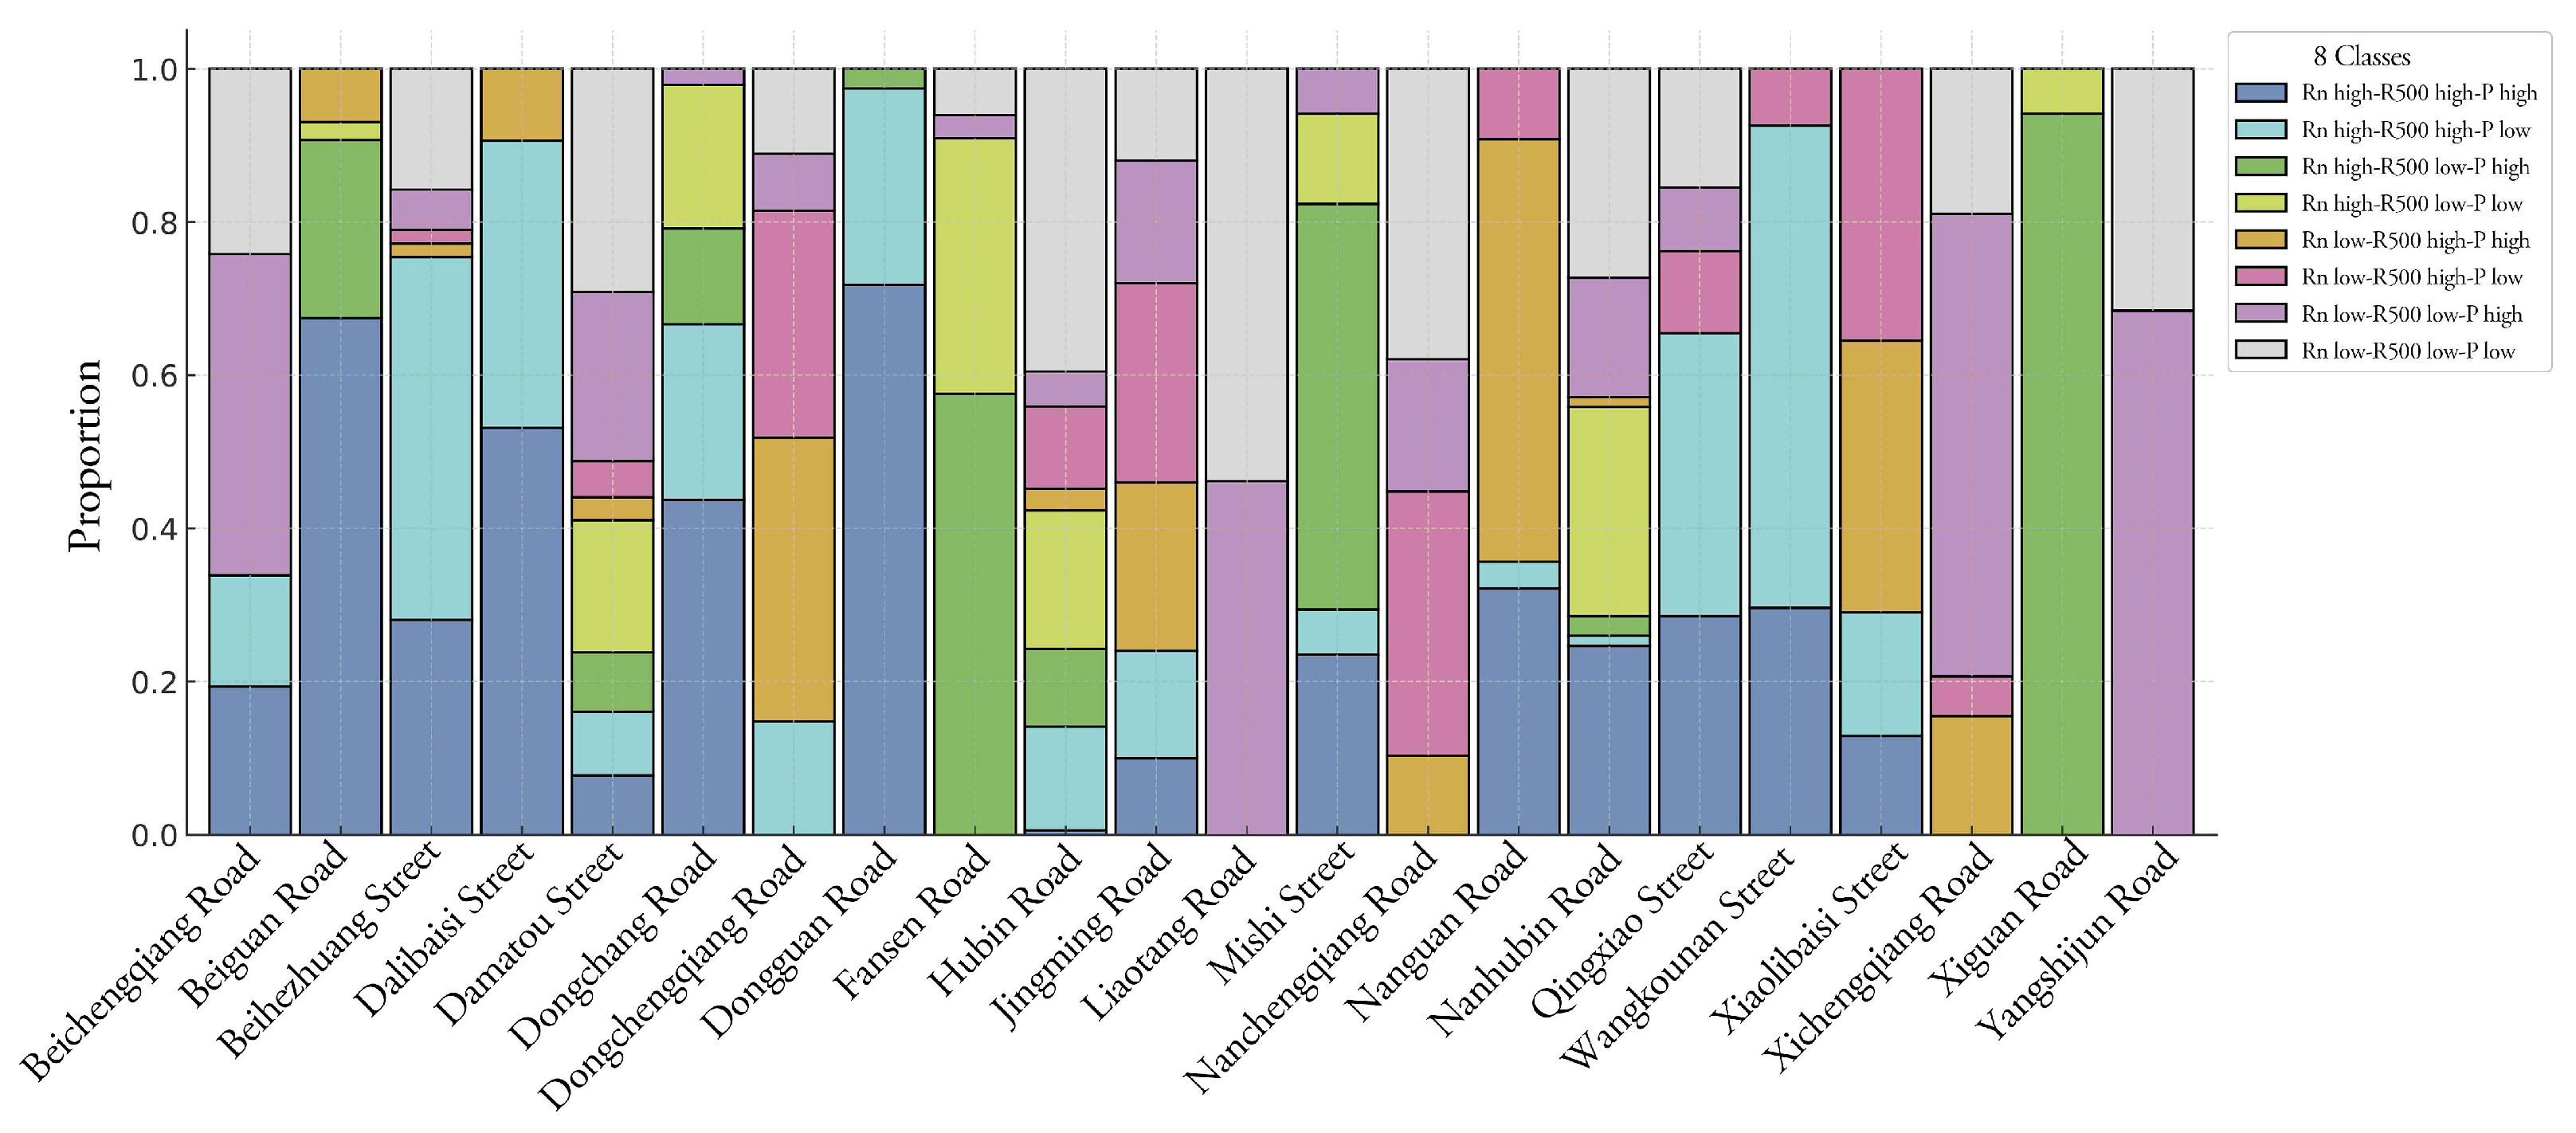
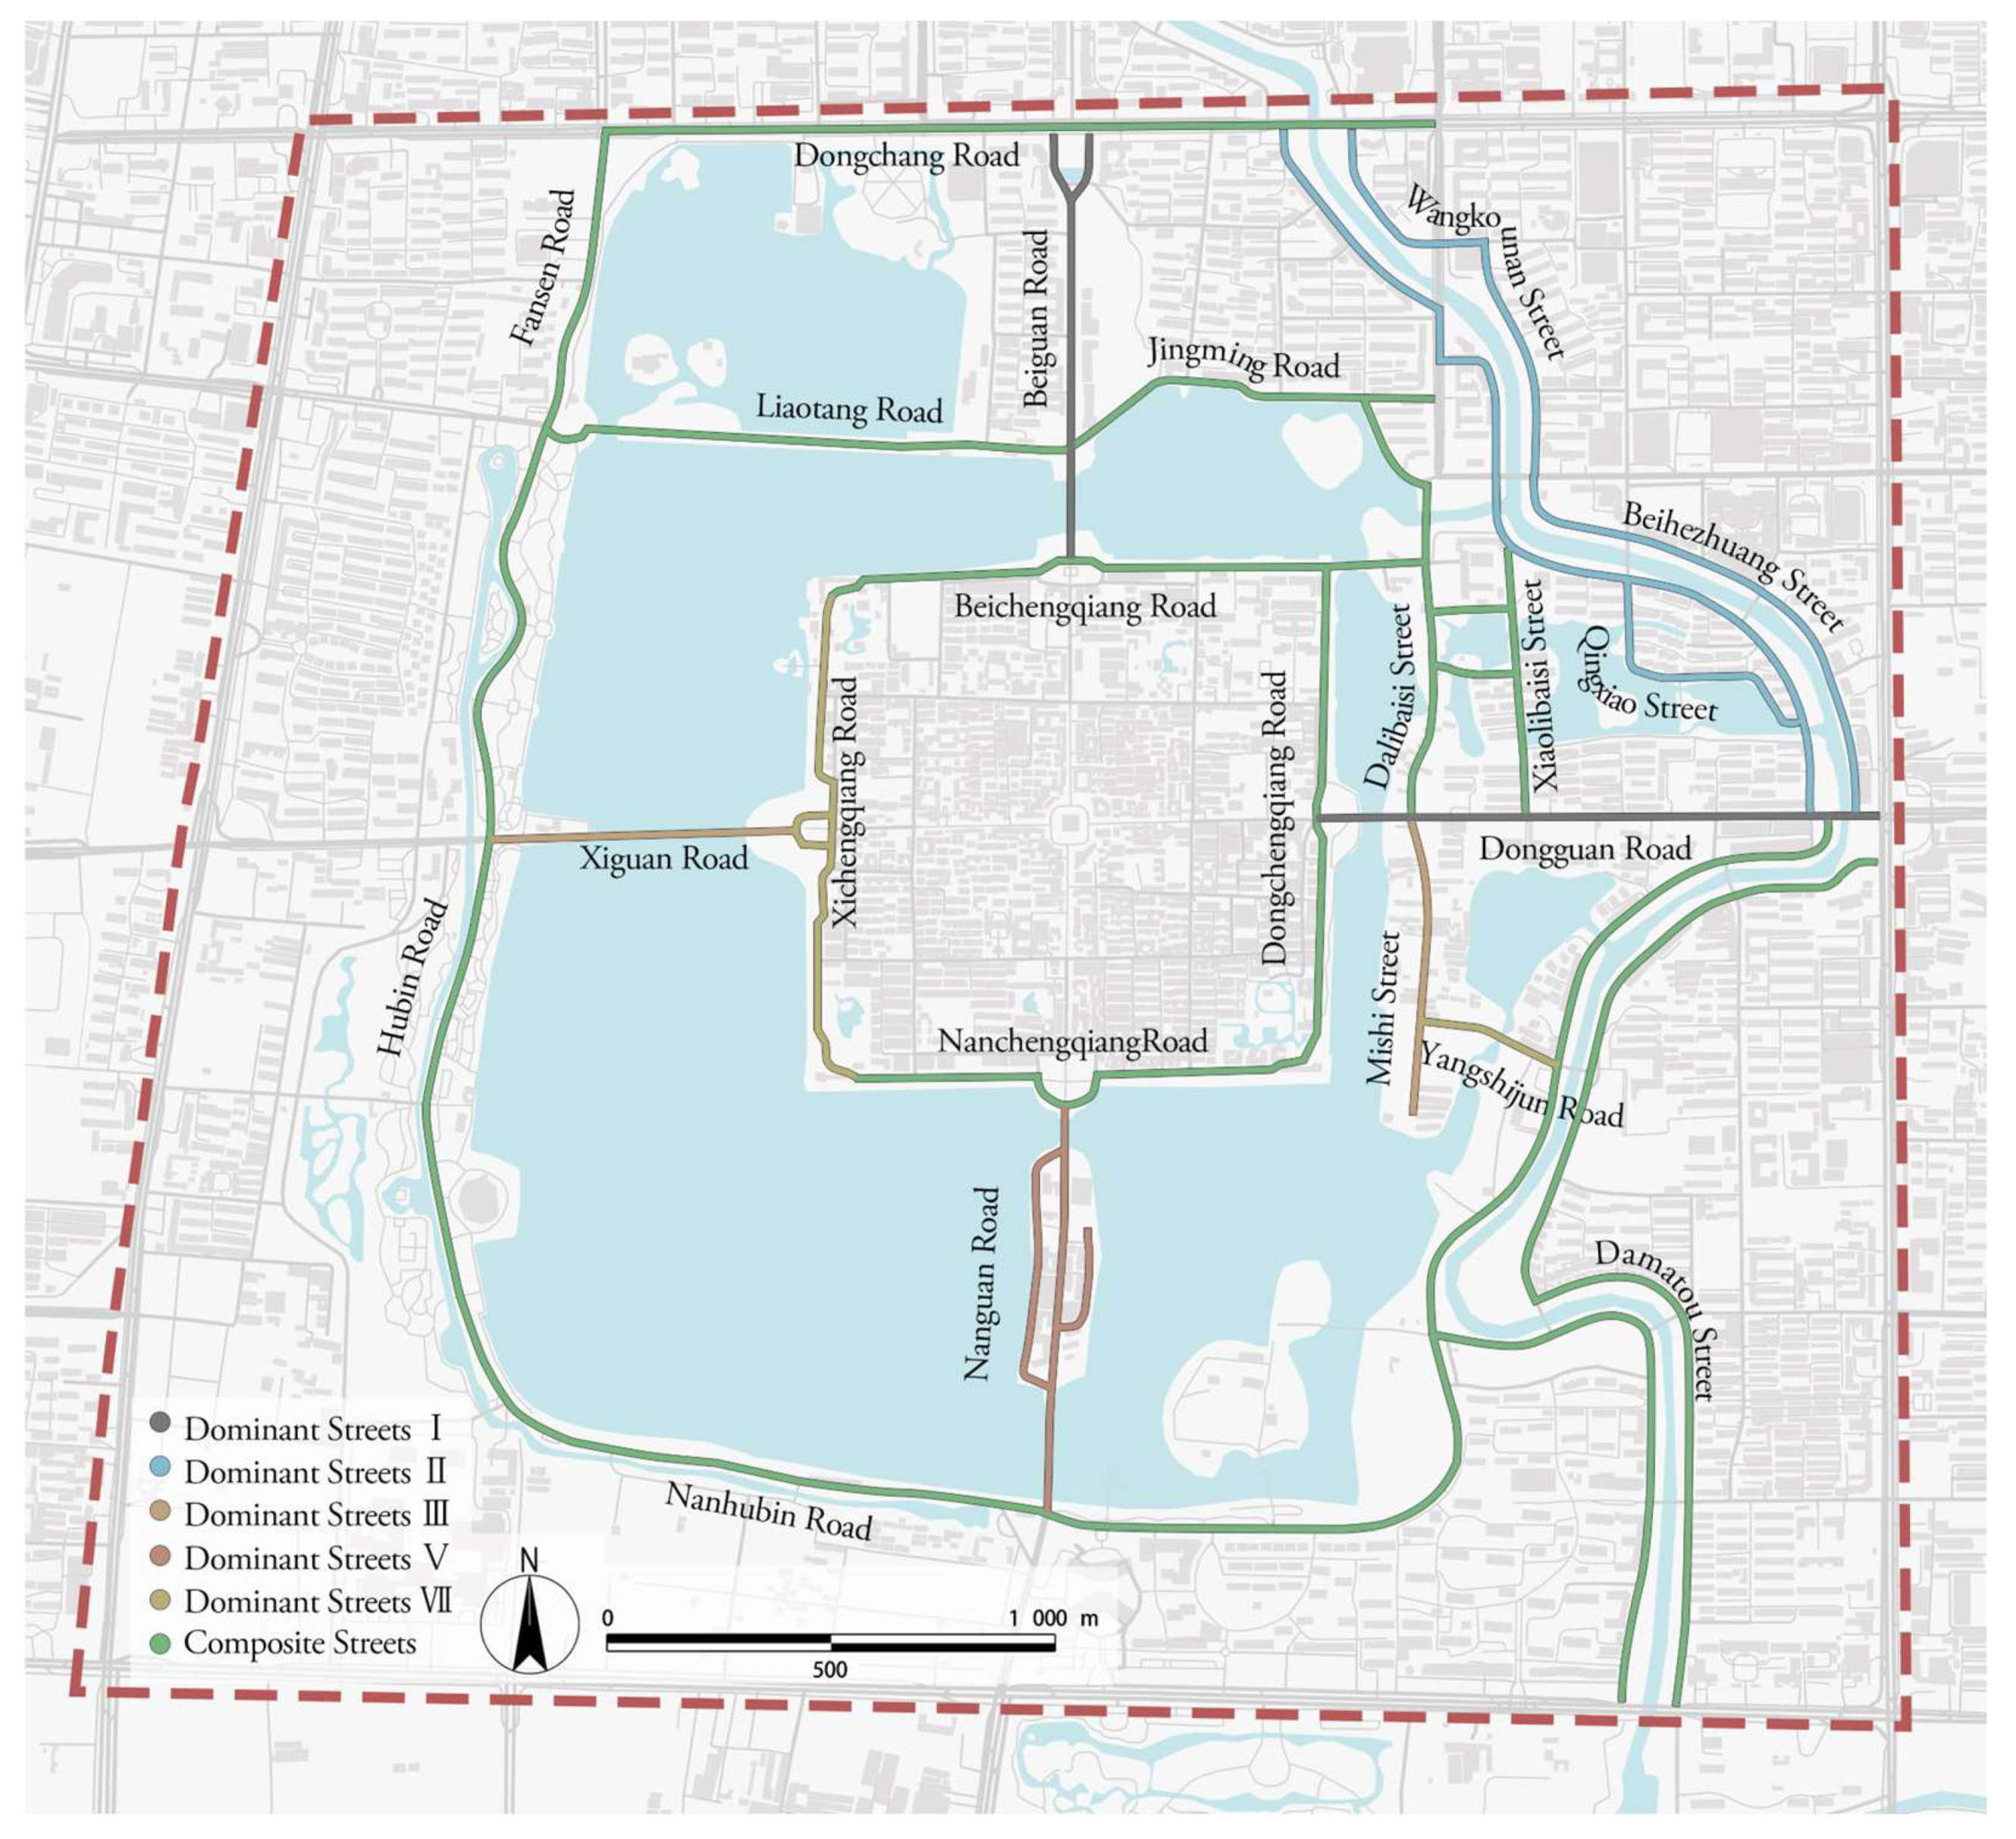
On the basis of the sampling-point classification, the number and proportional distribution of the eight types of sampling points within each street were calculated, which enabled a further diagnostic classification at the street-unit level (Figure 22). This study introduces a classification mechanism distinguishing between dominant streets and composite streets to avoid potential bias arising from representing overall street characteristics solely by the most prevalent sampling-point type. When a given spatial diagnostic type accounts for 50% or more of the sampling points within a street, and the difference between its proportion and that of the second most prevalent type exceeds 12.5%, this type is considered to exert a statistically significant dominant effect on the spatial characteristics of the street. Conversely, when the proportions and inter-type differences of sampling-point types within a street do not meet these threshold criteria, the street is classified as a composite street, whose overall spatial characteristics are represented by a combination of multiple high-proportion types. This typological classification aims to identify the core visual quality of each street, while a more refined assessment requires an integrated interpretation based on the detailed composition of sampling-point types. Based on this classification, the composite type of streets can be divided into more renewal units consisting of multiple types of sampling points. The 22 streets selected within the study area were categorized into dominant-type streets and composite-type streets based on the aforementioned classification criteria (Figure 23).

6. Renewal Strategies

6.1. Framework for Renewal Strategies

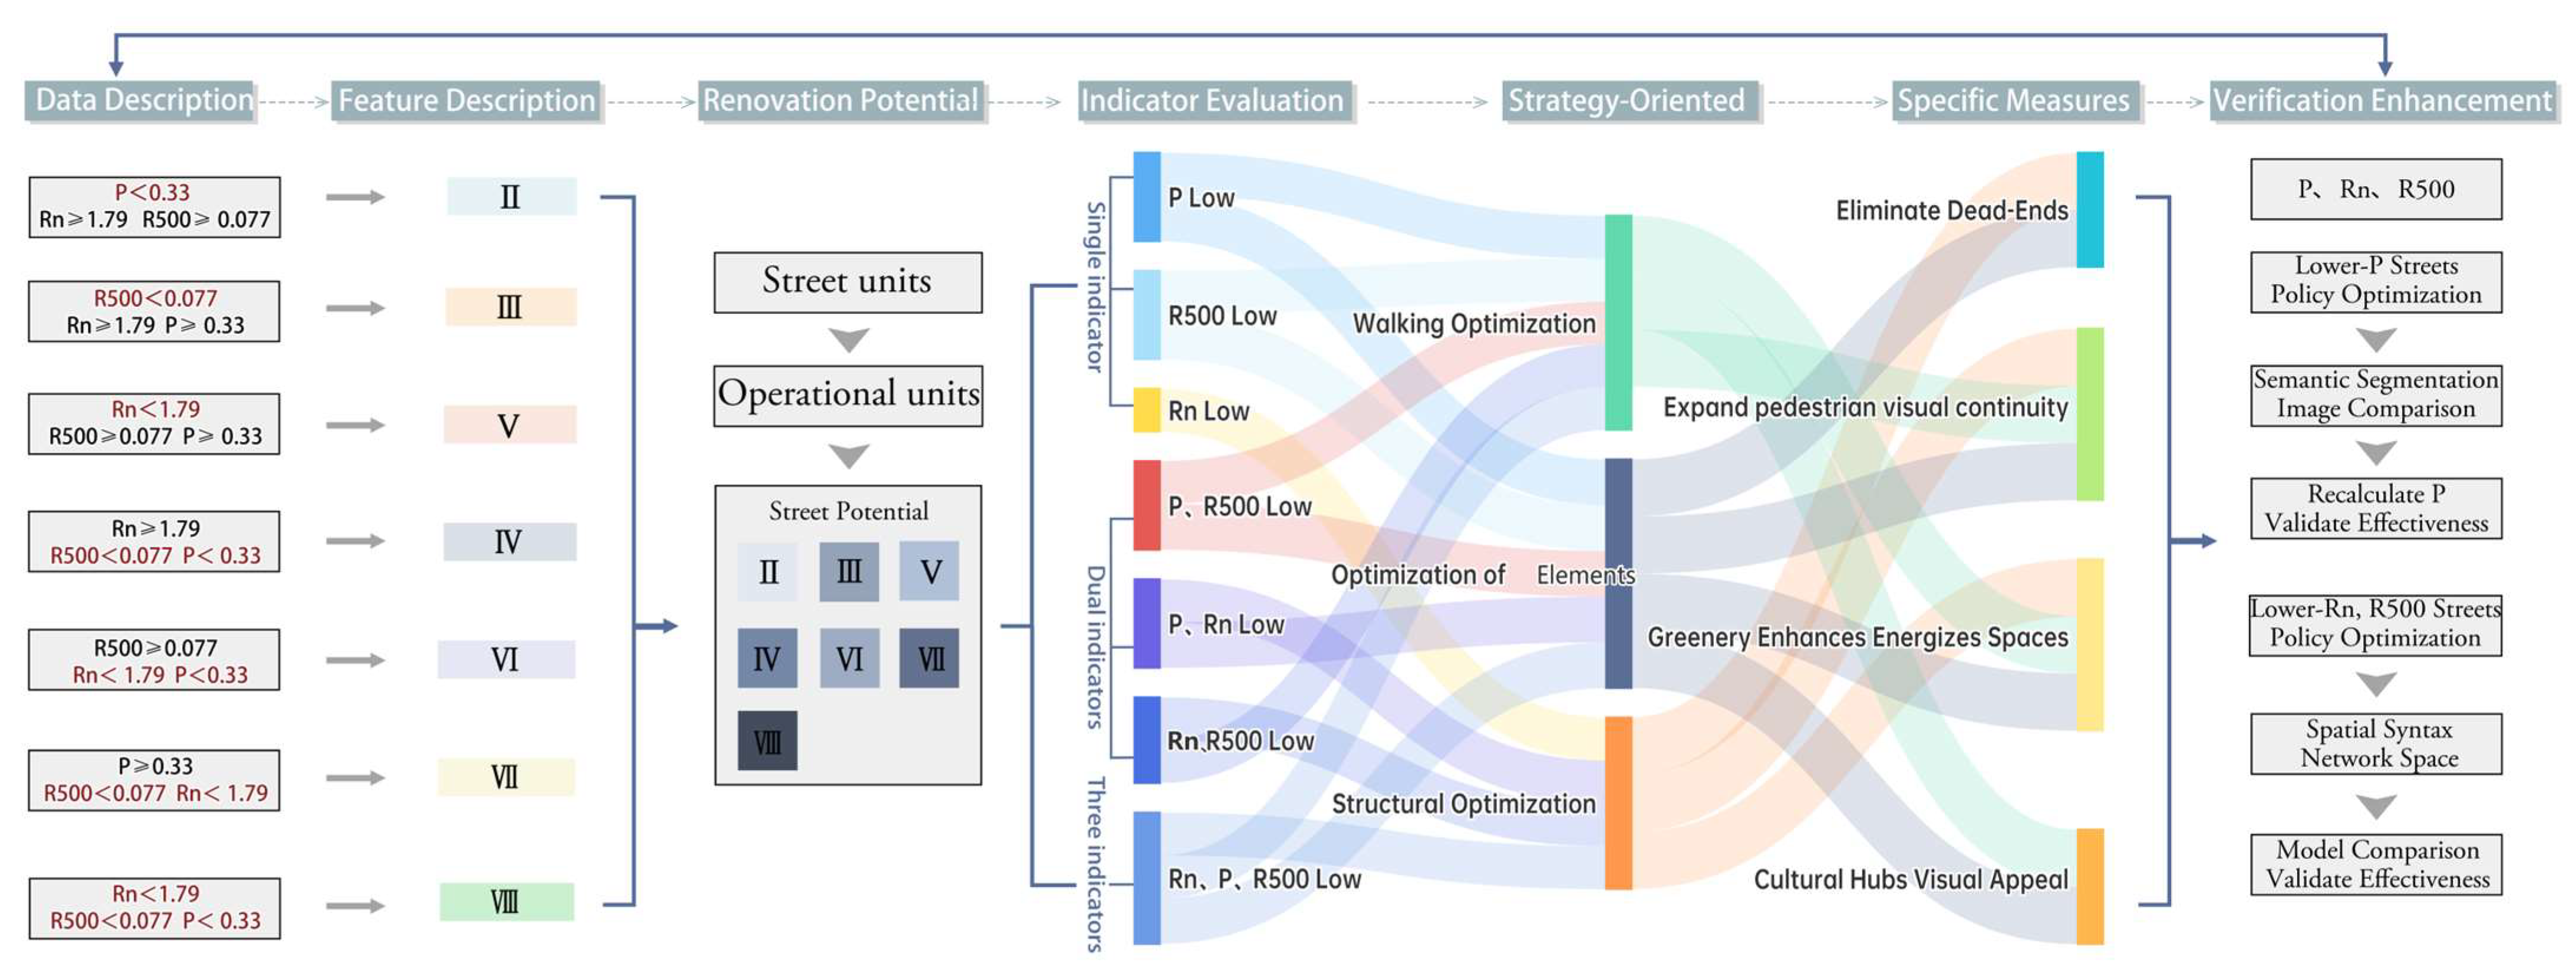
Based on the preceding diagnostic analyses, this study proposes a structured renewal strategy design process of “typology identification—priority determination—bottleneck identification—customized design strategies—improvement validation” to generate clear and targeted strategies (Figure 24). The quantitative results derived from the previous analyses directly yield eight basic diagnostic typologies, which provide the basis for a more refined prioritization process. Prior to priority determination, renewal units originally defined at the street level are further refined according to street typologies (dominant-type streets and composite-type streets).
Specifically, streets are subdivided into operational units characterized by relatively continuous distributions of sampling-point diagnostic types. Priority determination is then conducted based on diagnostic data at both the sampling-point and operational-unit levels. All indicators are normalized, and an overall ranking is used to preliminarily identify operational units with relatively weak comprehensive performance. For data points located in the middle range of the ranking—where direct classification based on overall scores is ambiguous—the absolute differences among the three normalized indicators are calculated. Operational units with larger indicator differences are assigned a higher improvement priority, as they exhibit more pronounced structural or perceptual deficiencies, while those with smaller differences are assigned a medium improvement priority. Through this procedure, a quantitative prioritization judgment is achieved for all operational-unit diagnostic categories. Importantly, the effectiveness of these strategies can be validated through scenario-based simulations and comparative analyses with the original data. For example, at the visual perception scale, optimized streetscape images generated through targeted design strategies can be compared with the original images. By extracting relevant visual elements from both sets of images using semantic segmentation and recalculating the visual perception indices, the effectiveness of the proposed strategies can be quantitatively evaluated.

6.2. Strategies for Liaocheng Streets

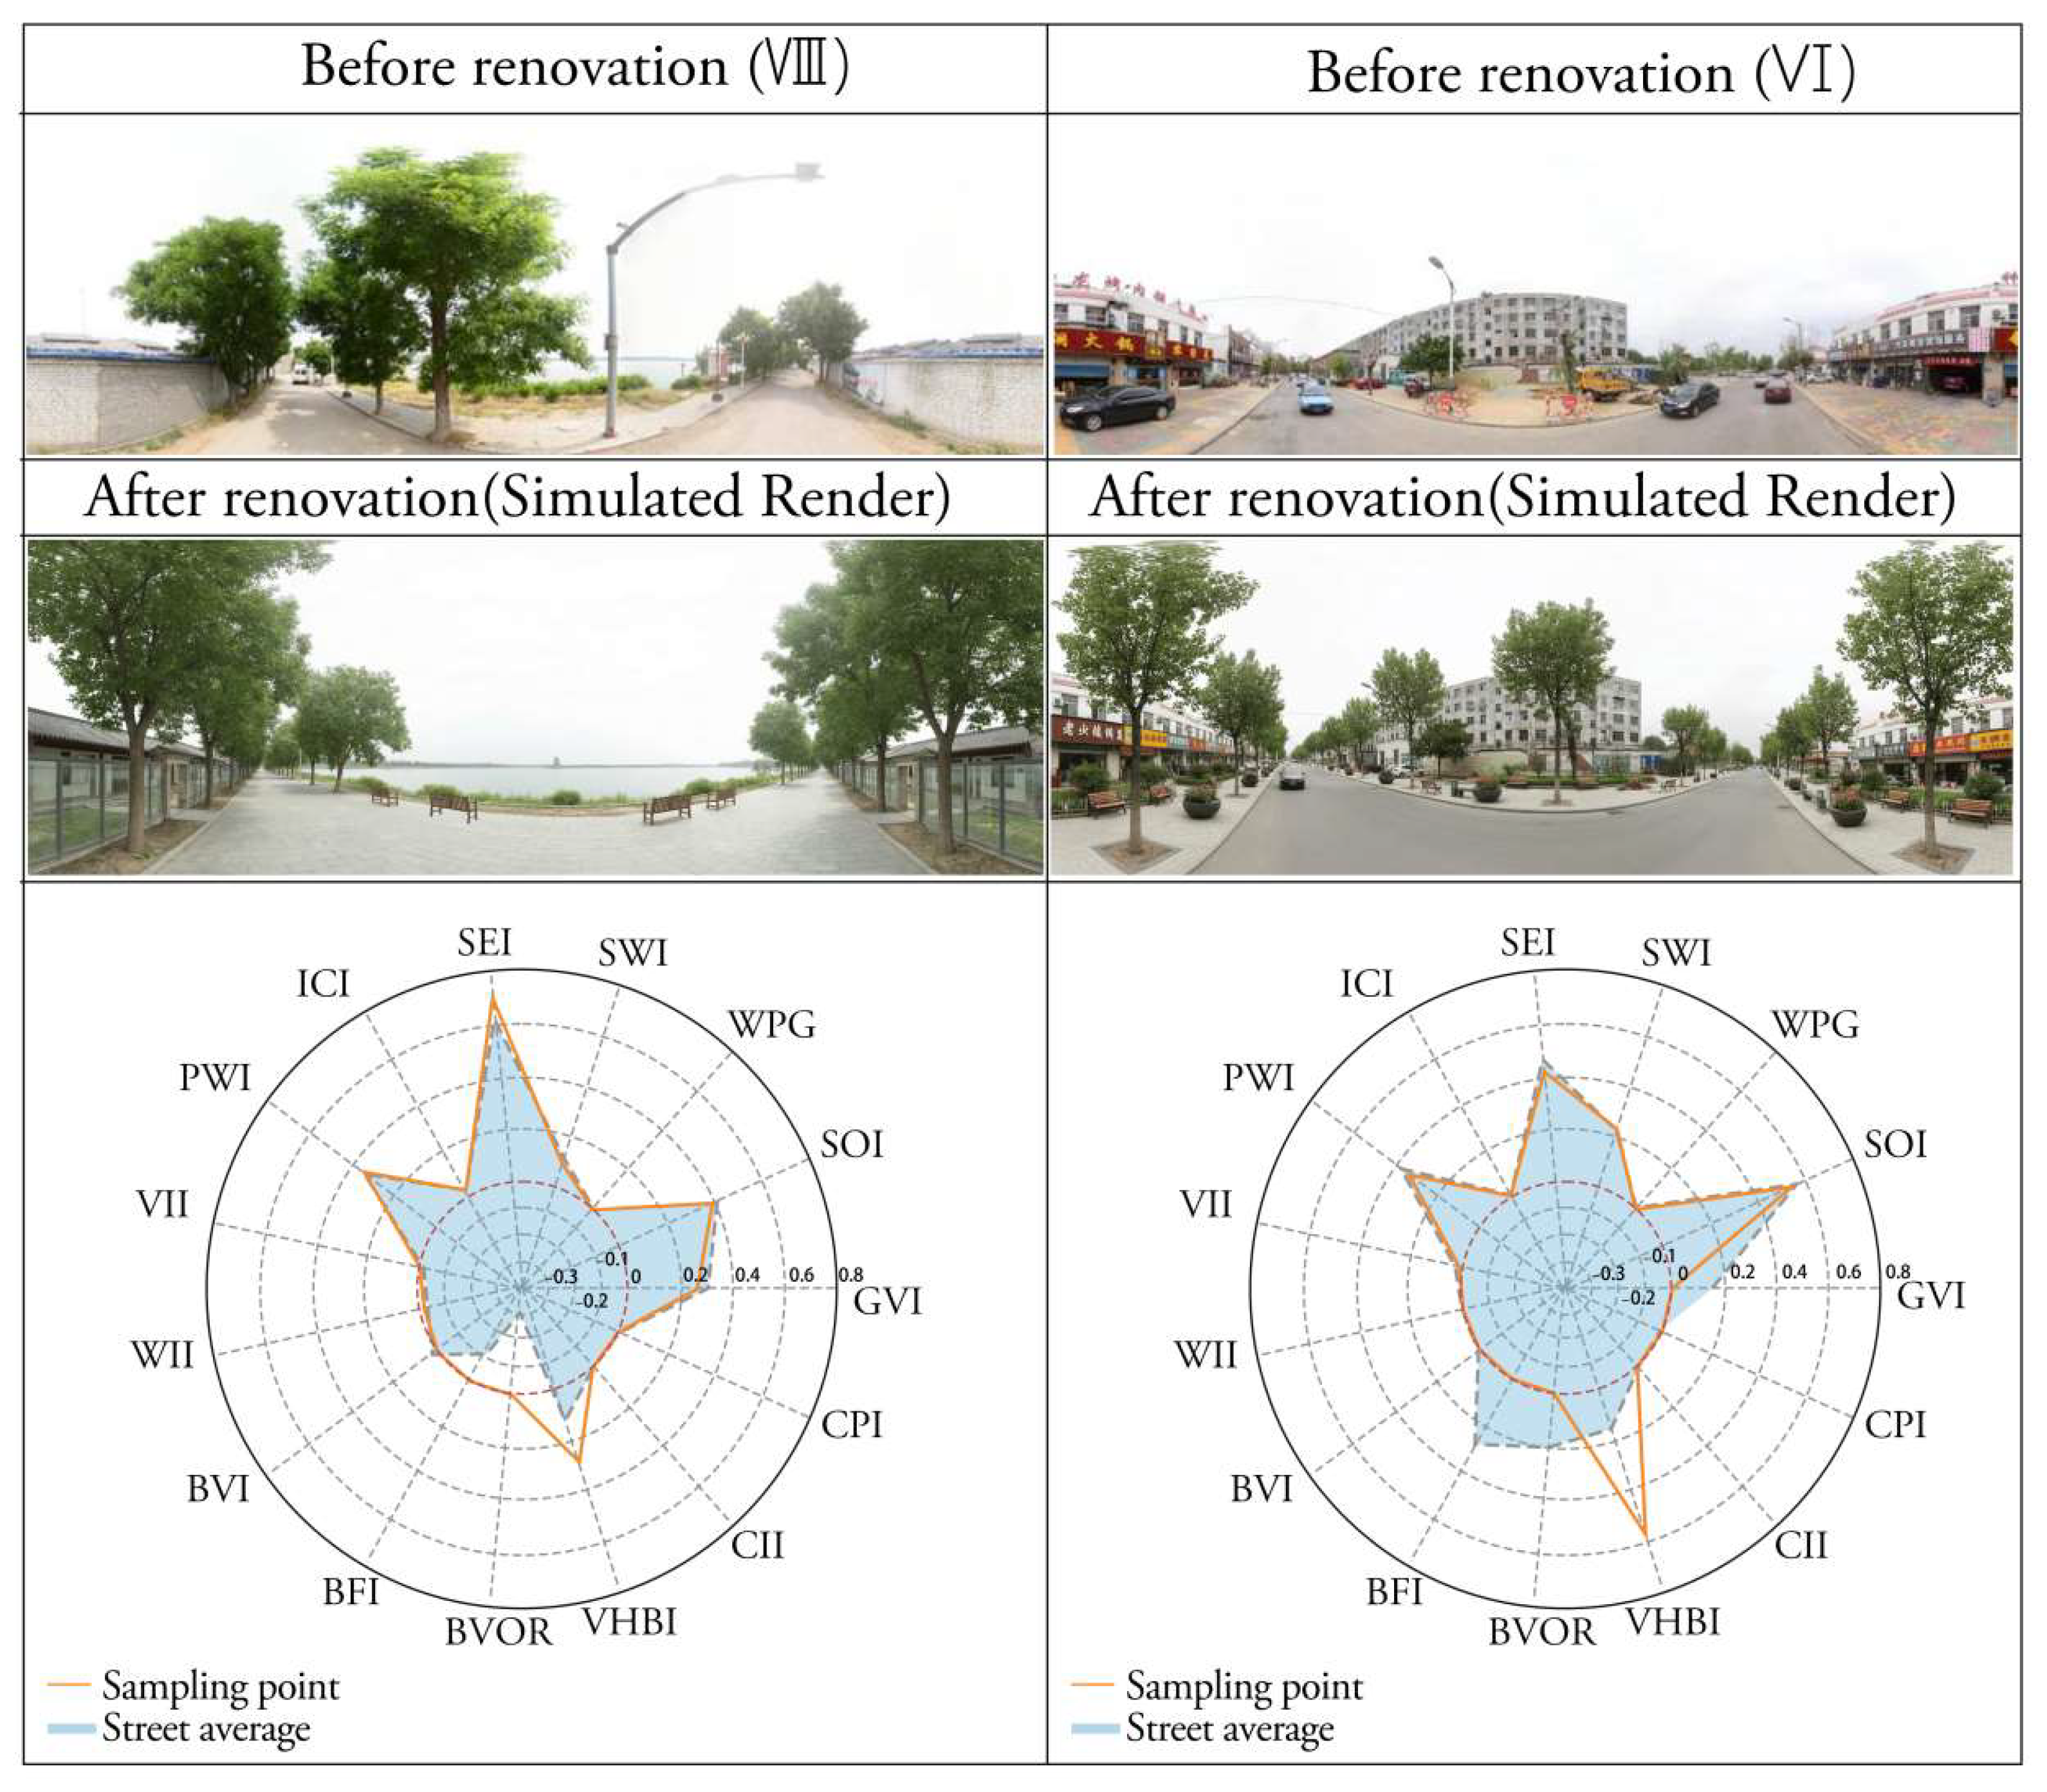
Based on the existing conditions of the streets, optimization strategies are proposed from three aspects: visual quality, walkability, and spatial structure. Regarding visual quality specifically, targeted adjustments of visual elements can be made according to the current status and assigned weights of the 15 indicators. Taking specific street nodes as examples, the simulated rendering after renovation was produced (Figure 25).
Street Node 1, located on Nanchengqiang Road, exhibits low overall and local NQPDA and a low CVPI. The overall spatial accessibility is poor, the street network is fragmented, and the visual environment is substandard. Improvement strategies include: activating idle spaces along the street to enhance continuity and attractiveness; using visually continuous paving guidance lines to integrate it into the main urban pedestrian network; and employing visual nodes to improve legibility and compensate for spatial structural deficiencies. Analysis of the visual radar chart indicates that the current street’s GVI, SOI, and BVI are relatively low. We have decided to employ low-growing greenery arrangements that maintain blue visibility while increasing the street’s green visibility rate, thereby improving the street’s visual comfort.
Street Node 2 is situated on Jingming Road. It has high local NQPDA, indicating good connectivity within the local spatial network, but the street exhibits low overall NQPDA and CVPI, characterized by numerous spatial enclosures and insufficient greenery, resulting in a generally confined street environment. Visual radar chart analysis reveals a low GVI and SEI, coupled with a high VII. The weight analysis indicates a relatively low priority for the GVI. An integrated approach is planned: using vegetation landscaping and sidewalk widening, creating a buffer between pedestrian and vehicular spaces to reduce the impact of vehicle. After optimization, the buffered, continuous pedestrian space enhances the appeal of walkability. By enhancing positive indicators that boost street visual perception while mitigating the negative impact of adverse indicators, the visual perception of street nodes is effectively improved.

7. Conclusions

This study focuses on the waterfront streets in the historic district of Liaocheng, adopting an integrated methodology that incorporates deep learning-based semantic segmentation, sDNA, GIS, and statistical analysis. A multi-dimensional and multi-scale evaluation framework tailored for waterfront streets in historic districts has been established, along with a comprehensive indicator evaluation system. This framework was applied to evaluate the historic waterfront streets of Liaocheng as a representative case, leading to the formulation of targeted renewal strategies. Based on the three-dimensional diagnostic framework, a corresponding strategic framework is proposed to guide specific renewal interventions. This contributes theoretical innovation to the evaluation system for environmental quality of waterfront streets in historic districts, while offering practical references for urban renewal projects.
The findings reveal variations among different waterfront streets in terms of spatial structure attributes, pedestrian accessibility, and perceptual indicators. The significance of these indicators lies in their collective capacity to elucidate street spatial logic and environmental experience quality from three perspectives and two aspects of physical and psychologically-perceived accessibilities. It enables a characterization of streets that relies not on isolated metrics, but on an integrated diagnostic mechanism. The resulting street typology clearly identifies the strengths and weaknesses of each type, facilitating the development of differentiated strategic frameworks. Through this typological diagnosis, the study provides actionable and implementable optimization strategies for different classes.
While this study proposes a multi-dimensional and multi-scale measurement and diagnostic framework for streetscape visual perception that offers valuable references for enhancing street space quality, it does not address demographic variations, such as the potentially differing visual preferences of tourists and residents. Future research could incorporate methods of monitoring targeting specific user groups, enabling the development of more nuanced and population-sensitive renewal strategies.

Author Contributions

Conceptualization, Z.L. and S.A.; methodology, Z.L.; software, Y.Z.; validation, Y.Z. and X.H.; formal analysis, Z.L.; investigation, D.Z.; resources, Z.L.; data curation, Y.Z.; writing—original draft preparation, Z.L., Y.Z. and X.H.; writing—review and editing, Z.L. and S.A.; visualization, Z.L., Y.Z. and X.H.; supervision, Z.L.; project administration, S.A.; funding acquisition, Z.L. All authors have read and agreed to the published version of the manuscript.

Funding

This research was funded by National Natural Science Foundation of China (Grant number: 52308025), Shandong Provincial Natural Science Foundation (Grant number: ZR2022QE293), and Youth Innovation Team Program for Higher Education of Shandong Province (Grant number: 2023KJ325).

Institutional Review Board Statement

The study was conducted in accordance with the Declaration of Helsinki, and approved by the Institutional Review Board of Shandong Jianzhu University of SDJZU-IRB-20250620 on 20 June 2025.

Informed Consent Statement

Informed consent for participation was obtained from all subjects involved in the study.

Data Availability Statement

The data that support the findings of this study are available from the authors upon reasonable request.

Conflicts of Interest

Author Shanghong Ai was employed by the Shandong Wanfang Architectural Engineering Design Co., Ltd. The remaining authors declare that the research was conducted in the absence of any commercial or financial relationships that could be construed as a potential conflict of interest.

Abbreviations

The following abbreviations are used in this manuscript:
sDNASpatial Design Network Analysis
GISGeographic Information System
GSVGoogle Street View
BSVBaidu Street View
OSMOpen Street Map
FCNFully Convolutional Network
SOISky Openness Index
GVIGreen View Index
BVIBlue View Index
BFIBlue Visual Fragmentation Index
BVORBlue Visual Occlusion Ratio
WMGWaterfront Maintenance Grade
SWIStreet Width Index
SEIStreet Enclosure Index
ICIInterface Complexity Index
PWIPedestrian Walkability Index
VIIVehicle Interference Index
WIIWall Interference Index
VHBIVernacular Heritage Building Index
CIICultural Identity Index
CPICultural Place Index
CVPIComposite Visual Perception Index

Appendix A

Figure A1. Spatial Distribution of Different Indicator.
Sustainability 18 01099 g0a1

References

  1. Habitat, U. Streets as Public Spaces and Drivers of Urban Prosperity; United Nations Human Settlements Programme: Nairobi, Kenya, 2013. [Google Scholar]
  2. Cao, Y.; Wantzen, K.M. Understanding public perceptions of the urban riverfront as social-ecological systems: The case of Tours (France). Norois 2023, 266, 47–70. [Google Scholar] [CrossRef]
  3. Fang, C. Research and Insights on the Ecological Restoration of Cheonggyecheon Stream in South Korea. Water Resour. Plan. Des. 2022, 3, 67–70. [Google Scholar]
  4. Chen, Y.; Wu, H. Blend the streams into the city life: Enlightenments from thedevelopment of San Antonio Riverwalk. Urban Plan. Int. 2020, 35, 124–132. [Google Scholar]
  5. From River Management to a Model for Waterfront Economy: What Did Cheonggyecheon Do Right? Available online: https://mp.weixin.qq.com/s/vdYIG_9ABQRvWhMx0KIQgg (accessed on 2 October 2025).
  6. Rozman Cafuta, M. Open space evaluation methodology and three dimensional evaluation model as a base for sustainable development tracking. Sustainability 2015, 7, 13690–13712. [Google Scholar] [CrossRef]
  7. Carmona, M.; Gabrieli, T.; Hickman, R.; Laopoulou, T.; Livingstone, N. Street appeal: The value of street improvements. Prog. Plan. 2018, 126, 1–51. [Google Scholar] [CrossRef]
  8. Jia, Q.; Mahdzar, S.S.S.; Shaharuddin, S.N. Urban development and cultural integration: Spatial analysis of Hui ethnic group area in Xi’an. J. Asian Archit. Build. Eng. 2025, 1–21. [Google Scholar] [CrossRef]
  9. Koohsari, M.J.; Kaczynski, A.T.; Mcormack, G.R.; Sugiyama, T. Using space syntax to assess the built environment for physical activity: Applications to research on parks and public open spaces. Leis. Sci. 2014, 36, 206–216. [Google Scholar] [CrossRef]
  10. Dunkel, A. Visualizing the perceived environment using crowdsourced photo geodata. Landsc. Urban Plan. 2015, 142, 173–186. [Google Scholar] [CrossRef]
  11. Rundle, A.G.; Bader, M.D.; Richards, C.A.; Neckerman, K.M.; Teitler, J.O. Using Google Street View to audit neighborhood environments. Am. J. Prev. Med. 2011, 40, 94–100. [Google Scholar] [CrossRef]
  12. Kelly, C.M.; Wilson, J.S.; Baker, E.A.; Miller, D.K.; Schootman, M. Using Google Street View to audit the built environment: Inter-rater reliability results. Ann. Behav. Med. 2013, 45, S108–S112. [Google Scholar] [CrossRef]
  13. Taylor, B.T.; Fernando, P.; Bauman, A.E.; Williamson, A.; Craig, J.C.; Redman, S. Measuring the quality of public open space using Google Earth. Am. J. Prev. Med. 2011, 40, 105–112. [Google Scholar] [CrossRef] [PubMed]
  14. Gong, F.-Y.; Zeng, Z.-C.; Zhang, F.; Li, X.; Ng, E.; Norford, L.K. Mapping sky, tree, and building view factors of street canyons in a high-density urban environment. Build. Environ. 2018, 134, 155–167. [Google Scholar] [CrossRef]
  15. Cheng, L.; Chu, S.; Zong, W.; Li, S.; Wu, J.; Li, M. Use of tencent street view imagery for visual perception of streets. ISPRS Int. J. Geo-Inf. 2017, 6, 265. [Google Scholar] [CrossRef]
  16. Porta, S.; Renne, J.L. Linking urban design to sustainability: Formal indicators of social urban sustainability field research in Perth, Western Australia. Urban Des. Int. 2005, 10, 51–64. [Google Scholar] [CrossRef]
  17. Le, Q.H.; Kwon, N.; Nguyen, T.H.; Kim, B.; Ahn, Y. Sensing perceived urban stress using space syntactical and urban building density data: A machine learning-based approach. Build. Environ. 2024, 266, 112054. [Google Scholar] [CrossRef]
  18. Zhao, J.; Guo, Q. Intelligent assessment for visual quality of streets: Exploration based on machine learning and large-scale street view data. Sustainability 2022, 14, 8166. [Google Scholar] [CrossRef]
  19. Kang, Y.; Kim, J.; Park, J.; Lee, J. Assessment of perceived and physical walkability using street view images and deep learning technology. ISPRS Int. J. Geo-Inf. 2023, 12, 186. [Google Scholar] [CrossRef]
  20. Li, X.; Zhang, C.; Li, W. Does the visibility of greenery increase perceived safety in urban areas? Evidence from the place pulse 1.0 dataset. ISPRS Int. J. Geo-Inf. 2015, 4, 1166–1183. [Google Scholar] [CrossRef]
  21. Li, Y.; Yabuki, N.; Fukuda, T. Measuring visual walkability perception using panoramic street view images, virtual reality, and deep learning. Sustain. Cities Soc. 2022, 86, 104140. [Google Scholar] [CrossRef]
  22. Wenjie, L.; Huan, L.; Wenxue, L.; Qiaoyun, S. Relationship Between Garden Element Recognition and Visual Perception Under Image Semantic Segmentation Technology. Huazhong Archit. 2024, 42, 138–142. [Google Scholar]
  23. Long, Y.; Liu, L. How green are the streets? An analysis for central areas of Chinese cities using Tencent Street View. PLoS ONE 2017, 12, e0171110. [Google Scholar] [CrossRef] [PubMed]
  24. Zhang, J.; Li, Y.; Fukuda, T.; Wang, B. Urban safety perception assessments via integrating multimodal large language models with street view images. Cities 2025, 165, 106122. [Google Scholar] [CrossRef]
  25. Tong, M.; She, J.; Tan, J.; Li, M.; Ge, R.; Gao, Y. Evaluating street greenery by multiple indicators using street-level imagery and satellite images: A case study in Nanjing, China. Forests 2020, 11, 1347. [Google Scholar] [CrossRef]
  26. Kumakoshi, Y.; Chan, S.; Koizumi, H.; Li, X.; Yoshimura, Y. Standardized green view index and quantification of different metrics of urban green vegetation. Sustainability 2020, 12, 7434. [Google Scholar] [CrossRef]
  27. Wang, J.; Liu, W.; Gou, A. Numerical characteristics and spatial distribution of panoramic Street Green View index based on SegNet semantic segmentation in Savannah. Urban For. Urban Green. 2022, 69, 127488. [Google Scholar] [CrossRef]
  28. Wu, Y.; Liu, Q.; Hang, T.; Yang, Y.; Wang, Y.; Cao, L. Integrating restorative perception into urban street planning: A framework using street view images, deep learning, and space syntax. Cities 2024, 147, 104791. [Google Scholar] [CrossRef]
  29. Yu, M.; Zheng, X.; Qin, P.; Cui, W.; Ji, Q. Urban color perception and sentiment analysis based on deep learning and street view big data. Appl. Sci. 2024, 14, 9521. [Google Scholar] [CrossRef]
  30. Sánchez, I.A.V.; Labib, S. Accessing eye-level greenness visibility from open-source street view images: A methodological development and implementation in multi-city and multi-country contexts. Sustain. Cities Soc. 2024, 103, 105262. [Google Scholar] [CrossRef]
  31. Yang, H.; Tsou, S.; Hu, Y. Research on Pedestrians’ Visual Perception Characteristics Based on USGGS: A Case Study of the Six Inner-City Districts of Tianjin. Landsc. Archit. 2025, 32, 37–44. [Google Scholar] [CrossRef]
  32. Hillier, B.; Hanson, J. The Social Logic of Space; Cambridge University Press: Cambridge, UK, 1989. [Google Scholar]
  33. Major, M.D. The Syntax of City Space: American Urban Grids; Routledge: Oxfordshire, UK, 2018. [Google Scholar]
  34. Griffiths, S.; Vaughan, L. Mapping spatial cultures: Contributions of space syntax to research in the urban history of the nineteenth-century city. Urban Hist. 2020, 47, 488–511. [Google Scholar] [CrossRef]
  35. Lyu, Y.; Abd Malek, M.I.; Jaafar, N.H.; Sima, Y.; Han, Z.; Liu, Z. Unveiling the potential of space syntax approach for revitalizing historic urban areas: A case study of Yushan Historic District, China. Front. Archit. Res. 2023, 12, 1144–1156. [Google Scholar] [CrossRef]
  36. Şahin Körmeçli, P. Analysis of walkable street networks by using the space syntax and GIS techniques: A case study of Çankırı city. ISPRS Int. J. Geo-Inf. 2023, 12, 216. [Google Scholar] [CrossRef]
  37. Wang, L.; Han, X.; He, J.; Jung, T. Measuring residents’ perceptions of city streets to inform better street planning through deep learning and space syntax. ISPRS J. Photogramm. Remote Sens. 2022, 190, 215–230. [Google Scholar] [CrossRef]
  38. Yu, M.; Chen, X.; Zheng, X.; Cui, W.; Ji, Q.; Xing, H. Evaluation of spatial visual perception of streets based on deep learning and spatial syntax. Sci. Rep. 2025, 15, 18439. [Google Scholar] [CrossRef]
  39. Chen, M.; Liu, Y.; Liu, F.; Chadha, T.; Park, K. Measuring pedestrian-level street greenery visibility through space syntax and crowdsourced imagery: A case study in London, UK. Urban For. Urban Green. 2025, 105, 128725. [Google Scholar] [CrossRef]
  40. Lei, Y.; Zhou, H.; Xue, L.; Yuan, L.; Liu, Y.; Wang, M.; Wang, C. Evaluating and comparing human perceptions of streets in two megacities by integrating street-view images, deep learning, and space syntax. Buildings 2024, 14, 1847. [Google Scholar] [CrossRef]
  41. GUO Bingyu, Z.B. A study on street walking quality measurement and optimization path based on visual perception: Taking Xi’an old city as an example. Planner 2025, 41, 68–76. [Google Scholar]
  42. Liaocheng Municipal People’s Government. Available online: http://www.liaocheng.gov.cn/channel_t_156_11746/doc_639486aff8ab1b32646a023c.html (accessed on 2 October 2025).
  43. Jiangbei Water City. Available online: https://baike.baidu.com/item/%E6%B1%9F%E5%8C%97%E6%B0%B4%E5%9F%8E/360926 (accessed on 23 September 2025).
  44. Li, X.; Zhang, C.; Li, W.; Ricard, R.; Meng, Q.; Zhang, W. Assessing street-level urban greenery using Google Street View and a modified green view index. Urban For. Urban Green. 2015, 14, 675–685. [Google Scholar] [CrossRef]
  45. Chen, X.; Meng, Q.; Hu, D.; Zhang, L.; Yang, J. Evaluating greenery around streets using baidu panoramic street view images and the panoramic green view index. Forests 2019, 10, 1109. [Google Scholar] [CrossRef]
  46. Ki, D.; Lee, S. Analyzing the effects of Green View Index of neighborhood streets on walking time using Google Street View and deep learning. Landsc. Urban Plan. 2021, 205, 103920. [Google Scholar] [CrossRef]
  47. Zhu, T.; Dong, J. A Deep Learning-Based Study on Urban Street Spatial Quality. In Proceedings of the 2022/2023 Annual Conference on Urban Planning in China, Wuhan, China, 23–25 September 2023; p. 12. [Google Scholar]
  48. Li, X.; Wu, D.; Li, L.; Wang, X. Research on visual perception evaluation of urban riverside greenway landscape based on deep learning. J. Beijing For. Univ. 2021, 43, 93–104. [Google Scholar]
  49. Yao, Y.; Liang, Z.; Yuan, Z.; Liu, P.; Bie, Y.; Zhang, J.; Wang, R.; Wang, J.; Guan, Q. A human-machine adversarial scoring framework for urban perception assessment using street-view images. Int. J. Geogr. Inf. Sci. 2019, 33, 2363–2384. [Google Scholar] [CrossRef]
  50. Chen, L.; Cai, X.; Liu, Z. Multi-Source data and semantic segmentation: Spatial quality assessment and enhancement strategies for Jinan Mingfu City from a tourist perception perspective. Buildings 2025, 15, 2298. [Google Scholar] [CrossRef]
  51. Fang, Z.; Liu, C.; Xiao, Y.; Jin, C.; Zhuang, X. Evaluation of street aesthetics and influencing factors using multi-source deep learning methods: The case study of Shanghai. Urban Plan. Int 2023, 38, 48–58. [Google Scholar]
  52. Han, J.; Dong, L. A study of visual evaluation of streetscape based on the psychophysical method. Chin. Landsc. Archit. 2015, 31, 116–119. [Google Scholar]
  53. Guneroglu, N.; Acar, C.; Dihkan, M.; Karsli, F.; Guneroglu, A. Green corridors and fragmentation in South Eastern Black Sea coastal landscape. Ocean Coast. Manag. 2013, 83, 67–74. [Google Scholar] [CrossRef]
  54. Huang, Z.; Li, Z.X.L.W. Street space quality measurement based on multi-source big data and its impact on street vitality: A case study of Guangzhou’s historic urban area. Shanghai Urban Plan. Rev. 2023, 6, 122–130. [Google Scholar]
  55. Al Mushayt, N.S.; Dal Cin, F.; Barreiros Proença, S. New lens to reveal the street interface. A morphological-visual perception methodological contribution for decoding the public/private edge of arterial streets. Sustainability 2021, 13, 11442. [Google Scholar] [CrossRef]
  56. Chen, L. Research on Optimization of Street Space Pedestrian Appraisal Method Based on Multi-Source Data—Taking Nanjing Main Area as an Example. Master’s Degree, Nanjing University, Nanjing, China, 2020. [Google Scholar]
  57. Rui, Q.; Cheng, H. Quantifying the spatial quality of urban streets with open street view images: A case study of the main urban area of Fuzhou. Ecol. Indic. 2023, 156, 111204. [Google Scholar] [CrossRef]
  58. Xu, J.; Dai, Y.; Cai, J.; Qian, H.; Peng, Z.; Zhong, T. Evaluation of urban street historical appearance integrity based on street view images and transfer learning. ISPRS Int. J. Geo-Inf. 2025, 14, 266. [Google Scholar] [CrossRef]
  59. Zhongde, W.; Xiaoyan, W. Study on the spatial quality of riverside road based on streetscape analysis technology: Taking the third Generation Riverside Road in Chongqing as an example square. Landsc. Archit. 2024, 40, 45–51. [Google Scholar]
  60. Zhou, J.-L.; Xu, Q.-Q.; Zhang, X.-Y. Water resources and sustainability assessment based on group AHP-PCA method: A case study in the Jinsha River Basin. Water 2018, 10, 1880. [Google Scholar] [CrossRef]
  61. Vaidya, O.S.; Kumar, S. Analytic hierarchy process: An overview of applications. Eur. J. Oper. Res. 2006, 169, 1–29. [Google Scholar] [CrossRef]
  62. Yang, B.; Li, J. Evaluation of Street Space Quality from the Perspective of “Visual Perception and Activity Support”: A Case Study of Nanjing City. In Proceedings of the 2022/2023 Annual Conference on Urban Planning in China, Wuhan, China, 23–25 September 2023; p. 9. [Google Scholar]
  63. Zhao, Y.; Yan, J.-W.; Li, Y.; Bian, G.-M.; Du, Y.-Z. In-site phenotype of the settlement space along China’s Grand Canal Tianjin Section: GIS-sDNA-based model analysis. Buildings 2022, 12, 394. [Google Scholar] [CrossRef]
  64. Deng, S.; Ying, W. Research on Optimizing Mountain City Tourism Resources Based on the Interaction Between Tourist Behavior and Spatial Accessibility: A Case Study of the Chongqing Yuzhong District City Wall Belt. In Proceedings of the 2025 China Urban Planning Annual Conference, Shenyang, China, 22–23 November 2025; p. 12. [Google Scholar]
  65. Van Nes, A. Spatial configurations and walkability potentials. Measuring urban compactness with space syntax. Sustainability 2021, 13, 5785. [Google Scholar] [CrossRef]
  66. Wang, Z.; Bovik, A.C. A universal image quality index. IEEE Signal Process. Lett. 2002, 9, 81–84. [Google Scholar] [CrossRef]
Figure 1. (a) China regional map. (b) Shandong regional map. (c) Liaocheng area map. (d) Study area (Image source for (a): http://bzdt.ch.mnr.gov.cn, approval number: GS (2023)2767. No changes have been made to the original image; Image source for (bd): https://guihuayun.com. All images were accessed on 29 September 2025).
Sustainability 18 01099 g001
Figure 2. Bird’s-eye view of the study area.
Sustainability 18 01099 g002
Figure 3. Schematic of sampling points for street view acquisition and example images (Image source: BSV, accessed on 29 August 2025).
Sustainability 18 01099 g003
Figure 4. Visual Evaluation Indicator Weight.
Sustainability 18 01099 g004
Figure 5. Research Framework.
Sustainability 18 01099 g005
Figure 6. Visual Elements and Indicator Classification.
Sustainability 18 01099 g006
Figure 7. Visual Element Ranking.
Sustainability 18 01099 g007
Figure 8. Visual Indicator Statistical Values.
Sustainability 18 01099 g008
Figure 9. Typical Street Visual Indicator Score.
Sustainability 18 01099 g009
Figure 10. Scatter plots of local NQPDA by street.
Sustainability 18 01099 g010
Figure 11. Local NQPDA Spatial Distribution Map.
Sustainability 18 01099 g011
Figure 12. Scatter plots of overall NQPDA by street.
Sustainability 18 01099 g012
Figure 13. Overall NQPDA Spatial Distribution Map.
Sustainability 18 01099 g013
Figure 14. Correlation Analysis Between Indicators and NQPDA.
Sustainability 18 01099 g014
Figure 15. Visual Perception Index Statistics.
Sustainability 18 01099 g015
Figure 16. Scatter Plot of Composite Visual Perception Indicators for Streets.
Sustainability 18 01099 g016
Figure 17. Spatial Distribution of CVPI.
Sustainability 18 01099 g017
Figure 18. Correlation Analysis of NQPDA (R = n), NQPDA (R = 500), and CVPI.
Sustainability 18 01099 g018
Figure 19. Three-Dimensional Evaluation of Spatial Perception Measures.
Sustainability 18 01099 g019
Figure 20. Distribution of Indicator Data at Sampling Points for different streets. (a) Relationship between Overall NQPDA and CVPI; (b) Relationship between Local NQPDA and CVPI.
Sustainability 18 01099 g020
Figure 21. Visual Perception Diagnostic Framework.
Sustainability 18 01099 g021
Figure 22. Analysis of Street Sampling Point Types.
Sustainability 18 01099 g022
Figure 23. Spatial Distribution of Street Types.
Sustainability 18 01099 g023
Figure 24. Renewal Strategy Framework.
Sustainability 18 01099 g024
Figure 25. Street Optimization Strategy.
Sustainability 18 01099 g025
Table 1. Interpretation of Relevant Indicators and Indicator System.
DimensionIndicatorMeaningFormula for CalculationReferences
Natural CoordinationGreen View IndexThe percentage of the total field of view occupied by the vertical projection area of vegetation.Green View Index (GVI) =
(P_Vegetation/P_Total) × 100%
[51,52]
Sky Openness IndexThe percentage of the total field of view occupied by the visible sky area.Sky Openness Index (SOI) =
(P_Sky/P_Total) × 100%
[51,52]
Blue View IndexThe percentage of the total field of view occupied by the surface area of natural or artificial water bodies.Blue View Index (BVI) =
(P_Water/P_Total) × 100%
[51]
Blue Visual Fragmentation IndexThe ratio of the number of distinct connected areas identified as water bodies to their total area.Blue Visual Fragmentation Index (BFI) = (N_water frags/N_water total) × 100%[53]
Blue Visual Occlusion RatioThe percentage of the water body’s inherent visible area obscured by other objects.Blue Visual Obstruction Ratio (BVOR) = (P_water occluded/P_water) × 100%
Waterfront Maintenance GradeIn waterfront areas, the percentage of the field of view occupied by artificial barriers.Waterfront Maintenance Grade (WMG) = (P_water fence/P_Total) × 100%[48]
Artificial ComfortStreet Width IndexThe proportion of pixels occupied by road open space elements in street view imagery relative to the total number of pixels in the image.Street Spaciousness Index (SWI) = (P_street/P_Total) × 100%[51]
Street Enclosure IndexThe proportion of pixels occupied by buildings, walls, and trees in street view images relative to the total pixel area of the image.Street Enclosure Index (SEI) = (P_building + P_wall + P_tree_facade/P_Total) × 100%[54]
Interface Complexity IndexThe richness and diversity of visual elements in the architectural interfaces within the street.Interface Complexity Index (ICI) = (P_non transparent/P_total) × 100%[55]
Pedestrian Walkability IndexThe proportion of dedicated pedestrian space to the total road traffic space area.Pedestrian Walkability Index (PWI) = (P_sidewalk/P_road) × 100%[56]
Vehicle Interference IndexThe spatial visual proportion occupied by motor vehicles in the field of view.Vehicle Interference Index (VII) = (P_vehicles/P_Total) × 100%[57]
Wall Interference IndexThe proportion of continuous, enclosed walls (particularly solid walls lacking interactivity) within the pedestrian’s field of view in the street space.Wall Interference Index (WII) = (P_wall/P_Total) × 100%[50]
Historical CulturalVernacular Heritage Building IndexQuantify the pixel proportion of buildings with traditional regional architectural features visible in street view images within the overall visual scene.Vernacular Heritage Building Index (VHBI) = (P_historic/P_total facade) × 100%[58]
Cultural Identity IndexThe proportion of culturally significant pixels in street view imagery relative to the total number of pixels.Cultural Identity Index (CII) = (P_images with cultural signs/P_images total) × 100%
Cultural Place IndexQuantify the proportion of pixels representing culturally significant sites within urban street spaces relative to the total number of pixels.Cultural Place Index (CPI) = (P_cultural venues/P_Total) × 100%[50]
Disclaimer/Publisher’s Note: The statements, opinions and data contained in all publications are solely those of the individual author(s) and contributor(s) and not of MDPI and/or the editor(s). MDPI and/or the editor(s) disclaim responsibility for any injury to people or property resulting from any ideas, methods, instructions or products referred to in the content.