Abstract
This study investigates regional heterogeneity and spatial interdependence in digital skills mismatch across Indonesia by constructing a Digital Skills Supply–Demand Ratio (DSSDR) from the Indonesia Digital Society Index (IMDI). In line with SDG 10 (Reduced Inequalities) and SDG 4 (Quality Education), the study aims to provide policy-relevant evidence to support a more inclusive and balanced digital transformation. Using district-level data and spatial econometric models (OLS, SAR, and the SDM), the analysis evaluates both local determinants and cross-regional spillover effects. Model comparison identifies the Spatial Durbin Model as the best specification, revealing strong spatial dependence in digital skills imbalance. The results show that most local socioeconomic and digital readiness indicators do not have significant direct effects on DSSDR, while school internet coverage exhibits a consistently negative association, indicating that digital demand expands faster than local supply. In contrast, spatial spillovers are decisive: a higher share of ICT study programs in neighboring regions improves local DSSDR through knowledge and human-capital diffusion, whereas higher GRDP per capita in adjacent regions exacerbates local mismatch, consistent with a talent-attraction mechanism. These findings demonstrate that digital skills mismatch is a spatially interconnected phenomenon driven more by interregional dynamics than by local conditions alone, implying that policy responses should move beyond isolated district-level interventions toward coordinated regional strategies integrating education systems, labor markets, and digital ecosystem development. The study contributes a spatially explicit, supply–demand-based framework for diagnosing regional digital inequality and supporting more equitable and sustainable digital development in Indonesia.
1. Introduction
Achieving the Sustainable Development Goals (SDGs) is essential for improving human well-being and ensuring inclusive and sustainable development. The seventeen SDGs, comprising 169 targets, articulate an ambitious global agenda to eradicate poverty, reduce inequalities, and promote shared prosperity by 2030 [1,2]. In this context, digital technologies are increasingly recognized as key enablers of sustainable development, given their transformative potential to enhance productivity, improve public service delivery, and expand economic inclusion. Nevertheless, the rapid pace of digital transformation, when not accompanied by adequate human capital development and inclusive capacity-building, poses significant risks. Rather than narrowing development gaps, digitalization may instead reinforce existing disparities by creating new forms of exclusion based on skills, access, and capabilities. This concern is particularly relevant to SDG 4 (Quality Education), which emphasizes the development of relevant skills for decent work, and SDG 10 (Reduced Inequalities), which calls for reducing disparities across regions and population groups. Without sufficient investment in digital skills formation and equitable access to learning opportunities, digital transformation may hinder—rather than accelerate—progress toward these goals. According to the Sustainable Development Report 2025, Indonesia is ranked 77th out of 167 countries, with an SDG Index score of 70.22 in 2024 [3], indicating that substantial challenges remain in advancing sustainable development outcomes—particularly in areas related to human capital development, inequality, and regional disparities. These challenges make the effective governance of digital transformation and skills development especially critical in the Indonesian context.
The digital economy has emerged as a major driver of productivity growth and economic development in the era of Industry 4.0. Over the past two decades, rapid advances in digital technologies have profoundly reshaped multiple sectors, including the economy, governance, healthcare, and everyday life [4]. The accelerated diffusion of technologies such as artificial intelligence (AI), cloud computing, and deep learning has transformed both social structures and industrial systems. The COVID-19 pandemic further acted as a catalyst for digital adoption, normalizing virtual and hybrid modes of work and economic activity [5,6].
Digital transformation has progressed at an exponential pace. Developments in communication technologies and the Internet of Things (IoT) have facilitated the expansion of remote and hybrid work arrangements, fundamentally altering labor market dynamics [7]. This rapid transformation has generated increasing demand for advanced competencies in areas such as AI, IoT, data analytics, machine learning, and virtual and augmented reality. Consequently, governments face mounting pressure to cultivate digital talent capable of mastering these technologies, while workers are required to continuously upgrade their skills to remain competitive in a rapidly evolving labor market.
Despite its transformative potential, digitalization has also generated a critical global challenge: the widening mismatch between the supply of digitally skilled labor and industry demand. While the need for digital workers continues to increase, the availability of adequately trained and competent digital talent remains limited, resulting in persistent digital skills and innovation shortages [8,9,10]. In this study, digital skills and innovation are defined as the ability to use digital technologies, devices, and networks to access, manage, create, and communicate information, as well as to solve problems in work and daily life contexts [11].
Against this background, the growing mismatch between digital skill supply and labor market demand poses a serious risk to economic growth and national competitiveness. From a sustainable development perspective, this challenge is closely linked to SDG 4 (Quality Education), which emphasizes skills development, and SDG 10 (Reduced Inequalities), which calls for reducing regional and social disparities in digital capacity [12,13,14]. Failure to address this mismatch risks undermining the inclusive benefits of digital transformation and slowing progress toward these goals [15].
This imbalance contributes not only to socioeconomic inequality across countries but also to pronounced spatial disparities within national economies. In many regions—particularly in developing countries—digital industries struggle to recruit workers with sufficient digital proficiency, while individuals possessing digital skills often face limited employment opportunities that match their qualifications.
In the contemporary digital economy, digital literacy has become a cornerstone of both individual employability and organizational competitiveness. Proficiency in digital technologies enables adaptation to rapid technological change, strengthens organizational resilience, and enhances competitive advantage. Conversely, a persistent mismatch between individual digital capabilities and labor market requirements may result in adverse outcomes, including workforce displacement due to automation and AI adoption, as well as rising costs associated with continuous reskilling and upskilling.
Addressing digital skills mismatch requires systematic and evidence-based government intervention. Policymakers must be able to identify and map the spatial distribution of digital skill disparities—particularly at the regional and provincial levels—to design targeted capacity-building programs. In this context, a robust quantitative indicator is essential to assess the severity and spatial variation in digital labor imbalances.
To this end, this study employs the Digital Skills Supply–Demand Ratio (DSSDR) as a statistical indicator capturing the degree of mismatch between available digital competencies (supply) and labor market needs (demand). The DSSDR is derived from the difference between digital skill supply and demand, normalized by the average of their respective maximum values. This normalization produces a standardized index ranging from −100 to 100, enabling consistent comparisons of digital skills mismatch across regions.
This ratio-based approach has been widely applied in the skill mismatch literature to quantify imbalances between labor supply and demand [16,17,18]. A DSSDR value close to zero indicates that digital skill demand is largely met by existing supply. Values approaching −100 signal insufficient digital skill availability relative to industry needs, while values approaching 100 reflect an oversupply of digital skills relative to labor market demand.
The measurement of digital skills supply and demand in this study follows the framework adopted in the Indonesia Digital Society Index (IMDI). In accordance with the IMDI report and the ITU Digital Skills Toolkit [19], digital skills—on both the supply and demand sides—are classified into three levels: basic (fundamental use of digital devices and the internet), intermediate (productive use of more advanced software and applications), and advanced (higher-level capabilities involving digital problem-solving and technology-driven innovation). The indicators used for this classification are developed by the Ministry of Communication and Digital Affairs [20].
Empirical studies examining digital labor mismatch remain limited in the Asian context, particularly in developing economies. Indonesia represents a highly relevant case study, reflecting the broader challenges faced by Southeast Asian countries undergoing rapid digital transformation. Existing research largely focuses on internet access or general digital literacy, yet few studies directly quantify the mismatch between labor market demand and available digital competencies.
By incorporating the DSSDR, this study provides a more precise measurement of digital skill imbalance and enables the identification of regions where policy intervention is most urgently needed. Within the broader context of digital globalization—characterized by cross-border flows of data, technology, and digital labor—countries that fail to align digital skill supply with economic demand risk falling further behind in global competitiveness: (1) identify the key determinants (drivers and barriers) of digital skills mismatch in Indonesia, and (2) develop a practical analytical framework to address and reduce regional disparities in digital labor supply and demand.
The Electronic-Based Government System (EBGS) is closely associated with rising demand for digital skills. Higher-quality EBGS implementation serves as a proxy for advanced regional digitalization, which stimulates greater demand for digital competencies among individuals and economic actors [21].
On the supply side, the availability of digital infrastructure at the school level plays a strategic role in fostering future digital talent capable of meeting growing labor market demand [22]. Internet access in schools supports digital learning and serves as a foundational platform for early digital skill development. Moreover, school internet coverage reflects governmental commitment to narrowing the gap between digital talent demand and workforce capacity [23].
Beyond basic internet access, broader digital infrastructure—including fixed broadband, mobile broadband, and emerging edge networks, with particular emphasis on 4G and 5G technologies—also contributes positively to digital skill development. Such infrastructure facilitates access to digital services and accelerates individuals’ exposure to advanced technologies. Empirical evidence documents substantial cross-country differences in digital skill attainment among both general users and ICT professionals, closely linked to variations in infrastructure availability and quality [9].
Education remains a fundamental pillar of digital talent supply. Expanding ICT-oriented educational programs enhance the formation of future digital talent and supports the growing demand for digital skills [22,24,25]. The realization of digital skill supply is further shaped by the Labor Force Participation Rate (LFPR). Higher participation rates indicate that digitally skilled individuals are actively engaged in economic activities, transforming potential skills into effective labor supply and influencing the degree of supply–demand mismatch.
Finally, GRDP per capita reflects a region’s economic capacity to invest in human capital and absorb skilled labor. Empirical evidence suggests that higher GDP per capita is associated with reduced skill shortages, indicating a more balanced alignment between skill supply and labor market demand [26].
This study examines regional heterogeneity in digital skills mismatch across Indonesia using data from the IMDI. Recent methodological advances highlight the importance of distributional heterogeneity and tail dependence in regional and economic outcomes, particularly through approaches such as quantile regression (e.g., [27]). While this literature provides valuable insights into non-uniform effects across outcome distributions, it does not explicitly address spatial spillovers or the supply–demand mismatch structure of digital skills. This study fills this gap by introducing a spatially explicit, region-level measure of digital skills mismatch and by modeling cross-regional spillover effects using spatial econometric methods. The analysis incorporates key explanatory variables—EBGS Index, School Internet Coverage Index, Network Coverage Index, ICT Study Program Share, LFPR, and GRDP per capita—and explicitly accounts for spatially structured disparities in digital skills supply and demand [28,29].
Spatial econometric models provide a robust framework for accounting for spatial dependence and regional clustering, enabling a more comprehensive explanation of digital skills supply–demand mismatch across Indonesia.
2. Material and Methods
2.1. Material
The empirical analysis in this study draws upon primary data from the 2025 Indonesia Digital Society Index (IMDI) survey. The IMDI was designed as a comprehensive framework to measure the extent and characteristics of the digital divide across districts in Indonesia. Its architecture is organized into four core pillars—Infrastructure and Ecosystem, Digital Literacy, Empowerment, and Jobs—each comprising a set of sub-pillars and operational indicators that capture essential dimensions of digital society development. The IMDI is constructed using a two-stage Principal Component Analysis (PCA) to derive objective, data-driven weights, first at the sub-pillar level and then at the pillar level, before aggregating them into a single composite index. It is based on nationally representative survey data combined with administrative statistics and has been formally established as a national framework for monitoring digital development and regional digital disparities in Indonesia. Accordingly, the IMDI provides a conceptually grounded and empirically robust measure of digital readiness at the district level [4]. The four IMDI pillars—Infrastructure and Ecosystem, Digital Skills, Empowerment, and Jobs—capture the multidimensional nature of the digital divide, with Digital Skills reflecting the population’s capability to use digital technologies effectively. In this study, particular attention is given to the Jobs pillar, which contains indicators of both the supply of digital skills in the labor force and the demand for such skills among industries. This focus enables a systematic assessment of digital labor mismatch, defined as the gap between available digital competencies and labor-market requirements. The indicators used to measure digital skills supply and demand follow the official IMDI framework, as summarized in Table 1.

Table 1.
Operational Definitions of Digital Skills Supply and Demand Across Basic, Intermediate, and Advanced Indicators.
All indicators used to assess digital skill supply and demand were measured using a four-point Likert scale. Respondents indicated the extent to which they performed each digital skill, with response options ranging from Never (1), Occasionally (2), Frequently (3), to Always (4). This scale captures both the frequency and consistency of digital skill utilization across individuals and industries.
2.2. Digital Skill Supply–Demand Ratio (DSSDR)
To quantify the mismatch between digital skill supply and demand, this study employs the Digital Skills Supply–Demand Ratio (DSSDR), defined as:
where denotes the supply–demand ratio for region i, represents the average level digital skill supply across the basic, intermediate, and advance category, and represents the corresponding level of digital skills demand. The terms and indicate the maximum values of supply and demand observed across all districts. This formulation is adapted from the Ecosystem Service Supply–Demand Ratio proposed by [17]. The interpretation of the Digital Skills Supply–Demand Ratio (DSSDR) is straightforward. A positive value () indicates a surplus, meaning that the supply of digital skills in region i exceeds the level of demand. Conversely, a negative value () reflects a deficit, implying a shortage of digital skills relative to regional demand. Values close to zero () suggest a state of balance, where the supply of digital skills is broadly aligned with local labor market requirements. The DSSDR used in this study is a task-based, exposure-and-capability indicator derived from IMDI, rather than a direct performance-based proficiency measure, and thus reflects regional patterns of engagement in digital tasks instead of test-based skill scores.
2.3. Sampling Design
This study uses data from the Indonesia Digital Society Index (IMDI), a nationally coordinated survey system designed to monitor digital development and readiness across Indonesia. The data cover 38 provinces and 514 districts/cities and combine large-scale individual (household) surveys, enterprise surveys, and relevant administrative statistics to capture the multidimensional pillars of Infrastructure and Ecosystem, Digital Skills, Empowerment, and Jobs.
The IMDI survey employs a multistage and stratified random sampling design to ensure representativeness across regions. In the first stage, provinces and districts/cities are selected to guarantee full national coverage. In the second stage, samples are drawn separately for individuals and enterprises. Individual respondents are selected from the working-age population (15–64 years) using stratification by gender balance and educational attainment, while enterprise respondents are selected from legally registered industries using stratification by economic sector (primary, secondary, and tertiary) and firm size (micro/small versus medium/large enterprises). This combination of multistage selection and stratification ensures broad representativeness across provinces and districts/cities. The sampling procedure is summarized in Figure 1, and the detailed characteristics of respondents are reported in Table 2.
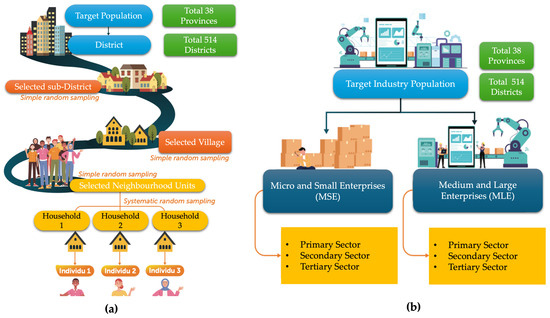
Figure 1.
Multistage Random Sampling Framework for (a) Individual and (b) Industry Respondents (Source: [20]).
Table 2.
Survey Design of the 2025 IMDI Study.
The sample size for the individual survey is determined using Slovin’s formula with a 5% margin of error and a 95% confidence level, which represents a standard and practical choice for large-scale national surveys and is empirically adopted based on the IMDI survey waves for the 2022–2024 period. This procedure yields 18,564 individual respondents nationwide. In parallel, the enterprise survey includes 11,901 industries across multiple economic sectors.
To ensure data reliability, a multi-stage quality control procedure was applied throughout data collection and processing, including duplication checks, respondent eligibility screening, and consistency checks. Only validated observations were retained, and the final dataset contains no duplicated records and no missing values in key variables, ensuring the internal consistency of the indicators. Although the overall national sample is substantial, the number of respondents at the district/city level is uneven and relatively limited in some areas. Therefore, district-level indicators are interpreted as reflecting broader regional patterns rather than precise local estimates, and this limitation is explicitly taken into account in the empirical interpretation.
Finally, to ensure consistency between the supply side (individual survey) and demand side (enterprise survey), both datasets are aggregated to the district/city level and normalized within the IMDI framework before further analysis. The Digital Skills Supply–Demand Ratio (DSSDR) is then constructed using these harmonized district-level indicators, ensuring conceptual and statistical coherence despite differences in micro-level units and sample sizes.
2.4. Hypotheses
Based on the existing literature, this study formulates the following research hypotheses:
- (a)
- H1—Electronic-Based Government System (EBGS) Index
H1:
Regions with a higher Electronic-Based Government System Index are expected to exhibit a higher (DSSDR), reflecting a lower level of digital skills mismatch, as more advanced e-government implementation increases demand for digital skills and accelerates skill alignment.
Expected direction of effect: EBGS ↑ → DSSDR ↑ → mismatch ↓
- (b)
- H2—School Internet Coverage Index
H2:
Regions with a higher School Internet Coverage Index are expected to have a higher DSSDR, indicating a reduction in digital skills mismatch, as early exposure to digital infrastructure strengthens the long-term supply of digital skills.
Expected direction of effect: School Internet ↑ → Digital skill supply ↑ → DSSDR ↑ → mismatch ↓
- (c)
- H3—Network Coverage Index
H3:
Regions with better Network Coverage—as reflected by a higher Network Coverage Index—are expected to display a higher DSSDR, indicating a smaller digital skills mismatch, due to improved access to digital services and accelerated digital skill acquisition.
Expected direction of effect: Network coverage ↑ → Skill acquisition ↑ → DSSDR ↑ → mismatch ↓
- (d)
- H4—ICT Study Program Share
H4:
Regions with a larger ICT Study Program Share are expected to have a higher DSSDR, reflecting a lower digital skills mismatch, as ICT-oriented education directly contributes to the formation of advanced digital talent aligned with labor market needs.
Expected direction of effect: ICT education ↑ → Skill supply ↑ → DSSDR ↑ → mismatch ↓
- (e)
- H5—Labor Force Participation Rate (LFPR)
H5:
Regions with a higher Labor Force Participation Rate (LFPR) are expected to exhibit a higher DSSDR, indicating a lower digital skills mismatch, as greater labor force engagement enables digital competencies to be realized as effective labor supply.
Expected direction of effect: LFPR ↑ → Effective skill supply ↑ → DSSDR ↑ → mismatch ↓
- (f)
- H6—GRDP per Capita
H6:
Regions with higher GRDP per capita are expected to demonstrate a higher DSSDR, reflecting a smaller digital skills mismatch, as stronger economic capacity supports human capital development and the absorption of digitally skilled labor.
Expected direction of effect: GRDP per capita ↑ → Human capital & absorption ↑ → DSSDR ↑ → mismatch ↓
2.5. Spatial Econometric Modeling of DSSDR
To explain the variation in digital skill mismatch across districts, we employ a spatial econometric framework based on the Spatial Durbin Model (SDM). In this specification, the digital skills mismatch, measured by the Digital Skills Supply–Demand Ratio (DSSDR), serves as the response variable, while several indicators of regional digital capacity and economic conditions are included as covariates. The variables used in the model are summarized in Table 3 below.
Table 3.
Variables in the Spatial Durbin Model.
At the district level, the SDM can be written as [29]:
where denotes the digital skills mismatch (DSSDR) in district i, is the value of the k-th covariate (e.g., SPBE, school internet coverage, GRDP) in district i; is the -th element of the spatial weight matrix , capturing spatial proximity between districts i and j. The spatial weight matrix is constructed using queen contiguity, such that if districts and share either a common boundary or a common vertex, and otherwise. This specification is a standard choice for areal data, particularly when the true spatial interaction structure is unknown and administrative boundaries are irregular, as it captures both edge- and vertex-based neighborhood relationships [30]. Although alternative specifications such as k-nearest neighbors or distance-based weight matrices could be considered, the main objective of this study is to establish the presence and substantive role of spatial dependence and spillover effects in digital skills mismatch; robustness checks using alternative weight matrices are therefore left for future research. Parameter is the spatial autoregressive parameter associated with the spatial lag of the dependent variable; are the regression coefficients for the local covariates; are the regression coefficients for the spatially lagged covariates, capturing spillover effects from neighboring districts; and is the disturbance term for district i, assumed to follow . In matrix form, the SDM can be expressed as:
where is an vector of DSSDR values; is an matrix of explanatory variables (SPBE, school internet, coverage, ICT study program, labor force participation, and GRDP); is an spatial weights matrix; and are vectors of coefficients for local and spatially lagged covariates, respectively. This specification allows the decomposition of covariate impacts into direct effects (within a district) and indirect or spillover effects (transmitted through neighboring districts), making the SDM particularly suitable for analyzing regional patterns of digital skills mismatch.
The SDM is appropriate only when the data exhibit spatial dependence. To assess this, we evaluate global spatial autocorrelation using Moran’s I, which measures whether districts with similar values tend to cluster geographically. Moran’s I is defined as [31]:
where is the number of districts (514), and represents elements of the spatial weight matrix. A Moran’s I value close to 1 indicates strong spatial clustering. The statistical significance of Moran’s I can be assessed using a standard Z–test:
where and are the expected value and variance of Moran’s I under spatial randomness. Spatial autocorrelation is considered significant when at the 5% significance level.
3. Result
3.1. Spatial Variations in Digital Skill Supply and Demand
Based on responses from individual and industry participants, the mean, standard deviation (SD), minimum, and maximum values of digital skill supply and demand were calculated, as presented in Table 4.
Table 4.
Descriptive statistics of digital skill supply and demand across basic, intermediate, and advanced categories.
Table 4 indicates that, overall, the digital skill supply is substantially lower than the demand across all skill levels—basic, intermediate, and advanced. The mean supply values for basic, intermediate, and advanced skills are 22.746, 5.461, and 4.905, respectively. In contrast, industry demand is considerably higher, reaching 53.027 at the basic level, 45.285 at the intermediate level, and 43.057 at the advanced level. These results highlight a significant gap between the supply and demand for digital skills. The distribution mismatch is clearly illustrated in Figure 2. The mean difference tests indicate a significant mismatch between digital skill supply and demand across all categories, as evidenced by p-values < 0.05 in Table 5.
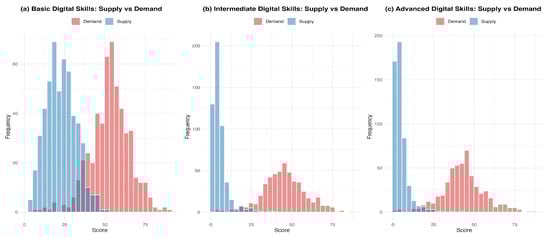
Figure 2.
Distribution mismatch between supply and demand across skill categories.
Table 5.
Results of mean difference testing for digital skill supply and demand.
Figure 3 illustrates the spatial distribution of digital skill supply and demand. The pattern reveals a pronounced mismatch across cities and regencies, with the disparity becoming most evident at the advanced skill level.
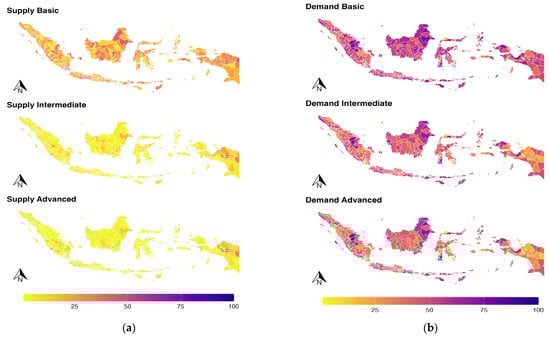
Figure 3.
Spatial distribution of digital skill (a) supply and (b) demand.
To provide an overall picture of the mismatch between digital skill supply and demand, we computed the Digital Skill Supply–Demand Ratio (DSSDR). This metric integrates all skill levels—basic, intermediate, and advanced (Figure 4). The results of the calculation are presented in Table 6.
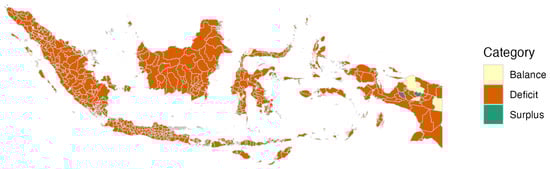
Figure 4.
Spatial distribution of the Digital Skill Supply–Demand Ratio (DSSDR).
Table 6.
Summary Statistics of the Digital Skill Supply–Demand Ratio (DSSDR).
The examination of average supply and demand figures indicates that only two districts are classified as surplus: Intan Jaya and Tolikara. These districts exhibit a greater average supply of digital skills relative to the average demand. For example, Intan Jaya reports a supply mean of 14.21 compared to a demand mean of 5.24. A like trend is observed in Tolikara, where the average supply (41.76) surpasses the average demand (35.96). Eight cities and regencies are classified under the balanced group, distinguished by negligible disparities between the mean supply and mean demand. Pinrang exhibits approximately same values (supply mean = 9.66; demand mean = 9.63). Similar situations are noted in Mamberamo Raya, Lanny Jaya, Pegunungan Bintang, Toli Toli, Nias Selatan, and Sidenreng Rappang. All remaining locations are designated as deficit areas, where the average demand for digital skills surpasses the average supply. This disparity underscores possible deficiencies in the local digital workforce, indicating a necessity for focused capacity-building and skill enhancement initiatives.
3.2. Spatial Analysis of DSSDR
3.2.1. Spatial Clustering
The preliminary phase of this research is determining the spatial grouping of discrepancies between the supply and demand for digital skills. This clustering seeks to identify regions with potential surplus, typified by elevated positive DSSDR values, and regions with potential deficiency, indicated by substantial negative values. We utilize both Global Moran’s I and Local Moran’s I (LISA) data to do this. The Global Moran’s I result is 0.200 with a p-value of 0.00, signifying a statistically significant spatial clustering pattern. Additionally, the Local Moran’s I findings, illustrated in Figure 5, indicate a significant hotspot in the Papua region. This hotspot indicates regions with elevated positive DSSDR values, implying that the availability of digital skills in these places surpasses the associated demand.
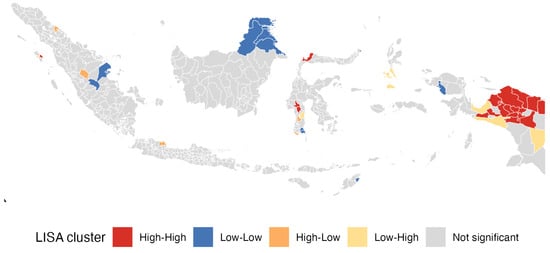
Figure 5.
Local Moran’s I Clusters for DSSDR. The “not significant” areas indicate regions where the local Moran’s I is not statistically significant, meaning these regions cannot be classified into High–High, Low–Low, High–Low, or Low–High clusters. This is an important result showing that spatial dependence in the DSSR is highly localized rather than widespread.
3.2.2. Spatial Econometrics Modeling
To evaluate the spatial variation in DSSDR, we estimated three regression models—OLS, SAR, and SDM. The best-fitting model was selected using the Akaike Information Criterion (AIC) and log-likelihood values. The results of the model comparison are presented in Table 7.
Table 7.
Parameter estimate and model comparison of OLS, SAR, and SDM.
Model comparison utilizing information criteria unequivocally demonstrates that the Spatial Durbin Model (SDM) offers the optimal fit for elucidating spatial variance in the Digital Skill Supply–Demand Ratio (DSSDR). Of the three competing specifications, the OLS model produces an AIC of 4487.663 and a log-likelihood of −2235.832, while the SAR model demonstrates a marginal enhancement in fit, with an AIC of 4484.750 and a log-likelihood of −2233.375. The SDM achieves the lowest AIC of 4469.751 and the maximum log-likelihood of −2219.875, demonstrating that the inclusion of both geographical dependence in the result and spatial lags of the explanatory variables significantly improves model performance. Thus, the SDM is designated as the recommended specification for substantive interpretation.
In the SDM, the dependent variable is the DSSDR, with positive values signifying a surplus of digital skills and negative values indicating a shortfall. Most explanatory variables are quantified as percentages, but GRDP per capita is represented in millions. The intercept is negative and statistically significant (−33.704, p = 0.016), indicating that, when all factors are maintained at their baseline levels, Indonesian regions inherently exhibit a deficiency in digital skills. At the local level, none of the factors has a statistically significant influence at the 5% threshold. The lack of statistically significant local impacts should not be construed as evidence of the insignificance of these factors. This pattern likely indicates dynamic adjustments and time-lag mechanisms, where enhancements in digital infrastructure, education, and institutional capacity gradually influence the equilibrium between the supply and demand for digital skills. In practice, investments in connectivity, education, or ICT initiatives necessitate time to convert into worker skills and labor market alignment. The current study utilizes cross-sectional data, which only reflects simultaneous relationships and cannot clearly predict delayed effects. Future research employing panel or dynamic geographical models is necessary to officially investigate the temporal adjustment mechanism behind regional digital skill disparities.
The EBGS Index has a minor negative and statistically insignificant coefficient (−0.035, p = 0.671), suggesting that enhancements in electronic-based government systems do not independently rectify the imbalance between digital skill supply and demand. The School Internet Coverage Index exhibits a negative coefficient (−0.196, p = 0.067), marginally significant at the 10% level, indicating that increased school connectivity correlates with reduced DSSDR, supporting the notion that digital exposure in educational institutions may accelerate the demand for digital skills beyond the capacity of local labor markets to meet. Network coverage (0.006, p = 0.936), the ICT study program share (−0.010, p = 0.913), the labor force participation rate (−0.118, p = 0.467), and GRDP per capita (−0.007, p = 0.483) are statistically insignificant, indicating that local infrastructure, overall labor engagement, and income levels do not directly and significantly mitigate digital skill mismatches.
In contrast, the spatial elements of the SDM are both substantively and statistically significant. The spatial autoregressive parameter is both positive and significant (ρ = 0.199, p = 0.016), indicating that DSSDR exhibits positive spatial dependence: regions with surpluses or deficits tend to cluster geographically, and the digital skill status in one region is systematically correlated with that of its neighbors. The spatial lag of the ICT study program share (WX4) exhibits a robust positive and statistically significant effect (0.417, p < 0.001), suggesting that areas adjacent to neighbors with superior ICT capabilities are likely to experience enhanced DSSDR, aligning with the notion of advantageous cross-border spillovers in digital capacity and knowledge dissemination. In contrast, the spatial lag of GRDP per capita (WX6) is negative and statistically significant (−0.288, p = 0.044), indicating that proximity to wealthier regions correlates with diminished local DSSDR, likely due to economic centers attracting digital talent from adjacent areas, thus exacerbating local deficiencies.
The residual spatial lags—EBGS (0.138, p = 0.249), School Internet Coverage (0.001, p = 0.992), Network Coverage (0.188, p = 0.238), and LFPR (−0.010, p = 0.574)—lack statistical significance. The SDM results indicate that digital skill mismatches in Indonesia are influenced more by spatially mediated processes than by local conditions alone, with the ICT readiness and economic strength of neighboring regions producing contrasting spillover effects on the equilibrium between digital skill supply and demand.
3.3. Model Validity Assessment
Diagnostic tests were performed to assess the validity of the SDM specification. Utilizing α = 0.01 as the decision threshold, all fundamental assumptions are fulfilled. The assessment of spatial autocorrelation in the residuals reveals a Moran’s I value of −0.0141 and a p-value of 0.623, signifying an absence of residual spatial dependence; thus, the spatial structure has been sufficiently represented by the SDM. The Shapiro–Wilk normality test produces W = 0.9926 with a p-value of 0.0118, exceeding the stringent α = 0.01 threshold, indicating that the null hypothesis of normally distributed residuals cannot be rejected, hence validating the normality assumption. The Breusch–Pagan test for heteroskedasticity yields BP = 15.556 (df = 6, p = 0.0163); while this is significant at the 5% level, it does not reach significance at α = 0.01, suggesting insufficient evidence of heteroskedasticity at the specified significance level. Multicollinearity diagnostics utilizing VIF values from the OLS-equivalent model indicate that all predictors are far below the standard threshold of 10 (range from 1.13 to 2.99), hence affirming the lack of concerning collinearity. Collectively, these diagnostics indicate that the SDM fulfills the essential model assumptions of independence, normalcy, homoscedasticity, and non-collinearity when assessed at α = 0.01, hence reinforcing the robustness and reliability of the model’s estimated parameters.
3.4. Direct, Indirect, and Total Effects
The disaggregation of effects in the SDM elucidates the manner in which each variable impacts the Digital Skill Supply–Demand Ratio (DSSDR) via both local (direct) mechanisms and spillover (indirect) pathways across adjacent regions. The Electronic-Based Government System Index indicates a minor negative direct effect (−0.027), implying that advancements in local e-government capacity do not directly improve the equilibrium between the supply and demand for digital skills. The positive indirect effect (0.156) suggests that EBGS advancements in adjacent regions positively influence local DSSDR, culminating in an overall positive total effect of 0.129. This indicates that digital governance improvements provide advantageous geographical spillovers, even when their localized impact is minimal (Table 8).
Table 8.
Direct, Indirect, and Total Effects Based on the SDM.
The School Internet Coverage Index demonstrates significant and consistently adverse effects across all channels. The direct effect (−0.215) and the indirect effect (−0.389) both diminish DSSDR, resulting in a substantial negative total impact of −0.604. This conclusion corroborates the previous model results, suggesting that enhanced school internet penetration amplifies digital exposure and accelerates the demand for digital skills more rapidly than supply can adapt, both locally and in adjacent areas.
The impact on Network Coverage is minimal: the direct effect (0.006), indirect effect (0.003), and overall effect (0.009) are exceedingly minor, indicating that general connectivity infrastructure does not significantly affect regional digital skill disparities.
The ICT Study Program Share has a negligible direct effect (0.002) and a substantial positive indirect effect (0.221), resulting in a significant total effect of 0.223. This pattern indicates that ICT readiness in adjacent regions significantly enhances local DSSDR, demonstrating the cross-border dissemination of digital competencies and ecosystem advantages. In contrast, local ICT readiness does not seem to immediately alter the supply–demand equilibrium.
The Labor Force Participation Rate exhibits opposing effects: a negative direct effect of −0.094 and a positive, substantial indirect effect of 0.468, culminating in a total effect of 0.373. This indicates that although local rises in labor force participation may not immediately resolve digital skill disparities, enhanced labor engagement in adjacent areas has a beneficial effect—potentially through regional labor mobility and interconnected workforce markets.
Ultimately, GRDP per capita has slight adverse effects across all channels: −0.008 directly, −0.014 indirectly, and −0.022 in total. This suggests that increased regional prosperity correlates with marginally greater shortfalls in digital skills, both locally and in adjacent regions, possibly due to economically vibrant locations creating a demand for digital labor that exceeds the local skill supply.
Collectively, these findings underscore the significance of regional spillovers in influencing patterns of digital skill mismatch. Variables like ICT readiness and EBGS have more pronounced indirect effects than direct effects, highlighting those regional digital ecosystems function within interrelated spatial networks. In contrast, school internet coverage demonstrates significant adverse effects through both direct and spillover channels, identifying it as a principal factor contributing to the growing digital skill shortages throughout Indonesia.
4. Discussion
The digital economy has emerged as a significant driver of productivity enhancement and economic progress in the context of Industry 4.0. Nonetheless, digital change does not invariably progress seamlessly. Disparities between the availability of digital competencies and labor market demands have surfaced as a prevalent issue in most emerging nations [8,32]. This issue is closely linked to the United Nations Sustainable Development Goals (SDGs), particularly SDG 4 (Quality Education), which emphasizes the development of relevant skills, equitable access to quality education, and lifelong learning opportunities [33], and SDG 10 (Reduced Inequalities), which calls for reducing regional and social disparities in development outcomes [34]. While technological advancement presents significant benefits, the availability of sufficiently skilled workers frequently remains limited, resulting in structural impediments to inclusive digital transformation. This study aims to detect and quantify the mismatch in digital skills and to elucidate the regional variables contributing to these disparities. The Digital Skills Supply–Demand Ratio (DSSDR) serves as an analytical metric to assess the disparity between the availability of digital skills and labor market requirements. From a policy standpoint, a continual mismatch in digital skills jeopardizes economic competitiveness and hinders advancement towards fair and inclusive development, as outlined in the SDGs, by exacerbating spatial and socioeconomic inequities in access to digital possibilities.
The spatial mapping results reveal that, out of 514 districts in Indonesia, only two districts exhibit a surplus condition and eight districts are classified as balanced, while the vast majority of districts remain in a deficit state. The districts categorized as surplus and balanced are predominantly located in Papua. This pattern is closely associated with the distribution of digital skills training participation rates, including both self-initiated training and programs facilitated by the government. As illustrated in the map, Papua records relatively higher levels of participation in digital skills training, as indicated by the prevalence of orange and red colors, which contributes to a more favorable alignment between digital skills supply and demand in the region (Figure 6).
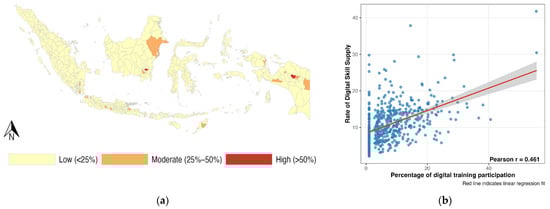
Figure 6.
(a) Spatial distribution of digital training participation and (b) relationship between total digital skills supply and participation rate.
From the perspective of SDG 4 (Quality Education), these findings underscore the critical importance of targeted skills development and equitable access to learning opportunities in strengthening regional digital readiness. At the same time, the pronounced spatial clustering of digital skills deficits reveals persistent territorial inequalities in human capital formation, which is directly aligned with the concerns of SDG 10 (Reduced Inequalities). In this context, expanding and better targeting digital skills training emerges as a strategic and necessary policy instrument to reduce the persistent mismatch between digital skills supply and labor market demand [5,35,36].
This study employs spatial econometric modeling to examine the spatial nature of the digital skills supply–demand mismatch. The findings provide strong empirical evidence that disparities between digital skills supply and demand in Indonesia cannot be adequately understood solely through the local characteristics of individual regions. Instead, these disparities are significantly shaped by spatial interactions across regions. The superior performance of the Spatial Durbin Model (SDM) relative to OLS and SAR specifications underscores that both spatial dependence in the dependent variable and spillover effects from explanatory variables play a crucial role in shaping patterns of digital skills imbalance. Empirically, the SDM emerges as the preferred model, as indicated by the lowest AIC, the highest log-likelihood, and the fulfillment of model validity diagnostics.
The estimation results further reveal that Indonesian regions are structurally predisposed to digital skills deficits, as indicated by a statistically significant negative intercept. This suggests the existence of a systemic gap between the rapidly expanding demand for digital skills and the capacity of the available workforce, even before accounting for regional contextual factors. In other words, the digital skills mismatch in Indonesia is not merely a localized or sector-specific issue, but a structural challenge embedded within the broader national digital economy ecosystem. Addressing this condition requires strategic policy interventions, particularly in strengthening human capital development. In line with SDG 10 (Reduced Inequalities), reducing disparities in digital capacity across regions must be prioritized, while improvements in the education system, consistent with the goals of SDG 4 (Quality Education), are essential to expand equitable access to high-quality digital skills training and education [37,38].
Interestingly, most explanatory variables do not exhibit statistically significant local (direct) effects on the DSSDR. Indicators such as the Electronic-Based Government System (SPBE), network infrastructure readiness, the share of ICT study programs, labor force participation, and GRDP per capita do not directly improve the balance between digital skills supply and demand at the regional level. This suggests that improvements in institutional capacity, infrastructure, or economic prosperity within a single region do not automatically translate into immediate gains in local digital skills availability. Instead, these results point to the presence of time lags and structural frictions in transforming digital development into a workforce that is effectively aligned with labor market needs. More broadly, the findings indicate that digitalization should not be treated merely as a technological upgrade, but rather as a complex socioeconomic transformation that requires a systemic and integrated policy approach [39].
In contrast, the School Internet Coverage Index exhibits a negative effect on DSSDR, both directly and indirectly. This result strengthens the argument that expanding digital access in the education sector may accelerate digital exposure and aspirations among younger generations, thereby generating a surge in demand for digital skills that current education and training systems are unable to accommodates [40]. Consequently, expanding educational connectivity without strengthening transition pathways into the digital labor market may unintentionally widen digital skills gaps rather than close them.
The spatial dimension captured by the SDM provides substantially deeper insights into the nature of digital skills mismatch. The positive and significant spatial autoregressive parameter indicates that DSSDR is spatially clustered, meaning that regions experiencing digital skills surpluses or deficits tend to be geographically proximate. This pattern suggests that digital skills inequality evolves as a regional and interconnected phenomenon rather than as an aggregation of isolated local conditions. Moreover, the positive and significant spillover effects of neighboring ICT readiness highlight the central role of regional digital ecosystems. In this context, building regional digital innovation ecosystems is not merely a strategic response to global digital transformation, but also a crucial driver of high-quality and inclusive regional development [41]. ICT preparedness in adjacent regions enhances a region’s DSSDR through mechanisms such as knowledge diffusion, industrial networking, and skilled labor mobility. This finding aligns with knowledge spillover theory and reinforces the view that digital development transcends administrative boundaries.
Conversely, the negative spillover effects of neighboring GRDP per capita point to a talent siphoning effect, whereby economically stronger regions attract digitally skilled workers from surrounding areas. Regions located near more prosperous economic centers thus tend to experience intensified digital skills deficits. This dynamic reflects broader patterns of regional inequality, where economic growth may inadvertently deepen interregional skill disparities in the absence of inclusive talent development and retention policies.
These two spillover effects point to distinct and economically intuitive mechanisms. The positive spillover from neighboring ICT study programs reflects cross-district diffusion of digital human capital through graduate mobility, interregional training networks, and shared digital ecosystems. In contrast, the negative spillover from neighboring GRDP per capita is consistent with a talent-attraction (or talent-siphoning) effect, whereby economically stronger regions draw skilled workers from surrounding areas and thereby weaken the local skill balance in nearby districts. From a regional development perspective, these spatial patterns align closely with theories of human capital mobility, agglomeration economies, and core–periphery dynamics. Regions with stronger economic and technological bases tend to attract skilled labor from adjacent areas, reinforcing cumulative advantages in core regions while deepening skill shortages in peripheral areas. At the same time, positive spillovers from neighboring ICT readiness reflect knowledge diffusion and interregional learning processes, through which digital capabilities and technological practices spread across regional boundaries. This interpretation is consistent with the Indonesian evidence reported by [42], who show that human capital and knowledge spillovers operate through spatial and technological channels at the district level. In this sense, digital skills mismatch in Indonesia follows a classic pattern of spatially uneven development, in which labor mobility and agglomeration forces jointly shape the geography of human capital in the digital economy [43]. These findings affect Indonesia’s regional digital development policy. First, the substantial geographical dependence and spillover effects suggest that district-level interventions are insufficient; policies must be coordinated across regions, especially functionally related economic sectors. Second, positive spillovers from neighboring ICT readiness suggest that investments in digital education and ICT ecosystems can benefit all regions, whereas negative spillovers from neighboring GRDP per capita suggest a talent-drain mechanism from peripheral to core regions. Talent retention strategies, regional incentives, and more balanced digital industry spatial distribution outside large economic hubs are needed. Third, poor local effects of infrastructure and socioeconomic variables show that infrastructure growth alone cannot alleviate digital skills mismatch without education, training, and school-to-work transition system reforms. A geographically coordinated and integrated policy framework linking digital infrastructure, education, labor markets, and regional development initiatives is needed to reduce digital skills mismatch.
The decomposition of direct and indirect effects further confirms that key variables—such as SPBE and ICT readiness—exert their influence primarily through spillover channels rather than local effects. This finding implies that digital skills development policies focused exclusively on individual regions may be inherently limited in effectiveness [44]. Instead, regional and interregional policy approaches that explicitly account for labor mobility and the integration of digital ecosystems are increasingly relevant [45].
Overall, the findings suggest that differences in digital abilities in Indonesia are a complicated spatial issue, determined by the interaction of digital preparedness, economic structure, and regional characteristics. In order to achieve the goals of SDG 4 (Quality Education) and SDG 10 (Reduced Inequalities), addressing the mismatch in digital skills requires more than just improving infrastructure or connectivity. A more balanced, inclusive, and spatially equitable digital revolution requires coordinated initiatives. These efforts should combine educational institutions, labor markets, and regional development policies.
Future research could extend the present framework by exploring alternative constructions of the DSSDR, particularly by introducing differential weighting schemes across basic, intermediate, and advanced skill levels or alternative normalization strategies. Such sensitivity analyses would help assess the robustness of the index and pro-vide deeper insights into how the relative importance of different skill tiers shapes the observed patterns of digital skills mismatch
5. Conclusions
This study provides a comprehensive assessment of the spatial dynamics shaping digital skills mismatch across Indonesian regions using the Digital Skills Supply–Demand Ratio (DSSDR). Model comparisons across OLS, SAR, and SDM specifications show that the Spatial Durbin Model (SDM) offers the best empirical fit, confirming that digital skills mismatch is driven not only by local conditions but also by strong spatial spillover effects. While most local socioeconomic and digital readiness indicators—such as EBGS, ICT study program share, network coverage, LFPR, and GRDP per capita—do not exhibit statistically significant direct effects, school internet coverage consistently shows negative direct and indirect impacts, indicating that digital demand expands faster than local supply. The spatial dimension proves central in explaining regional disparities: regions tend to cluster into persistent surplus and deficit areas, ICT readiness in neighboring regions improves local DSSDR through cross-regional diffusion of digital capabilities, while higher GRDP per capita in adjacent regions exacerbates local shortfalls through a talent-attraction mechanism. These findings indicate that the disparity of digital skills in Indonesia is fundamentally a spatial and interregional issue. In the context of SDG 10 (Reduced Inequalities), this suggests addressing regional digital disparities necessitates coordinated, cross-regional policy measures rather than isolated district-level initiatives. Simultaneously, the prominent influence of education-related variables underscores the significance of SDG 4 (Quality Education), especially in enhancing the coherence between digital education systems, training pathways, and labor market demands. Therefore, effective policy responses must incorporate education reform, workforce development, and digital ecosystem initiatives within a spatially coordinated regional development framework.
This study also has limitations. Although the national sample is large (18,564 individuals and 11,901 enterprises), the number of observations at the district level is uneven and relatively modest, so district-level indicators should be interpreted as reflecting broader regional patterns rather than precise local estimates. Future research would benefit from panel or longitudinal data to analyze dynamic adjustment processes and from robustness checks using alternative spatial weight matrices and alternative DSSDR constructions, including differential weighting across skill levels.
Author Contributions
I.G.N.M.J., D.K., L.A., A.S. and F.K.: methodology, validation, and formal analysis; N., H.P., Y.A.A.S. and N.H.: investigation, resources, supervision; I.G.N.M.J., D.K., L.A., Y.A.A.S. and S.S.P.: writing—original draft preparation; S.S.P., Y.A.A.S. and L.A.: visualization; and A.S.: project administration, funding acquisition. All authors have read and agreed to the published version of the manuscript.
Funding
This publication charge is funded by Unpad through the Indonesian Endowment Fund for Education (LPDP) on behalf of the Indonesian Ministry of Higher Education, Science and Technology and managed under the EQUITY Program (Contract No. 4303/B3/DT.03.08/2025 and 3927/UN6.RKT/HK.07.00/2025).
Institutional Review Board Statement
Not applicable.
Informed Consent Statement
Not applicable.
Data Availability Statement
The original contributions presented in this study are included in the article. Further inquiries can be directed to the corresponding author.
Acknowledgments
The authors gratefully acknowledge the Agency for Human Resources Development on Communication and Digital Affairs, Ministry of Communication and Digital Affairs, and Universitas Padjadjaran for funding this research. The publication charge for this article is funded by Universitas Padjadjaran through the Indonesian Endowment Fund for Education (LPDP) on behalf of the Indonesian Ministry of Higher Education, Science and Technology and managed under the EQUITY Program (Contract No. 4303/B3/DT.03.08/2025 and 3927/UN6.RKT/HK.07.00/2025). The authors also acknowledge the use of the DeepSeek (https://www.deepseek.com, accessed on 11 November 2025) generative AI tool as a technical aid to support the development and refinement of R 4.5.1 code for data processing and analysis. The AI tool did not generate scientific content, design the study, or contribute to the interpretation of the results; all scientific responsibility remains entirely with the authors.
Conflicts of Interest
The authors declare no conflicts of interest.
References
- Ga, J.; Bong, J.; Yu, M.; Kwak, M. Digital Enablers of Sustainability: Insights from Sustainable Development Goals (SDGs) Research Mapping. Sustainability 2025, 17, 7031. [Google Scholar] [CrossRef]
- Kücükgül, E.; Cerin, P.; Liu, Y. Enhancing the Value of Corporate Sustainability: An Approach for Aligning Multiple SDGs Guides on Reporting. J. Clean. Prod. 2022, 333, 130005. [Google Scholar] [CrossRef]
- Sachs, J.D.; Lafortune, G.; Fuller, G.; Lablonovski, G. Sustainable Development Report 2025: Financing Sustainable Development to 2030 and Mid-Century; Dublin University Press: Dublin, Ireland, 2025. [Google Scholar]
- Jaya, I.G.N.M.; Pahlevi, S.M.; Susenna, A.; Agustina, L.; Kusumasari, D.; Sukma, Y.A.A.; Hernikawati, D.; Rahmi, A.A.; Pravitasari, A.A.; Kristiani, F. Framework for Monitoring the Spatiotemporal Distribution and Clustering of the Digital Society Index of Indonesia. Sustainability 2024, 16, 11258. [Google Scholar] [CrossRef]
- Yang, G.; Yao, S.; Dong, X. Digital Economy and Wage Gap between High- and Low-Skilled Workers. Digit. Econ. Sustain. Dev. 2023, 1, 7. [Google Scholar] [CrossRef]
- Maity, R.; Lee, K.L. The Impact of Remote and Hybrid Work Models on Small and Medium-Sized Enterprises Productivity: A Systematic Literature Review. SN Bus. Econ. 2025, 5, 158. [Google Scholar] [CrossRef]
- Vărzaru, A.A.; Bocean, C.G. Digital Transformation and Innovation: The Influence of Digital Technologies on Turnover from Innovation Activities and Types of Innovation. Systems 2024, 12, 359. [Google Scholar] [CrossRef]
- Gayatri, G.; Jaya, I.G.N.M.; Rumata, V.M. The Indonesian Digital Workforce Gaps in 2021–2025. Sustainability 2023, 15, 754. [Google Scholar] [CrossRef]
- Obelovska, K.; Abziatov, A.; Doroshenko, A.; Dronyuk, I.; Liskevych, O. Analysis of Digital Skills and Infrastructure in EU Countries Based on DESI 2024 Data. Future Internet 2025, 17, 228. [Google Scholar] [CrossRef]
- Mhaske, P.; Bhattacharjee, B.; Haldar, N.; Upadhyay, P.; Mandal, A. Bridging Digital Skill Gaps in the Global Workforce: A Synthesis and Conceptual Framework Building. Res. Glob. 2025, 11, 100311. [Google Scholar] [CrossRef]
- Mammadov, H.; Romero, I. Digital Innovation. In International Encyclopedia of Business Management; Elsevier: Amsterdam, The Netherlands, 2026; pp. 362–366. [Google Scholar]
- Hariyani, D.; Hariyani, P.; Mishra, S. Digital Technologies for the Sustainable Development Goals. Green Technol. Sustain. 2025, 3, 100202. [Google Scholar] [CrossRef]
- Rydzewski, P. Digital Inequality and Sustainable Development. Probl. Ekorozwoju 2025, 20, 96–108. [Google Scholar] [CrossRef]
- Rothe, F.-F.; Audenhove, L.V.; Loisen, J. Digital Development, Inequalities and the Sustainable Development Goals: What Does “Leave No-One Behind” Mean for ICT4D? Inf. Technol. Dev. 2023, 29, 9–26. [Google Scholar] [CrossRef]
- Bocean, C.G. Sustainable Development in the Digital Age: Harnessing Emerging Digital Technologies to Catalyze Global SDG Achievement. Appl. Sci. 2025, 15, 816. [Google Scholar] [CrossRef]
- Wieling, M.; Borghans, L. Discrepancies Between Supply and Demand and Adjustment Processes in the Labour Market. Labour 2001, 15, 33–56. [Google Scholar] [CrossRef]
- Wang, Z.; Wang, R.; Luo, K.; Liang, S.; Xie, M. Machine Learning Insights into Supply—Demand Mismatch, Interactions and Driving Mechanisms of Ecosystem Services Across Scales: A Case Study of Xingtai, China. ISPRS Int. J. Geo-Inf. 2025, 14, 452. [Google Scholar] [CrossRef]
- Rikala, P.; Braun, G.; Järvinen, M.; Stahre, J.; Hämäläinen, R. Understanding and Measuring Skill Gaps in Industry 4.0—A Review. Technol. Forecast. Soc. Change 2024, 201, 123206. [Google Scholar] [CrossRef]
- ITU. Digital Skills Toolkit; ITU Publications: Geneva, Switzerland, 2018. [Google Scholar]
- Komdigi. Indeks Masyarakat Digital Indonesia; Komdigi: Jakarta, Indonesia, 2025. [Google Scholar]
- Tokovska, M.; Ferreira, V.N.; Vallušova, A.; Seberíni, A. E-Government—The Inclusive Way for the Future of Digital Citizenship. Societies 2023, 13, 141. [Google Scholar] [CrossRef]
- Sofrankova, B.; Sira, E.; Horvathova, J.; Mokrisova, M. Digital Skills and Digital Transformation Performance in the EU-27. Economies 2025, 13, 315. [Google Scholar] [CrossRef]
- Judijanto, L.; Nurwanto, N. The Impact of Technology Access Inequality and Digital Skill Disparities on Social Integration. Eastasouth J. Soc. Sci. Humanit. 2024, 2, 89–101. [Google Scholar] [CrossRef]
- Jony, S.S.R.; Kano, T.; Hayashi, R.; Matsuda, N.; Rahman, M.S. Online Job Portal Data of the ICT Sector in Bangladesh. Educ. Sci. 2022, 12, 423. [Google Scholar] [CrossRef]
- Alghamdi, J.; Holland, C. ICT Integration in Education: Saudi Arabia and Ireland. Educ. Inf. Technol. 2020, 25, 4721–4745. [Google Scholar] [CrossRef]
- Guo, Y.; Langer, C.; Mezzanzanica, M.; Pallucchini, F.; Trentin, F.; Wiederhold, S. Skill Demand, Skill Supply, and Skill Mismatch in the EU. Pillars. 2020. Available online: https://www.h2020-pillars.eu/node/1154 (accessed on 20 December 2025).
- Ul-Durar, S.; Dimitriadis, K.A.; Arshed, N.; De Sisto, M.; Harati, H. Distributional and Tail-Dependent Perspectives in Economic Relationships: A Review of Quantile Regression Application. J. Econ. Surv. 2025, in press. [Google Scholar] [CrossRef]
- Arbia, G.; Ghiringhelli, C.; Mira, A. Estimation of Spatial Econometric Models with Large Datasets. Reg. Sci. Urban Econ. 2019, 76, 67–73. [Google Scholar] [CrossRef]
- Elhorst, J.P. Spatial Econometrics: From Cross-Sectional Data to Spatial Panels; Springer: Berlin/Heidelberg, Germany, 2014. [Google Scholar]
- Liu, P.; Chen, Y.; Liang, X.; Li, H.; Biljecki, F.; Stouffs, R. A Graph Neural Network for Small-Area Estimation: Integrating Spatial Regularisation, Heterogeneous Spatial Units, and Bayesian Inference. Int. J. Geogr. Inf. Sci. 2025, 1–39. [Google Scholar] [CrossRef]
- Moran, P. A Test for the Serial Independence of Residuals. Biometrika 1950, 37, 178–181. [Google Scholar] [CrossRef] [PubMed]
- Senkrua, A. Skills Mismatch in Developed and Developing Countries. Int. J. Sustain. Dev. World Policy 2021, 10, 8–24. [Google Scholar] [CrossRef]
- Matović, S.; Bajrami, D.D.; Gajić, T.; Lakić, M.; Martinov, D.; Šuput, S.; Radosavac, A.; Đervida, R. Beyond Numbers: Challenges in Measuring SDG4 Targets–Serbia’s Perspective. Sustainability 2024, 16, 10006. [Google Scholar] [CrossRef]
- Liu, T.; Zhu, X.; Cao, M. Impacts of Reduced Inequalities on Quality Education: Examining the Relationship Between Regional Sustainability and Higher Education. Sustainability 2022, 14, 14112. [Google Scholar] [CrossRef]
- Barabasch, A.; Keller, A. Individualizing Workplace Learning with Digital Technologies. In Digital Transformation of Learning Organizations; Springer: Cham, Switzerland, 2021; pp. 115–130. [Google Scholar]
- Schultheiss, T.; Backes-Gellner, U. Updating Education Curricula and Technology Adoption. J. Technol. Transf. 2024, 49, 191–235. [Google Scholar] [CrossRef]
- Gupta, A.S.; Chakraborty, A. Impact of Digital Education on Attainment of SDG 4. J. Inform. Educ. Res. 2025, 5, 1–15. [Google Scholar]
- O’Sullivan, K.; Clark, S.; Marshall, K.; MacLachlan, M. A Just Digital Framework to Ensure Equitable Achievement of The Sustainable Development Goals. Nat. Commun. 2021, 12, 6345. [Google Scholar] [CrossRef] [PubMed]
- Fróna, D.; Fróna-Hadas, D. Digital Transformation in Rural Hungary: Infrastructure, Skills and Uptake Across Regions. Land 2025, 14, 2034. [Google Scholar] [CrossRef]
- Alenezi, M.; Wardat, S.; Akour, M. The Need of Integrating Digital Education in Higher Education: Challenges and Opportunities. Sustainability 2023, 15, 4782. [Google Scholar] [CrossRef]
- An, X.; Tong, L. Research on the Dissipative Evolution of the Regional Digital Innovation Ecosystem from the Perspective of Symbiosis Theory. Sustainability 2025, 17, 8121. [Google Scholar] [CrossRef]
- Isnaeni, N.F.; Khoirunurro, K. Knowledge Spillovers and Human Capital in Indonesia. Asia-Pac. J. Reg. Sci. 2021, 5, 21–39. [Google Scholar] [CrossRef]
- Herbst, M.; Rok, J. Mobility of Human Capital and Its Effect on Regional Economic Development. Review of Theory and Empirical Literature. Munich Pers. RePEc Arch. 2013, 45755. [Google Scholar]
- Salahuddin, M.; Gow, J. Internet Usage and Economic Growth in South Africa. Telemat. Inform. 2016, 33, 1141–1154. [Google Scholar] [CrossRef]
- Faggian, A.; Franklin, R. Human Capital Redistribution in the USA. Spat. Econ. Anal. 2014, 9, 376–395. [Google Scholar] [CrossRef]
Disclaimer/Publisher’s Note: The statements, opinions and data contained in all publications are solely those of the individual author(s) and contributor(s) and not of MDPI and/or the editor(s). MDPI and/or the editor(s) disclaim responsibility for any injury to people or property resulting from any ideas, methods, instructions or products referred to in the content. |
© 2026 by the authors. Licensee MDPI, Basel, Switzerland. This article is an open access article distributed under the terms and conditions of the Creative Commons Attribution (CC BY) license.