Article

Reducing Household Food Waste Through Education: A Pilot Intervention and Evaluation for Low-Income Families in California

Division of Agriculture and Natural Resources, University of California, Davis, CA 95618, USA
*
Author to whom correspondence should be addressed.
Sustainability 2026, 18(2), 1078; https://doi.org/10.3390/su18021078
Submission received: 18 December 2025 / Revised: 15 January 2026 / Accepted: 19 January 2026 / Published: 21 January 2026
(This article belongs to the Special Issue Consumer Behavior, Food Waste and Sustainable Food Systems)

Abstract

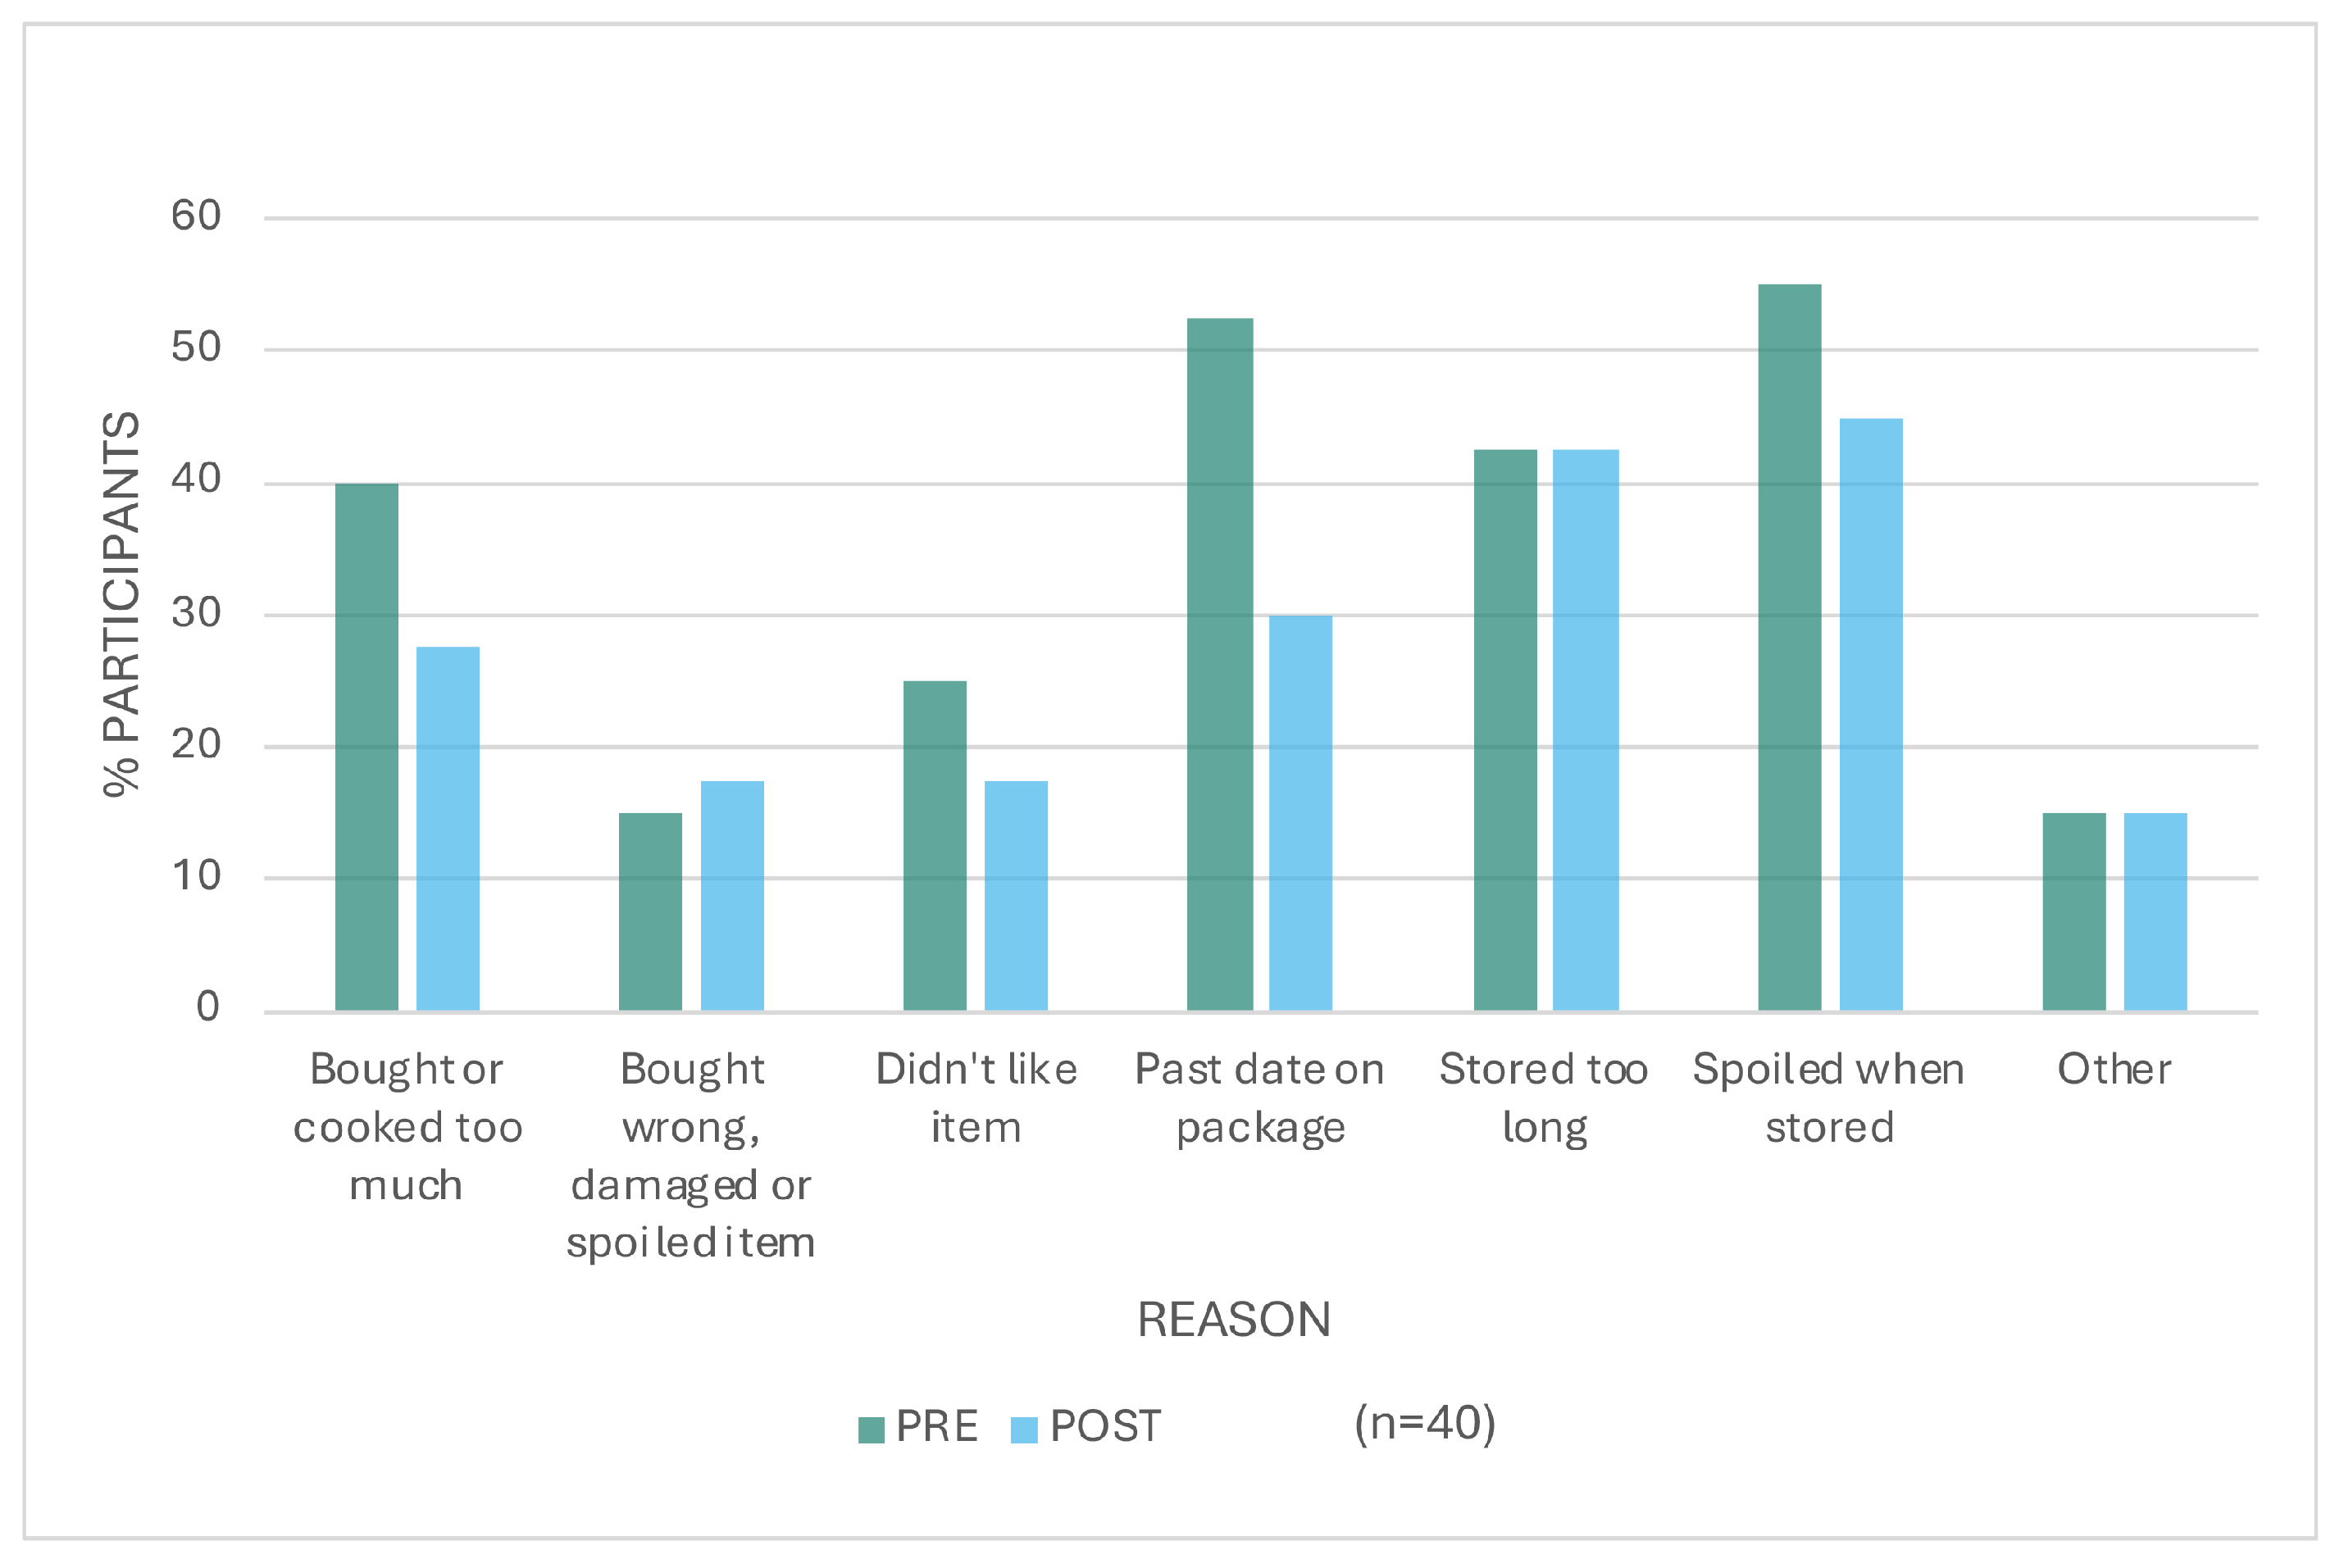
Household food waste is a complex issue shaped by socioeconomic conditions, household size, time and resource constraints, and routine food management behaviors. Understanding the practices, attitudes, barriers, and motivators that influence food waste is crucial for designing effective and sustainable interventions for low-income households experiencing high rates of food insecurity. Guided by community input, a food waste reduction education program was developed and piloted in seven California counties. In total, 50 adults were enrolled; 40 completed pre/post surveys, 17 completed food waste audits, and 14 responded to a four-month follow-up survey. Survey results showed significant increases in key food management behaviors: making and using a shopping list, freezing food, and using leftovers in future meals. The percentage of participants discarding food because of package dates declined from 53% to 30%. All measures of barriers and self-efficacy improved. Food audit results indicated the volume and weight of solid and liquid food waste decreased, although the changes were not statistically significant. At follow-up, all respondents reported checking their refrigerator and cupboards before shopping, making a shopping list, and storing and reheating food safely all or most of the time. Overall, the findings demonstrate that practical, skills-based education can help low-income households reduce food waste.

1. Introduction

The coexistence of widespread food insecurity and high household food waste in the US is a paradox within the food system. In 2023, the United States Department of Agriculture (USDA) reported that 47 million people, including nearly 14 million children nationally, are living in food-insecure households; yet the average US household wastes 31.9 percent of the food it purchases, amounting to an estimated cost of $240 billion [1,2]. In precise terms, the annual food waste in the nation is estimated to cost a household of four $2913, with a weekly cost of $56 [3]. In California, residents discard nearly six million tons of food annually, contributing 18 percent of the total material sent to landfills, while approximately three million households and a little over a million households with children across the state experience limited and inconsistent access to food [4,5]. This underscores the need to understand the behavioral, economic, environmental, and policy-related drivers of household food waste to inform effective and sustainable interventions that can support food security among low-income households.
Food waste not only carries economic cost but also significant environmental consequences. According to the Environmental Protection Agency (EPA), the largest components of municipal solid waste are paper and paperboard (23.1%), food (21.6%), plastics (12.2%), and yard trimmings (12.1%), and about one-third of the food available in the US is never consumed [6,7]. When food is wasted, all resources used in its production, processing, and distribution are also lost. Once in landfills, decomposing food generates methane, a potent greenhouse gas that contributes to global warming and climate change. To address methane and other short-lived climate pollutants, California passed Senate Bill 1383, which aimed to reduce organic waste disposal in landfills by 75 percent by 2025 [4]. At the global level, the United Nations Sustainable Development Goal 12.3 seeks to halve food waste at the retail and consumer levels by 2030 [8].
Household food waste is a complex issue that differs based on household size and socioeconomic status and is affected by the household’s attitudes, barriers, motivators, practices, and its food-reduction awareness. For instance, a study on US consumers’ food waste awareness and attitudes indicated that nearly 70 percent of the study respondents agreed that discarding food after the package date reduces the risk of foodborne illness, and almost 60 percent believed that some degree of food waste is necessary to maintain meal freshness [9]. Similarly, a 2019 study on food-related routines related to refrigerated products showed that food odor and appearance and package date labels largely influence decisions in discarding food [10]. In households with children, perishable items, such as fruits, vegetables, cereal-based products, and dairy products, were the most commonly discarded foods [11]. Furthermore, the quantity and composition of household waste varied significantly across socioeconomic groups, with the highest generation rates observed in higher-income households, followed by middle and lower-income groups [12].
Despite growing attention to food waste mitigation, there is limited research on food-waste practices among low-income households and on effective strategies to address the specific needs of this population around reducing household food waste and supporting food security. Previous work suggests that interventions and campaigns are found to be most effective when they are free to participants, address food literacy, use multiple mass-media platforms, tailor content by age group, and frame messages around personal values [13]. Food waste reduction is especially important for low-income households because they face unique barriers such as limited food budgets, higher rates of food insecurity, reliance on donated food, inconsistent food supplies, limited culinary skills, and/or kitchen and storage equipment—all of which suggest opportunities for providing additional resources with tools, strategies, and knowledge to extend the usability of food.
Research has shown that consumer education is a key strategy for diverting food waste from landfills [14]. In the US, Cooperative Extension educators can play an essential role in reducing consumer food waste. The Cooperative Extension System is a nationwide educational network, supported by the USDA, that connects the public with research-based information from land-grant universities. As University of California, Cooperative Extension (UCCE) researchers and educators, the objectives of our work were to: (1) fill the gap in research to better understand the current level of household food waste reduction knowledge, practices, attitudes, barriers, and motivators of consumers participating in federally funded nutrition education programs for low-income populations in California; and (2) develop, implement, and evaluate culturally and linguistically appropriate educational strategies to support consumers’ reduction in food waste.
The UCCE workgroup designed a three-phase research project to address food waste in California’s low-income households. Figure 1 illustrates the phases of the project. Phase 1 involved understanding the perspectives and attitudes regarding household food waste by surveying UCCE statewide program educators, staff, and volunteers [15]. In Phase 2, parents in the community who qualified for federally funded food assistance programs were recruited to participate in group discussions about their household food practices and motivations for saving food [16]. In Phase 3, a toolkit with a lesson series was developed based on the needs assessments from Phases 1 and 2 and piloted in seven California counties.
This article focuses on Phase 3, the delivery and evaluation of the lesson series pilot. The study aims to examine the effectiveness of our lesson series in improving low-income participants’ food resource management attitudes, behaviors, and self-efficacies, removing knowledge barriers in reducing household food waste, and reducing the amount of food thrown away.

2. Materials and Methods

2.1. Lesson Series Pilot

The lesson series was developed as a result of community feedback sessions and consisted of four one-hour lessons on the following topics:
  • Planning and shopping–tips for meal planning, making a shopping list, and shopping to save food and money.
  • Cooking–food preparation and cooking techniques to reduce waste, recipes to repurpose leftovers, and getting the most out of produce.
  • Food storage–organizing the kitchen, understanding food date labels, and food storage timelines and strategies for best quality, freshness, ripeness, and safety.
  • Handling excess food–food preservation methods, best practices for freezing foods, benefits of composting, identifying compostable waste, and sorting waste for collection.
Each lesson included a corresponding presentation, a lesson plan for educators with lesson preparation instructions, teaching scripts, a supply list, and handouts for participants to complete activities or reinforce learning.
Designed to be participant-centered, interactive, and stand-alone, all lessons in the series followed the same structure:
5.
Recap of the previous lesson and goal check-in (if applicable).
6.
Open-ended discussion questions to introduce the topic.
7.
Learning objectives.
8.
Two hands-on small group activities.
9.
Key messages and goal setting.
10.
Conclusions, participant feedback, and incentives.
The toolkit with the lesson series, “Plan, Prep, Preserve: Your Path to Saving Food and Money”, is available upon request from the corresponding author.

2.2. Participant Recruitment and Eligibility

The lesson series was piloted across seven California counties, representing a diverse mix of rural and urban communities in the northern, central, and southern regions of the state, to assess the effectiveness of the program. Participants were recruited through community partners and UCCE educators using flyers and word of mouth. Sites included three family resource centers, a community health center, an elementary school site, and two supportive housing sites. Prior to the pilot, participants had not attended UCCE community nutrition education programs, which often incorporate food resource management information.
To verify eligibility, interested individuals were asked to complete a short screening survey, either in writing, verbally, or online. Participants were required to be 18 years of age or older, have at least one child in the household, prepare most of the meals for the household, speak and read English, and be available to attend all four lessons in person.
Consent to participate was obtained verbally during the first class. Participants received between $50 and $100 (United States Dollars) in gift cards based on their level of participation. Study protocols were approved by the University of California, Davis Institutional Review Board.
Initially, 67 participants were openly recruited at the seven sites serving low-income families. Fifty enrolled in the pilot by completing the pre-pilot survey; 40 completed both the pre- and post-pilot surveys and participated in one or more lessons; and 25 completed all lessons and assessments. Food waste audits were performed at three of the seven sites. Table 1 summarizes the pilot participation details.

2.3. Pilot Plan and Timeline

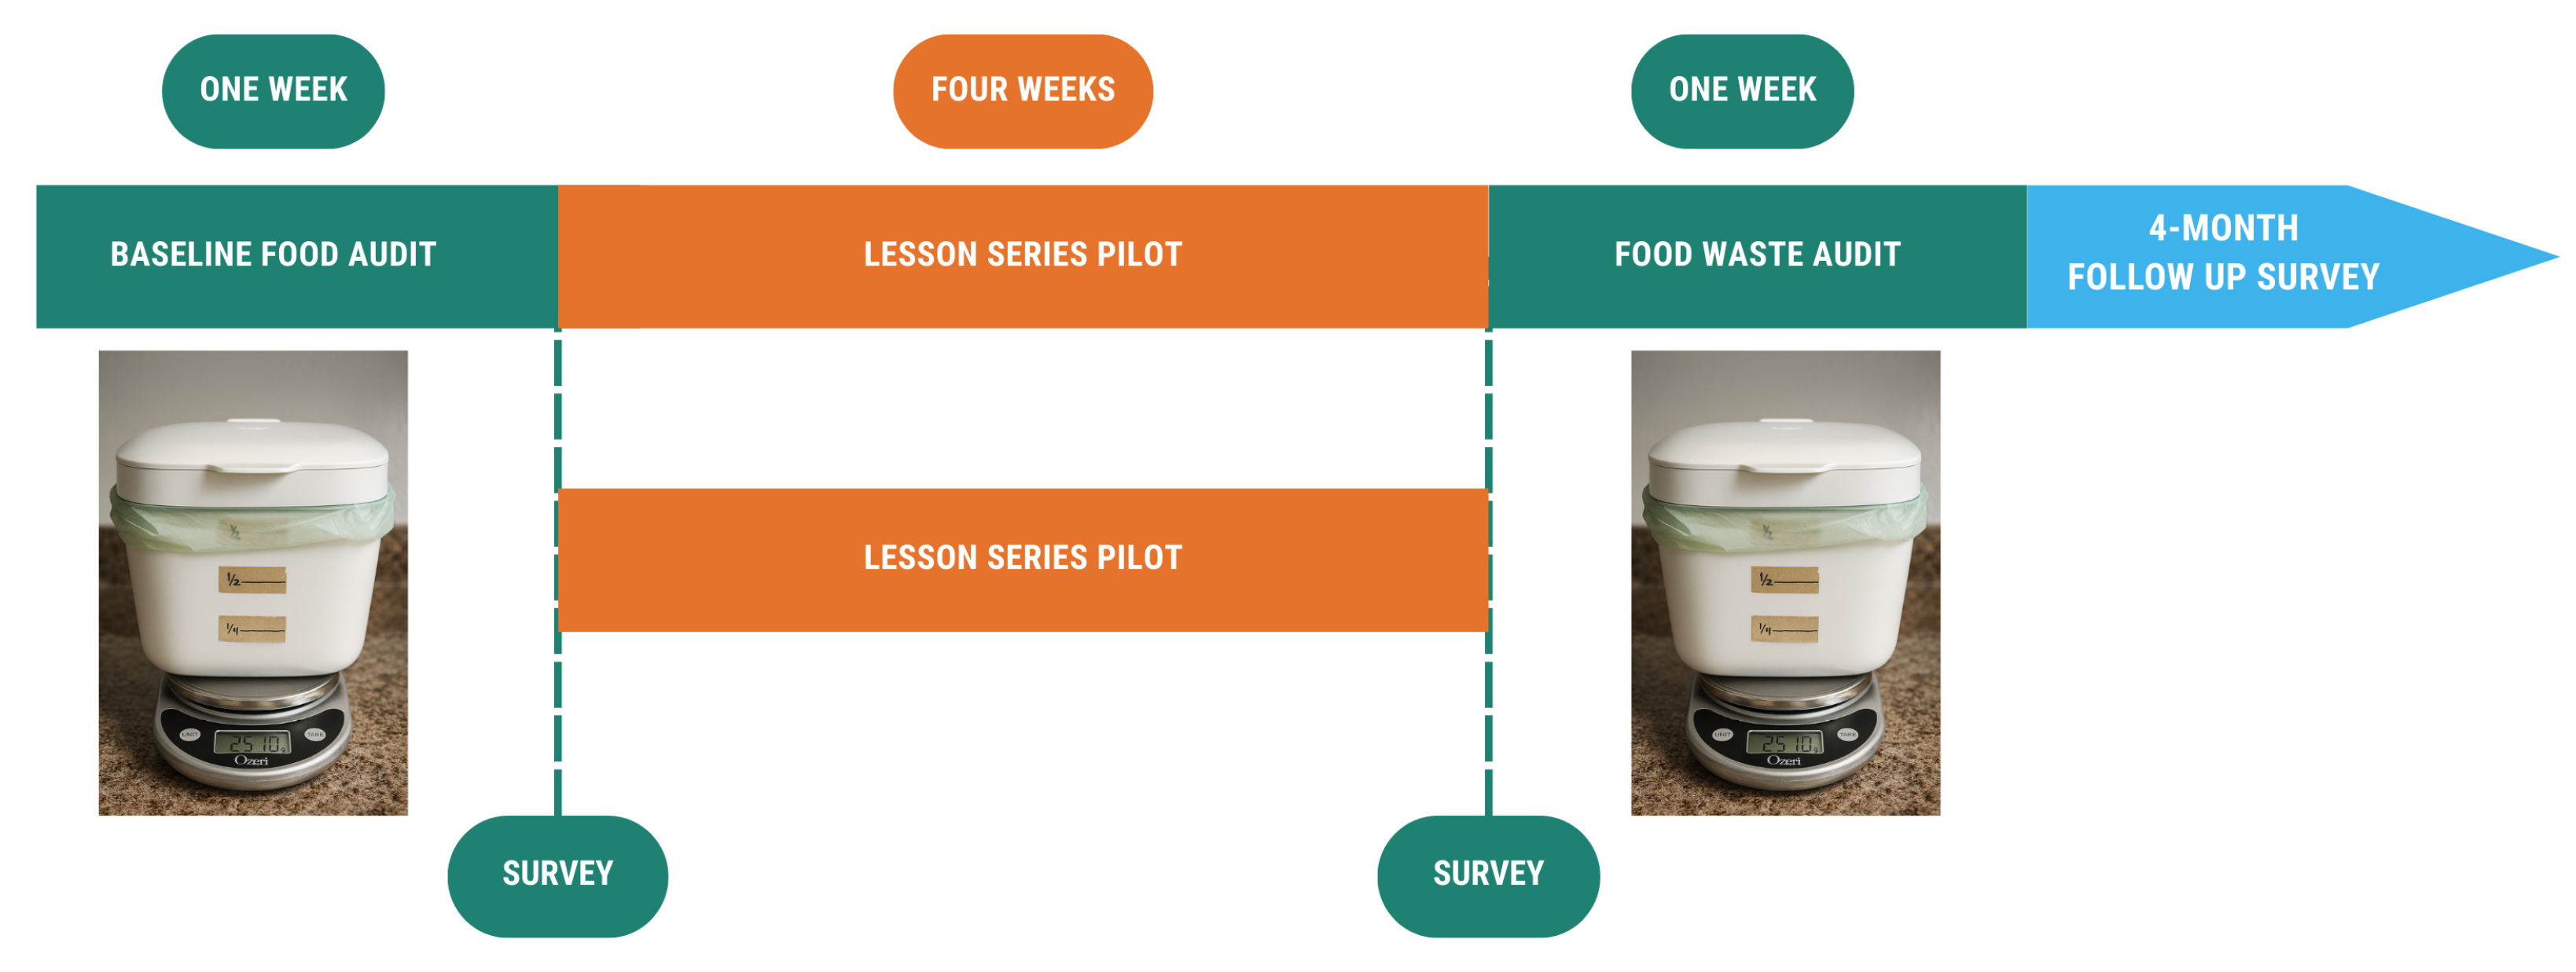
The four lessons in the pilot were conducted weekly on consecutive weeks when possible. The pilot was evaluated primarily from food waste audits and surveys. Pre- and post-pilot food audits were performed with a subset of participants the week before and the week after the lesson series. Pre- and post-pilot surveys were administered during the first and last weeks of the lesson series. A follow-up survey was sent by email four months after the end of the pilot. Figure 2 illustrates the pilot study design with the intended timing of surveys and food waste audits.

2.4. Household Food Waste Audit Data Collection

Food waste audits were performed to determine how the volume and weight of household food waste changed from pre- to post-pilot. A week before the lesson series began, participants at three of the seven sites attended an in-person class to learn how to measure their household food waste. Each participant was given solid and liquid food waste containers, compostable bags to line the solid waste containers, and a printed daily food waste diary with detailed instructions. The diary, adapted from stopfoodwaste.org, accessed on 12 November 2025 [17], is included in the Supplemental Materials.
Participants were instructed to collect their family’s household food waste for five consecutive days, including three weekdays and two weekend days. They were asked to place all their solid and liquid food waste without packaging in separate containers and complete a page in their food waste diary each day. As an optional step, participants were encouraged to take photos of the waste inside their containers with a smartphone.
Questions in the food waste diary included the types of food in the waste containers, the reasons for throwing away these foods, the volume of food in the containers, the weights of the filled containers, and where the containers were emptied (e.g., trash bin, organic waste pickup bin, and/or home compost bin).
Participants measured waste volume using lines marked on the containers. The volume was used mainly as a check on measured weight. The solid waste container was a covered plastic kitchen scrap bin with approximate volume markings on the outside, and the liquid waste container was a plastic kitchen measuring cup. Participants measured weight by placing the filled containers on a digital scale. The container weight was later subtracted during data analysis. When the participants submitted the food waste diaries in class, the instructor checked them for completeness and accuracy.

2.5. Survey Data Collection

The pre/post-pilot survey was used to measure changes in the participants’ food practices, barriers, readiness to change, motivation, and self-efficacy and collect data on demographics and food security, spending, and assistance. The same printed surveys were distributed at the beginning of the first class and the end of the last class and took about 15 to 20 min for participants to complete. The instructor briefly reviewed the instructions and questions before the survey and reviewed the responses for completeness when the surveys were collected. Surveys used in this study are included in the Supplemental Materials.
Most survey questions were adapted from previously published studies [18,19]. Food security was assessed with two standard questions used by the USDA [20]. In addition, participants were asked how much money their household spent on food and beverages each month and what type of food assistance they received.
The last section of the pre/post-pilot survey collected demographic data on race, ethnicity, ages of people living in the household, highest grade in education completed, preferred language for receiving educational materials, and county of residence.
The four-month follow-up survey consisted of three questions designed to identify which food practices, tools, and skills participants maintained after the lesson series. A Qualtrics (Qualtrics, Provo, UT, USA) survey was emailed to site coordinators and participants with known email addresses who completed the pilot.

2.6. Data Analysis

Both pre- and post-pilot daily food waste diaries were completed by 17 participants at three sites. Data from the printed diaries were entered into a Qualtrics survey by one of the researchers (DS) and downloaded to Microsoft Excel for Mac (Version 16.89.1; Microsoft Corporation, Redmond, WA, USA) for analysis. The solid and liquid food waste volumes and weights were summed for all participants for all days of the pre- and post-pilot waste audits. Subtracting pre from post aggregated values indicated the total change in household food waste. T-tests were performed on individual paired data using the Excel Analysis ToolPak to determine if changes were significant (p < 0.05). Counts for the multiple-choice questions—types of food in waste containers, reasons for throwing out food, and where containers were emptied—were summed in the same way as food waste volumes and weights.
Both pre- and post-pilot surveys were received from 40 participants across seven counties. Similar to the food waste diaries, the researchers (DS, YM) entered the data from printed surveys into Qualtrics and downloaded it to Excel for analysis. Questions about amount and frequency were analyzed similarly. The amount of food thrown out was coded in Qualtrics from 1 to 4 (none to a lot). (The response “We don’t eat this food” was coded the same as none.) The frequency of activities was coded from 1 to 5 (never to always). Pre- and post-pilot amounts and frequencies were summed for all participants and compared, and paired samples t-tests on individual data were used to assess if changes were statistically significant. An a priori power analysis for a paired-samples t-test (α = 0.05) indicated that a sample size of 40 participants provides approximately 88% power to detect a medium effect size (Cohen’s d = 0.50) in pre–post survey outcomes.
Other multiple-choice questions were analyzed by comparing the count and percentage of participants for each choice before and after the pilot; this included the question about barriers, where participants were asked to select agree, disagree, or not sure for each statement. Although the motivation question was a ranking, it was analyzed by the count of participants ranking each choice as one of their top three.
The self-efficacy question in the pre/post-pilot survey asked participants to what extent they felt confident in their ability to perform food practices taught during the pilot. Responses were coded from 1 to 3 (not confident to confident). (“Does not apply to me” was not counted.) The data were analyzed using the method to compute individual change reported by Koundinya [21] along with a paired t-test. The key metric was the percentage of participants whose confidence increased after the pilot.
The participant demographics and food security, spending, and assistance were analyzed using descriptive statistics and reported in terms of frequency and percentage for categorical variables and mean, minimum, and maximum for continuous variables.
Anonymous responses to the four-month follow-up survey were received from 14 participants. Frequency questions about food-related activities and the use of incentive items were analyzed using the same approach as the pre/post survey. Text responses to the open-ended question about most useful or practical skills learned were examined to identify themes.

3. Results

3.1. Participant Demographics

Demographic data were analyzed for the 50 participants who enrolled in the lesson series pilot by taking the pre-pilot survey. The participants’ ages ranged from 21 to 64 years, with a mean of 36.1. Most participants identified as other (32%), White (22%), or Black or African American (16%), and over half identified as Hispanic (58%). Sixty-eight percent had a household size of four or more. More than half the participants had attended some college (66%). The majority (72%) preferred English for receiving educational materials. The participant demographics are summarized in Table 2.
Based on the pre-pilot survey responses, we met our goal of reaching low-income households, with 68% of the enrolled participants received some type of food assistance aside from school meals, such as CalFresh (California’s Supplemental Nutrition Assistance Program) (44%), and Women, Infants, and Children (WIC) (32%), and 48% experienced some level of household food insecurity. Monthly food spending ranged from $400 to $1500, with a mean of $801. Food spending included the value of benefits received through food assistance programs, as well as cash spent on groceries and restaurant food.

3.2. Food Practices

3.2.1. Household Food Waste Audit

Household food waste data were analyzed for the 17 participants who participated in the audit. Table 3 indicates that the volume and weight of solid and liquid household food waste decreased from pre- to post-pilot; however, the changes were not significant according to paired t-tests.
Two main issues with participant data collection made the food waste audit data difficult to analyze: missing data and incorrect measurement. Some participants were unable to complete their food waste diaries on certain days for a variety of reasons, such as personal circumstances, eating out, traveling, or forgetting about the audit.
Measurement issues included incorrectly measuring liquid volume using the digital scale rather than the measuring cup, not including the solid waste container in the weight measurement (although this did not affect the pre/post change), and disposing of food packaging in the solid waste container. Before analysis, some data were able to be corrected based on discussions with the participants, food waste photos, and comparison between waste volume and weight.
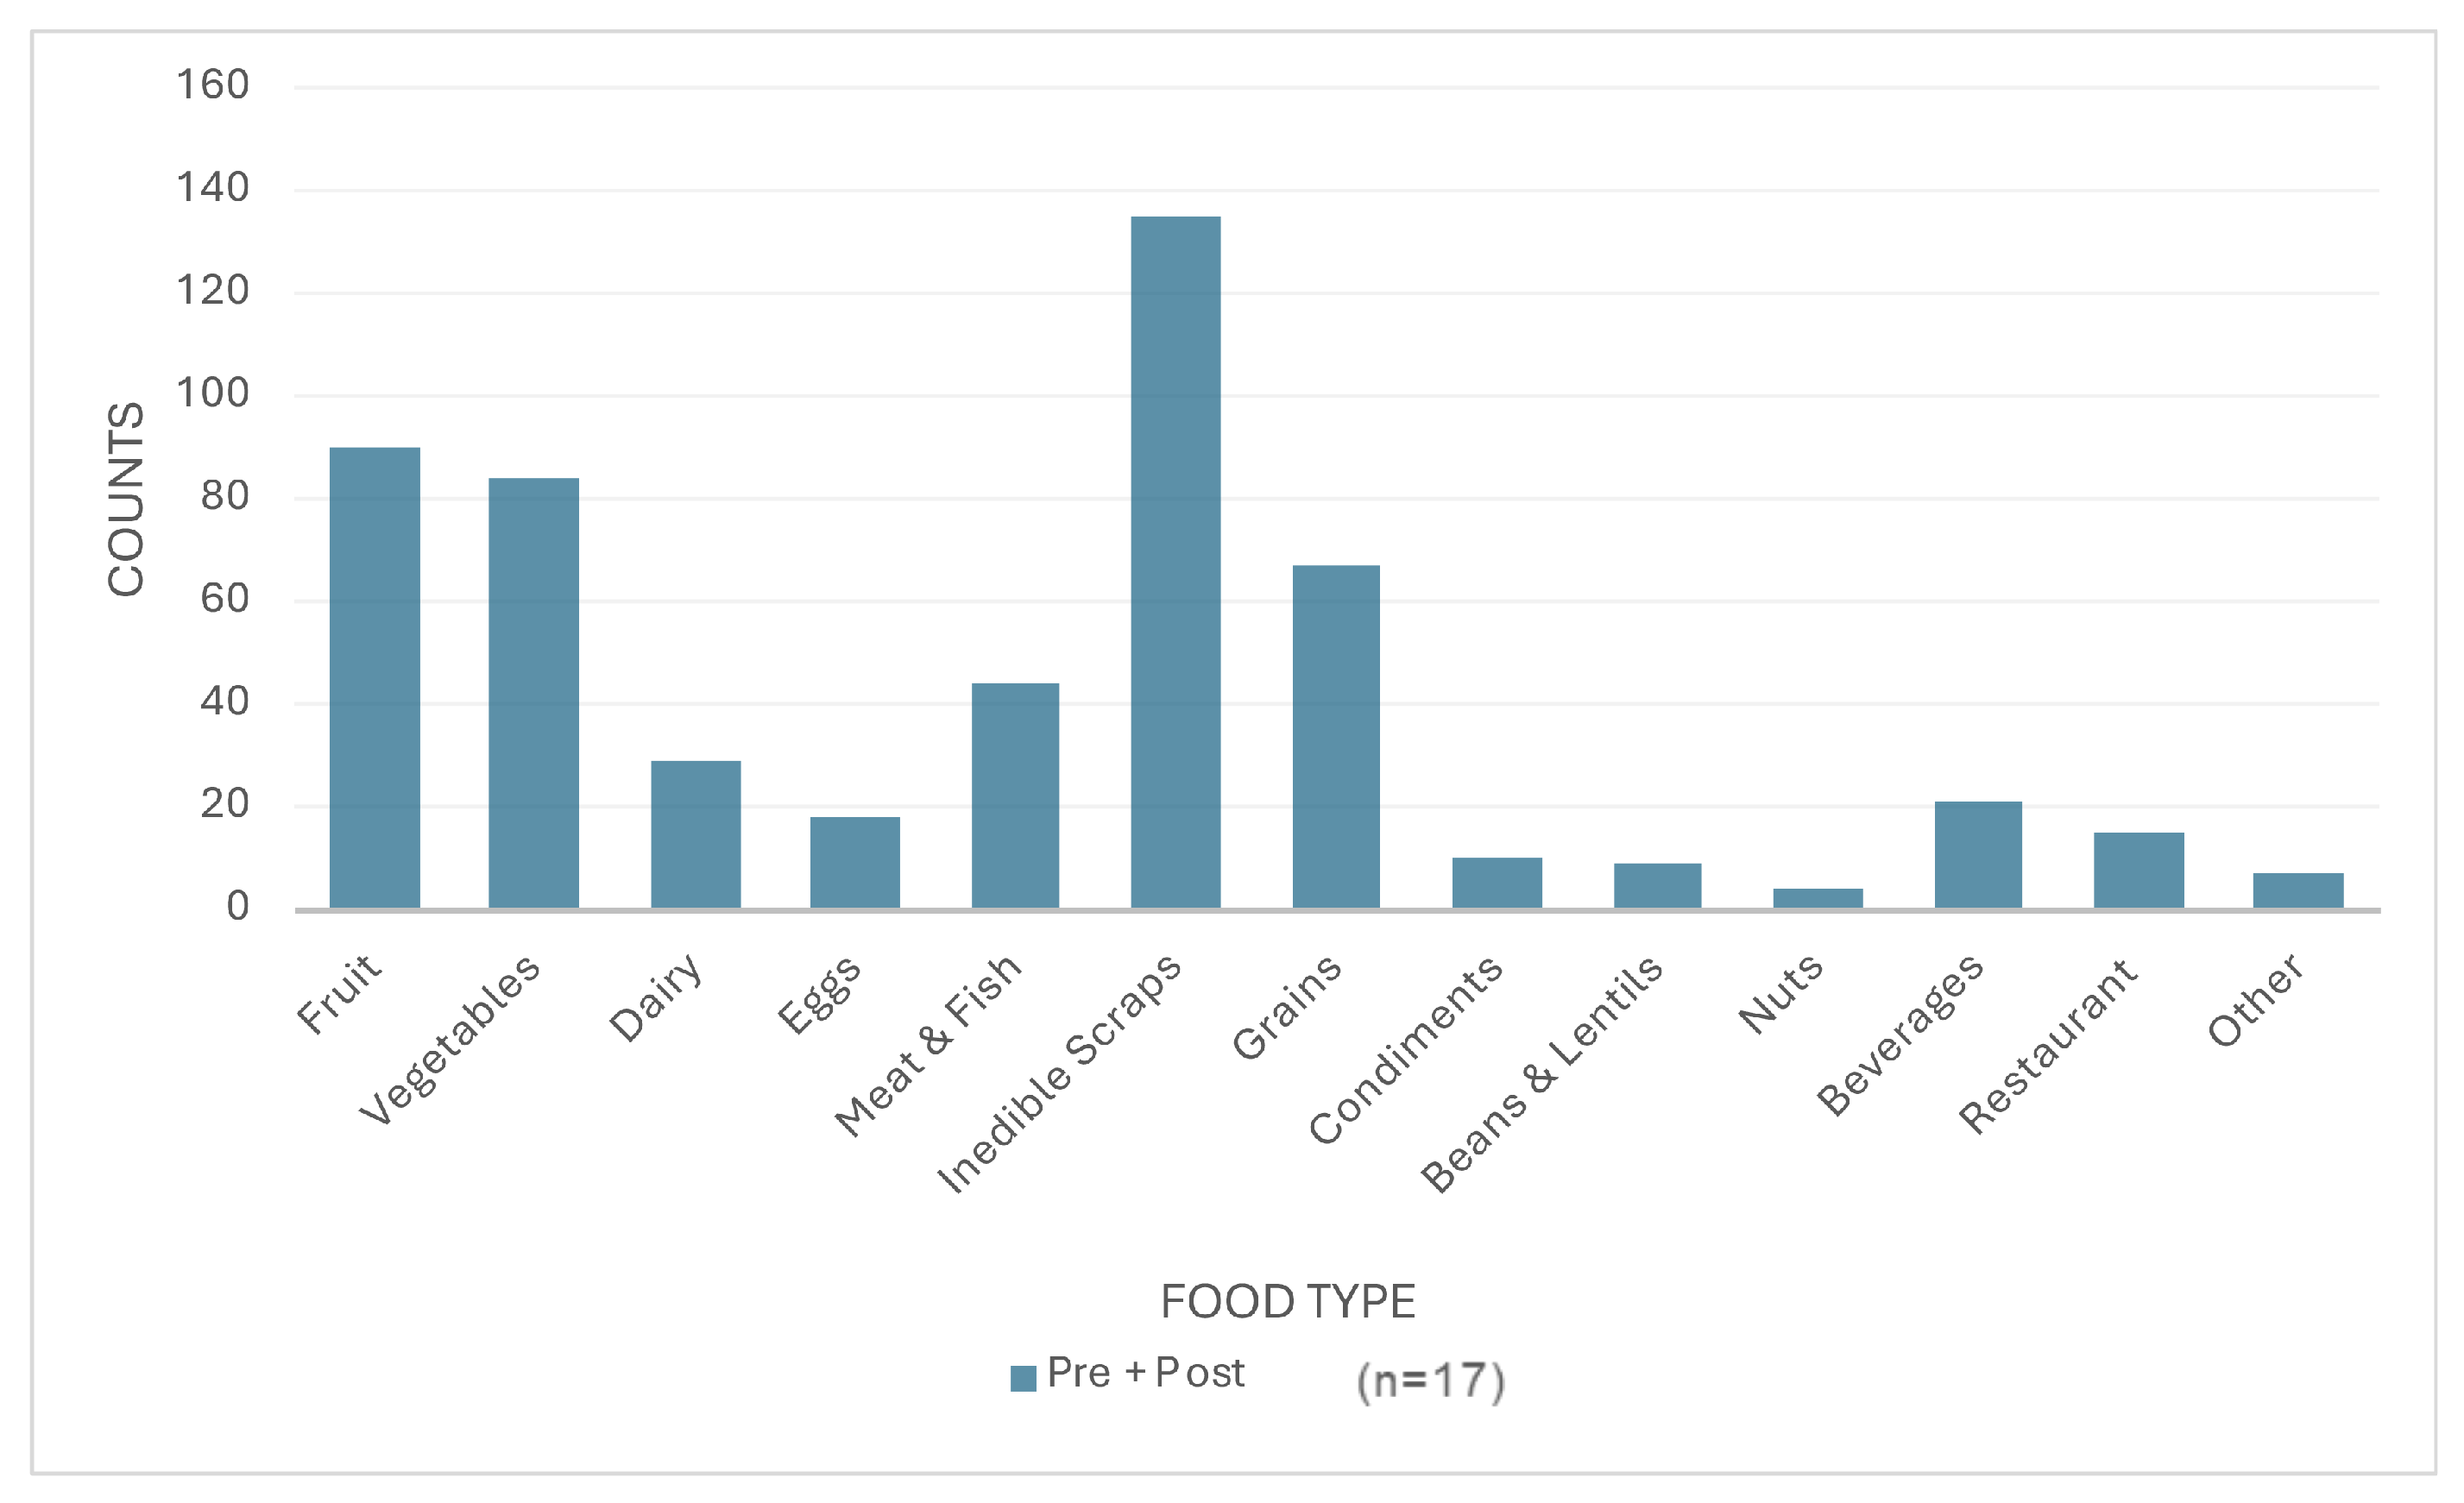
The daily food waste diaries provided insight into the types of food thrown away, the reasons for throwing food away, and where it was disposed. The counts of different foods thrown away are presented in Figure 3. The pre- and post-pilot counts were added together to see trends more clearly with a limited number of food waste audit participants. The top four food types were inedible scraps, fruits, vegetables, and grains such as bread, rice, pasta, and cereal, and these agreed with the pre/post-survey, where participants were asked to recall what food items were thrown away during the past week.
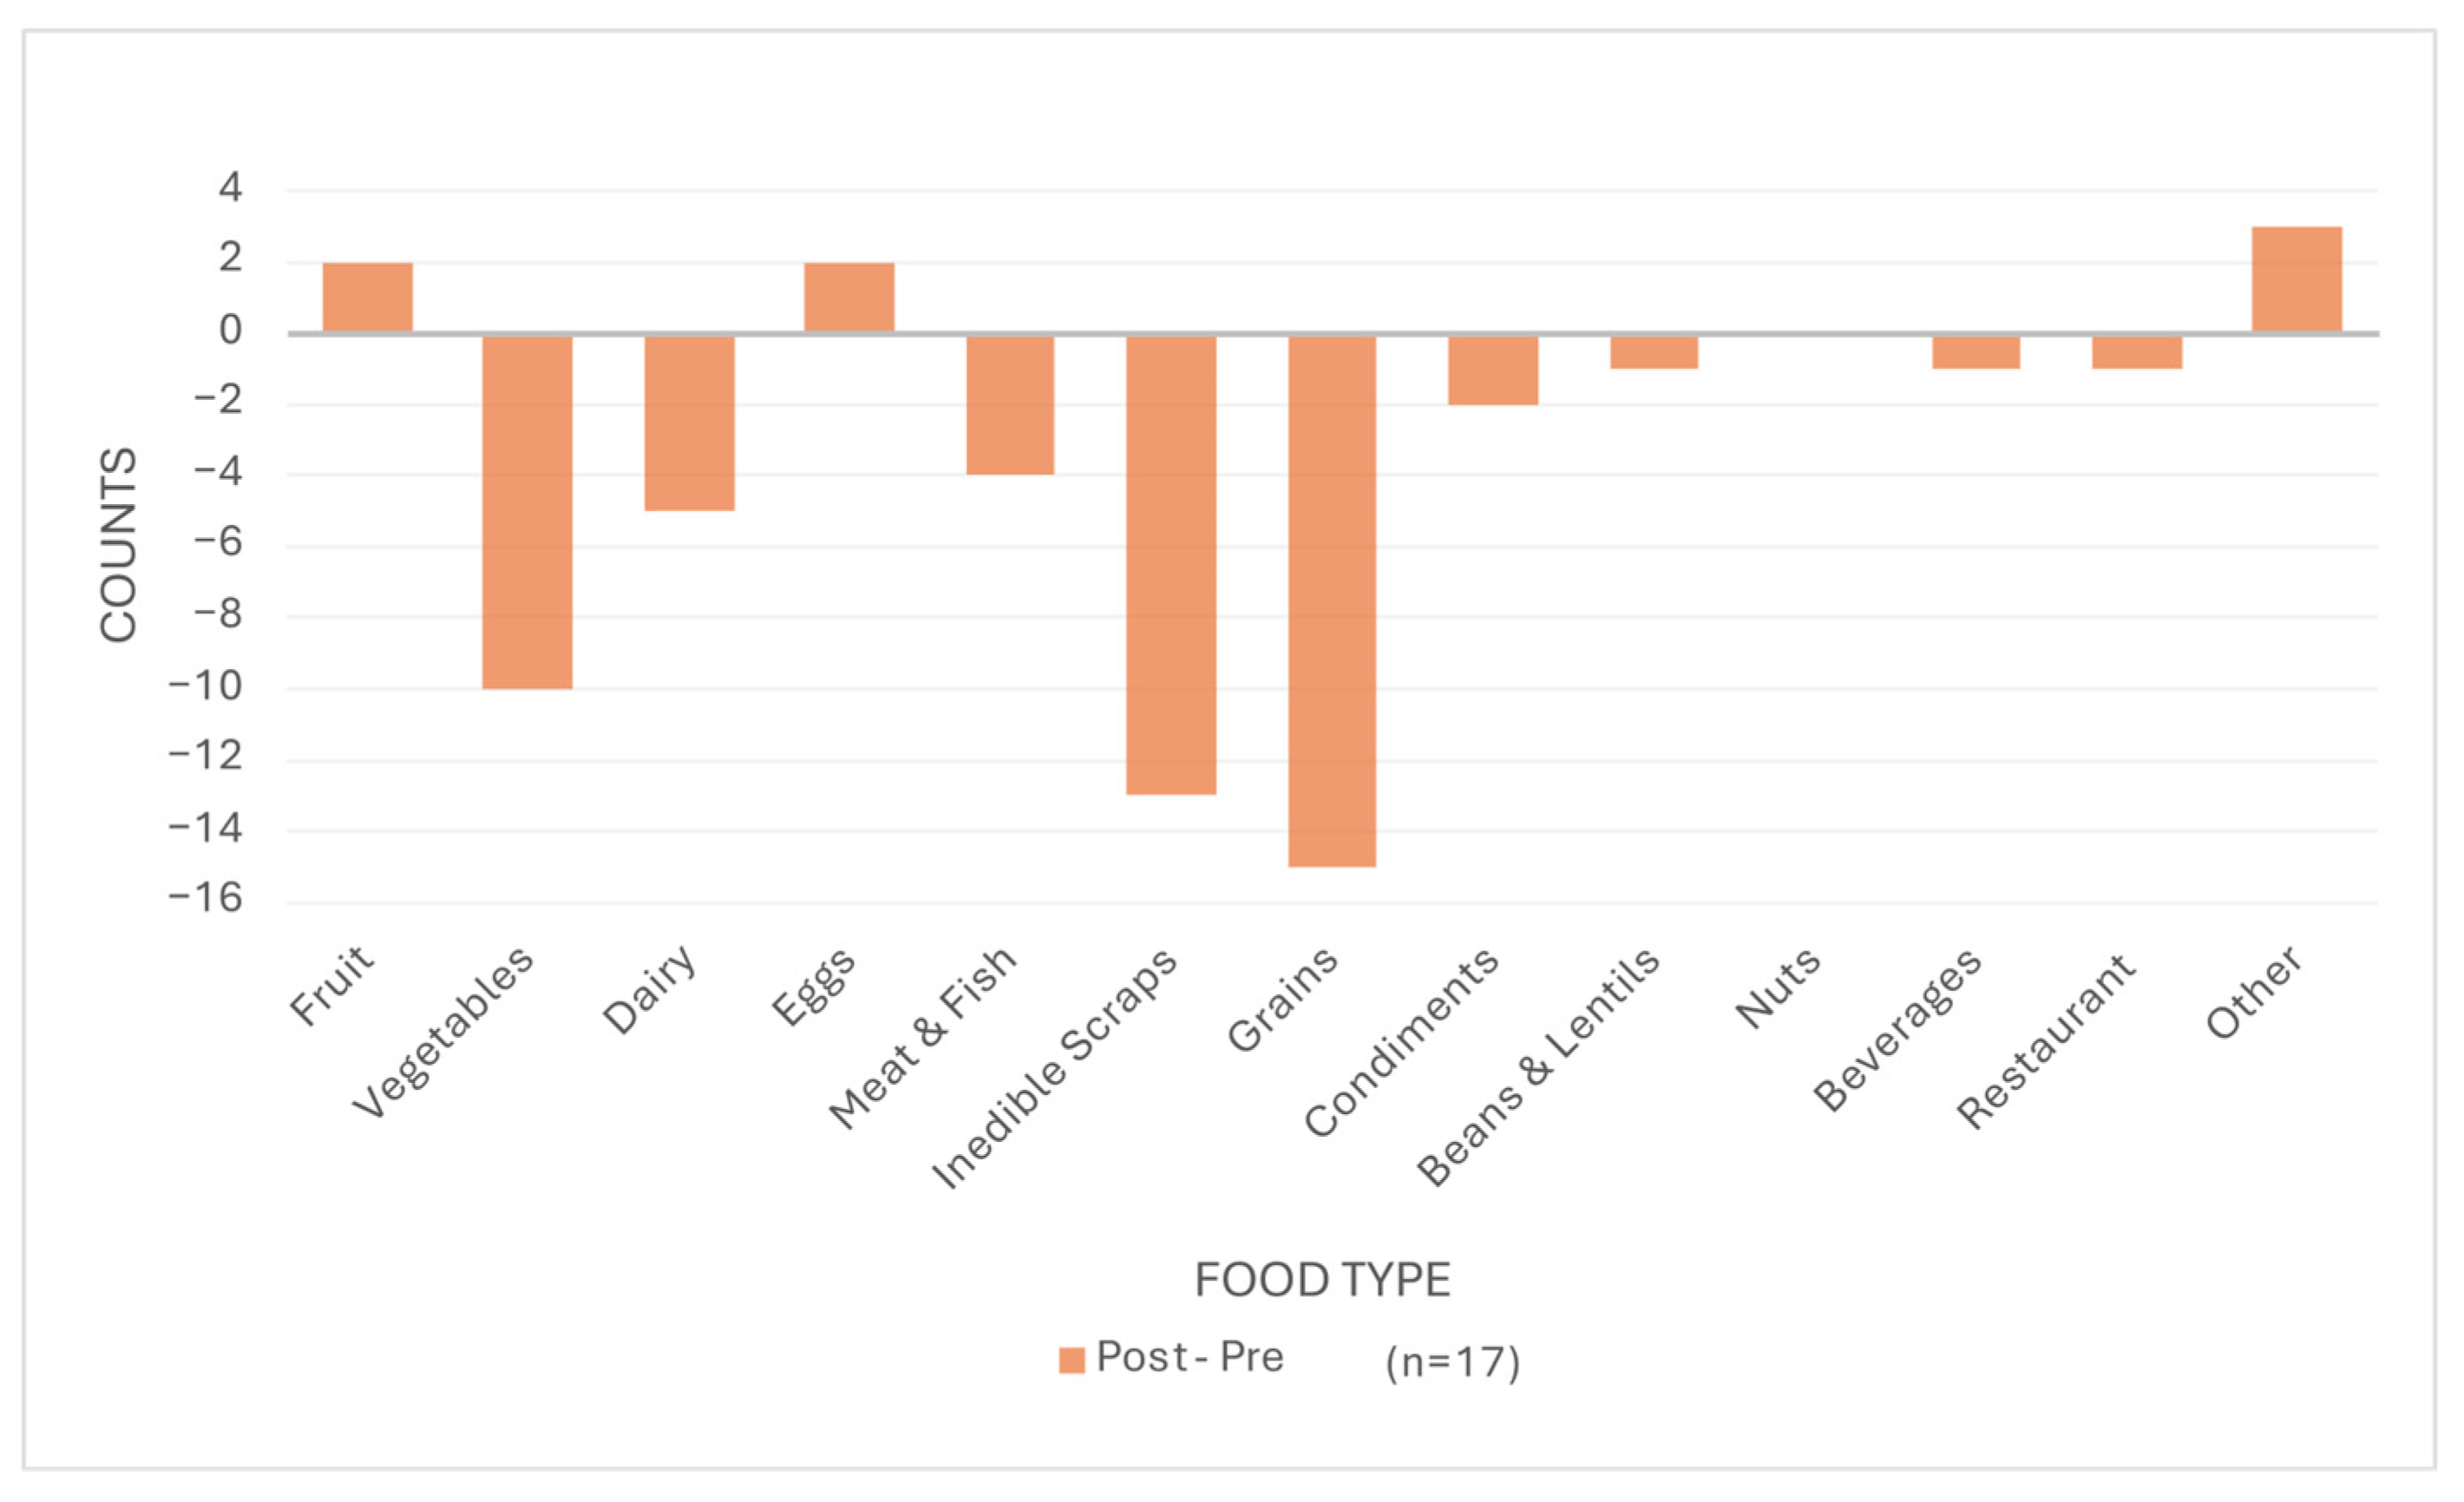
The count changes for different food types are illustrated in Figure 4. The biggest decreases after the pilot were for grains, inedible scraps, and vegetables.

3.2.2. Pre/Post-Pilot Survey

The following results are based on data from the 40 participants who completed both the pre- and post-pilot surveys. Figure 5 compares the reasons for throwing out food pre- and post-pilot. Participants were asked to choose all the reasons that applied to them and their household members. The top reason pre- and post-pilot was that food spoiled when stored. Other commonly cited reasons were past date on package (use by, sell by, best by) and stored too long (based on personal desire for freshness). The biggest change occurred in the percentage of participants throwing out food because of the package date, which decreased from 53% pre to 30% post.
The majority of participants threw out most of their food in the home trash bin (91% pre, 82% post). The number of participants using the green bin (organic waste pick-up) and garbage disposal increased slightly post-pilot, while the number using the compost bin decreased.
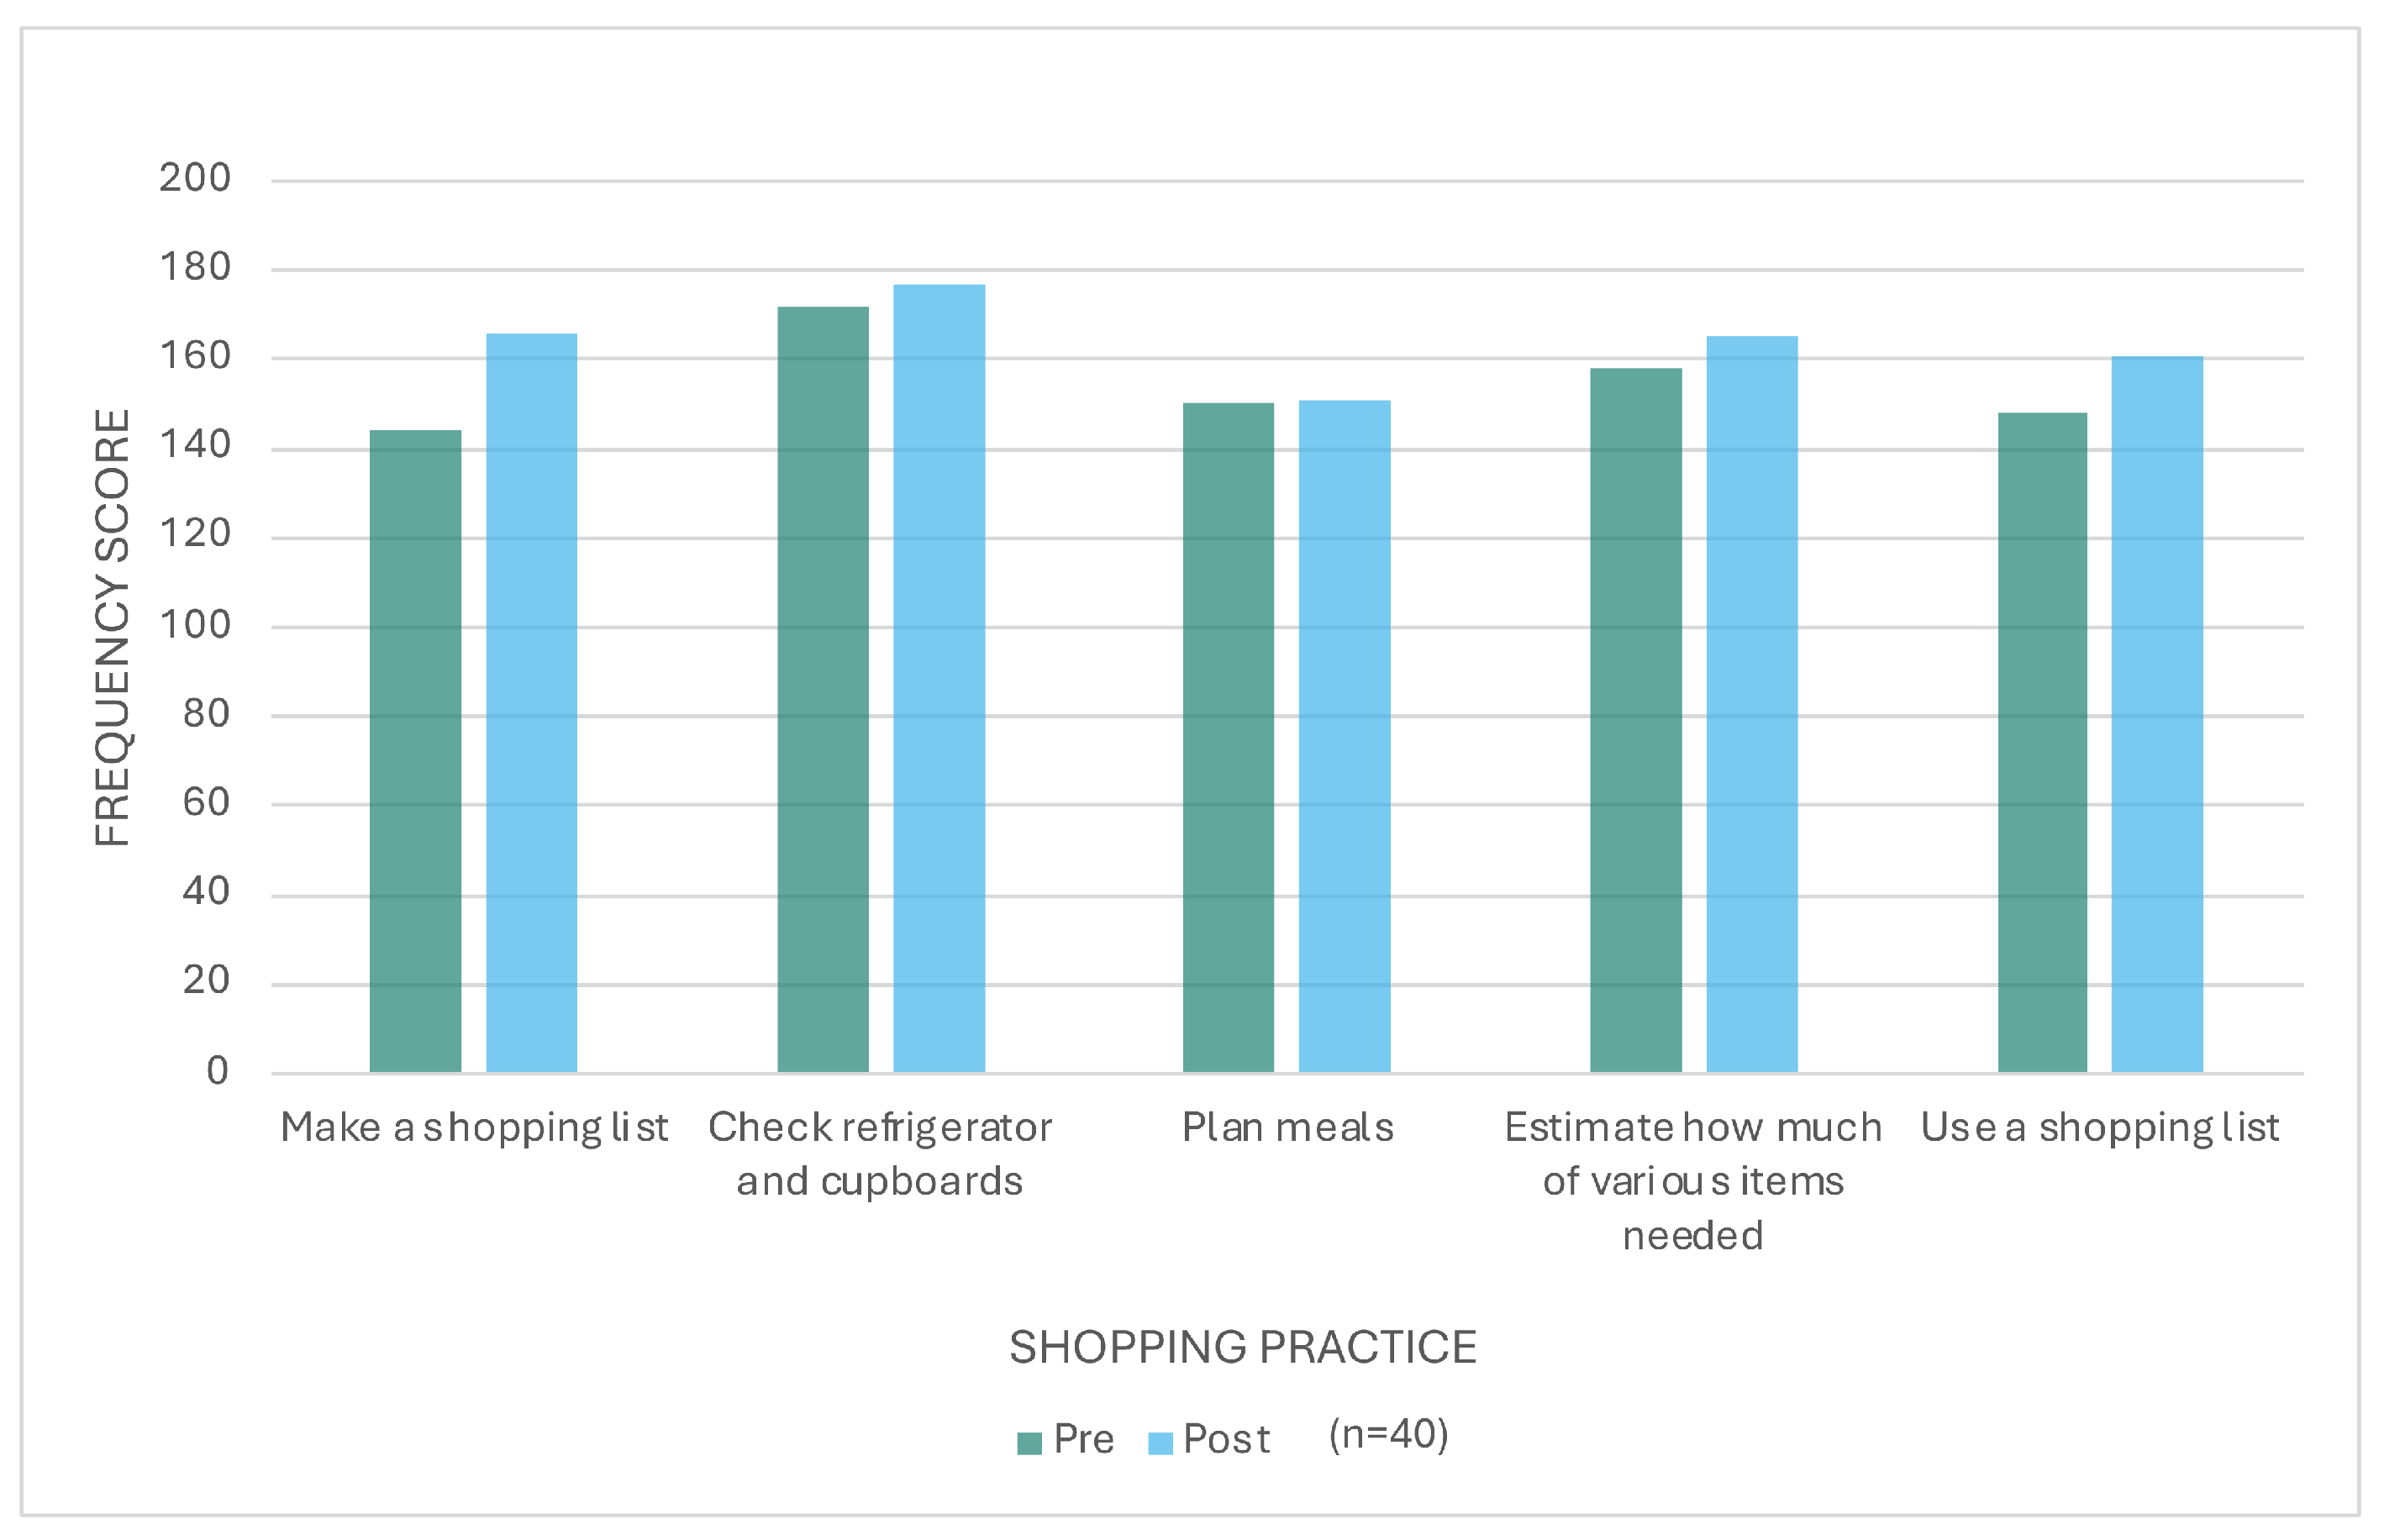
The frequency of shopping-related practices is shown in Figure 6. The frequency score increased for all practices post-pilot. The frequency score pre- and post-pilot was highest for checking the refrigerator and cupboards before shopping. Paired t-tests indicated significant mean increases for making a shopping list (p < 0.001) and using a shopping list (p = 0.011). (Making a shopping list meant preparing the list ahead of time, and using a shopping list meant actually following it in the store.) The practice that changed the least from pre- to post-pilot was planning meals.
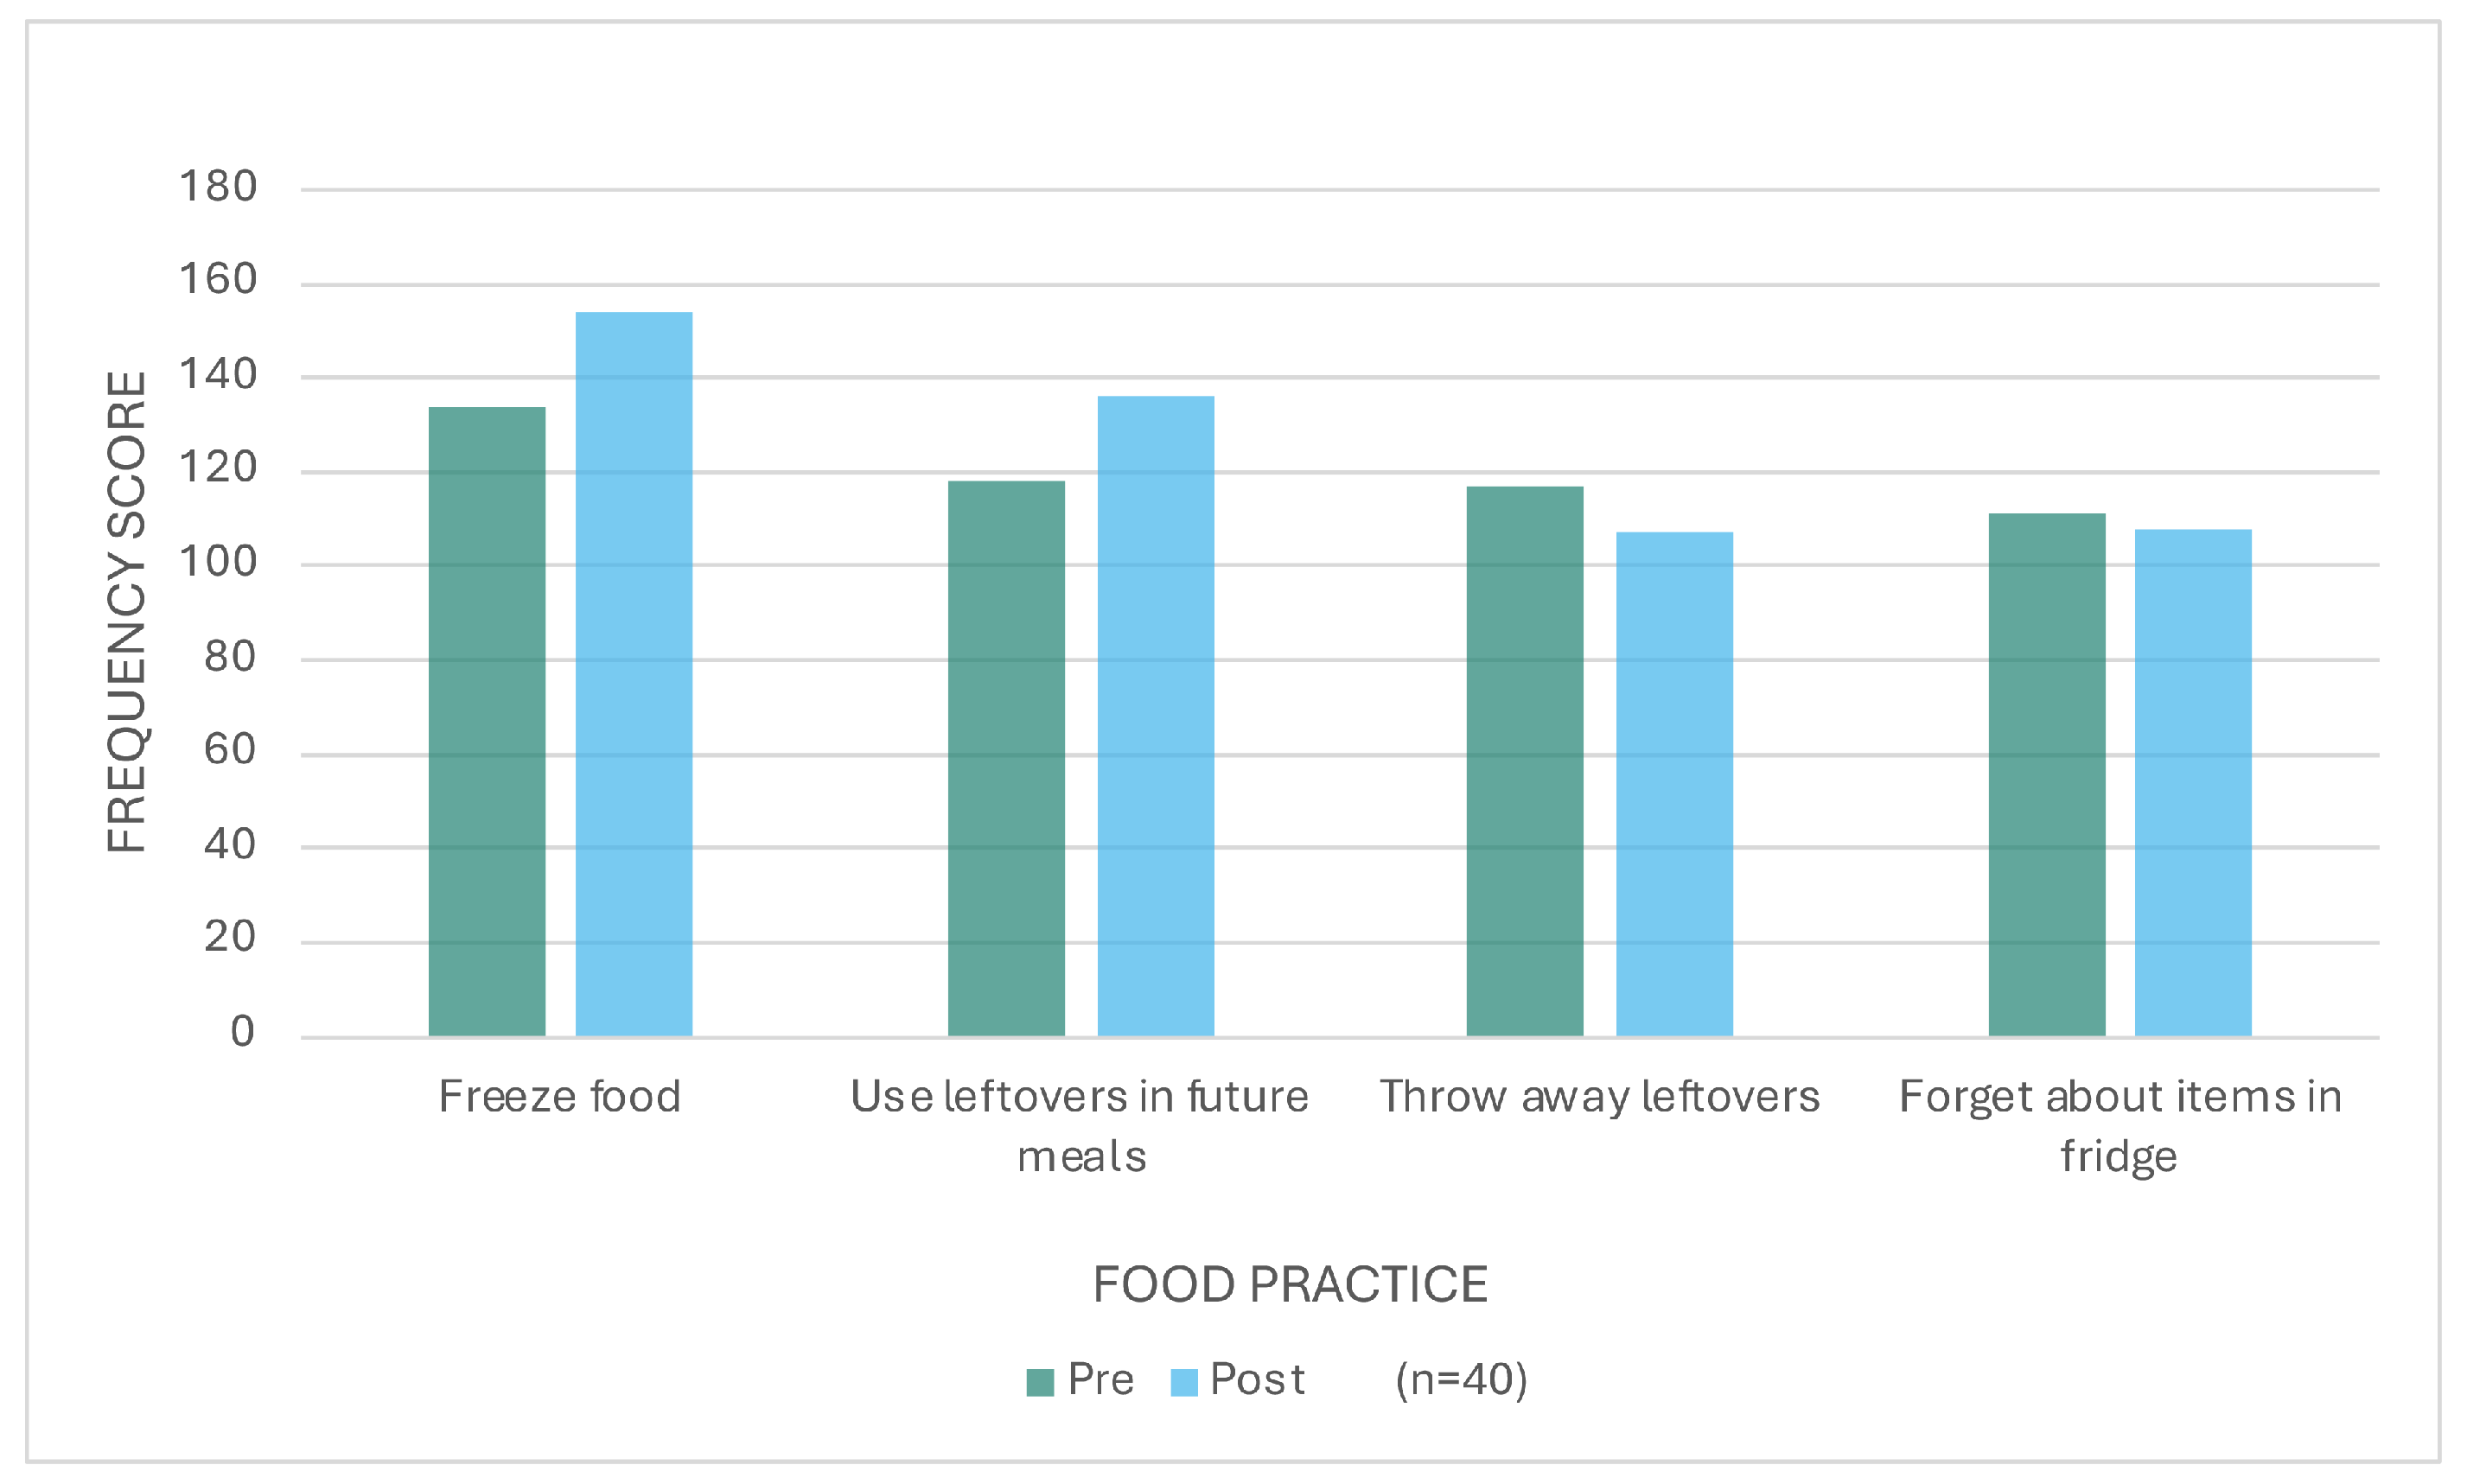
Figure 7 depicts the frequency of food practices other than shopping. The frequency score increased pre- to post-pilot for freezing food if not able to eat it in time and using leftovers and food scraps in future meals, while the frequency score decreased for throwing away leftovers because no one wanted to eat them and forgetting about items in the fridge until they were too old to eat. The mean frequency increase was significant for freezing food (0.50, p = 0.016) and using leftovers (0.45, p = 0.012).
Participants who completed both food waste audits showed a larger mean frequency increase in freezing food compared to those who did not (0.94 vs. 0.17). These participants also showed a larger decrease in throwing away leftovers (−0.41 vs. −0.13) and forgetting about items in the fridge (−0.24 vs. 0.04).
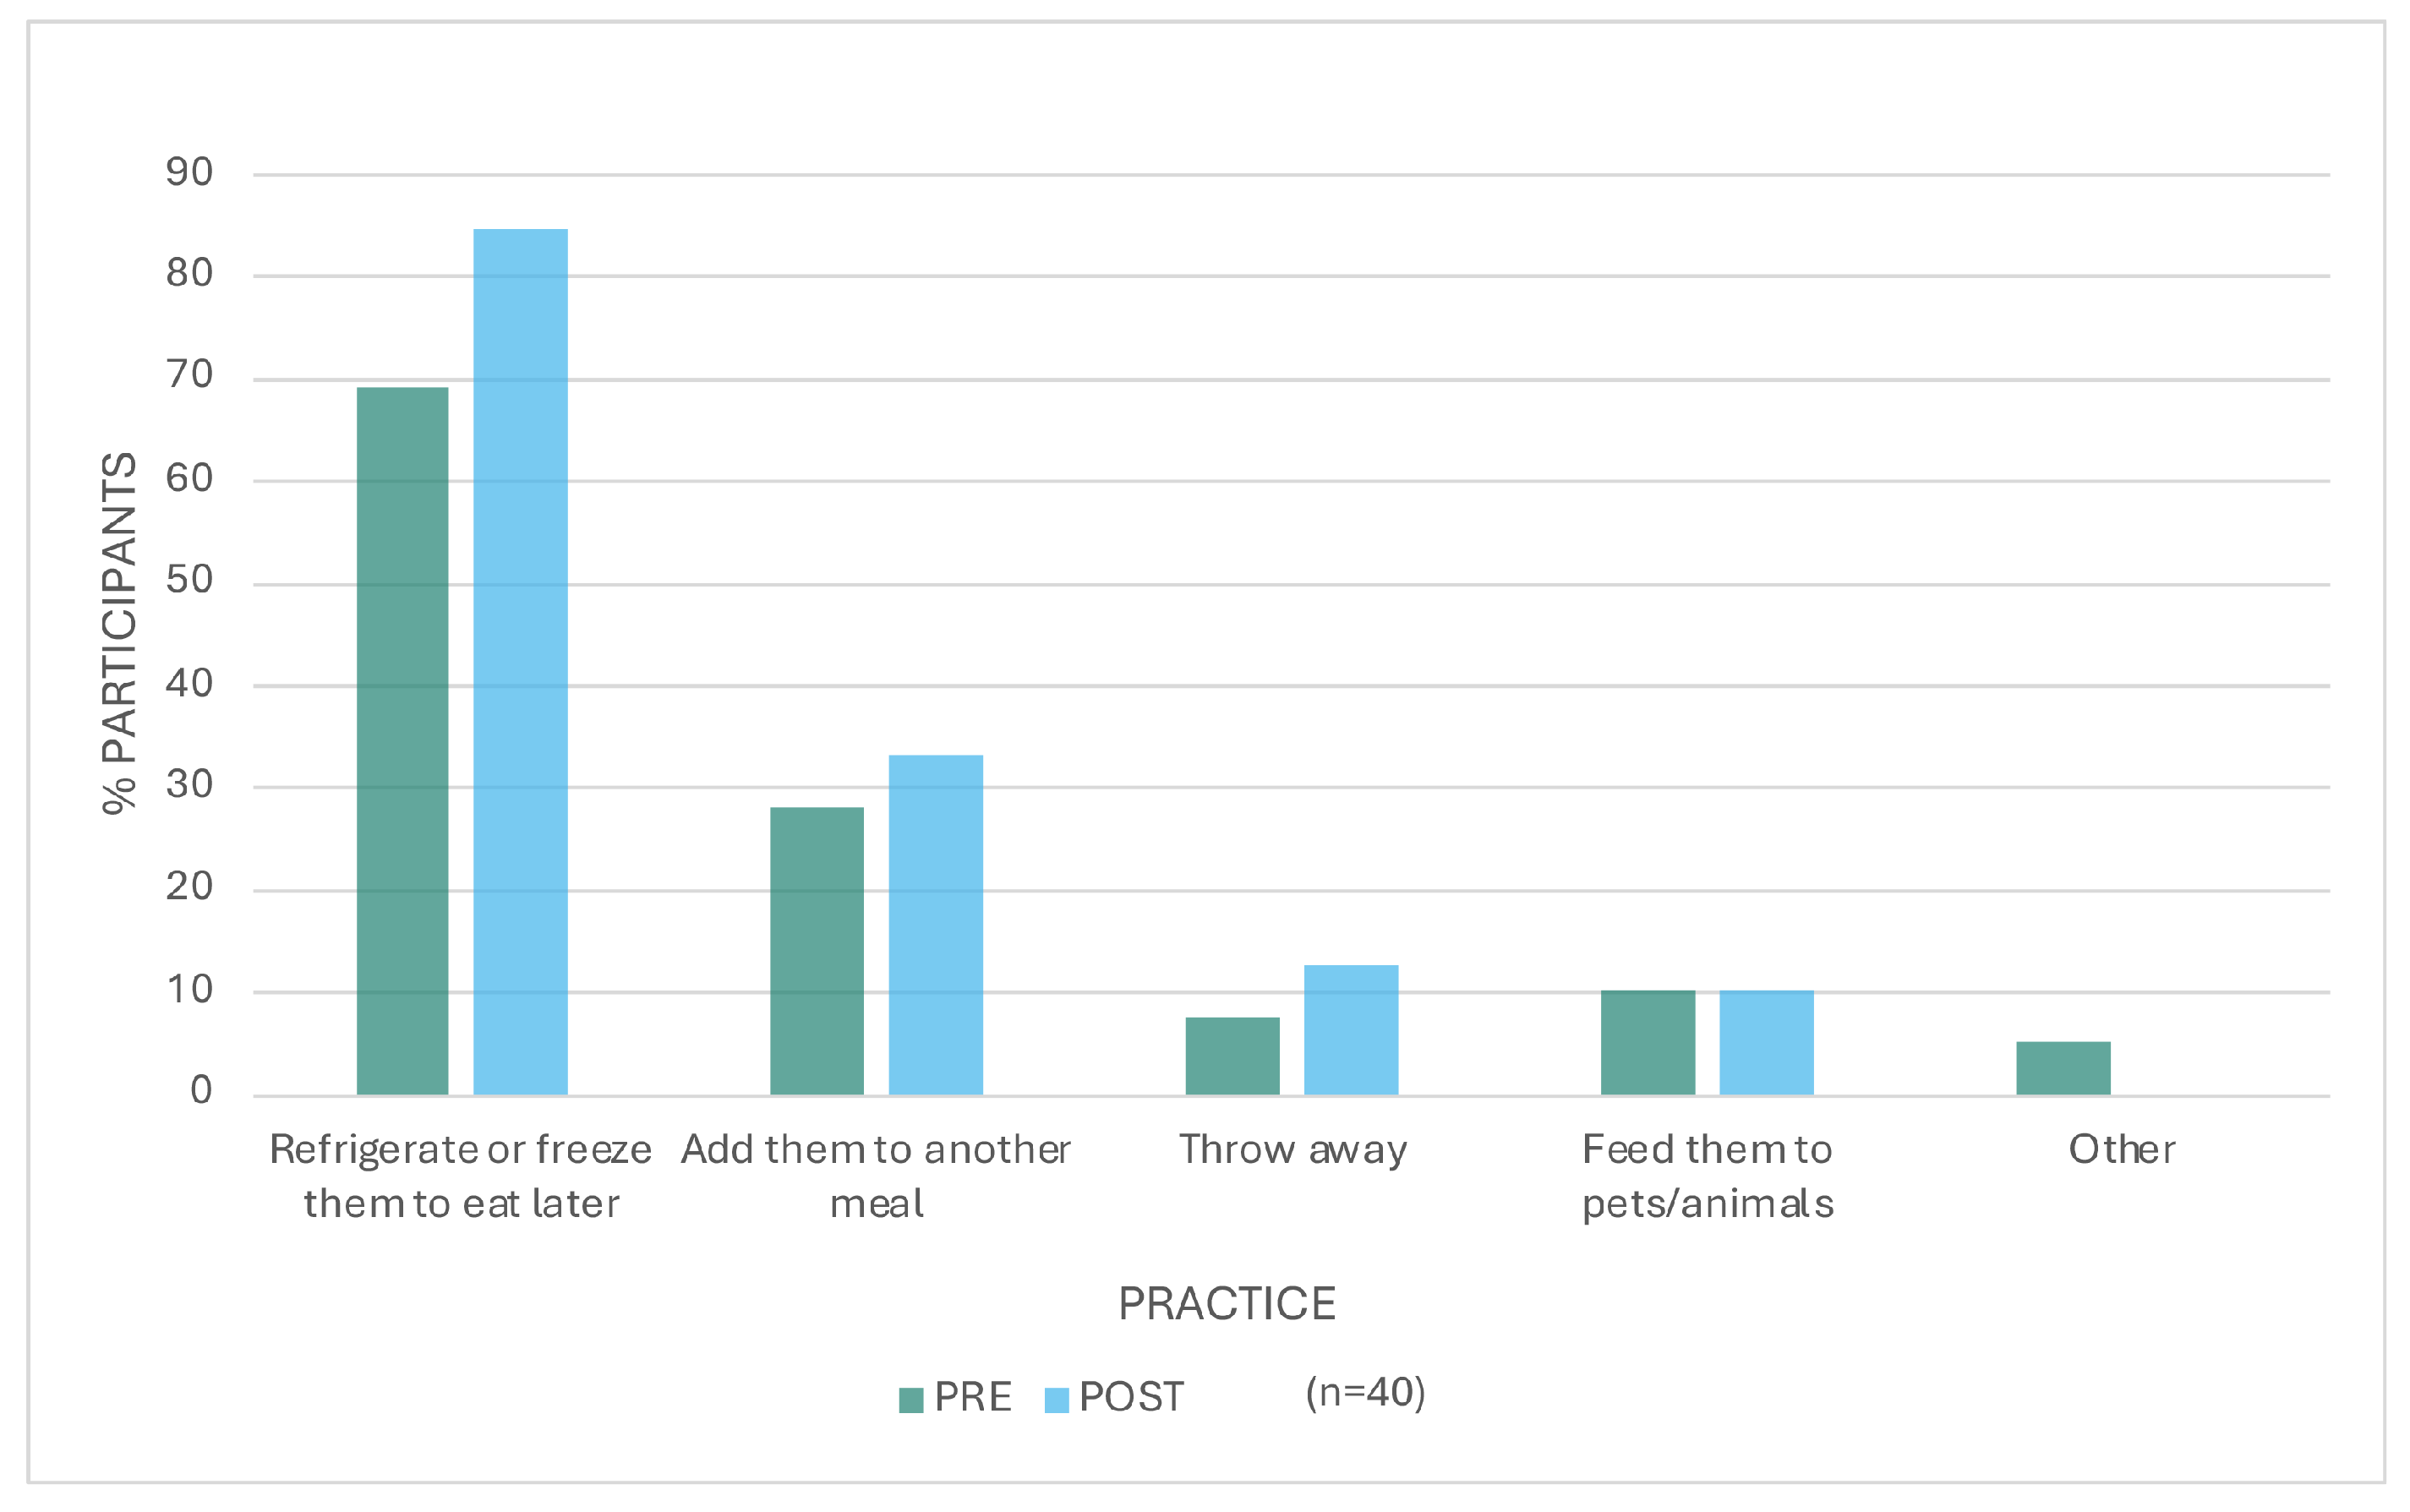
When eating out, 35% of participants decreased their frequency of bringing home restaurant leftovers after attending the pilot, and the mean change was significant (p = 0.031). When leftovers were brought home, the majority of participants refrigerated or froze them to eat later (69% pre, 85% post), as shown in Figure 8. The second most common practice was adding restaurant leftovers to another meal (28% pre, 33% post). Ten percent of participants (pre and post) fed their restaurant leftovers to pets or other animals, and a similar percentage threw them away (8% pre, 13% post).

3.2.3. Four-Month Follow-Up Survey

The four-month follow-up survey results revealed that 100% of respondents (n = 14) frequently (always or most of the time) checked their refrigerator and cupboards before shopping, made a shopping list, and stored and reheated food safely, and 93% frequently used a shopping list, used tips to make shopping with kids easier, and used leftovers in future meals. Sorting household food waste for collection or drop-off was the least frequently performed activity (71% always or most of the time). The class incentive items most often used at home were the refrigerator/freezer thermometer, reusable freezer bags, and the shopping list magnetic note pad.
The survey included an open-ended question about the most useful or practical skills learned from the program. Participants’ comments centered on practices related to shopping, food storage and preservation, and reusing leftovers. The following are some quotes from participants indicating their behavior changes:
“To stop overspending! I had a lot of leftover waste simply because it spoiled before my family could eat it.”
“To always make a shopping list. And freeze the food that I’m not going to use just to keep it fresh.”
“Not washing my veggies until right before use, repurposing meals, freezing things.”

3.3. Barriers

Barriers, readiness to change, motivation, and self-efficacy were evaluated using the pre/post-pilot survey data. To assess barriers to reducing household food waste, the participants were presented with nine statements describing different barriers and asked to select agree, disagree, or not sure for each one. Prior to the lesson series pilot, the four biggest barriers, according to the percentage of participants who agreed, were:
  • I toss food if I am not sure it is safe to eat (73%).
  • I don’t have enough information from my waste disposal company about collecting my household food waste (63%).
  • I don’t have enough information on the benefits of reducing household food waste (50%).
  • I don’t have enough food preservation skills (48%).
Agreement with all nine barrier statements decreased after the pilot, as shown in Table 4. The barriers with the biggest decreases were: not enough information from my waste disposal company (38%), not enough information on the benefits of reducing waste (35%), not enough food preservation skills (35%), and not finding time to prepare food before it spoils (20%). These results indicate that three of the top initial barriers were overcome.

3.4. Readiness to Change and Motivation

All participants indicated they were either interested or somewhat interested in taking action to reduce the amount of food their household threw out (90% interested pre, 95% interested post).
The top three motivators for participants to reduce their household food waste were saving money, wanting to set an example for their children, and wanting to manage their home efficiently.

3.5. Self-Efficacy

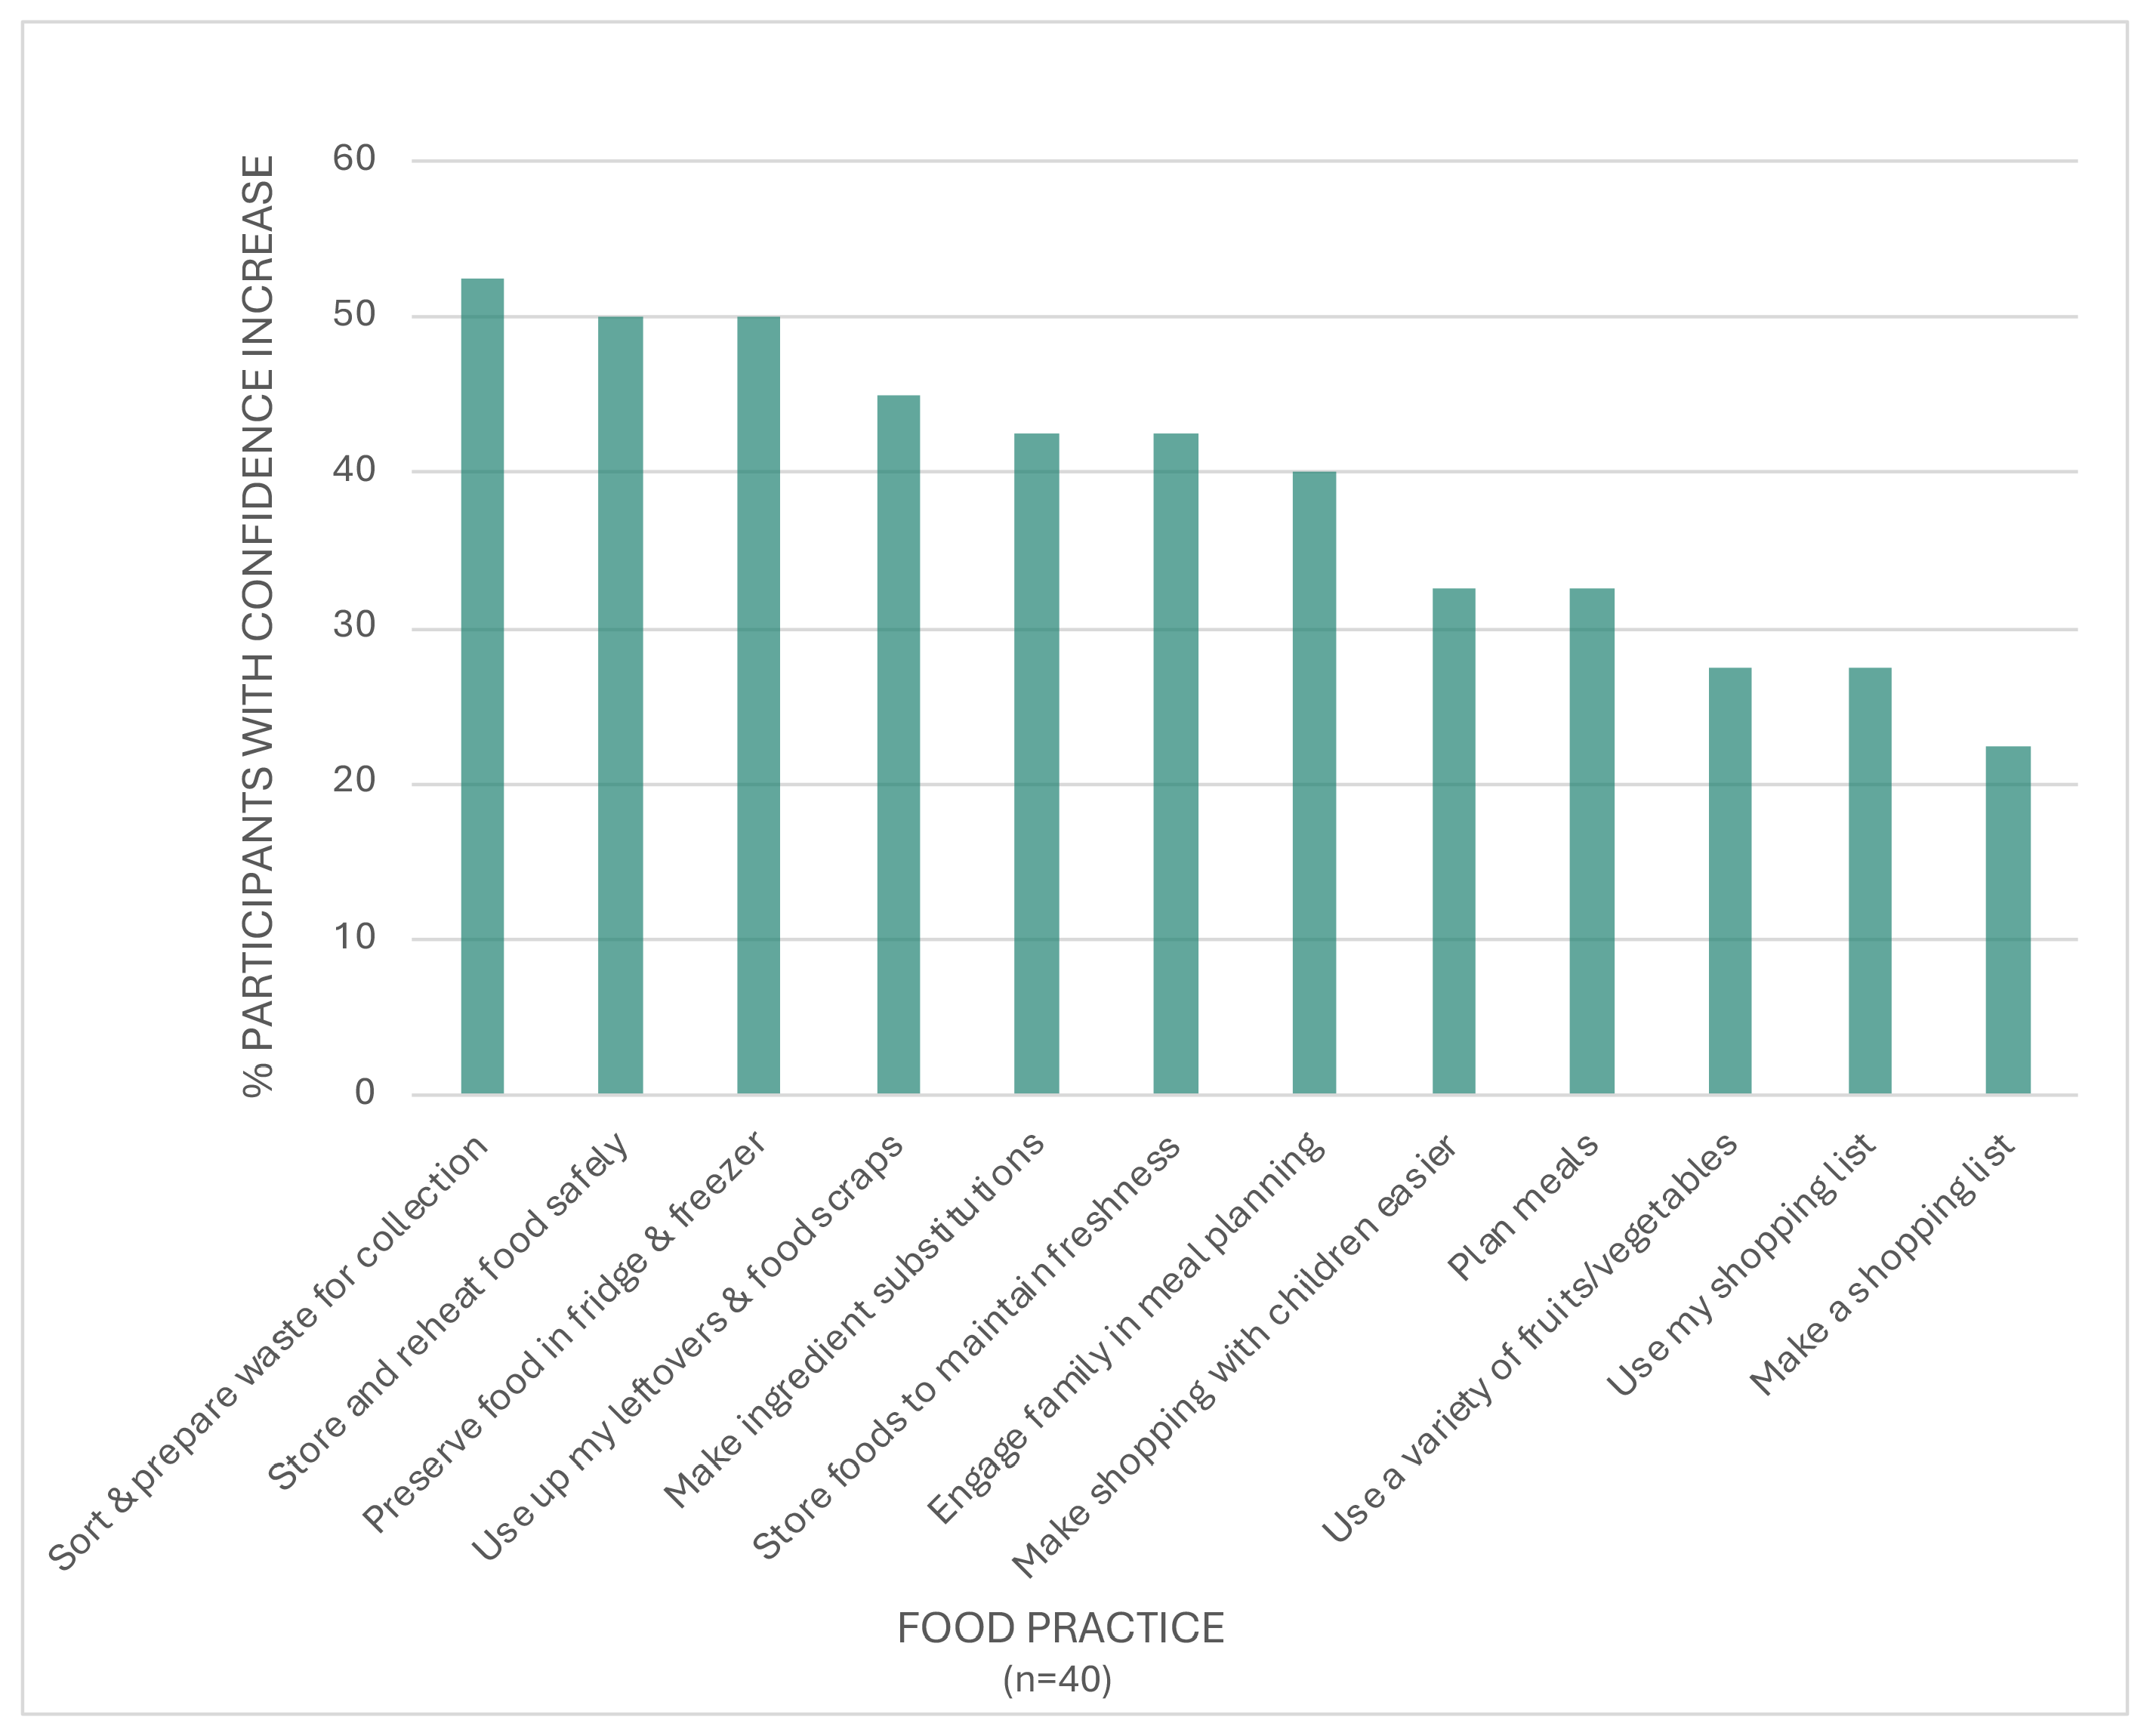
Self-efficacy was measured by the participants’ reported confidence in their ability to perform the food practices taught in the lesson series. There was a statistically significant increase in participant confidence to perform all twelve food practices in the pre-/post-pilot survey question (all p < 0.03). The greatest percentage of participants increased their confidence in the following practices: sorting and preparing food waste for collection or drop-off (53%), storing and reheating leftover foods safely (50%), and preserving food in the refrigerator and freezer (50%). The results are summarized in Figure 9.
The mean level of confidence increased with the number of lessons attended for the following practices: engaging family in meal planning, storing and reheating leftover foods safely, and preserving food in the refrigerator and freezer. Attending specific lessons also increased confidence in some of the food practices taught in those lessons. For example, attending the third lesson on food storage increased the mean confidence in storing foods to maintain freshness (0.53), storing and reheating foods safely (0.43), and preserving food (1.0), compared to not attending the lesson. As discussed earlier, self-efficacy was measured on a 3-point scale ranging from 1 (not confident) to 3 (confident).

4. Discussion

This study evaluated a four-lesson household food waste reduction intervention tailored to low-income households in the US. To our knowledge, it is among the first published studies to focus on this understudied population and integrate education with a pre/post-intervention survey, food waste audit in the living environment, and longer-term follow-up assessment. Our findings demonstrate that a skills-focused lesson series can improve participants’ food management behaviors, decrease barriers to food waste reduction, and increase confidence in performing sustainable food practices.
The current study’s lesson content was informed by focus groups with community members representative of the intended audience and the intervention was tailored to reach the main food preparers in low-income households. Previously, only a few studies tailored information to the audience [22,23]. Similar to prior interventions, the current study addressed essential household food waste topics, including meal planning and shopping, food preparation, food storage, understanding date labels, and handling excess food. However, while most interventions have relied on participants to engage with information and materials individually at home, this study reached participants in community settings, allowing for group interaction and peer learning [24,25,26].

4.1. Interpretation of Results

Demographic data analysis confirmed that the intervention reached low-income, high-need households with nearly 70 percent receiving food assistance and almost half experiencing some amount of food insecurity. Past research has shown that low-income households have different constraints, priorities, and needs than the general population, including limited access to transportation; larger family sizes; competing work and caregiving responsibilities; language barriers; and managing food from multiple sources, including food assistance programs, food banks, and grocery stores [27,28,29]. In noting that participants with lower incomes were more likely to drop out of their study than those with higher incomes, Wharton et al. stated, “interventions may be required that not only provide individual tailoring but consideration for a wider range of barriers to reducing food waste based on sociodemographics [25].” Families with children face additional food waste challenges, such as picky eating behaviors that lead to over-preparation of meals [30]. Therefore, we limited our sample to households with children and recommended strategies for shopping with children, and still successfully retained 80% participation (attended at least one lesson and completed pre- and post-surveys).
Our food waste audit and pre/post-pilot survey indicated the most frequently discarded foods were inedible scraps, fruits, vegetables, and grains, aligning with recent US survey data [31]. After the pilot, decreases in discarded scraps, vegetables, and grains were consistent with the content of the lessons, which emphasized creative food reuse, proper food storage, and food preservation methods—an outcome observed in similar interventions [24,25]. For instance, the cooking lesson included a “build your own fried rice” recipe and tips for using beet greens, broccoli stems, and leftover bread.
A notable change in our study was the reduction in the number of participants discarding food because of package date labels, a major driver of unnecessary food waste [32]. Confusion around “sell by”, “use by”, and “best by” dates among US consumers is well documented; a 2025 poll found that 43% of US consumers always or usually discard food near or past the date label, up from 37% in 2016 [32,33,34,35]. The lesson on food storage, including package dates, appears to have addressed this barrier, with a significant decrease in participants throwing away food for this reason post-intervention. This finding highlights the importance of targeted education in correcting misconceptions about food freshness and safety.
According to the survey results, participants’ food practices improved following the lesson series pilot. Most notably, participants reported more frequently making and using a shopping list, freezing food for later use, and incorporating leftovers or food scraps into future meals—behaviors intentionally targeted in the curriculum. These behaviors—particularly use of a shopping list and using leftovers—are associated with less household food waste, while freezing food has been suggested as an energy-efficient strategy for reducing food waste [36,37]. Participants who completed the food waste audit were more likely to freeze food and less likely to throw away leftovers than those who did not, suggesting that self-monitoring may heighten awareness and reinforce behavior change, consistent with studies showing that measurement alone can drive food waste reduction [38,39].
Improvements in handling restaurant leftovers, such as increased refrigeration, freezing, and repurposing, demonstrated that participants were able to apply their skills in different contexts. At the same time, participants reported bringing home restaurant leftovers less often, possibly because they ordered less or had food safety concerns, though the reasons for this were not assessed.
In contrast, meal planning showed less change than other practices. This may be because meal planning is a more complex habit that involves coordination of the entire household’s activities, as observed by multiple studies [40,41]. Participants may have also felt their current planning was sufficient or faced work or caregiving demands that limited the time available for planning meals.
Follow-up survey results indicated that many food practices were sustained four months after the pilot ended, although participants who continued the behaviors may have been more likely to respond to the survey. Sorting food waste for collection was the least frequently performed practice. This is not surprising as practices related to food waste disposal are difficult to change because of structural factors [42]. Many participants, particularly apartment dwellers, lacked access to organic food waste collection or the ability to compost at home. The main goal of our lesson on handling excess food was to prepare participants for future implementation of organic waste services.
The pre-/post-survey results strongly demonstrated that attending the lesson series pilot helped participants overcome barriers and increase self-efficacy to reduce household food waste. All barrier measures decreased, and all self-efficacy measures increased from pre- to post-pilot. Although more than half the participants gained confidence in sorting and preparing their waste for collection or drop-off, this was the least frequently performed practice in the follow-up survey because of the structural factors discussed earlier. Similarly, the percentage of participants who felt it was not possible for their household to compost food waste decreased only 5% from pre- to post-pilot.
The leading barrier, “I toss food if I am not sure if it is safe to eat”, decreased only slightly after the pilot. This may reflect uncertainty in how participants interpreted the statement, since discarding unsafe food can be interpreted as appropriate behavior. However, greater knowledge of food safety can reduce unnecessary waste of edible food [43]. Rewording the statement might help clarify the intended barrier.
The participants’ readiness to reduce their household food waste was expected, given their voluntary enrollment in the lesson series pilot. Prior research shows that consumers, perhaps especially those with financial constraints, are highly motivated by financial considerations [19,40,43], which aligns with the participants’ primary reasons for wanting to decrease their food waste—saving money and managing their home more efficiently. Household dynamics also shape food-related behaviors, reflected in the participants’ desire to set a positive example for their children as another motivation to reduce waste.

4.2. Limitations and Lessons Learned

This study had several limitations. Although the results were encouraging, the sample size was relatively small, and only half the enrolled participants attended all the lessons and assessments. Attendance challenges are common in low-income populations due to transportation, personal circumstances, and family responsibilities [44,45]. We found that attending specific lessons increased confidence in certain food practices, suggesting that offering standalone classes may reduce barriers to participation while still being impactful.
This study focused exclusively on household-level food behaviors and did not examine broader systemic factors that affect household food waste. Structural issues such as food access, local food policies, transportation constraints, and community resources all influence how households handle food but were outside the scope of this study [46,47].
The results from our intervention cannot be generalized to other populations or geographic locations. Our pilot was designed specifically for populations with lower incomes in California and delivered in English. In general, California residents have a higher awareness of food waste issues than those in many other US states because of Senate Bill 1383, which is aimed at diverting organic waste from landfills. Our results were also affected by self-selection bias because the participants who volunteered were already interested in food waste reduction.
Our evaluation relied on self-reported data from surveys and household food waste audits, which can introduce additional sources of bias and error. Participants may have had difficulty recalling the types and amounts of food they threw out in the surveys, leading to recall bias. Social desirability bias may have prompted participants to overreport positive behaviors and underreport negative ones. Multi-day audits can lead to missing data and response fatigue. Together, these factors may have caused household food waste to be underestimated.
Conducting a self-managed household food waste audit with a population with lower income proved particularly challenging. This is also the reason we have a small sample size, which substantially limited statistical power. As noted earlier, the primary difficulties involved missing data and inaccurate measurement of food waste. These challenges are not unique to our study; even in the general population, direct measurement of household food waste is affected by logistical and methodological limitations [48]. Specifically, it is time-consuming, requires technical proficiency, and relies on the cooperation of all household members to separate food waste [49].
Currently, no universally accepted audit method or protocol exists, making it difficult to compare results between studies [49]. Any method of measuring food waste in the household, including diaries, photographs, questionnaires, and weighing waste, can be subject to user error or biases, including social desirability bias [50,51]. The accuracy of our waste audit may have been improved by adding a trial period for participants to practice their skills, simplifying the process by measuring solid food weight only, or having the research team pick up and measure the waste.
Despite the lack of statistical significance, our food waste audit results are still meaningful within the context of this pilot study. The audit was designed to assess feasibility and capture general patterns in food waste rather than to detect statistically significant changes, particularly given the small sample size and variability associated with participant-managed audits. Both food waste volume and weight decreased after the intervention, showing a consistent direction of change. These trends are consistent with the improvements in participants’ self-reported food practices. Together, the audit and survey results provide complementary evidence to inform future larger-scale studies.
We used paper surveys for our pre/post-pilot evaluation because they reduce technological barriers, such as access to digital devices or internet. Unlike online surveys, however, paper surveys do not have automatic error checking. In our study, we found that the structure and order of the questions affected the participants’ responses, especially when a multiple-answer question (choose all that apply) was asked immediately before or after a single-answer question (choose one). The ranking question about motivation was confusing to participants (even after the instructor’s verbal explanation) because it was the only one of its kind. We corrected most errors by checking the surveys as they were collected, but limiting the types of questions or grouping similar questions together could have made administering the surveys easier.

4.3. Implications for Future Research and Practice

Future research and practice should focus on expanding the reach, accessibility, and cultural relevance of this educational intervention. Translating the curriculum into Spanish, and potentially other languages, will be important in reaching more households with lower incomes in California. The lesson series is currently being disseminated to educators across the US, creating opportunities to assess its effectiveness in diverse communities. Another priority is assessing the long-term impact of the lessons on food-related behaviors and food resource management skills. Based on our experience, holding classes in-person helped facilitate interaction and discussion between participants. Future research should examine whether delivery format influences intervention effectiveness.
A more suitable food waste audit methodology is needed for families with lower incomes—one that is simple, accurate, and feasible for participants who may have limited time, caregiving demands, language barriers, varying levels of literacy, and limited familiarity with measurement tools. Surveys should be simplified for clarity and ease of completion.
In future studies, including a control group that completes the same surveys without attending the educational lessons would allow for a clearer assessment of the intervention’s effectiveness over time. This design would help distinguish changes linked to the intervention from those resulting from other influences or general trends.
Food waste behavior is complicated, extending beyond individual actions to the dynamics of the entire household. There are multiple factors influencing household food waste reduction, such as engagement of family members, meal planning routines, and shopping practices. Future research should focus on understanding these interconnected factors, developing interventions that involve the whole family, youth at school, and stakeholder and community support, and influencing policy, systems, and environmental changes.

5. Conclusions

This study contributes to the limited research on food waste interventions in populations with lower incomes. The use of multiple assessment tools, including pre/post surveys, food waste audits, and follow-up surveys, provided a more complete picture of food-related behaviors and attitudes in the home. Even so, challenges with self-reported data and self-managed food audits highlight the need for simpler, more reliable measurement approaches for families with limited time and resources.
The pilot results show that skill-based education delivered through trusted community partners can improve key food management behaviors, reduce barriers, and increase confidence to reduce food waste among low-income households. To increase engagement, programs should incorporate culturally relevant, hands-on activities that encourage participant interaction and peer learning. Integrating food waste reduction efforts with existing nutrition education programs may further enhance outcomes, given the connection between food resource management and food security.
More broadly, food waste education can support state and national sustainability goals while helping families stretch limited resources. Pairing education with stronger structural supports, such as improved community resources, public programs, and local food systems, can further strengthen and sustain its impact.

Supplementary Materials

The following supporting information can be downloaded at: https://www.mdpi.com/article/10.3390/su18021078/s1, Food audit survey, pre-/post-survey, 4-month follow-up survey.

Author Contributions

Conceptualization and project supervision, Y.M. and M.N.; methodology, D.S.; formal analysis, D.S.; visualization, D.S., Y.M. and N.P.; references: J.H.; funding acquisition, M.N. and Y.M.; writing—original draft preparation, D.S., Y.M., A.E. and I.P.; writing—review and editing, all authors. All authors have read and agreed to the published version of the manuscript.

Funding

This research was funded and supported by the ReFED Catalytic Grant Fund.

Institutional Review Board Statement

Study protocols were approved by the University of California, Davis Institutional Review Board (protocol code 2060459-1 and approved date 25 May 2023).

Informed Consent Statement

Informed consent was obtained from all subjects involved in the study.

Data Availability Statement

The original contributions presented in this study are included in the article/Supplementary Materials. Further inquiries can be directed to the corresponding author.

Conflicts of Interest

The authors declare no conflicts of interest.

References

  1. Rabbitt, M.P.; Reed-Jones, M.; Hales, L.J.; Burke, M.P.; United States Department of Agriculture Economic Research Service. Household Food Security in the United States in 2023; Economic Research Report; No. 337; Economic Research Service, U.S. Department of Agriculture: Washington, DC, USA, 2024. [Google Scholar] [CrossRef]
  2. Yu, Y.; Jaenicke, E.C. Estimating Food Waste as Household Production Inefficiency. Am. J. Agric. Econ. 2020, 102, 525–547. [Google Scholar] [CrossRef]
  3. Kenny, S. Estimating the Cost of Food Waste to American Consumers; EPA/600/R-25/048; U.S. Environmental Protection Agency: Washington, DC, USA, 2025. Available online: https://www.epa.gov/system/files/documents/2025-04/costoffoodwastereport_508.pdf (accessed on 30 November 2025).
  4. CalRecycle. California’s Organic Waste Reduction: SB 1383 Short-Lived Climate Pollutant Reduction Strategy. Available online: https://calrecycle.ca.gov/organics/slcp (accessed on 12 November 2025).
  5. California Association of Food Banks. Food Insecurity Data. Available online: https://www.cafoodbanks.org/food-insecurity-data/ (accessed on 30 November 2025).
  6. U.S. Environmental Protection Agency. Advancing Sustainable Materials Management: 2018 Fact Sheet. 2020. Available online: https://www.epa.gov/sites/default/files/2020-11/documents/2018_ff_fact_sheet.pdf (accessed on 30 November 2025).
  7. U.S. Environmental Protection Agency. From Farm to Kitchen: The Environmental Impacts of U.S. Food Waste. Available online: https://www.epa.gov/land-research/farm-kitchen-environmental-impacts-us-food-waste (accessed on 30 November 2025).
  8. United Nations Environment Program. Food Waste Index Report 2024: Think Eat Save—Tracking Progress to Halve Global Food Waste; Nairobi, Kenya. 2024. Available online: https://wedocs.unep.org/handle/20.500.11822/45230 (accessed on 29 October 2025).
  9. Qi, D.; Roe, B.E. Household Food Waste: Multivariate Regression and Principal Components Analyses of Awareness and Attitudes among U.S. Consumers. PLoS ONE 2016, 11, e0159250. [Google Scholar] [CrossRef]
  10. Davenport, M.L.; Qi, D.; Roe, B.E. Food-Related Routines, Product Characteristics, and Household Food Waste in the United States: A Refrigerator-Based Pilot Study. Resour. Conserv. Recycl. 2019, 150, 104440. [Google Scholar] [CrossRef]
  11. Tonini, P.; Odina, P.M.; Durany, X.G. Predicting Food Waste in Households with Children: Socio-Economic and Food-Related Behavior Factors. Front. Nutr. 2023, 10, 1249310. [Google Scholar] [CrossRef]
  12. Suthar, S.; Singh, P. Household Solid Waste Generation and Composition in Different Family Size and Socio-Economic Groups: A Case Study. Sustain. Cities Soc. 2015, 14, 56–63. [Google Scholar] [CrossRef]
  13. Lai, M.; Rangan, A.; Grech, A. Enablers and Barriers of Harnessing Food Waste to Address Food Insecurity: A Scoping Review. Nutr. Rev. 2022, 80, 1836–1855. [Google Scholar] [CrossRef]
  14. Schanes, K.; Dobernig, K.; Gözet, B. Food Waste Matters—A Systematic Review of Household Food Waste Practices and Their Policy Implications. J. Clean. Prod. 2018, 182, 978–991. [Google Scholar] [CrossRef]
  15. Neelon, M.; Meng, Y.; Lee, D.; Price, N.; Matias, S. Needs Assessment of Extension Staff/Volunteers Readiness to Tackle Household Food Waste Reduction Education. J. Nutr. Educ. Behav. 2024, 56, S68. [Google Scholar] [CrossRef]
  16. Meng, Y.; Neelon, M.; Hartmann, J.; Padasas, I.; Price, N.; Schnur, D.; VanCleave-Hunt, V. Exploration of Low-Income Household Food Waste Reduction Awareness, Practices, and Education Needs. J. Nutr. Educ. Behav. 2024, 56, S8. [Google Scholar] [CrossRef]
  17. StopWaste. 10-Minute Fridge Reality Check. Available online: https://stopfoodwaste.org/resource/10-minute-fridge-reality-check (accessed on 12 November 2025).
  18. Visschers, V.H.M.; Wickli, N.; Siegrist, M. Sorting out Food Waste Behaviour: A Survey on the Motivators and Barriers of Self-Reported Amounts of Food Waste in Households. J. Environ. Psychol. 2016, 45, 66–78. [Google Scholar] [CrossRef]
  19. Neff, R.A.; Spiker, M.L.; Truant, P.L. Wasted Food: U.S. Consumers’ Reported Awareness, Attitudes, and Behaviors. PLoS ONE 2015, 10, e0127881. [Google Scholar] [CrossRef]
  20. U.S. Department of Agriculture (USDA). Food Security in the U.S.—Measurement. Available online: https://www.ers.usda.gov/topics/food-nutrition-assistance/food-security-in-the-us/measurement (accessed on 12 November 2025).
  21. Koundinya, V. Program Development and Evaluation: How to Compute and Present Individual Change with Before and After Survey Data; Quick Tips #38; University of Wisconsin-Extension: Madison, WI, USA, 2017. [Google Scholar]
  22. Roe, B.E.; Qi, D.; Beyl, R.A.; Neubig, K.E.; Apolzan, J.W.; Martin, C.K. A Randomized Controlled Trial to Address Consumer Food Waste with a Technology-Aided Tailored Sustainability Intervention. Resour. Conserv. Recycl. 2022, 179, 106121. [Google Scholar] [CrossRef]
  23. Schmidt, K. Explaining and Promoting Household Food Waste-Prevention by an Environmental Psychological Based Intervention Study. Resour. Conserv. Recycl. 2016, 111, 53–66. [Google Scholar] [CrossRef]
  24. van der Werf, P.; Seabrook, J.A.; Gilliland, J.A. “Reduce Food Waste, Save Money”: Testing a Novel Intervention to Reduce Household Food Waste. Environ. Behav. 2021, 53, 151–183. [Google Scholar] [CrossRef]
  25. Wharton, C.; Vizcaino, M.; Berardy, A.; Opejin, A. Waste Watchers: A Food Waste Reduction Intervention among Households in Arizona. Resour. Conserv. Recycl. 2021, 164, 105109. [Google Scholar] [CrossRef]
  26. Soma, T.; Li, B.; Maclaren, V.; Soma, T.; Li, B.; Maclaren, V. Food Waste Reduction: A Test of Three Consumer Awareness Interventions. Sustainability 2020, 12, 907. [Google Scholar] [CrossRef]
  27. Eicher-Miller, H.A.; Graves, L.; McGowan, B.; Mayfield, B.J.; Connolly, B.A.; Stevens, W.; Abbott, A. A Scoping Review of Household Factors Contributing to Dietary Quality and Food Security in Low-Income Households with School-Age Children in the United States. Adv. Nutr. 2023, 14, 914–945. [Google Scholar] [CrossRef]
  28. Shanks, C.B.; Andress, L.; Hardison-Moody, A.; Jilcott Pitts, S.; Patton-Lopez, M.; Prewitt, T.E.; Dupuis, V.; Wong, K.; Kirk-Epstein, M.; Engelhard, E.; et al. Food Insecurity in the Rural United States: An Examination of Struggles and Coping Mechanisms to Feed a Family among Households with a Low-Income. Nutrients 2022, 14, 5250. [Google Scholar] [CrossRef]
  29. Vahabi, M.; Damba, C. Perceived Barriers in Accessing Food among Recent Latin American Immigrants in Toronto. Int. J. Equity Health 2013, 12, 1. [Google Scholar] [CrossRef]
  30. Kansal, M.; Ananda, J.; Mitsis, A.; Karunasena, G.G.; Pearson, D. Food Waste in Households: Children as Quiet Powerhouses. Food Qual. Prefer. 2022, 98, 104524. [Google Scholar] [CrossRef]
  31. MITRE Corporation. The Food We Eat—And Throw Away. Household Food Waste. Available online: https://sites.mitre.org/household-food-waste/ (accessed on 3 December 2025).
  32. Patra, D.; Feng, S.; Howard, J.W. Confusion of Food-Date Label with Food Safety—Implications for Food Waste. Curr. Opin. Food Sci. 2022, 48, 100917. [Google Scholar] [CrossRef]
  33. Neff, R.A.; Spiker, M.; Rice, C.; Schklair, A.; Greenberg, S.; Leib, E.B. Misunderstood Food Date Labels and Reported Food Discards: A Survey of U.S. Consumer Attitudes and Behaviors. Waste Manag. 2019, 86, 123–132. [Google Scholar] [CrossRef] [PubMed]
  34. Kavanaugh, M.; Quinlan, J.J. Consumer Knowledge and Behaviors Regarding Food Date Labels and Food Waste. Food Control 2020, 115, 107285. [Google Scholar] [CrossRef]
  35. Neff, R.; Leib, E.B.; Khan, A.; Gunders, D. Consumer Perceptions of Food Date Labels: 2025 National Survey; ReFED: Chicago, IL, USA; Johns Hopkins Bloomberg School of Public Health: Baltimore, MD, USA; Harvard Law School Food Law and Policy Clinic: Cambridge, MA, USA, 2025. [Google Scholar]
  36. Stancu, V.; Haugaard, P.; Lähteenmäki, L. Determinants of Consumer Food Waste Behaviour: Two Routes to Food Waste. Appetite 2016, 96, 7–17. [Google Scholar] [CrossRef] [PubMed]
  37. Brown, T.; Hipps, N.A.; Easteal, S.; Parry, A.; Evans, J.A. Reducing Domestic Food Waste by Freezing at Home. Int. J. Refrig. 2014, 40, 362–369. [Google Scholar] [CrossRef]
  38. Qi, D.; Roe, B.E.; Apolzan, J.W.; Martin, C.K. Learning about Our Vices from Devices: A Model of Individual Learning with an Application to Consumer Food Waste. J. Agric. Resour. Econ. 2023, 48, 296–308. [Google Scholar] [CrossRef]
  39. Ramos, G.J.; Borges, J.A.R.; Domingues, C.H.d.F.; van Herpen, E. Reducing Food Waste by Simply Measuring It: Insights from Interventions to Reduce Household Food Waste. Br. Food J. 2023, 126, 812–833. [Google Scholar] [CrossRef]
  40. Quested, T.E.; Marsh, E.; Stunell, D.; Parry, A.D. Spaghetti Soup: The Complex World of Food Waste Behaviours. Resour. Conserv. Recycl. 2013, 79, 43–51. [Google Scholar] [CrossRef]
  41. Pickering, J. Household Meal Planning as Anticipatory Practice: The Role of Anticipation in Managing Domestic Food Consumption and Waste. Geoforum 2023, 144, 103791. [Google Scholar] [CrossRef]
  42. Pereira, V.R.; Fiore, F.A.; Pereira, V.R.; Fiore, F.A. Opportunities and Barriers to Composting in a Municipal Context: A Case Study in São José Dos Campos, Brazil. Sustainability 2024, 16, 3359. [Google Scholar] [CrossRef]
  43. Graham-Rowe, E.; Jessop, D.C.; Sparks, P. Identifying Motivations and Barriers to Minimising Household Food Waste. Resour. Conserv. Recycl. 2014, 84, 15–23. [Google Scholar] [CrossRef]
  44. Neuenschwander, L.M.; Abbott, A.; Mobley, A.R. Comparison of a Web-Based vs In-Person Nutrition Education Program for Low-Income Adults. J. Acad. Nutr. Diet. 2013, 113, 120–126. [Google Scholar] [CrossRef] [PubMed]
  45. Richardson, J.; Williams, J.A.; Mustian, R.D. Barriers to Participation in Extension Expanded Foods and Nutrition Programs. J. Ext. 2003, 41, 8. [Google Scholar]
  46. Cuffey, J.; Li, W.; Yu, Y.; Miao, R. Retail Food Environment and Household Food Waste: An Empirical Study. Food Policy 2023, 117, 102457. [Google Scholar] [CrossRef]
  47. Hamilton, S.F.; Richards, T.J. Food Policy and Household Food Waste. Am. J. Agric. Econ. 2019, 101, 600–614. [Google Scholar] [CrossRef]
  48. Seta, Y.; Yamakawa, H.; Okayama, T.; Watanabe, K.; Nonomura, M. The Effects of Interventions Using Support Tools to Reduce Household Food Waste: A Study Using a Cloud-Based Automatic Weighing System. Sustainability 2025, 17, 6392. [Google Scholar] [CrossRef]
  49. Withanage, S.V.; Dias, G.M.; Habib, K. Review of Household Food Waste Quantification Methods: Focus on Composition Analysis. J. Clean. Prod. 2021, 279, 123722. [Google Scholar] [CrossRef]
  50. van Herpen, E.; van der Lans, I.A.; Holthuysen, N.; Nijenhuis-de Vries, M.; Quested, T.E. Comparing Wasted Apples and Oranges: An Assessment of Methods to Measure Household Food Waste. Waste Manag. 2019, 88, 71–84. [Google Scholar] [CrossRef]
  51. Aitken, J.A.; Sprenger, A.; Alaybek, B.; Mika, G.; Hartman, H.; Leets, L.; Maese, E.; Davoodi, T.; Aitken, J.A.; Sprenger, A.; et al. Surveys and Diaries and Scales, Oh My! A Critical Analysis of Household Food Waste Measurement. Sustainability 2024, 16, 968. [Google Scholar] [CrossRef]
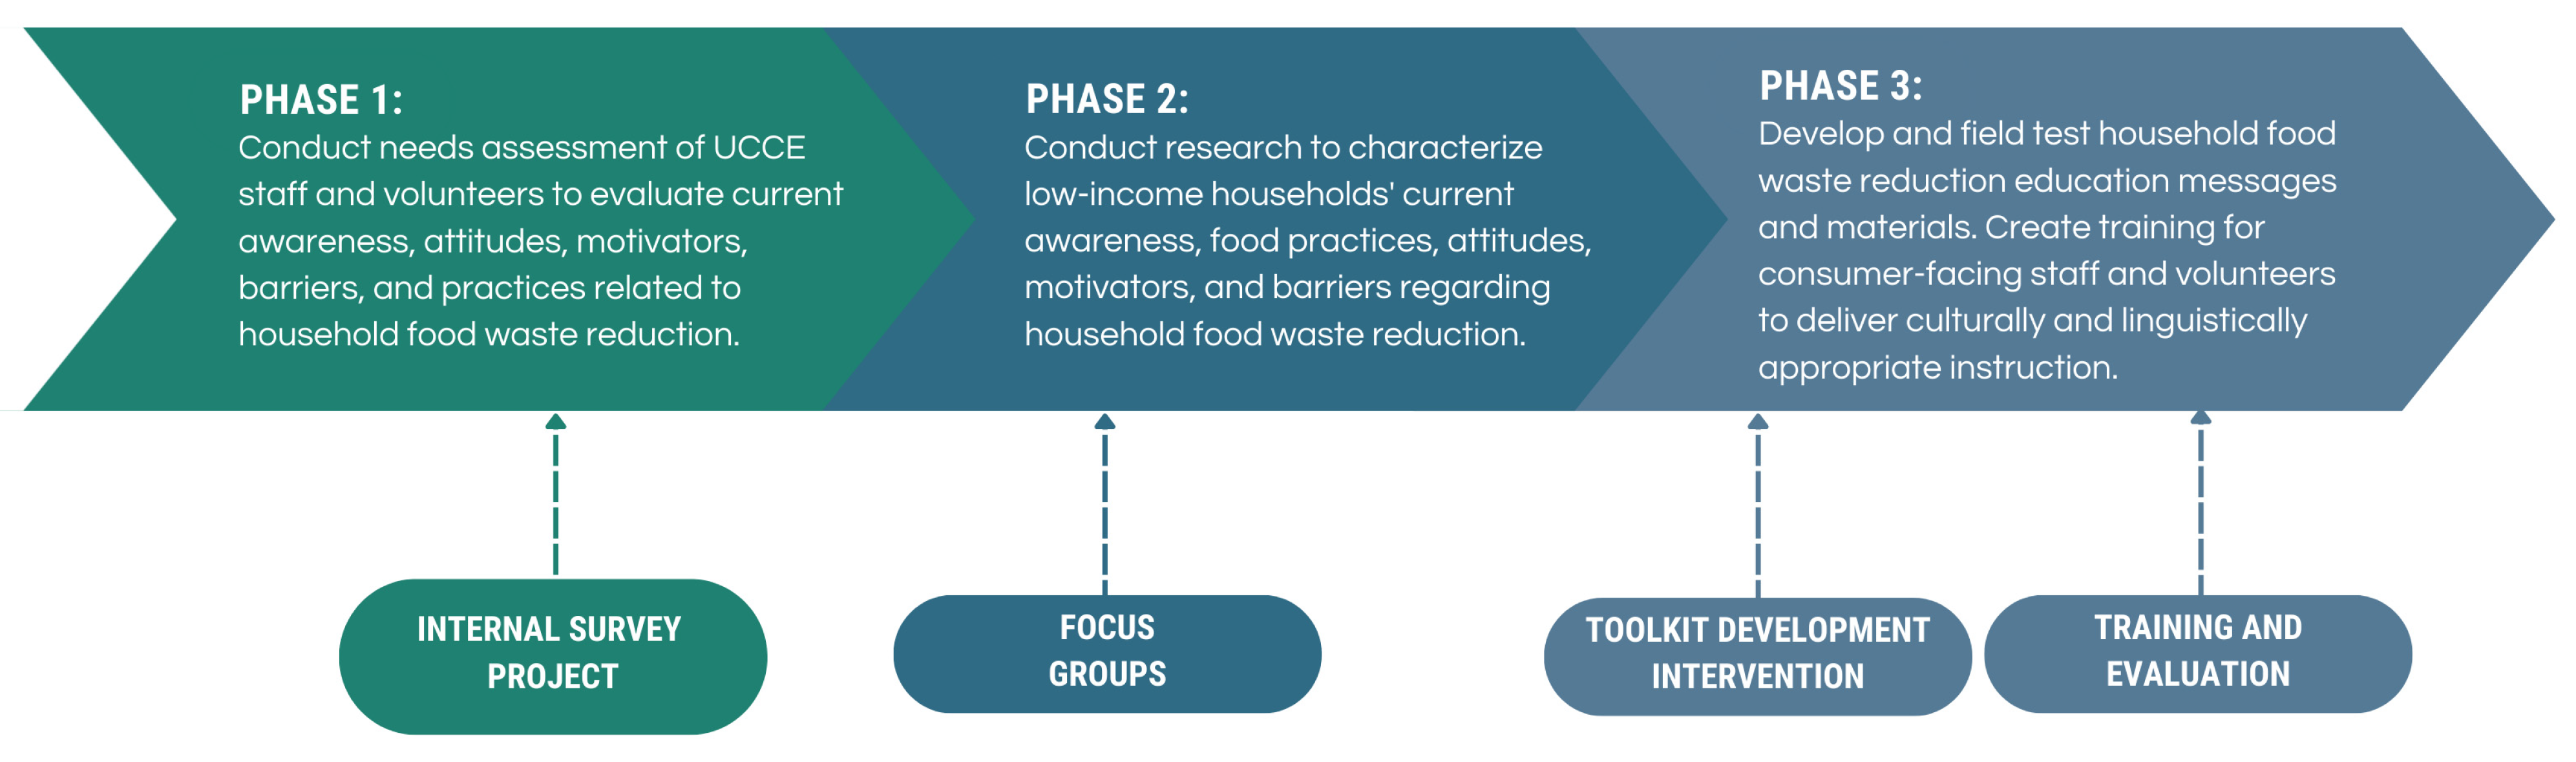
Figure 1. Phases of the UCCE food waste reduction project.
Sustainability 18 01078 g001
Figure 2. Pilot study design with timeline.
Sustainability 18 01078 g002
Figure 3. Total counts of discarded food by type during the pre- and post-pilot waste audits (n = 17). Count reflects the number of times each food type was recorded across all participants over the full audit period.
Sustainability 18 01078 g003
Figure 4. Change in discarded food types from pre- to post-pilot waste audits (n = 17).
Sustainability 18 01078 g004
Figure 5. Reasons for throwing out food pre- vs. post-pilot (n = 40).
Sustainability 18 01078 g005
Figure 6. Frequency of shopping-related practices pre- vs. post-pilot (n = 40).
Sustainability 18 01078 g006
Figure 7. Frequency of other food practices pre- vs. post-pilot (n = 40).
Sustainability 18 01078 g007
Figure 8. Handling of restaurant leftovers pre- vs. post-pilot (n = 40).
Sustainability 18 01078 g008
Figure 9. Percentage of participants reporting increased confidence across food-practice skills taught in the pilot lesson series.
Sustainability 18 01078 g009
Table 1. Number of pilot program participants per county who completed each lesson and assessment (n = 50).
CountyPre Survey (Enrolled)Pre Food AuditLesson 1Lesson 2Lesson 3Lesson 4Post
Survey
Post Food AuditFull
Participation * (Rate) **
19-95556-2 (22%)
24-42222-2 (50%)
36-63566-2 (33%)
46-65555-5 (83%)
5888888888 (100%)
6777764664 (57%)
710710984732 (20%)
Total502250 (100%)39 (78%)39 (78%)34 (68%)40 (80%)17 (77%)25 (50%)
* Full participation is defined as having completed all lessons and assessments. ** Full participation rate is calculated as: full participation/pre survey (enrolled).
Table 2. Demographic characteristics of participants (n = 50).
VariableNumberPercent
Race
  American Indian or Alaskan Native12%
  Asian48%
  Black or African American816%
  White1122%
  Other1632%
  White + Other24%
  Choose not to answer816%
Ethnicity
  Hispanic2958%
  Not Hispanic1836%
  Choose not to answer36%
Household Size
  2612%
  31020%
  41632%
  51224%
  648%
  712%
  812%
Highest Grade Completed
  6th grade24%
  7th to 12th grade612%
  High school diploma or GED918%
  Some college1020%
  2-year college918%
  4-year college918%
  Other510%
Preferred Language
  English3672%
  Spanish612%
  Either816%
Age (years)MeanMinMax
  Participant36.12164
  Household21.4172
Table 3. Food waste audit: solid and liquid food volume and weight pre- vs. post-pilot (n = 17).
Total Amount (n = 17)PrePostPost Minus Prep-Value
Solid Food Volume (containers/day)8.907.50−1.400.10
Liquid Food Volume (oz/day)51.1139.80−11.310.35
Solid Food Weight (lbs/day)34.7527.12−7.630.09
Liquid Food Weight (lbs/day)3.753.60−0.160.47
Table 4. Participant agreement with food waste reduction barrier statements pre- vs. post-pilot (n = 40).
Barrier% of Participants Who Agree with Barrier Statement (n = 40)
PrePostPost Minus Pre
Not enough information on benefits50%15%−35%
Don’t understand date labels25%13%−12%
Toss food if not sure safe to eat73%65%−8%
Not enough food preservation skills48%13%−35%
Not enough info from waste company63%25%−38%
Difficult to prepare a meal from leftovers35%18%−17%
Don’t find time to prepare food before it spoils35%15%−20%
Not possible to compost food waste43%38%−5%
Not enough food storage space28%25%−3%
Disclaimer/Publisher’s Note: The statements, opinions and data contained in all publications are solely those of the individual author(s) and contributor(s) and not of MDPI and/or the editor(s). MDPI and/or the editor(s) disclaim responsibility for any injury to people or property resulting from any ideas, methods, instructions or products referred to in the content.