Abstract
Land surface temperature (LST) is an important indicator of ecosystem sustainability and climate change resilience, particularly in highland watersheds characterized by fast land use and land cover (LULC) changes. In this research, the LST dynamics of the Laut Tawar Sub-watershed, Central Aceh, Indonesia, were investigated, based on Landsat 9 OLI/TIRS 2024 imagery. Supervised classification identified eight land cover categories, and their thermal contrasts were evident: built-up and plantation zones exhibited the highest LST values (25–32 °C), while water bodies and forests acted as natural coolers (9.5–17 °C), with elevation further modulating these patterns by creating cooler microclimates at higher altitudes (>2000 m), highlighting the impact of topography in generating microclimatic diversity. Intermediate values were shown for the moderate and sparse forest areas, which thus worked as transition zones with low cooling capabilities. Natural land covers contributed to thermal regulation, whereas built-up and agricultural expansion exacerbated surface heat and possible urban heat island (UHI) effects. This research highlights the importance of protecting forests and water bodies, controlling land conversion, and applying targeted green infrastructure informed by the thermal disparities and land cover dynamics observed.
1. Introduction
In recent decades, the increased influence of global climate change and frequent land use and land cover (LULC) alterations have presented serious challenges to environmental sciences and resource management. Because urbanization, deforestation, and agricultural expansion are becoming more prevalent across the world, the dynamics of land surface energy are likely to change substantially [1]. Land surface temperature (LST), i.e., the heat exchange between the land surface and the atmosphere, responds immediately to these changes. It is important to monitor LST to determine local and regional climate variation, the impact of UHI, and the general well-being of certain ecosystems [2]. Climate anomalies are increasingly becoming more severe and frequent due to anthropogenic factors. A thorough analysis of LST will support the practice of effective mitigation and adaptation plans to guarantee sustainable environmental management [3].
Landsat 9 was selected for this study because its enhanced sensor features are applicable for this type of measurement in tropical highland watersheds. The satellite has a spatial resolution of 30 m for the multi-spectral bands and 100 m for the thermal infrared bands and is equipped with the Thermal Infrared Sensor 2 (TIRS-2), which enables improved radiometric accuracy and stability compared with previous missions. Its 16-bit radiometric resolution enables the detection of small temperature variations, and its 16-day revisit cycle allows for continuous monitoring under limited cloud-free conditions. These features make Landsat 9 an optimal choice for integrating LULC, LST retrieval, and elevation analysis in the Laut Tawar sub-watershed [4,5].
In the face of human development and industrialization, the Laut Tawar sub-watershed offers a dynamic environment for observing LST patterns. Its multiple land uses, ranging from farms to urban areas, are conditioned by both natural dynamics and human-driven transformation [6]. In recent years, the Laut Tawar communities have been experiencing water quality degradation, habitat loss, and changes to their hydrological regimes. These changes have been aggravated by increasing water requirements and expanding industry [6,7]. While previous studies in Indonesia have examined LULC and hydrology separately, few have integrated land cover classification, land surface temperature, and elevation into a single framework. This study addresses this gap by combining Landsat 9 thermal data with LULC and topographic variables to reveal the contrasting spatial–thermal information in a tropical highland watershed.
As noted, despite the ecological and hydrological significance of the Laut Tawar sub-watershed, few studies have examined its thermal regime using integrated LULC and elevation data [8]. The Laut Tawar sub-watershed exhibits strong relief contrasts between its highlands and low-lying lakeshores and valley floors. However, research in this region has rarely quantified the influence of elevation on land surface temperature, particularly in highland tropical watersheds. Microclimatic contrasts between the cooler microhabitats of higher-elevation forests and the warmer valleys/deforested slopes may have implications for spatial patterns in ecology, hydrology, and human health, but such relationships are largely unquantified in the literature on Laut Tawar [9,10].
Multiple environmental factors are known to influence LST, ranging from natural components, such as topography, vegetation cover, and meteorological conditions, to anthropogenic elements, such as land conversion, urban sprawl, and industrial activity [11]. The process of urbanization normally influences surface temperature because the natural covers are replaced with impervious, heat-retaining surfaces [12]. In general, temperatures are lower in well-vegetated areas due to evapotranspiration and shading effects [13].
In the Laut Tawar sub-watershed, the interaction between traditional agricultural activities and the new pattern of urban growth makes for a complex thermal mosaic that cannot be computed by conventional modeling techniques [14]. Recent research has underscored the need to integrate both natural and anthropogenic variables to fully articulate LST variation over such heterogeneous landscapes [15]. This requires high-resolution remote sensing data in combination with detailed information collected on the ground.
Recent research trends concerning global sustainability and environmental resilience have also led to increased interest in monitoring LST as a proxy for ecosystem stress. Policymakers require spatially and temporally explicit data to guide their decisions on land management and urban planning because extreme weather events and thermal anomalies—e.g., precipitation fluctuations or increased droughts—are frequently observed [16]. The high-resolution, continuous, and near-real-time thermal data from Landsat 9 enable the recording of slight temperature differences that may provide early warnings of environmental degradation [17]. Establishing baseline temperature distributions and long-term trend analyses is helpful in evaluating the effectiveness of specific forms of local adaptation strategies, e.g., green infrastructure development and appropriate modifications to the LULC policies intended to ameliorate the effect of urban heat islands [18].
This study was designed to investigate the spatial LST in the Laut Tawar sub-watershed and to identify the most significant natural and anthropogenic factors influencing these patterns. In this regard, this study aimed to map the distribution of LST across different land cover types within the sub-watershed using Landsat 9 thermal data, whereby we can quantify the influence of land cover changes, such as the conversion of forest or vegetation areas to agricultural or urban areas, on temperature variations [6,19]. In achieving this goal, this study seeks to fill a critical gap in the current literature, providing a detailed assessment and integrating remote sensing data with geospatial analysis [20].
This investigation makes use of a multidisciplinary technique involving both Remote Sensing (RS) and Geographic Information System (GIS). Thermal infrared images from Landsat 9 will be gathered and then preprocessed to extract the radiance values in the upper atmosphere, which will later be converted to brightness temperature using the standardized calibration coefficients. Furthermore, the Normalized Difference Vegetation Index (NDVI) will be obtained for use as the green cover proxy, and the emissivity calculation will help convert the brightness temperature to the surface temperature of the earth. Combining these datasets will allow for the creation of a thematic map of LST, which will display not only the spatial distribution of the area but also the time intervals within which the phenomena of concern have been observed across the sub-watershed [2,17,21,22].
Moreover, the changing states of the Laut Tawar sub-watershed also emphasize the importance of new and local studies. In a context of increased climate uncertainties and fast socioeconomic growth, frequent observations of surface temperature tendencies are essential for sustainable regional planning [22]. Local government and various environmental groups look, in particular, at how spatial changes caused by fire may alter thermal models, noting the direct and indirect consequences of water and heat resources, agriculture, and urban comfort [23]. This study will be helpful in determining the correct use of land policy and establishing the adaptive procedures necessary to solve problems pertaining to heat, while also ensuring the health and safety of certain organisms and human beings [24]. The generated LST charts and the forecast are intended to be a main resource for regional planners looking to optimize their resources in the future [25].
This study’s importance extends beyond the Laut Tawar sub-watershed. Through the use of Landsat 9 data in complex, multi-use landscapes, this study is relevant to the broader thermal remote sensing research [17]. Furthermore, the methodological framework constructed here could be used in other places facing similar difficulties, which introduces possibilities for future studies that could integrate additional variables such as urban meteorological measurements and/or finer-scale LULC classifications [26]. Meanwhile, as research offers a holistic evaluation of both the spatial and temporal dimensions of LST, it can be used to better gauge the effects of climate change, LULC, and ecosystem resilience on a global scale [27]. Thus, it contributes to the wider conversation regarding sustainable development and climate change adaptation, which further highlights the importance of remote sensing technology in present-day environmental monitoring [28].
To summarize, in the present study, our aim is to determine and discuss the land surface temperature patterns in the ecologically and socioeconomically important Laut Tawar sub-watershed using data from the newly launched Landsat 9. Through a comprehensive analysis involving multi-spectral thermal imagery and advanced geospatial techniques, this research not only contributes to the scientific understanding of LST dynamics but also has policy implications concerning the implementation of effective measures to address the environmental consequences of rapid LULC change. With the ongoing climate variability continuing to challenge traditional planning paradigms, studies of this kind are necessary for building resilient and sustainable communities in the face of climate change [29].
2. Materials and Methods
2.1. Research Location
The Laut Tawar sub-watershed, located in the highlands of Central Aceh, Indonesia, is a part of the Gayo Highlands. It is located at a geographical point of 4°36′43″ N, 96°55′25″ E, and this sub-watershed covers a patchwork of landform types and ecosystems with an area of around 5670 hectares, based on delineation from Landsat 9 imagery and topographic analysis. At its center is Lake Laut Tawar, a tectonic freshwater lake that forms the focal point of the region’s hydrology. The 17 km long and 3.2 km wide lake has a maximum depth of 80 m and an average depth of 35 to 51 m (at different distances from shore). Situated at ±1200 m.a.s.l., with a rugged topography in the watershed, the hills and mountainous landscapes play major roles in regulating LST distribution, vegetation distribution patterns, and urban growth dynamics. The sub-watershed of Laut Tawar is situated in Central Aceh, Aceh, Indonesia, as shown in Figure 1. This ecosystem is composed of lake waters, forests, agricultural lands, and ever-increasing human settlements. Laut Tawar Lake is the main water supply for the local population, and it is used for various economic purposes alongside its function as a habitat for native fish species and aquatic plants.

Figure 1.
The Laut Tawar sub-watershed in Central Aceh.
Laut Tawar sub-watershed is located at about 1200 m above sea level, with a hills-and-valleys topography that affect the flow of water and the LST pattern. The region has a tropical highland climate with heavy precipitation, which is one of the key factors that affect soil temperature and moisture. Moreover, LULC in the sub-watershed includes protected forests, designated for conservation; coffee plantations, providing the bulk of the economic activity in the area; rice fields, which support local food security; and residential areas, which increase in tandem with socioeconomic development.
The Laut Tawar sub-watershed is characterized by the relationship between the natural environment and human activities, hence its characteristic ecosystem. The ecosystem equilibrium and surface temperature pattern may be influenced by land cover variation driven by urban expansion and agricultural intensification. As a result, continuous surveillance of LULC change in this area is vital to maintaining ecological balance and sustainable development. Studies on LST changes in this region will thus be able to offer essential information pertaining to LULC and potential responses to environmental change.
The Laut Tawar sub-watershed natural and environmental features have a significant impact on LST distribution in entire areas. The district is in an elevated region with an altitude of around 1200 M above mean sea level, and the climate is cooler compared with the low-land regions. However, within the sub-watershed, there are local contrasts in heat produced by differences in land cover, weather, and human practices.
2.2. Source of Data
The main data source in this study is satellite imagery acquired by the Landsat 9 satellite. Landsat 9 data for the year 2024 are examined here for the purpose of showing LST changes. The period specified is intentionally adopted as a reference frame to analyze the changes in the present environmental conditions of the Laut Tawar sub-watershed. The satellite data can be freely accessed and downloaded from official repositories such as USGS Earth Explorer and NASA Landsat Science for environmental monitoring or scientific use. The imagery description is presented in Table 1.

Table 1.
Landsat satellite imagery description.
2.2.1. Data Characteristics
Landsat 9 is the most recent satellite in the Landsat program, and it lifted off on 27 September 2021, as part of a joint mission between NASA and the U.S. Geological Survey (USGS). The satellite is a follow-on to Landsat 8, offering higher-resolution remote sensing for a variety of environmental applications, including LULC research and climate studies.
Landsat 9 acquires data at a 30 m spatial resolution for multi-spectral bands and a 100 m spatial resolution for thermal infrared bands to support detailed Earth surface mapping. The device mixes 11 bands, including visible, near-infrared, shortwave infrared, and thermal infrared, enabling functional land cover classification and the analysis of temperature variance.
Landsat 9 carries two major instruments:
- Operational Land Imager 2 (OLI-2)—This captures images in the visible, near-infrared, and shortwave infrared ranges and is used for vegetation studies, water quality tests, and land monitoring.
- Thermal Infrared Sensor 2 (TIRS-2)—This receives thermal emissions data, which are used to report the LST, heat anomalies, and-+ urban heat island effects.
Landsat 9 has a 16-day revisit cycle, which means the same geolocation has a measurement every 16 days. This uniformity enables environmental change to be monitored over time, as well as long-term climatic adaptation studies. Landsat 9 has a higher (radiometric) resolution, meaning that it can differentiate between 16,000 shades of color for each pixel and better identify subtle variations in the land and temperature compared with earlier satellites. This characteristic is useful in studying thermal patterns in varied landscapes, such as that of the Laut Tawar sub-watershed. Using Landsat 9 measurements, researchers can obtain high-resolution land surface information, which can be a useful tool for land planning, resource management, and climate adaptation applications.
2.2.2. Data Processing and Analysis
The downloaded satellite images are preprocessed through radiometric calibration, atmospheric correction, and cloud masking to enhance data quality and minimize distortion. Only scenes with little cloud cover above the research region were chosen to ensure spatial precision. Further analysis was performed in ArcGIS 10.8, including supervised classification (for type of land cover) into built-up areas, dense forest cover, moderate forest cover, sparse forest cover, grassland, plantation, rice field, and water bodies. These classes provide a spatial context to the relationship between land cover changes and surface temperature. The LST was calculated based on the thermal bands using a split-window algorithm once the digital number values were converted to radiance and transformed into temperature units (Kelvin), which were then converted from Kelvin to °C. Linear regression analysis was used to test the relationship between LST as the dependent variable and two independent variables: LULC and elevation. This statistical method facilitates the estimation of the extent to which each independent variable influences thermal heterogeneity throughout the watershed.
2.3. LST Retrieval
Concerning the algorithm employed during LST estimation using TIRS bands 10 and 11 and OLI sensor bands 4 and 5, the process for estimating land surface temperature followed six steps in ArcGIS [2,30].
First step: Conversion to TOA radiance. Thermal infrared remote sensor (TIRS) data was converted to spectral radiance (Lλ) using the radiance rescaling factors provided in the metadata file using the following formula:
where Lλ is the TOA spectral radiance (Watts/(m2 * srad * μm)); ML is the band-specific multiplicative rescaling factor from the metadata (RADIANCE_MULT_BAND_x, where x is the band number); AL is the band-specific additive rescaling factor from the metadata (RADIANCE_ADD_BAND_x, where x is the band number); and Qcal is the quantized and calibrated standard product pixel values (DN)
Lλ = MLQcal + AL
Second step: Conversion to at-satellite brightness temperature. The top-of-atmospheric spectral radiance (Lλ) data was converted to brightness temperature (TB) using the thermal constants (K1 and K2) provided in the metadata file.
where TB is the at-satellite brightness temperature (K); Lλ is the TOA spectral radiance (Watts/(m2 * srad * μm)); K1 = band-specific thermal conversion constant from the metadata (K1_CONSTANT_BAND_x, where x is the thermal band number); and K2 is the band-specific thermal conversion constant from the metadata (K2_CONSTANT_BAND_x, where x is the thermal band number).
TB= K2/(Ln (K1/Lλ + 1))
Third step: Calculation of the NDVI value. The Normalized Difference Vegetation Index (NDVI) was estimated using the OLI sensor optical band after the layer stacking of bands 4 and 5 using the algorithm shown in Equation (3) (range: −1 < NDVI < +1).
where NIR (near-infrared) refers to band 5, representing reflectance in the near-infrared wavelength; and RED corresponds to Band 4.
NDVI = (NIR − RED)/(NIR + RED)
Fourth step: Calculation of Pv. Pv, representing the proportion of vegetation, was estimated using the NDVI threshold method via the following equation:
where NDVI represents the NDVI value at a specific location. NDVI_min is the minimum NDVI value, typically indicating bare soil or non-vegetated areas, while NDVI_max represents areas with dense vegetation.
Pv = ((NVDI − NVDImin)/(NVDImax − NVDImin))2
Fifth step: Calculation of emissivity value. To obtain LST, the brightness temperature must be adjusted using a scale that incorporates the surface material emissivity (ε) [2] using the following equation:
where m = (εv − εs) − (1 − εs) Fεv and n = εs + (1 − εs) Fεv, where εs and εv are the soil emissivity and vegetation emissivity, respectively. This study used a value of n and m of 0.004 and 0.986, respectively [31].
∈ = m Pv + n
Sixth Step: Estimation of LST. The calculation of LST is performed using the corrected image emissivity, as described in Equation (6):
where TB is the at-sensor brightness temperature effective in degrees Kelvin; TB represents the satellite brightness temperature in Kelvin, obtained from satellite imagery data; λ is the central wavelength of the satellite sensor (for Landsat, the thermal infrared wavelength value is used); ρ is the thermal radiation constant (h.c/σ), where h is Planck’s constant; c is the speed of light; and σ = Boltzmann constant. After this calculation, the LST values are converted from degrees Kelvin to degrees Celsius (°C).
LST = TB/(1 + (λx TB/(ρ)) ln(ε))
2.4. The LULC Classification Process
The maximum likelihood classification supervised method was adopted in ArcGIS 10.8 to generate eight LULC classifications as follows: built-up area, dense forest, common forest, sparse forest, grassland, plantation field, rice paddy, and water body. These classes are selected on the basis of their ecological value, spectral reparability in Landsat 9 imagery, and dominance within the landscape of the Laut Tawar sub-watershed. We applied supervised maximum likelihood classification to derive LULC maps, a widely used and reliable method for Landsat imagery The classification describes both the natural and anthropogenic land covers that have been found to impact the dynamics of land surface temperature (LST), such as thermal buffering via dense forest and water bodies, or heat islanding via urban areas and intensively cultivated lands. By differentiating dense, moderate, and sparse forest classes, this analysis also identifies transition zones that are at considerable risk of being converted soon and crucial for ensuring ecological connectivity.
2.5. Kappa Accuracy Measurements
Re-estimation of the extant LULC categories is necessary to achieve an optimal classification for LULC. Recalculation attempts to reassess the precision of a land class obtained in a real-world scenario. Recalculation is then performed by returning to 200 training areas to compare the satellite imagery. The accuracy assessment is determined according to following equations [2]:
3. Results
3.1. LST Distribution in the Laut Tawar Sub-Watershed
The LST in the Laut Tawar sub-watershed shows a sharp contrast: vegetated areas and water bodies are relatively cool (9.5–17 °C), while urban areas and intensive agricultural areas are the hottest (25–32 °C). The map in Figure 2 (scale 1:200,000) classifies temperature boundaries to show the spatial distribution of the surface. This characterization emphasizes the thermal differences between LULC, namely, natural cooling (forests, lakes) versus warming drivers due to human activities.
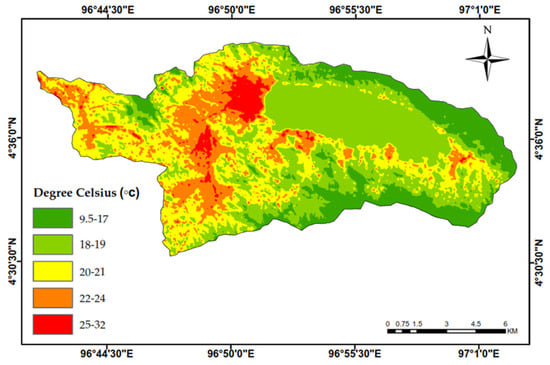
Figure 2.
LST distribution based on Landsat 9 imagery (2024).
Regions displayed in green (9.5–17 °C) delineate locations with relatively constant cooling conditions, probably due to the presence of heavy cooling vegetation or water bodies that behaved as cooling sources. The light green (18–19 °C points) color reveals moderate increases in temperature, as may be occurring in areas where land cover is transforming.
The yellow (20–21 °C) and orange (22–24 °C) regions represent warmer temperature zones, probably affected by anthropic influence (e.g., urbanization or intensive agriculture), leading to a decrease in green cover and shielding potential and an increase in solar radiation absorption. The red (25–32 °C) map units indicate areas with high thermal conditions which may potentially experience Urban Heat Island (UHI) effects, especially in the fast-growing residential centers.
From the LST map, it is clear that LULC, nature, and human activities work together in maintaining variations in surface temperature throughout the Laut Tawar sub-watershed.
In addition to the exploitation of the visual appearance of Figure 2, understanding of LST’s spatial pattern for certain classes can be enhanced by considering the thermal zones in which the temperature ranges belong. Table 2 summarizes these categories, showing that highland forests and water bodies remain cooler (9.5–17 °C), transitional vegetated slopes demonstrate intermediate temperatures (18–21 °C), and heavily cultivated or urbanized areas are warmer (22–32 °C). This list allows for a more systematic insight into the thermal gradients that exist throughout the entire watershed and their potential ecological or anthropogenic causes.
Table 2.
Land surface temperature (LST) distribution based on LULC category.
3.2. Spatial Patterns of Land Surface Temperature and the Factors That Influence Them
Varying land cover from densely planted surfaces to urban development plays a key role in temperature response because of changes in albedo, evapotranspiration, and shading. Taken together, these factors establish a highly complicated thermal mosaic that stems from a combination of natural landscape factors and human input [32].
3.2.1. Topography
Figure 3 shows the topographic map of the Laut Tawar sub-watershed, in which variation in elevation, slope aspect, and landform are the primary factors affecting the LST distribution in the study area. Topographic features also strongly influence the spatial distribution of LST in the Laut Tawar sub-watershed. The map makes it clear that the dark-green-shaded areas (apparently cooler, from 9.5 to 17 °C) are generally places on flatter land mass (valley), areas shadowed by dense forests, or areas near bodies of water, where natural cooling occurs. These pits offer shade and humidity and exhibit lower surface temperatures, even when the temperature is higher in the direct surroundings.

Figure 3.
Map of LST distribution with topography in the Laut Tawar sub-watershed.
On the other hand, the light green (18–19 °C)-, yellow (20–21 °C)-, orange (22–24 °C)-, and red (25–32 °C)-colored regions reflect less shaded and highly elevated zones, namely, peaks and steep slopes. Such positions are subject to increased solar radiation simply due to their limited obstructions/sources of shade and more open exposure, resulting in higher ground temperature records.
It is this acute spatial relationship between topography and temperature variation that plays a key role in driving LST dynamics in the region. Drawing on these observations, the temperature ranges within the sub-watershed are detailed in the table below, connecting each colored zone to a unique and targeted topographic and land cover context (see Table 3).
Table 3.
Elevation and LST range.
Temperatures near the surface are higher in regions with lower terrain elevations, i.e., 900–1200 m.a.s.l., in the 20–21 °C to 22–24 °C temperature ranges. This state results from the high degree of solar radiation and lower vegetation cover found in lowland areas. It is also the elevation range where temperatures fall to 18–19 °C or 20–21 °C, as they may gradually become affected by the more nature-dominated landscape, with denser vegetation and water bodies increasingly contributing to reducing the ground temperature (e.g., through evapotranspiration).
In localities with higher altitudes (1600–2000 m above sea level), temperatures are lower and vary from 9.5–17 to 18–19 °C—conditions typical of high-altitude valleys that have dense trees and numerous water features, which are a natural cooling factor. However, at altitudes of 2100–2400 m, a surface temperature between 9.5 and 17 °C tends to function as a stable microclimate, with minimal dramatic fluctuations. This may be due to the presence of factors such as high humidity and long-lasting vegetation cover, which prevent natural cooling from occurring quickly. The data shown in Table 1 offer compelling evidence for the influence of elevation on surface temperature distribution and highlight the role of topography as a determinant of the temperature patterns in this domain.
The findings reveal that elevation is highly influential on the LST in the Laut Tawar sub-watershed, where lower areas (900–1200 m.a.s.l.) have higher temperatures (20–24 °C) and higher elevations (1600–2400 m.a.s.l.) have lower temperatures (9.5–17 °C), following the environmental lapse rate. However, spatial heterogeneity is not limited to elevation gradients because slope orientation, gradient, and interaction between land cover also are very important in shaping local microclimates.
3.2.2. LULC Classification
This visual framework is necessary for visualizing the complicated symbiotic relationship between LULC in the Laut Tawar sub-watershed and serves as a precursor to the examination of how different landscape elements contribute to thermal responses at a local level (see Figure 4).
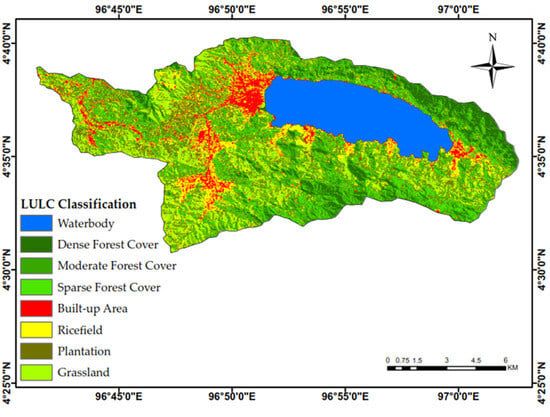
Figure 4.
LULC in the Laut Tawar sub-watershed.
This map provides a LULC classification that includes multiple categories such as primary forests and vegetation, agriculture land, settlements or urban areas, and water. Certain areas containing forests and thickets, usually in upland and valley landscapes, function as natural coolants via such physical mechanisms as evapotranspiration and the retention of moisture. This situation explains the fairly low temperature range and is supported by the behavior of the LST with respect to topography.
On the other hand, LULC categories include highly intensive agricultural activities and urban areas, which show a marked decline in vegetation coverage. This change leads to more solar radiation absorption and higher surface temperatures. Take urban areas, for example, which tend to experience the heat island effect because surfaces are dominated by materials such as concrete and asphalt, which are not equipped for natural cooling. What is more, the prominent water presence (revealed by LULC map) provides cooling corridors, and water bodies, such as rivers and lakes, can decrease local temperature via hydrodynamics.
In addition to the visual scheme in Figure 2, consideration of the distribution of LULC types further helps us to understand spatial variation in the LST. As illustrated in Table 4, some examples are over-represented regarding ground surface heating due to impervious cover density and low canopy cover percentages. The effect of temperature varies for plantations and rice fields, for example, with canopy cover and moisture saturation being the determining factors.
Table 4.
LULC category distribution in the study area.
This pattern emphasizes the intertwined influence of natural and anthropogenic LULC on the thermal mosaic of the watershed. Vegetated and aquatic areas stabilize microclimates, whereas urban sprawl and agricultural intensification create local hotspots.
Table 4 and Figure 5 confirm that areas with a high proportion of water bodies and forests (≈55% of the watershed) correspond to relatively low LST values, likely due to greater heat storage capacity and evaporative cooling. Conversely, developed land (≈10% of the area) exhibits disproportionately higher surface temperatures because impervious materials (concrete, asphalt) have high heat storage and low albedo, promoting local warming. These empirical patterns are consistent with regional studies that show topography and land cover to jointly control temperature gradients in upland valleys.

Figure 5.
Graph of percentage distribution of LULC in the study area.
Table 4 reveals that in the Laut Tawar sub-watershed, land cover distribution is dominated by water bodies (39.5%), mainly accounted for by the large surface area of Lake Laut Tawar, and dense forest (15.2%). These two groups are natural air-cooling systems with high evapotranspiration potential and heat storage ability. The significant contributions of the water surfaces and dense vegetation are also responsible for the relatively low land temperatures (9.5 to 17 °C) in most parts of the region, as shown in the LST map. The abundance of these natural land cover types is vital to maintaining thermal equilibrium across the lake and highland environments.
Particularly, Lake Laut Tawar is as a major actor in regulating regional temperature by absorbing solar radiation at daytime, and, later, the heat stored in the lake is released slowly at night, thus decreasing the diurnal temperature range [33]. It is a large-surface water absorber and can contribute to the moistening of air and thereby cooling through evaporation; this effect decreases the localized climatic changes [34]. This moderating influence is enhanced by the forested hillsides adjacent to those holding the shelterbelt, forming a combined thermal shield that protects a large portion of the watershed from excessive heat gain [35].
In contrast, the human-related land cover classes (e.g., urban settlements [10.0%], grasslands [10.6%], plantation [5.8%], and rice fields [4.7%]) have a considerable effect on surface warming areas. Minutely built-up areas and naked soil are characterized by higher LST levels (22–32 °C), which are attributed to high percentages of impervious surfaces and a lack of vegetation coverage. Their ability to cool is also limited in grasslands and sparse forests (6.1%), acting as transitions between cooler and warmer sites. These results highlight that the transformation of vegetated areas to human settlements and intensive agriculture have a direct effect on local warming.
The results show that vegetated land cover types like rice fields produce weaker surface cooling lines than forests and water bodies. Their LST (22–32 °C) is also higher than that of the surrounding areas because of seasonal planting and harvesting cycles that result in bare soil/shallow water surfaces and hence less efficient evapotranspiration. Huang et al. (2024) have reported such findings as well; they found that paddy rice fields were characterized by high thermal variability and low long-term cooling potential [36].
On the other hand, thick forests and water areas display continuously lower LST values (9.5–17 °C). Forests control microclimates through stable evapotranspiration, canopy shadowing, and moisture-holding soil in such a way as to provide permanent thermal buffers [37]. Likewise, lakes such as Lake Laut Tawar serve as massive heat capacitors that sequester solar energy during the day and then releases it in a regulated manner at night to stabilize local climate [38]. The concurrent presence of forest and water cover hence creates a synergistic cooling effect, with a greater resistance to climate variation in watersheds [39].
The spatial distribution displays a bimodal pattern in thermal-regulating effects, with water bodies and woodlands serving as thermal buffers, and settlement growth and intensive agriculture enhancing heat island effects. This trend is supported by regression analysis: elevation controls LST variation in the landscape, but locally, land cover composition is a critical determinant.
The illustrations of the predominance of water surfaces and dense forest areas as cooling areas over smaller but still thermally significant areas of built-up and agricultural land are shown in Figure 5.
Figure 5 shows the composition of LULC in the Laut Tawar sub-watershed, with water body (39.5%) and dense forest (15.2%) being the dominant natural cooling zones. These covers regulate the microclimate via evapotranspiration and shading and also maintain biodiversity and water resource functions. Their existence is an indicator of a robust ecological infrastructure, which is key to climate resilience in the long-term.
Conversely, human activity land covers, including settlements (10.0%), drinking grasses (10.6%), plantations (5.8%), and rice fields (4.7%), are relatively small regarding cover ratios compared with the total area, but these land covers exert disproportionate thermal influences on the environment. Impervious surfaces and decreased vegetation coverage have led to positive relationships between urbanized areas—however small those may be—and LST. Grassland and sparse forests (6.1%) also cut across zones more susceptible to the conversion of the land and localized heating. The image further emphasizes that small changes in these categories can have a large impact on the thermal balance of the watershed and reflects the sensitivity of the system to LULC change.
The percentage allocation shown in Figure 5 is of critical concern for sustainable LULC. Low shares of medium and sparse forest suggest a potential ecological threshold, beyond which more conversion may compromise the cooling capacity in the watershed. On the other hand, the high percentage of water bodies and dense forest areas provides a potential advantage in planning for conservation-based green infrastructure and nature-based solutions to counteract urban heat island effects. From a sustainability point of view, conserving these natural covers and assimilating green infrastructure into growing settlements is critical for reconciling developed urban areas with the requirement to adapt to climate change and support ecosystem functions.
3.2.3. Regression Analysis of Elevation and LULC Influence on LST
The spatial variation in the LST in the Laut Tawar sub-watershed based on Landsat 9 images (2024) shows a diverse thermal environment influenced by natural and human factors. As seen in Figure 2, there are at least four areas with a different range of temperatures, from cooler areas (9.5–17 °C), which are dominated by dense vegetation and water bodies, to the warmer areas (25–32 °C), which are closer to urban settlements and intensively cultivated land. Patterns of elevation gradients and LULC composition have significant impacts on these patterns.
Two linear regression models were used to estimate these effects. The first regression model was LST regressed on elevation (Figure 6) and negative fit (R2 = 0.94). For highland data the negative regression coefficient (−138.4) indicates that mean surface temperature decreases by approximately 1.38 °C for every 100 m increase in elevation. Furthermore, supporting the major cooling effect of highland ecologies and topography is one of main factors determining the thermal pattern at the whole-drainage-basin scale. Its two-sub-branch cluster defined the correlation between LULC and LST as very weak (R = 0.23), accounting for just 5% of variation (Figure 7). Although the statistical significance is minimal, the differences in LST dynamics across LULC types are as follows: built-up areas had higher average temperature (28.1 °C) than grasslands and sparse forests at 25.6 and 25.2 °C, respectively; and dense forest and water bodies maintained lower temperatures (21.7 and 22.1 °C, respectively), which were significantly different from those of the other four LULC types.
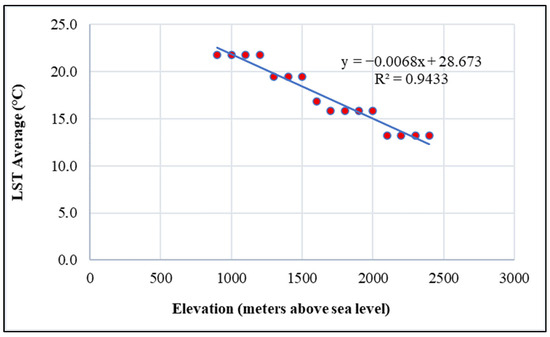
Figure 6.
Scatter plot of elevation’s impact on LST.
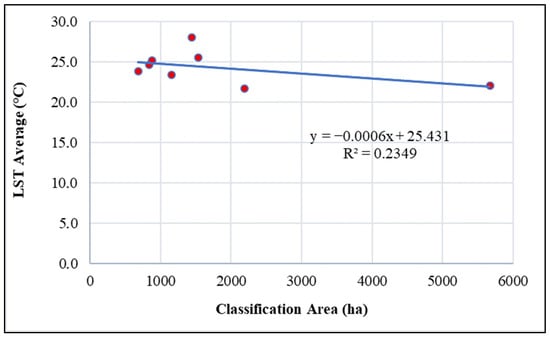
Figure 7.
Scatter plot of LULC classification’s impact on LST.
These results demonstrate that LULC alone accounts for a relatively small fraction of the regional LST variation compared with elevation but highlight that natural terrestrial vegetation and aquatic networks repeatedly function as long-term thermal moderators, while expansive urbanization and agriculture are consistently associated with surface ensembles producing large-scale surface warming.
3.2.4. Accuracy Assessment
An assessment of the accuracy of the supervised classifications was made by comparing them with an independent set of validation samples. A confusion matrix was created through the comparison of the classified LULC map with reference data from high-resolution satellite imagery and a field survey. The overall accuracy and Kappa coefficient are computed below using the confusion matrix (Table 5).
Table 5.
Confusion matrix of LULC accuracy assessment.
4. Discussion
4.1. LST Distribution Patterns
In areas with low LST values (9.5–17 °C), the significance of vegetation and water naturally dominates the cooling effect [40]. Vegetation and water bodies, with their high heat capacity, enable the gradual dissipation of heat, resulting in microclimatically cool environments and favorable conditions for ecosystems. The presence of the phenomenon has been well-documented in the international literature, with green cover stabilizing the surface temperature [3].
However, human impacts are noted in the higher temperature (25–32 °C) regimes. Urbanization, typically associated with the use of building materials (e.g., concrete and asphalt), and agricultural intensification typically lead to a decrease in vegetation cover and higher heat-retention. This results in the creation of UHIs, in which higher surface temperatures dysregulate the local microclimate equilibrium and extend their impact on environmental quality and public health [41]. The study by Kowe et al. (2022) assessed the spatial arrangement of built-up areas and found that land transformation had a considerable impact on LST, diminishing natural cooling mechanisms and increasing heat radiation [42].
In addition, the observed temperature gaps, such as 18–19, 20–21, and 22–24 °C, reflect the spatial pattern of transitions in LULC. Such transitions mirror those of periurban areas, where there is a blending of natural and built environments and the potential to adapt over time in a sustainable manner [43]. This emphasizes the significance of urban planning solutions that integrate green solutions to reduce thermal effects, which have been the focus of the ongoing Urban Microclimates study, indicating the impact of LST on NDVI [3].
The spatial distribution of LST in the Laut Tawar sub-watershed not only reflects the thermal environment of this region but also reflects the influence of natural and human factors. Cold spots highlight the importance of vegetation and water bodies as natural cooling factors in the local environment, while hot spots reflect the influences of urbanization and agricultural intensification, leading to higher surface temperatures [44].
4.2. Topography and LST Variations
A topographical map highlighting the distribution of LST is shown in Figure 3, which profiles the temperature changes in tandem with the different elevations in the study area, indicating a significant temperature decrease with increasing altitude, which can be attributed to what the environmental lapse rate principle illustrates, namely, that the air temperature decreases with increasing height above sea level [45,46].
It can be observed from Figure 3 that elevation differences do not fully determine the distribution of LST; it is also affected by a series of topographic factors, such as the direction of the slope, the gradient, and the distribution of some natural elements (e.g., vegetation and water body). Low-altitude areas are mostly open areas with direct solar radiation exposure and are therefore warmer than high-altitude areas on LST maps [27]. On the other hand, more elevated zones are mainly covered with dense vegetation and water masses that function as cooling agents due to evapotranspiration and heat storage, leading to lower surface temperatures. This is in agreement with the results of the study carried out by Navarro-Serrano et al. (2020), which emphasized that shading and local air circulation can counteract temperature increments at steep slopes in complex topographical settings [47].
The addition of data derived from Figure 3 and Table 3 is crucial to an understanding of the microclimatic tendencies associated with altitude differences. The warm thermal environments of the flat terrain might enhance UHI effects, even if associated with heavy anthropogenic load; on the other hand, the colder environment of the higher terrain, in response to altitude ascent, serve as a natural response to increasing elevation [27]. A study by McGuire et al. (2012) in the Rocky Mountain front range illustrates that cooling trends with increasing elevation have tangible implications for climate adaptation planning, including precipitation that can be used for water management and microclimate-informed spatial planning [46].
Figure 3 and Table 3 not only confirm the decrease in LST as elevation increases but also provide evidence that a multi-dimensional view is needed for modeling the dynamics of the land surface temperature. Combining remote sensing with topographic data also makes it possible to produce more accurate predictive models, predicting the temperature distribution in heterogeneous topographic areas [48]. This approach has become common in recent studies, which have used elevation adjustments to regional temperature trends to show that dynamic lapse rate models improve climate risk estimates for adaptation and planning efforts [45,49,50].
Solar radiation is an important determinant of slope aspect; south-facing slopes in this tropical highland area tend to be warmer because of greater insolation, whereas north-facing slopes are cooler. Bindajam et al. (2020) reported an interaction effect of slope orientation and vegetation on LST variability in semi-arid mountain cities, with shaded slopes and vegetated surfaces always showing lower surface temperatures [51]. Similarly, Navarro-Serrano et al. (2020) also concluded that the joint use of topography and vegetation indices are useful in obtaining more accurate LST estimations, emphasizing that slope and aspect may present a challenge in heterogeneous landscapes [47]. Slope gradient not only affects LST through the regulation of runoff through soil water holding capacity and vegetation coverage; the cooler microclimate on steep slopes is also significant. Steeper vineyards have the advantage of better air flow and less heat retention. Navarro-Serrano et al. (2020) highlighted that the steep slopes in the Mediterranean mountains also counteract warming via shading and local air flow, decreasing the extent of heat accumulation compared with flat land [47].
Furthermore, topography modulates microclimates through its interactions with LULC. In the sub-watershed of Laut Tawar, the upper reaches are covered with dense forests and bodies of water that function as permanent thermal buffers through evapotranspiration effects and canopy shading, as well as with absorbing heat. On the other hand, low-lying valleys and flat terrain are more sensitive to direct solar radiation and anthropogenic (i.e., urban and agricultural) LULC, which could enhance warming. McGuire et al. (2012) described a similar pattern in the Rocky Mountain front range, where cooling trends, driven by elevation, had potential consequences for water management and adaptation planning [46].
4.3. LULC and LST Distribution
Comparing the spatial distributions, as illustrated by the LULC maps in Figure 4, Table 4, and Figure 5, reveals a spatial variability across the study area. Water is prominent, followed by dense forests and open land features, namely, grasslands and built-up areas. Physiographically, lowland and valley locations are favorable for water bodies and dense vegetation, while flat terrains and low-slope areas are generally urbanized or developed as agriculture land [52]. These environments suggest that the topography directly controls the LULC types, and these LULC types, in turn, affect the distribution of LST through the shading effect, evapotranspiration, and heat storage [53].
Physically, topography plays two roles in determining the LST distribution. In the first stage, directly, we have variables such as elevation, slope, and aspect, which determine how the surface will receive the sun radiation. Sun-facing slopes (e.g., south-facing in the northern hemisphere) typically receive greater radiation intensity, leading to higher LST values [54]. Second, the LULC patterns are influenced by topography. Valley floors, where both water flow and dense vegetation are found, can have a cooling effect due to evapotranspiration, while urban and agricultural land, located in flatland, where deforestation is also a common practice, leads to higher heat storage, increasing UHI effects [55].
This paradox (i.e., urban areas occupy only about 10% of the watershed but produce more thermal heat) can be attributed to the thermal properties of impervious surfaces. Media like blacktop, concrete, and roofs have a low albedo, which means that they absorb more energy from the sun during the day and then release it back slowly during the night. Therefore, even single urban area can produce local heat islands that raise the mean LST of its surroundings. Such a mechanism is in line with the long-observed urban heat island (UHI) effect [56]. In addition, the urban form enhances heat storage. In areas of high building density, wind penetration is restricted and longwave radiation is trapped, contributing to additional warming at the surface. Compact urban forms can also raise LST by several degrees compared with neighboring vegetated or water-covered areas, even for relatively small urban footprints [57]. This is why the 10% level of urban cover in the Laut Tawar sub-watershed has an overwhelming thermal effect compared with the cooling effects of vegetations and water sources. Another reason is the absence of evapotranspiration in cities. Urban surfaces, however, are mostly impervious and dry compared with forests or rice fields, through which latent heat flux results in a loss of heat from urban areas. It follows that the thermal contrast between urban and natural land covers increases—especially in the dry season—when vegetation stress on cooling system of vegetation is intensified [58].
The association of LULC and topographic variables can provide important information on LST distribution, which has important implications for spatial planning and climate adaptation action [49,59]. According to this analysis, the areas supporting water bodies and forest ecosystems have lower LST, inducing thermal buffer effects to stabilize the microclimatic environment. Thus, the conservation and enhancement of green cover in these sites need to be promoted through mitigation strategies for UHIs and extreme temperature increases [59,60].
The LULC findings are supported by further LULC analysis based on the LULC classification results: topography directly and indirectly influences the LST distribution in the Laut Tawar sub-watershed. Elevation, slope, and direction contribute to the exchange of solar radiation in LULC changes that affect natural cooling mechanisms and accumulated heat [50,61].
4.4. Comparison with Analogous Upland Watershed and Methodological Advances
The findings of this study verify that elevation is the primarily control factor for LST variation in the highland watersheds. LULC type composition is a secondary but still important regulator. Similar results have also been reported for the Swiss Alps have, where LST trends derived from Landsat exhibited a clear negative correlation with increasing ground elevation, due to the cooling effect of high elevations, but a warming response in valley settlements [62]. Similar trends were also found in the northern Himalayan foothills, where wooded uplands remained cooler but lowland urban areas experienced significant surface heating [63]. These similarities indicate that the Laut Tawar sub-watershed follows a general worldwide trend with respect to the thermal dynamics of mountainous ecosystem.
Alongside topography, LULC changes also play a crucial role in local thermal heterogeneity. In the highlands of Southeast Asia, new evidence suggests that deforestation and the conversion of dense forests into farming lands are closely related to increases in LST, while intact forests and water bodies consistently serve as thermal buffers, reducing surface warming. A study on the central highland of Vietnam that conducted a spatiotemporal analysis determined that LST change was most influenced by forest cover loss (by 89.4% compared with other regions), and LULC transition is significantly changing the thermal status of mountainous tropical regions [64]. Likewise, research in the Ethiopian Highlands has indicated that valley floor agricultural expansion resulted in an increase in some local hotspots despite a regional cooling effect due to elevation. Moreover, in the northeast highlands of Ethiopia, rushed conversion from forestland and grassland to cropland and built-up areas during the period 1984–2021 caused a dramatic decrease in ecosystem service value (less than 50%), as well as an increase in local environment stress, e.g., land surface warming [65]. The findings from Laut Tawar correspond to these observations and demonstrate that urban areas and extensive cultivated land, despite their limited spatial coverage, produce a disproportionately large thermal load regarding their ecological footprint.
Methodologically, the present work contributes to improving the application of remote sensing technology in highland regions by adopting Landsat 9 thermal data, supervised classification, regression modeling, and estimation precision assessment based on the Kappa coefficient. This process guarantees the stringent validation of LULC maps and enhances the credibility of further LST studies. Similar methodological developments have been made in China, where regression-based models combining high-resolution images have decomposed the impacts of LULC, soil moisture, and groundwater on surface temperature [66]. This study highlights the benefits of using a similar integrated approach to show that remote sensing, combined with statistical modeling, is effective in capturing the intricate interaction between natural and human-induced drivers in tropical highland catchments.
From a sustainability viewpoint, the results highlight the necessity of protecting water bodies and large forest area as natural cooling mechanisms, and of introducing green infrastructure in fast-growing urban areas to reduce UHI impacts. The relatively low proportions of medium and sparse forests suggest the existence of a possible ecological threshold, beyond which additional conversion would threaten the watershed’s thermal buffering capacity. These insights are connected to worldwide calls for nature-based solutions in climate adaptation and spatial planning [67].
4.5. Landsat 9 Data in LST Measurement
This advanced Landsat 9 approach to LST estimation is highly relevant for climate research and LULC purposes. With strong sensitivity to temperature change, this data can be used for in-depth research on the urban heat island effect and LULC conversion, and it can also be used to establish ensemble learning-based forecasting models that combine spatial information with meteorological factors, which will reduce reliance on various complex external inputs [68]. Applications also have practical significance, such as in land use planning and climate adaptation policies using real LST for energy-efficient infrastructure and green urban solutions; in environmental monitoring and ecosystem resilience through the provisioning of hotspots [60]; and in scientific advancements using Landsat 9 coupled with numerical models, developing novel algorithms for long-term spatial mapping [69].
4.6. Implications for Spatial Management and Climate Adaptation
The implications for spatial management and climate adaptation in highland watersheds are clear from the results of this study. This study shows that the density of forest cover and water surfaces naturally provide greater cooling effects, whereas urban areas and most forms of intensive farming significantly favor surface heating. From a policy standpoint, this highlights the significance of prioritizing the conservation of high-density forest patches and Lake Laut Tawar and its tributaries as examples of ecophysical infrastructure, moderating temperature and supporting the water system [64].
The results also indicate that the medium and sparse forest classes cover a relatively small percentage of the landscape, which may imply distinct ecological thresholds. These borderline areas could, in fact, diminish the health of the watershed. Thus, spatial planning should aim to avoid further deforestation in such high-risk pools and to preserve biotic connectivity with dense forest patches and water sources [70,71].
Although limited, urban expansion per se was demonstrated to produce a significant thermal difference by changing verdant surfaces with impervious materials. This evidence endorses the inclusion of green infrastructure (e.g., urban parks, riparian buffers, vegetated corridors) in settlement planning as a feasible and empirically grounded approach to reducing locally intensified heat buildup. These suggestion are readily justified on the basis of the LST analysis, and are in agreement with international calls for nature-based solutions to adaptation and spatial planning at a global level [72].
It is important to note that the recommendations made in this study are limited to what has always been performed regarding data processing. Although agroforestry or other LULC systems could, indeed, be viable options, they were not evaluated in this study and are therefore not recommended as a policy intervention. By anchoring its recommendations in real findings, e.g., forest conservation, waterbody protection, and green infrastructure implementation, this analysis offers unique, practical, and context-specific advice to regional planners and policymakers interested in diversifying development while promoting climate resilience within highland ecosystems. This is consistent with calls for the evidence-based integration of nature-based solutions into spatial planning, making wise use of eco-infrastructures such as forests or water bodies and promoting periurban-to-urban green infrastructure may prove helpful in combating local heat build-up while enhancing long-term resilience [73,74].
5. Conclusions
This research emphasizes the spatial variance of LST in the Laut Tawar sub-watershed and the factors affecting its distribution. The patterns across the region indicate that the highest temperatures (25–32 °C) are in urbanized and extensively farmed landscapes, and the lowest temperatures (9.5–17 °C) are found in areas dominated by dense forests and water bodies. These findings reinforce the importance of natural land covers as thermal buffers that locally control microclimates through evapotranspiration, shading, and heat storage.
Both elevation and vegetation were found to be the chief determinants in reducing surface heating, indicating that high altitudes and thick vegetation cover could significantly alleviate the intensity of UHI effects. On the other hand, the transformation of vegetated landscapes into human settlements and the intensification of agriculture increase local warming conditions while reinforcing thermal hotspots.
By integrating LULC, LST, and elevation analysis, this study provides an innovative spatial baseline for a tropical highland watershed. The findings indicate that the expansion of built-up and agricultural areas intensifies surface warming, while forests and water bodies regulate thermal balance across different elevations, further shaping microclimatic diversity. Such information should be helpful in determining the appropriate green infrastructure interventions in urban and farming areas.
Author Contributions
Conceptualization, M.F.; methodology, M.F. and A.A.; software, M.F.; validation, M.F., A.A. and C.D.; formal analysis, M.F. and H.H.; investigation, M.F.; resources, A.A.; data curation, C.D.; writing—original draft preparation, M.F.; writing—review and editing, A.A. and C.D.; visualization, H.H.; supervision, A.A., C.D. and H.H.; project administration, A.A.; funding acquisition, M.F. All authors have read and agreed to the published version of the manuscript.
Funding
This research received no external funding.
Institutional Review Board Statement
Not applicable.
Informed Consent Statement
Not applicable.
Data Availability Statement
The data presented in this study are available on request from the corresponding author.
Acknowledgments
The authors gratefully acknowledge the editors and anonymous reviewers for their constructive comments on this manuscript.
Conflicts of Interest
The authors declare no conflicts of interest.
Abbreviations
The following abbreviations are used in this manuscript:
| LST | Land surface temperature |
| LULC | Land use and land cover |
| TIRS | Thermal Infrared Sensor |
| UHI | Urban heat island |
| m.a.s.l. | Meters above sea level |
References
- Pongratz, J.; Schwingshackl, C.; Bultan, S.; Obermeier, W.; Havermann, F.; Guo, S. Land Use Effects on Climate: Current State, Recent Progress, and Emerging Topics. Curr. Clim. Change Rep. 2021, 7, 99–120. [Google Scholar] [CrossRef]
- Achmad, A.; Fadhly, N.; Deli, A.; Ramli, I. Urban growth and its impact on land surface temperature in an industrial city in Aceh, Indonesia. Lett. Spat. Resour. Sci. 2022, 15, 39–58. [Google Scholar] [CrossRef]
- Kara, Y.; Yavuz, V. Urban Microclimates in a Warming World: Land Surface Temperature (LST) Trends Across Ten Major Cities on Seven Continents. Urban Sci. 2025, 9, 115. [Google Scholar] [CrossRef]
- Zhan, W.; Chen, Y.; Liu, Q.; Li, J.; Sacchi, M.D.; Zhuang, M.; Liu, Q.H. Simultaneous prediction of petrophysical properties and formation layered thickness from acoustic logging data using a modular cascading residual neural network (MCARNN) with physical constraints. J. Appl. Geophys. 2024, 224, 105362. [Google Scholar] [CrossRef]
- Liu, D.; Zhou, M.; Wang, X.; Shi, Z.; Sacchi, M.D.; Chen, W.; Liu, Z.; Wang, X. Enhancing Ground-Penetrating Radar (GPR) Data Resolution Through Weakly Supervised Learning. IEEE Trans. Geosci. Remote Sens. 2024, 62, 5107513. [Google Scholar] [CrossRef]
- Adhar, S.; Barus, T.A.; Nababan, E.S.N.; Wahyuningsih, H. Trophic state index and spatio-temporal analysis of trophic parameters of Laut Tawar Lake, Aceh, Indonesia. AACL Bioflux 2023, 16, 342–355. [Google Scholar]
- Ramli, I.; Murthada, S.; Nasution, Z.; Achmad, A. Hydrograph separation method and baseflow separation using Chapman Method—A case study in Peusangan Watershed. IOP Conf. Ser. Earth Environ. Sci. 2019, 314, 012026. [Google Scholar] [CrossRef]
- Solanky, V.; Singh, S.; Katiyar, S.K. Land Surface Temperature Estimation Using Remote Sensing Data; Springer: Berlin/Heidelberg, Germany, 2018; pp. 343–351. [Google Scholar]
- Putri, D.R.; Ismail, N.; Idroes, R.; Rizal, S.; Nur, S.; Nanda, M. Analysis of Land Surface Temperature (LST) in Bur Ni Geureudong Geothermal Field, Aceh, Indonesia Using Landsat 8 OLI / TIRS Images. Chiang Mai Univ. J. Nat. Sci. 2021, 20, e2021084. [Google Scholar] [CrossRef]
- Farhan, A.; Haryanto, A.D.; Hutabarat, J.; Siahaan, M.R.P. Identifikasi Zona Prospek Panas Bumi Menggunakan Digital Elevation Model Dengan Metode Densitas Kelurusan Dan Temperatur Suhu Permukaan Di Daerah Seulawah, Provinsi Aceh. Padjadjaran Geosci. J. 2021, 5, 80–90. [Google Scholar]
- Ramli, I.; Achmad, A.; Anhar, A. Temporal changes in Land Use and Land Cover (LULC) and local climate in the Krueng Peusangan Watershed (KPW) area, Aceh, Indonesia. Bull. Geogr. Socio-Econ. Ser. 2023, 59, 151–165. [Google Scholar] [CrossRef]
- Halefom, A.; He, Y.; Nemoto, T.; Feng, L.; Li, R.; Raghavan, V.; Jing, G.; Song, X.; Duan, Z. The Impact of Urbanization-Induced Land Use Change on Land Surface Temperature. Remote Sens. 2024, 16, 4502. [Google Scholar] [CrossRef]
- Bonan, G.B. Forests and climate change: Forcings, feedbacks, and the climate benefits of forests. Science 2008, 320, 1444–1449. [Google Scholar] [CrossRef] [PubMed]
- Tang, B.; Bi, Y.; Li, Z.A.; Xia, J. Generalized split-window algorithm for estimate of land surface temperature from Chinese geostationary FengYun meteorological satellite (FY-2C) data. Sensors 2008, 8, 933–951. [Google Scholar] [CrossRef]
- Hardiyanto, D.W.; Setianto, A.; Harijoko, A. Spatial Analysis to Determine the Geothermal Potential Index: The Case Study of Dieng Geothermal Complex. J. Geosains Dan Remote Sens. 2024, 5, 81–90. [Google Scholar] [CrossRef]
- Yasin, A.; Ali, A.; Ahmed, N. Time-series analysis of Leaf Area Index and Land Surface Temperature Association using Sentinel-2 and Landsat OLI data. Environ. Syst. Res. 2024, 6, 43. [Google Scholar] [CrossRef]
- Ye, X.; Liu, R.; Hui, J.; Zhu, J. Land Surface Temperature Estimation from Landsat-9 Thermal Infrared Data Using Ensemble Learning Method Considering the Physical Radiance Transfer Process. Land 2023, 12, 1287. [Google Scholar] [CrossRef]
- Cuce, P.M.; Cuce, E.; Santamouris, M. Towards Sustainable and Climate-Resilient Cities: Mitigating Urban Heat Islands Through Green Infrastructure. Sustainability 2025, 17, 1303. [Google Scholar] [CrossRef]
- Nurlina, N.; Kadir, S.; Kurnain, A.; Ilham, W.; Ridwan, I. Impact of Land Cover Changing on Wetland Surface Temperature Based on Multitemporal Remote Sensing Data. Pol. J. Environ. Stud. 2023, 32, 2281–2291. [Google Scholar] [CrossRef]
- Gupta, R.K. Geospatial and Statistical Analysis of Land Surface Temperature and Land Surface Characteristics of Jaipur and Ahmedabad Cities of India. J. Geosci. Environ. Prot. 2024, 12, 1–19. [Google Scholar] [CrossRef]
- Kocur-Bera, K.; Małek, A. Assessing the Feasibility of Using Remote Sensing Data and Vegetation Indices in the Estimation of Land Subject to Consolidation. Sensors 2024, 24, 7736. [Google Scholar] [CrossRef] [PubMed]
- Achmad, A.; Sari, L.H.; Ramli, I. A study of urban heat island of Banda Aceh City, Indonesia based on land use/cover changes and land surface temperature. Aceh Int. J. Sci. Technol. 2019, 8, 41–51. [Google Scholar] [CrossRef]
- Jagtap, A.A.; Shedge, D.K.; Mane, P.B. Exploring the Effects of Land Use/Land Cover (LULC) Modifications and Land Surface Temperature (LST) in Pune, Maharashtra with Anticipated LULC for 2030. Int. J. Geoinform. 2024, 20, 42–63. [Google Scholar]
- Orlov, A.; De Hertog, S.; Havermann, F.; Guo, S.; Luo, F.; Manola, I.; Thiery, W.; Lejeune, Q.; Pongratz, J.; Humpenöder, F.; et al. Changes in Land Cover and Management Affect Heat Stress and Labor Capacity. Earth’s Futur. 2023, 11, e2022EF002909. [Google Scholar] [CrossRef]
- Gao, Y.; Li, N.; Gao, M.; Hao, M.; Liu, X. Modelling Future Land Surface Temperature: A Comparative Analysis between Parametric and Non-Parametric Methods. Sustainability 2024, 16, 8195. [Google Scholar] [CrossRef]
- Maheng, D.; Pathirana, A.; Bhattacharya, B.; Zevenbergen, C.; Lauwaet, D.; Siswanto, S.; Suwondo, A. Impact of land use land cover changes on urban temperature in Jakarta: Insights from an urban boundary layer climate model. Front. Environ. Sci. 2024, 12, 1399041. [Google Scholar] [CrossRef]
- Achmad, A.; Ramli, I.; Nizamuddin, N. Impact of land use and land cover changes on carbon stock in Aceh Besar District, Aceh, Indonesia. J. Water Land Dev. 2023, 145, 159–166. [Google Scholar] [CrossRef]
- Kustura, K.; Conti, D.; Sammer, M.; Riffler, M. Harnessing Multi-Source Data and Deep Learning for High-Resolution Land Surface Temperature Gap-Filling Supporting Climate Change Adaptation Activities. Remote Sens. 2025, 17, 318. [Google Scholar] [CrossRef]
- Achmad, A.; Ramli, I.; Irwansyah, M. The impacts of land use and cover changes on ecosystem services value in urban highland areas. IOP Conf. Ser. Earth Environ. Sci. 2020, 447, 012047. [Google Scholar] [CrossRef]
- Singh, V. Estimating land surface temperature in ArcGIS using Landsat-8, Hoshangabad district, (Madhya Pradesh). Int. J. Appl. Res. 2017, 3, 1374–1379. [Google Scholar] [CrossRef]
- Sobrino, J.A.; Jiménez-Muñoz, J.C.; Paolini, L. Land surface temperature retrieval from LANDSAT TM 5. Remote Sens. Environ. 2004, 90, 434–440. [Google Scholar] [CrossRef]
- Santos Orozco, D.L.; Ruiz Corral, J.A.; Villavicencio García, R.F.; Rodríguez Moreno, V.M. Deforestation and Its Effect on Surface Albedo and Weather Patterns. Sustainability 2023, 15, 11531. [Google Scholar] [CrossRef]
- Qiu, Y.; Chen, J.; Chen, D.; Thiery, W.; Mercado-Bettín, D.; Xiong, L.; Xia, J.; Woolway, R.I. Enhanced heating effect of lakes under global warming. Nat. Commun. 2025, 16, 3954. [Google Scholar] [CrossRef]
- Wang, L.; Wang, J.; Wang, L.; Zhu, L.; Li, X. Lake Evaporation and Its Effects on Basin Evapotranspiration and Lake Water Storage on the Inner Tibetan Plateau. Water Resour. Res. 2023, 59, e2022WR034030. [Google Scholar] [CrossRef]
- Ellison, D.; Pokorný, J.; Wild, M. Even cooler insights: On the power of forests to (water the Earth and) cool the planet. Glob. Change Biol. 2024, 30, e17195. [Google Scholar] [CrossRef]
- Huang, D.; Xu, L.; Zou, S.; Liu, B.; Li, H.; Pu, L.; Chi, H. Mapping Paddy Rice in Rice–Wetland Coexistence Zone by Integrating Sentinel-1 and Sentinel-2 Data. Agriculture 2024, 14, 345. [Google Scholar] [CrossRef]
- Jamei, Y.; Seyedmahmoudian, M.; Jamei, E.; Horan, B.; Mekhilef, S.; Stojcevski, A. Investigating the Relationship between Land Use/Land Cover Change and Land Surface Temperature Using Google Earth Engine; Case Study: Melbourne, Australia. Sustainability 2022, 14, 14868. [Google Scholar] [CrossRef]
- Cheng, Y.; Liu, X.; Zeng, Z.; Liu, S.; Wang, Z.; Tang, X.; He, B.J. Impacts of Water Bodies on Microclimates and Outdoor Thermal Comfort: Implications for Sustainable Rural Revitalization. Front. Environ. Sci. 2022, 10, 940482. [Google Scholar] [CrossRef]
- Sweeney, B.W.; Newbold, J.D. Streamside forest buffer width needed to protect stream water quality, habitat, and organisms: A literature review. J. Am. Water Resour. Assoc. 2014, 50, 560–584. [Google Scholar] [CrossRef]
- Imran, H.M.; Issa Shammas, M.; Rahman, A.; Jacobs, S.J.; Ng, A.W.M.; Muthukumaran, S. Causes, Modeling and Mitigation of Urban Heat Island: A Review. Earth Sci. 2021, 10, 244. [Google Scholar] [CrossRef]
- Ullah, N.; Siddique, M.A.; Ding, M.; Grigoryan, S.; Khan, I.A.; Kang, Z.; Tsou, S.; Zhang, T.; Hu, Y.; Zhang, Y. The Impact of Urbanization on Urban Heat Island: Predictive Approach Using Google Earth Engine and CA-Markov Modelling (2005–2050) of Tianjin City, China. Int. J. Environ. Res. Public Health 2023, 20, 2642. [Google Scholar] [CrossRef] [PubMed]
- Kowe, P.; Dube, T.; Mushore, T.D.; Ncube, A.; Nyenda, T.; Mutowo, G.; Chinembiri, T.S.; Traore, M.; Kizilirmak, G. Impacts of the spatial configuration of built-up areas and urban vegetation on land surface temperature using spectral and local spatial autocorrelation indices. Remote Sens. Lett. 2022, 13, 1222–1235. [Google Scholar] [CrossRef]
- Komeh, Z.; Hamzeh, S.; Memarian, H.; Attarchi, S.; Alavipanah, S.K. A Remote Sensing Approach to Spatiotemporal Analysis of Land Surface Temperature in Response to Land Use/Land Cover Change via Cloud Base and Machine Learning Methods, Case Study: Sari Metropolis, Iran. Int. J. Environ. Res. 2025, 19, 98. [Google Scholar] [CrossRef]
- Achmad, A.; Ramli, I.; Nizamuddin, N. Monitoring Land Use and Land Cover Changes in Aceh Province-Indonesia for Sustainable Spatial Planning BT—Inclusive and Integrated Disaster Risk Reduction; Opdyke, A., Pascua de Rivera, L., Eds.; Springer Nature: Cham, Switzerland, 2025; pp. 82–94. [Google Scholar]
- Zhao, P.; He, Z.; Ma, D.; Wang, W.; Qian, L. Temperature trends and its elevation-dependent warming over the Qilian Mountains. J. Mt. Sci. 2024, 21, 500–510. [Google Scholar] [CrossRef]
- McGuire, C.R.; Nufio, C.R.; Bowers, M.D.; Guralnick, R.P. Elevation-Dependent Temperature Trends in the Rocky Mountain Front Range: Changes over a 56- and 20-Year Record. PLoS ONE 2012, 7, e44370. [Google Scholar] [CrossRef]
- Navarro-Serrano, F.; López-Moreno, J.I.; Azorin-Molina, C.; Alonso-González, E.; Aznarez-Balta, M.; Buisán, S.T.; Revuelto, J. Elevation effects on air temperature in a topographically complex mountain valley in the Spanish pyrenees. Atmosphere 2020, 11, 656. [Google Scholar] [CrossRef]
- Xu, L.; Du, J.; Ren, J.; Hu, Q.; Qin, F.; Mu, W.; Hu, J. Improving the ERA5-Land Temperature Product through a Deep Spatiotemporal Model That Uses Fused Multi-Source Remote Sensing Data. Remote Sens. 2024, 16, 3510. [Google Scholar] [CrossRef]
- Zhang, Y.; Shen, X.; Fan, G. Elevation-dependent trend in diurnal temperature range in the northeast china during 1961–2015. Atmosphere 2021, 12, 319. [Google Scholar] [CrossRef]
- Achmad, A.; Ramli, I.; Sugiarto, S.; Irzaidi, I.; Izzaty, A. Assessing and Forecasting Carbon Stock Variations in Response to Land Use and Land Cover Changes in Central Aceh, Indonesia. Int. J. Des. Nat. Ecodynamics 2024, 19, 465–475. [Google Scholar] [CrossRef]
- Bindajam, A.A.; Mallick, J.; AlQadhi, S.; Singh, C.K.; Hang, H.T. Impacts of vegetation and topography on land surface temperature variability over the semi-arid mountain cities of Saudi Arabia. Atmosphere 2020, 11, 762. [Google Scholar] [CrossRef]
- Awasthi, M.P. Mapping and analyzing temporal variability of spectral indices in the lowland region of Far Western Nepal. Water Pract. Technol. 2023, 18, 2971–2988. [Google Scholar] [CrossRef]
- Peng, X.; Wu, W.; Zheng, Y.; Sun, J.; Hu, T.; Wang, P. Correlation analysis of land surface temperature and topographic elements in Hangzhou, China. Sci. Rep. 2020, 10, 10451. [Google Scholar] [CrossRef]
- Taripanah, F.; Ranjbar, A. Quantitative analysis of spatial distribution of land surface temperature (LST) in relation Ecohydrological, terrain and socio- economic factors based on Landsat data in mountainous area. Adv. Sp. Res. 2021, 68, 3622–3640. [Google Scholar] [CrossRef]
- Nitis, T.; Klaic, Z.B.; Moussiopoulos, N. Effects of topography on urban heat island. In Proceedings of the 10th Conference on Harmonisation Within Atmospheric Dispersion Modelling for Regulatory Purposes, Crete, Greece, 17–20 October 2005; Volume 1, pp. 473–477. [Google Scholar]
- Andrés-Anaya, P.; Sánchez-Aparicio, M.; del Pozo, S.; Lagüela, S. Correlation of Land Surface Temperature with IR Albedo for the Analysis of Urban Heat Island †. Eng. Proc. 2021, 8, 9. [Google Scholar]
- Xu, F.; Shen, Y.; Zheng, M.; Zhang, X.; Zuo, Y.; Wang, X.; Zhang, M. Characterizing the Thermal Effects of Urban Morphology Through Unsupervised Clustering and Explainable AI. Remote Sens. 2025, 17, 3211. [Google Scholar] [CrossRef]
- Singh, S.; Kushwaha, S.K.P.; Jain, K. a Correlation Analysis of Land Surface Temperature and Evapotranspiration in an Urban Setting. Int. Arch. Photogramm. Remote Sens. Spat. Inf. Sci.-ISPRS Arch. 2023, 48, 1569–1574. [Google Scholar] [CrossRef]
- Liu, H.; Zhou, Z.; Wen, Q.; Chen, J.; Kojima, S. Spatiotemporal Land Use/Land Cover Changes and Impact on Urban Thermal Environments: Analyzing Cool Island Intensity Variations. Sustainability 2024, 16, 3205. [Google Scholar] [CrossRef]
- Achmad, A.; Ramli, I.; Nizamuddin, N.; Gunawan, A.; Fakhrana, S.Z.; Zhong, X. The impact of land use and land cover changes on ecosystem service value in Aceh Besar Regency, Aceh, Indonesia. Land 2024, 13, 69–76. [Google Scholar] [CrossRef]
- Basnet, P.; Grieger, S.; Putzenlechner, B.; Seidel, D. Forests with high structural complexity contribute more to land surface cooling: Empirical support for management for complexity. J. For. Res. 2025, 36, 59. [Google Scholar] [CrossRef]
- Gök, D.T.; Scherler, D.; Wulf, H. Land surface temperature trends derived from Landsat imagery in the Swiss Alps. Cryosphere 2024, 18, 5259–5276. [Google Scholar] [CrossRef]
- Debnath, M.; Poddar, I.; Saha, A.; Islam, N.; Roy, R. Analysis of land surface temperature and its correlation with urban, water, vegetation, and surface indices in the Siliguri Urban Agglomeration area of the Himalayan foothill region. Geomat. Nat. Hazards Risk 2025, 16, 2470393. [Google Scholar] [CrossRef]
- Tran, D.X.; Tran, T.V.; Pearson, D.; Myint, S.W.; Lowry, J.; Nguyen, T.T. Spatiotemporal analysis of forest cover change and associated environmental challenges: A case study in the Central Highlands of Vietnam. Geocarto Int. 2022, 37, 9277–9297. [Google Scholar] [CrossRef]
- Muche, M.; Yemata, G.; Molla, E.; Adnew, W.; Muasya, A.M. Land use and land cover changes and their impact on ecosystem service values in the north-eastern highlands of Ethiopia. PLoS ONE 2023, 18, e0289962. [Google Scholar] [CrossRef]
- Wei, Y.; Wang, D.; Luo, F.; Tian, X.; Bi, X.; Zhou, Z.; Hu, W. High-Temporal-Resolution Modeling of Land Surface Temperature and Groundwater Level Impacts on Shallow Aquifer Thermal Regimes. Water 2025, 17, 1107. [Google Scholar] [CrossRef]
- Zarei, M.; Shahab, S. Nature-Based Solutions in Urban Green Infrastructure: A Systematic Review of Success Factors and Implementation Challenges. Land 2025, 14, 818. [Google Scholar] [CrossRef]
- Cetin, M.; Ozenen Kavlak, M.; Senyel Kurkcuoglu, M.A.; Bilge Ozturk, G.; Cabuk, S.N.; Cabuk, A. Determination of land surface temperature and urban heat island effects with remote sensing capabilities: The case of Kayseri, Türkiye. Nat. Hazards 2024, 120, 5509–5536. [Google Scholar] [CrossRef]
- Parvar, Z.; Salmanmahiny, A. PyLST: A remote sensing application for retrieving land surface temperature (LST) from Landsat data. Environ. Earth Sci. 2024, 83, 373. [Google Scholar] [CrossRef]
- Haddad, N.M.; Brudvig, L.A.; Clobert, J.; Davies, K.F.; Gonzalez, A.; Holt, R.D.; Lovejoy, T.E.; Sexton, J.O.; Austin, M.P.; Collins, C.D.; et al. Habitat fragmentation and its lasting impact on Earth’s ecosystems. Sci. Adv. 2015, 1, e1500052. [Google Scholar] [CrossRef] [PubMed]
- Andronache, I. Analysis of Forest Fragmentation and Connectivity Using Fractal Dimension and Succolarity. Land 2024, 13, 138. [Google Scholar] [CrossRef]
- Muhoza, J.P.; Zhou, W. Urban Land Expansion and Spatiotemporal Dynamics of Urban Green Spaces in Africa. Sustainability 2025, 17, 2880. [Google Scholar] [CrossRef]
- Kadić, A.; Maljković, B.; Rogulj, K.; Pamuković, J.K. Green Infrastructure’s Role in Climate Change Adaptation: Summarizing the Existing Research in the Most Benefited Policy Sectors. Sustainability 2025, 17, 4178. [Google Scholar] [CrossRef]
- Shao, H.; Kim, G. A Comprehensive Review of Different Types of Green Infrastructure to Mitigate Urban Heat Islands: Progress, Functions, and Benefits. Land 2022, 11, 1792. [Google Scholar] [CrossRef]


Disclaimer/Publisher’s Note: The statements, opinions and data contained in all publications are solely those of the individual author(s) and contributor(s) and not of MDPI and/or the editor(s). MDPI and/or the editor(s) disclaim responsibility for any injury to people or property resulting from any ideas, methods, instructions or products referred to in the content. |
© 2025 by the authors. Licensee MDPI, Basel, Switzerland. This article is an open access article distributed under the terms and conditions of the Creative Commons Attribution (CC BY) license.