Abstract
Under global environmental change, the health of rivers and lakes on the “Asian Water Tower”—the Qinghai–Tibetan Plateau—is facing mounting pressures. This study examines Qinghai Lake, the Huangshui River, the Golmud River, and the Qinghai reach of the Yangtze River. By integrating the Water Quality Index (WQI) with the AHP–TOPSIS framework, we develop a multidimensional assessment system encompassing water resources, water environment, aquatic ecology, and management functions. The WQI results reveal pronounced spatial heterogeneity in water quality, with conditions ranked as Golmud River > Yangtze River > Huangshui River > Qinghai Lake. Dominant controlling factors also shift from dissolved oxygen in riverine systems to total phosphorus in the lake environment. The comprehensive AHP–TOPSIS evaluation further shows a health ranking of Yangtze River (0.736) > Golmud River (0.602) > Qinghai Lake (0.404) > Huangshui River (0.297), leading to the identification of four distinct management pathways: ecological conservation, natural restoration, nutrient control, and pollution remediation. By moving beyond single-parameter diagnostics, this study provides a robust methodological basis for differentiated river–lake management. The proposed “one river (lake), one strategy” framework, coupled with red-line management recommendations grounded in key indicators, offers direct scientific support for systematic protection and precise governance of aquatic ecosystems on the Qinghai–Tibetan Plateau, contributing to national ecological security and high-level environmental stewardship.
1. Introduction
Water resources are a core natural asset that underpin ecosystem stability, human well-being, and sustainable economic development, and their security has drawn intense global attention. Driven by population growth, industrialization, and land-use change, surface water systems worldwide face widespread pressures such as degradation of ecological structure, worsening water quality, and reduced availability [1]. In particular, under the background of global warming, surface water systems are exposed to multiple compounded risks—intensified hydrological disturbances, rising water temperatures, and enhanced mobility of pollutants [2]. As sensitive responders to climate change, high-altitude plateau river–lake systems exhibit pronounced ecological vulnerability and strong responsiveness to climatic perturbations and human interventions [3]; consequently, their health status is liable to greater fluctuation and maintaining the system’s steady state becomes especially critical.
Qinghai Province, located on the Tibetan Plateau, is the headwater region for major rivers such as the Yangtze, Yellow, and Lancang (Mekong), and occupies an irreplaceable strategic position in the country’s water-security framework and in regulating plateau hydrological cycles [4]. In recent years, under the combined influences of glacier retreat, increased precipitation uncertainty, and water-resource development, typical rivers and lakes in Qinghai have exhibited compound features including fluctuations in water quality, spatiotemporal imbalances in water quantity, and weakened ecological functions [3,5]. Studies indicate that the evolution of water resources in plateau regions shows clear spatial heterogeneity and seasonal variability [6]. Some lakes have experienced rapid area expansion and declines in salinity [3], reflecting the high sensitivity of plateau rivers and lakes to climatic and anthropogenic influences. Therefore, systematically assessing the health status of typical rivers and lakes in Qinghai is of important scientific significance for identifying water-resource evolution patterns under climate change, improving basin-scale integrated management capacity, and reducing water-environment risks.
Regarding indicator systems for river and lake health assessment, research has gradually shifted from traditional single physiochemical metrics toward comprehensive frameworks that emphasize ecological integrity, system resilience, and responses to multiple pressures. For example, projects such as the USEPA initiatives in the United States and the European STAR project propose assessment methods centered on coarse-scale benthic invertebrate communities, Index of Biological Integrity (IBI), and functional response indicators, thereby establishing process-based ecological evaluation approaches [7,8,9]. In China, river–lake health assessment frameworks have coalesced into a multi-dimensional structure of “basin attributes—water attributes—biological attributes—social functions,” which balances ecological processes, hydrological regulation, biological responses, and human activities. Basin attributes include indicators such as longitudinal connectivity and shoreline development intensity that reflect channel structural integrity [10]. The water attributes focus on water quality, water quantity, compliance of water-functional zones, and ecological flow guarantee [11]. The biological attributes characterize ecological stability and biodiversity using metrics such as benthic IBI and fish indices [12,13]. The social functions incorporate public satisfaction, water-supply security, and flood control capacity to reflect management performance and service provision [14,15]. Empirical applications of this framework in the Yangtze, Huai, and Yellow River basins have validated its regional adaptability and decision-support value [16].
Within existing river–lake health assessment systems, water quality—being the core component of the “water attributes” dimension—constitutes the most direct and fundamental indicator of aquatic health and serves as an essential prerequisite for subsequent evaluations of ecological function. To quantify water quality and enable cross-regional comparison, many studies employ composite water-quality indices to normalize multi-parameter water-quality data. The Water Quality Index (WQI), one of the earliest and most widely used composite water-quality models, is favored for its computational simplicity, clear structure, and ease of interpretation, and has been broadly applied for pollution grading and assessment of water-use suitability [17]. The WQI integrates multiple physiochemical indicators into a single score via a weighted average, which is particularly useful in regions with heterogeneous data and differing indicator sets. However, as its use has expanded, the limitations of the WQI have become apparent—subjectivity in weight assignment, potential masking of localized pollution features, and insufficient uniformity across disparate indicators [18]. And its capacity to represent dynamic ecosystem changes and spatial heterogeneity is limited [19]. Therefore, in comprehensive river–lake health assessments, the WQI is more appropriately used as a foundational water-quality evaluation tool that provides quantitative inputs for subsequent multi-indicator, multi-dimensional health diagnostics.
To strengthen structural robustness and multidimensional explanatory power of assessment methods, multi-criteria decision-making (MCDM) approaches have received increasing attention in environmental applications [20]. MCDM transforms multi-source parameters into rankable composite scores by constructing weighting matrices and an ideal-solution space, effectively addressing deficiencies in traditional methods regarding weight rationality and discrimination capability. The Analytic Hierarchy Process (AHP), a hierarchical structuring method, is suitable for building multi-indicator hierarchies and incorporating expert judgment [21]. The Technique for Order Preference by Similarity to Ideal Solution (TOPSIS) ranks evaluated objects by computing their distances to the positive and negative ideal solutions based on distance functions [22]. The AHP–TOPSIS combination has been jointly applied in environmental management contexts such as flood risk and land-use planning [23,24], demonstrating stable, reliable performance and broad applicability.
The AHP–TOPSIS integration can, within a unified framework, combine heterogeneous indicators spanning water-use efficiency, water quality, ecological protection, and socio-economic conditions, overcoming the one-sidedness of single-indicator approaches and markedly improving the systematicity and scientific validity of evaluation results [25]. Previous studies have shown that the method adapts well to diverse natural settings and socio-cultural backgrounds of river–lake systems [26]. Moreover, its data requirements are moderate: it supports long-term time-series analysis and is also suitable for cross-sectional comparisons using annual or discrete data, retaining good operability in data-limited study regions [27]. However, although AHP–TOPSIS has been applied in various fields of environmental management, its use in integrating a basic WQI with a multi-dimensional health assessment framework to evaluate plateau river–lake systems remains limited and underexplored.
This study focuses on representative plateau rivers and lakes in Qinghai Province. We first applied the WQI method to conduct an integrated assessment of water quality and to elucidate spatial differentiation patterns in water quality. Building on this, and using a river–lake health indicator system, we employed an AHP–TOPSIS approach to comprehensively evaluate overall health levels, thereby providing a holistic reflection of the health status of rivers and lakes on the Qinghai Plateau. This study aims to develop a comprehensive health assessment framework tailored to plateau river–lake systems and, through scenario-based comparative analysis, identify health conditions and key bottlenecks across different water bodies, thereby providing scientific support for targeted governance and systematic optimization of rivers and lakes on the Qinghai Plateau.
2. Method
2.1. Study Area
This study selected four typical types of river–lake water bodies on the Qinghai Plateau as research objects: Qinghai Lake (saline lake), the Huangshui River (a tributary of the Yellow River), the Golmud River (an inland river), and the Qinghai section of the Yangtze River mainstream (a large river). According to variations in upstream–downstream water quality, tributary confluence sections, administrative divisions, the presence of dams, and adjacent land-use patterns, the study area was divided into different evaluation river segments or subzones. The spatial distribution of the study area is shown in Figure 1.
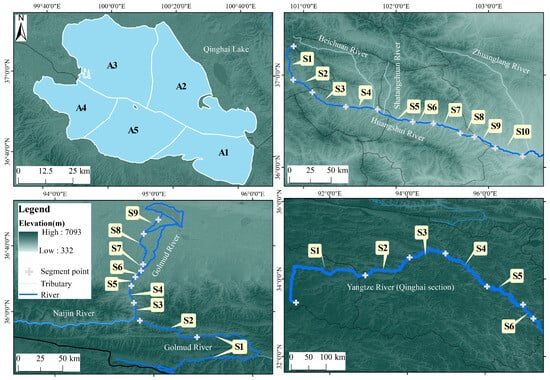
Figure 1.
Overview Map of the Research Area.
Qinghai Lake covers approximately 4300 km2 and is primarily recharged by precipitation and more than fifty inflowing rivers. Its water level, surface area, salinity, and ecosystem conditions have shown pronounced fluctuations under the influence of climate variability and human activities, making it a key region for aquatic ecological protection. A total of five evaluation subzones were delineated.
The Huangshui River extends approximately 374 km and flows through the socio-economic core area of Qinghai Province. It has faced pressures from urban and agricultural non-point source pollution and domestic wastewater discharge, with a pronounced imbalance between water supply and demand. Ten evaluation river segments were delineated.
The Golmud River, approximately 483 km in length, is an inland river mainly recharged by snow and ice meltwater, exhibiting strong seasonality in runoff. Salinity accumulation and high mineralization occur in its lower reaches. Intensive industrial and agricultural development has imposed significant ecological pressure. Nine evaluation river segments were delineated.
The Qinghai section of the Yangtze River mainstream stretches approximately 1206 km. Originating from the Tanggula Mountains, it flows across alpine grasslands and is primarily fed by precipitation and meltwater, with marked seasonal variability in runoff. As the core region of the Sanjiangyuan (Three-River-Source) area, it plays a crucial role in maintaining downstream ecological security and water conservation. Six evaluation river segments were delineated.
2.2. Data Sources
The data used in this study were primarily obtained from government bulletins, river and lake management policy documents, health assessment reports, and related scientific datasets (https://sthjt.qinghai.gov.cn/). These sources covered key information such as basin runoff, total water resources, and lake water levels, mainly for the years 2022–2023. According to recent hydrological and meteorological bulletins of Qinghai Province, no severe extreme droughts or floods occurred during this period; annual precipitation and runoff remained within the normal interannual variability range. Thus, 2022–2023 can be regarded as a hydrological period representing the “normal fluctuation” conditions of the Qinghai Plateau and is suitable as a reasonable baseline for assessing river–lake health in the region.
Regarding specific data sources, the hydrological and water resources data used in this study were mainly derived from official statistics issued by the Qinghai Provincial Department of Water Resources (e.g., Qinghai Water Resources Bulletin, 2022–2023) and supplementary internal hydrological datasets. Soil and water conservation data were obtained from official documents of the Qinghai Provincial Department of Natural Resources (e.g., Qinghai Province Soil and Water Conservation Bulletin, 2022). River–lake governance policy documents included river–lake chief system implementation plans and annual reports compiled by the Qinghai Provincial Department of Water Resources, as well as associated planning documents and interim assessment reports prepared by municipal water authorities along the basins. Existing river–lake health assessment reports were also collected from local water bureaus and used to assist in cross-checking and supplementing missing information.
All hydrological, water quality, ecological, and socio-economic indicators were compiled on an annual basis, primarily using annual statistical values or annual means for 2022–2023. The Water Quality Index (WQI) was calculated uniformly based on the annual mean concentrations of the relevant water quality parameters at each monitoring site and used together with other annual-scale indicators in the AHP–TOPSIS comprehensive health assessment to ensure temporal consistency across the evaluation methods. To ensure scientific reliability, the dataset was cleaned to remove outliers, and normalization was applied to eliminate dimensional inconsistencies among indicators. Cross-validation was conducted by comparing data from multiple sources to enhance accuracy and credibility.
2.3. Water Quality Index
The Water Quality Index is a widely recognized method for the comprehensive evaluation of surface water quality. In this study, the WQI model was applied to assess the overall water quality of four typical water bodies in Qinghai Province—the Qinghai section of the Yangtze River mainstream, the Huangshui River, the Golmud River, and Qinghai Lake.
The comprehensive water quality index was calculated using a weighted average method [28]:
where Qi represents the quality index of each parameter, determined based on its measured concentration and the corresponding water quality class according to the Environmental Quality Standards for Surface Water (GB 3838-2002) [29]. Wi denotes the assigned weight for each indicator.
Five parameters were selected as evaluation indicators in this study: TP, NH3-N, DO, CODMn, and pH. Their weights—0.29, 0.20, 0.21, 0.14, and 0.16, respectively—were determined with reference to previous studies [17] and the relative importance of these parameters to aquatic ecosystem health. These five indicators were selected partly because they correspond to the core monitoring items used for Class II–IV water quality assessment in China’s national standard (GB3838-2002), and they have continuous and complete monitoring records in the study area. In addition, they collectively capture key dimensions of water quality pressures, including eutrophication stress (TP, NH3-N), organic pollution intensity (CODMn), and the acid–base balance and re-oxygenation capacity of water bodies (pH, DO), thereby reflecting the major water quality stressors affecting plateau rivers and lakes.
The final WQI values were classified into water quality categories based on commonly used international standards: excellent (0–25%), good (26–50%), medium (51–75%), poor (76–100%), and very poor (>100%). This classification follows widely adopted thresholds in global WQI research and provides good comparability and visualization performance [30,31,32].
2.4. Health Assessment Indicators for Typical Rivers and Lakes
The health assessment indicators for the four typical rivers and lakes in this study (Table 1 were developed based on key principles such as problem-oriented assessment, representation of regional characteristics, and operational feasibility. The indicator system was constructed in accordance with the natural attributes and management requirements of each water body, covering aspects including water resources, water pollution, aquatic space, shorelines, ecological restoration, and law enforcement supervision.

Table 1.
Integrated Health Assessment Indicator System for Typical Rivers and Lakes on the Qinghai Plateau.
Among these indicators, monitoring-based parameters (e.g., C12: compliance rate of monitored water quality sections) primarily relied on routine monitoring data from 2022–2023 or their annual averages. Water resources and ecological indicators (e.g., C1: water resources development and utilization rate; C15: assurance level of ecological flow in river channels) were calculated using hydrological station records, remote-sensing-derived datasets, and the aforementioned functional zoning results. For management- and governance-related indicators (e.g., C9: rectification rate of “four types of disorder” issues), quantification was based on river–lake chief system implementation plans and reports, annual management records, and questionnaire survey results.
Within criterion layer B6, several indicators exhibit qualitative characteristics and were therefore converted into quantifiable variables through standardized scoring. “Public satisfaction (C20)” was derived from questionnaire surveys conducted among local residents, water users, and frontline management personnel within the basin. Other qualitative indicators were scored using a graded evaluation table developed from management records and implementation reports provided by basin authorities. After normalization, all qualitative indicators were incorporated into the AHP–TOPSIS model for unified calculation.
2.5. Evaluation Scenarios
To reflect the differing management perspectives and decision contexts under the River and Lake Chief System, this study designed two evaluation scenarios. In the “Three-River Scenario,” only the Qinghai section of the Yangtze River mainstream, the Huangshui River, and the Golmud River were included as evaluation units. This scenario corresponds to the current governance perspective that emphasizes river-corridor management and is closely linked to socioeconomic activities and water-use regulation.
In the “Three-River–One-Lake Scenario,” the plateau lake—Qinghai Lake—was further incorporated into the evaluation system alongside the three rivers, forming a mixed set of “three rivers and one lake.” This scenario was designed to examine how the relative health ranking and priority for improvement among the three rivers would change when a large terminal lake with outlet-blocking characteristics is considered.
By comparing the evaluation results under the two scenarios, the stability of the TOPSIS closeness coefficients can be analyzed, and structural differences in health constraints between river systems and lakes can be identified.
2.6. AHP-TOPSIS Framework
The combined AHP–TOPSIS evaluation method has been widely applied in fields such as water resources management and ecological assessment due to its robustness and flexibility. In this study, the method is employed to conduct a comprehensive health assessment of four typical rivers and lakes in Qinghai Province. The AHP–TOPSIS calculation framework consists of the following steps:
- (1)
- Data Standardization
Because the evaluation indicators differ in units and magnitudes, the original data must be standardized to ensure comparability. Min–max normalization is applied, as expressed by:
where is the original data; and are the maximum and minimum values of indicator across all rivers and lakes; and is the standardized value.
For negative indicators (e.g., pollutant concentrations), the normalization formula is adjusted to:
Determination of Criterion Weights.The weights of the six criterion-level indicators (B1–B6) in this study were determined using the Analytic Hierarchy Process (AHP). First, based on the six criteria, a 6 × 6 pairwise comparison matrix was constructed. The classical Saaty 1–9 scale was applied to judge the relative importance among criteria, where a higher score indicates that the row criterion is more important than the column criterion.
The principal eigenvector of the matrix was extracted and normalized to obtain the weight of each criterion. Following standard AHP procedures, the consistency index (CI) and consistency ratio (CR) were calculated. All matrices satisfied the requirement of CR < 0.10, indicating an acceptable level of consistency. The final weights of criteria B1–B6 are listed in Supplementary Material Tables S1–S6.
- (2)
- Calculation of the Weighted Normalized Matrix
After standardization, the indicator weights derived from AHP are applied to the normalized matrix to obtain the weighted normalized matrix:
where is the weighted normalized value; is the weight of indicator ; and is the standardized data.
- (3)
- Determination of Positive and Negative Ideal Solutions
In TOPSIS, the optimal solution (positive ideal solution ) and the worst solution (negative ideal solution ) must first be determined:
Here, represents the best performance across all indicators, while represents the worst.
- (4)
- Calculation of Euclidean Distance from Ideal Solutions
The Euclidean distances between each river/lake and the positive and negative ideal solutions are calculated as follows:
where and denote the distances from the positive and negative ideal solutions, respectively.
- (5)
- Calculation of the Relative Closeness
Finally, the relative closeness of each river/lake to the ideal solution is calculated:
The value of ranges from 0 to 1, where larger values indicate a healthier river or lake.
2.7. Indicator Contribution Analysis Methodology
After completing the overall AHP–TOPSIS computation, the composite closeness score intuitively reflects the relative health status of each river and lake. However, this indicator remains a “result-level ranking”. To further uncover the mechanisms underlying this ranking, a more detailed interpretation at the indicator level is required. In particular, the TOPSIS method constructs an “ideal reference system” through the positive and negative ideal solutions, and different indicators contribute unequally to pulling an assessment object closer to or farther from the ideal state. Therefore, after obtaining the closeness results, it is necessary to analyze the actual influence of each indicator within the distance calculations, so as to identify which indicators drive improvements or declines in the health status of a given river or lake. To this end, the following analysis decomposes the distance to the ideal solutions at the indicator level.
To reveal the contribution of each indicator to the closeness score, the distances from each alternative to the positive and negative ideal solutions are decomposed by indicator. Following the concept of distance attribution, the “share of distance to the positive ideal solution” (unfavorable component) and the “share of distance to the negative ideal solution” (favorable component) are computed separately and then used to derive the net indicator influence. The specific formulas are as follows:
- (1)
- Share of Distance to the Positive Ideal Solution
- (2)
- Share of Distance to the Negative Ideal Solution
- (3)
- Net Influence Index
To jointly account for the relative weights of the positive and negative ideal distances in the closeness score, a net influence index is constructed:
where represents the net influence of indicator on the closeness score of alternative ; is the Euclidean distance from alternative i to the negative ideal solution; is the Euclidean distance from alternative i to the positive ideal solution.
2.8. Result Consistency Verification
To verify the robustness of the AHP–TOPSIS framework in river health assessment, this study conducts consistency checks from two perspectives: weight perturbation and indicator redundancy. These tests jointly evaluate the model’s sensitivity to weight uncertainty and indicator removal. After completing the consistency checks, further analyses—including improvement potential quantification and criterion-level closeness evaluation—are carried out to provide a more structured interpretation of the assessment results. Details of the methodology are provided in the Supplementary Material.
3. Results and Discussion
3.1. Assessment and Analysis of River–Lake Water Quality on the Qinghai Plateau
Spatial Differentiation Characteristics of Water Quality Assessment Results
The comprehensive WQI of the four types of water bodies in the study area exhibited pronounced spatial heterogeneity (Figure 2), ranging from 23.85% to 183.27%. The mean WQI values ranked as follows: Qinghai Lake (155.07%) > Yangtze River mainstem in the Qinghai section (48.53%) > Golmud River (38.83%) > Huangshui River (32.17%), reflecting the combined influence of water body type, watershed conditions, and human activity intensity on water quality.
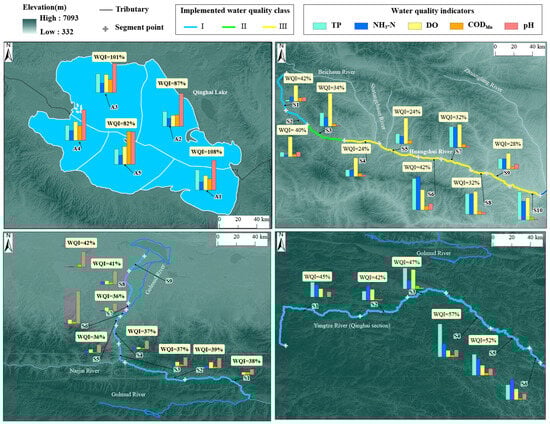
Figure 2.
WQI Calculation Results (For easier comparison of different indicators under varying units, the bar heights are renormalized based on the minimum and maximum values of the entire survey) Comparative Analysis of Key Indicators Across Watersheds.
The Golmud River showed generally good and stable water quality, with WQI values between 36.33% and 45.05%. All parameters met Class II standards, and TP and NH3-N concentrations were very low. Spatial distribution was relatively uniform, with minor WQI fluctuations at individual sites due to slightly elevated pH or reduced dissolved oxygen, indicating minimal anthropogenic disturbance and a system largely governed by natural background conditions. In contrast, the Huangshui River exhibited substantial water quality variability. Pollution loads were particularly pronounced in the midstream segment, where WQI ranged from 23.85% to 42.02%, and TP and NH3-N peaked in segments 4–6. CODMn was generally high, showing a spatial pattern of “acceptable upstream—sharp deterioration midstream—gradual recovery downstream,” highlighting the significant influence of localized pollution sources on overall water quality. The Yangtze River mainstem in Qinghai displayed generally good water quality, with WQI values of 42.08–56.66%. TP and NH3-N concentrations were higher than in the Golmud River, but dissolved oxygen and CODMₙ were favorable, showing fluctuating improvement along the river course. Slightly elevated WQI at some sections may result from tributary inflows or the distribution of pollution sources. Qinghai Lake exhibited anomalously high WQI values (138.58–183.27%). Although classified as Class II, extremely high CODMₙ values reflected its closed-lake characteristics, naturally high organic matter content, and alkaline background, indicating systematic effects on the WQI. This suggests limitations of applying river-based WQI methods to unique water bodies. The elevated WQI results from both external inputs—nutrients and oxidizable organic matter delivered by inflowing rivers and lakeshore activities that accumulate under the no-outflow condition [33]- and internal processes, as long residence time and weak mixing facilitate sediment-derived nutrient and organic matter release, reinforced by alkaline and humic-rich chemistry. These mechanisms form a nutrient-dominated pattern typical of terminal lakes, where sediment cycling sustains eutrophication [34]. Effective management therefore requires an integrated watershed–lake strategy that jointly controls external inputs and internal loading.
Overall, pollution in the study area was dominated by TP and NH3-N, with a typical nonpoint source pollution belt forming in the midstream Huangshui River. Water quality in the Golmud River and Yangtze mainstem was generally good with limited spatial heterogeneity. WQI effectively reflects cumulative pollution loads, while water quality classes highlight the limiting effect of the worst individual parameters. Combining both approaches provides a more comprehensive assessment of water quality. The anomalous WQI of Qinghai Lake indicates that natural chemical background should be considered when applying WQI to different water body types, and local standards may be necessary to enhance the scientific validity and applicability of water quality evaluations.
The controlling factor structure of the WQI across the four types of water bodies in the study area exhibited pronounced differentiation (Figure 3). Overall, DO contributed prominently in riverine systems, with contributions of approximately 20% in the Golmud River and 17.55–19.75% in the Yangtze River mainstem, highlighting the central role of ecological self-purification in flowing waters. However, the dominant mechanisms varied markedly among water bodies.
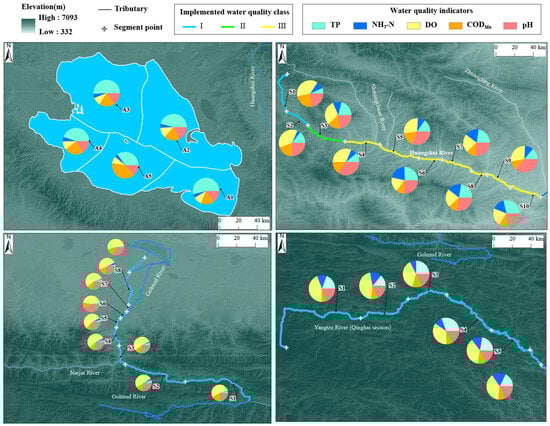
Figure 3.
Contribution of Water Quality Indicators (the percentage contribution of each indicator is expressed as a relative percentage, renormalized to 100% and presented as a complete pie chart).
The Golmud River exhibited a typical “DO single-factor dominant” pattern, with other parameters contributing relatively evenly, confirming its regulation primarily by natural processes. In contrast, the Yangtze mainstem displayed a “dual-factor synergistic” driving pattern, where DO and TP jointly influenced water quality, with TP contributing up to 17.4%, reflecting the combined effects of ecological self-purification and nutrient input. The Huangshui River transitioned longitudinally from upstream DO dominance (10.4–15.8%) to a mid- and downstream “multi-factor composite” pattern driven by TP, NH3-N, and CODMn, illustrating the cumulative impacts of urban and agricultural pollution sources. Qinghai Lake, however, was entirely dominated by TP, with contributions ranging from 63.80% to 84.10% (average > 70%), forming a distinct “absolute nutrient control” pattern. Localized CODMₙ peaks (e.g., 72.16% in segment 5) further indicate enhanced organic matter accumulation and decomposition, emphasizing the high sensitivity of closed lakes to external inputs and the amplified risk of eutrophication [3].
From a typological perspective, the driving structures of these water bodies can be categorized into four typical patterns: naturally dominated (Golmud River), dual-factor synergistic (Yangtze River mainstem), composite pollution (mid- to downstream Huangshui River), and nutrient-dominated (Qinghai Lake). This structural differentiation is closely related to water body hydrodynamics, watershed land-use intensity, and the degree of anthropogenic disturbance. Previous studies support these patterns: Kannel et al. [19] highlighted DO as a key indicator sensitive to organic loading in urbanized waters; Uddin et al. [17] similarly identified DO and TP as the most common controlling variables for water quality; and Wu et al. [35] demonstrated the decisive role of nutrients and organic matter in determining lake water quality in Poyang Lake. Although some indicators in the Huangshui River improved during the sampling period, potentially due to wet-season dilution and hydraulic flushing as observed by Deng et al. [36] in the Han River, the overall ecological health remained low, indicating a time lag between short-term improvements in physico-chemical indicators and full ecosystem recovery.
3.2. Comprehensive Assessment of River–Lake Health
3.2.1. Analysis of Comprehensive River–Lake Health Assessment Results
Based on the AHP weight system and TOPSIS model, two evaluation scenarios were constructed: the “Three-River Scenario” and the “Three-Rivers-One-Lake Scenario,” to comprehensively assess the health status of four representative water bodies, including the Yangtze River mainstem in Qinghai, the Golmud River, the Huangshui River, and Qinghai Lake. The health closeness index (C value) for each target was calculated from the distances to the positive ideal solution (S+) and negative ideal solution (S−), where smaller S+ indicates proximity to the optimal state, larger S− indicates distance from the worst state, and higher C values correspond to better overall health. It should be noted that the TOPSIS C value is a relative metric defined within a given set of alternatives. The positive and negative ideal solutions are reconstructed whenever the set of evaluated objects changes. Consequently, even if the individual indicators of each water body remain unchanged, their C values may vary. Therefore, absolute C values under different evaluation scenarios should not be directly interpreted as improvements or deteriorations in ecosystem health. The detailed results of the two evaluation scenarios, including S+, S−, C values, and health ranking for each each river and lake, are summarized in Table 2.
Table 2.
Comprehensive assessment of rivers and lake.
Under the Three-River Scenario, significant gradient differences were observed among the rivers. The Yangtze River mainstem exhibited the smallest S+ (0.013), largest S− (0.061), and highest C value (0.822), indicating the best health status. The Golmud River was at a moderate level (C = 0.526), with DO dominance but limited by water resource utilization efficiency. The Huangshui River had the lowest C value (0.449), reflecting the poorest comprehensive health. These differences were primarily influenced by the combined effects of anthropogenic disturbances and ecological self-regulation capacity: the Yangtze benefited from watershed protection policies (e.g., Yangtze River Protection and Restoration Action Plan, https://www.gov.cn/; Yangtze River Protection Law, https://www.mee.gov.cn/) and large-flow dilution and self-purification effects; the Golmud River relied mainly on groundwater recharge, maintaining relatively good natural self-purification capacity, though high-altitude, arid, and high-evaporation conditions limited runoff and constrained purification processes [37]; the Huangshui River, with significant industrial, agricultural, and urban wastewater inputs, experienced overlapping point and non-point source pollution, leading to exceedances in NH3-N and CODMn and heightened health risks [38].
When the assessment framework was expanded from the “three-river scheme” to the “three-river–one-lake scheme,” the inclusion of the closed Qinghai Lake reshaped both the positive and negative ideal solutions. As a result, the TOPSIS C values of the three rivers declined overall, yet their ranking—Yangtze River mainstream (Qinghai section) > Golmud River > Huangshui River—remained unchanged. This consistency indicates that the relative ecosystem-health gradient among the river systems is robust and stable. In the Three-Rivers-One-Lake Scenario, the C values for the four targets followed a clear gradient: Yangtze mainstem (C = 0.736) > Golmud River (0.602) > Qinghai Lake (0.404) > Huangshui River (0.297). Qinghai Lake exhibited lower health than the rivers but higher than the Huangshui River, indicating a moderately low status. Its relatively low C value was primarily driven by its closed hydrological nature and nutrient accumulation: long hydraulic retention times limit the removal of external pollutants, making TP a key constraint on health, while weak hydrological connectivity and limited recharge exacerbate these effects [39]. This demonstrates a structural difference between lake and river systems in terms of health assessment. Overall, natural ecological constraints (C7, C13, C10) dominated health differentiation, whereas policy and management indicators (C1, C6, C9) varied little, reflecting the predominance of natural control and the limited margin for human regulation in watershed health.
The results of the two scenarios were largely consistent, with stable river health rankings (Yangtze mainstem > Golmud River > Huangshui River), confirming the robustness and generalizability of the AHP-TOPSIS framework. In summary, the Yangtze River mainstem represents an “ecological self-purification-dominated” type, the Golmud River a “natural maintenance” type, the Huangshui River a “composite pollution” type, and Qinghai Lake a “nutrient accumulation-dominated” type. Targeted management strategies should be implemented accordingly: maintain ecological flow and connectivity for the Yangtze and Golmud rivers; strengthen integrated control of urban and non-point source pollution in the Huangshui River; and reduce TP input and enhance sediment pollution control in Qinghai Lake.
Based on the AHP–TOPSIS assessment, the “three-river scheme” consistently ranked ecosystem health as Yangtze River mainstream (Qinghai section) > Golmud River > Huangshui River. When Qinghai Lake was incorporated, the TOPSIS C values of the three rivers declined, and the original inter-river gradient was reshaped into a more complex river–lake–urban river gradient. This shift highlights both the robustness of the AHP–TOPSIS framework to changes in the evaluation set and the inherent relativity of C values, as the lake’s water quality strongly influences the ideal–negative-ideal structure and compresses differences among rivers.
The inclusion of Qinghai Lake is supported by recent evidence showing that nutrient and pollutant accumulation has intensified in Tibetan Plateau lakes over the past decades. Regional syntheses indicate significant increases in nitrogen and phosphorus concentrations [40], while nutrient forms in Qinghai Lake are statistically linked to watershed and lakeshore soil TN, TP, and pH, underscoring watershed–soil–lake connectivity in controlling water quality [41]. Furthermore, Tibetan Plateau lakes exhibit pronounced differences in ion composition and mineralization, with many tectonic lakes showing elevated salinity and high sensitivity to external inputs [42]. Together, these findings justify classifying Qinghai Lake as a closed, nutrient-accumulating priority control unit within the joint system.
From a river–lake integrated perspective, the Yangtze River and Golmud River remain relatively healthy and should prioritize maintaining ecological flow, hydrological connectivity, and soil–water conservation. The Huangshui River, characterized by mixed urban pollution, requires strengthened point–nonpoint co-control. Qinghai Lake demands stringent TN/TP load reduction, enhanced littoral and sediment pollution management, and long-term monitoring to prevent eutrophication. Overall, the stable ranking across both schemes demonstrates the robustness and general applicability of the AHP–TOPSIS system, while providing a quantitative basis for coordinated management of alpine river–lake ecosystems.
3.2.2. Indicator Contribution Analysis
In the Three-River scenario, the Net Influence Index (NetInf) exhibited pronounced differences among the rivers (Figure 4), reflecting their ecological baseline conditions and primary pressures. The health status of the Golmud River was mainly constrained by water use efficiency, with the largest negative contributors being the irrigation water use coefficient (C4: −33.14 pp) and the proportion of unconventional water supply (C2: −6.92 pp), indicating that low water use efficiency is the primary limiting factor for its health. In contrast, per capita water availability (C3: +26.73 pp) had the strongest positive effect, highlighting the river’s inherent water resource endowment.
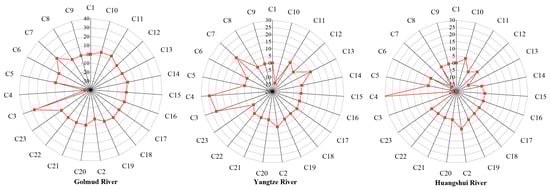
Figure 4.
Spatial Distribution of Net Influence Index for the “Three Rivers” Scheme.
The Huangshui River showed a typical pattern of resource scarcity and pollution pressure. Its negative NetInf contributions mainly came from per capita water availability (C3: −23.01 pp) and river–lake hydrological connectivity (C7: −15.51 pp), underscoring structural constraints caused by limited water resources and disrupted hydraulic connectivity. Simultaneously, the irrigation water use coefficient (C4: +31.53 pp) and unconventional water use (C2: +6.58 pp) provided positive contributions, reflecting efforts in heavily human-impacted areas to alleviate pressures through improved water management. The Yangtze River in the Qinghai segment exhibited the highest overall health, with positive NetInf contributions primarily driven by per capita water availability (C3: +21.65 pp) and irrigation water use efficiency (C4: +24.16 pp). However, sediment pollution (C10: −13.81 pp) remained the main negative constraint, indicating that cumulative endogenous pollution could still pose potential risks.
When Qinghai Lake was included in the “Three Rivers-One Lake” system, the NetInf pattern changed significantly (Figure 5), revealing the lake ecosystem’s unique health-driving mechanisms. The health of Qinghai Lake was strongly constrained structurally, with the proportion of soil erosion area (C13: −54.51 pp) as the overwhelmingly dominant negative factor. River–lake hydrological connectivity (C7: +19.90 pp) was the primary positive contributor, but in a closed-lake system, this mainly reflects inflow guarantee rather than mainstem connectivity. The contributions of indicators in the river system also shifted with the inclusion of Qinghai Lake: absolute values of both positive and negative NetInf generally increased, although the relative ranking remained stable. For example, C7 in the Huangshui River changed from −15.51 pp to −12.82 pp, and in the Golmud River from +11.73 pp to +12.97 pp, reinforcing their ecological preservation status. Meanwhile, the negative impact of C13 in the Huangshui River increased substantially (from −10.44 pp to −51.72 pp), highlighting, along with Qinghai Lake, that soil erosion represents a common and severe challenge across the Qinghai Plateau river–lake system.
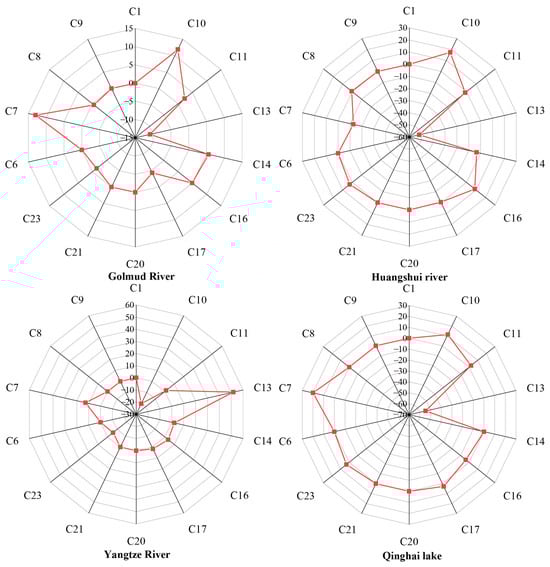
Figure 5.
Spatial Distribution of Net Influence Index for the “Three Rivers–One Lake” Scheme.
The integrated assessment under the “three rivers and one lake” scenario delineated four distinct health categories linked to specific management modes. The Yangtze River (Qinghai section) achieved the highest C value, with constraints mainly in C10 (sediment pollution) and C23 (digital/intelligent supervision), characterizing an “ecological conservation” system where natural resilience dominates and management focuses on reinforcement. The Golmud River, limited by C13 (soil erosion), C17 (fish integrity), and C23, represents a “natural restoration” system requiring the protection of natural processes and targeted ecological rehabilitation.
Qinghai Lake was primarily constrained by C13, C16 (riparian vegetation), and C8 (river/bank stability), consistent with its role as a closed alpine lake where nutrient and sediment control is fundamental to ecosystem health. The Huangshui River, affected concurrently by C13, C7 (hydrological connectivity), and C14 (water quality), had the lowest C value and typifies a “pollution management” urban river. Collectively, these modes underline the coherence between C-value levels and dominant bottleneck indicators, revealing contrasting regulatory mechanisms across alpine river–lake systems and providing a sound basis for differentiated, system-specific management interventions.
3.2.3. Robustness and Differentiation Analysis of River–Lake Health Assessment Results
To ensure the reliability and comparability of the model results, robustness tests were conducted for both object sets (Three-River scenario and Three-Rivers-One-Lake scenario), using weight perturbation and indicator redundancy analyses. The results indicated that the ranking remained stable under both perturbed and simplified conditions, and changes in closeness coefficients were negligible, confirming the robustness of the health ranking. Monte Carlo simulations showed that when weight perturbations were set to ±10%, the ranking consistency across objects reached 100%, with a mean Kendall’s τ of 1.000 (standard deviation 0.000), and minimal changes in closeness values (Yangtze: 0.7361 ± 0.0121, Golmud River: 0.6026 ± 0.0077, Qinghai Lake: 0.4048 ± 0.015, Huangshui River: 0.2965 ± 0.0121). Further, after removing low-discrimination indicators (C1, C6, C9, C21) and recalculating TOPSIS, the closeness values and ranking remained completely consistent (Yangtze > Golmud River > Qinghai Lake > Huangshui River), demonstrating the structural stability of the model across different variable sets.
To identify the core sources of differences in water body health evaluations, the relative distance to the positive ideal solution (IM%, Figure 6) was calculated, where higher IM% indicates greater improvement potential. In the Three-River scenario, the Golmud River’s shortcomings were concentrated in wetland coverage and water use efficiency (IM%: 50% for C1; 40% for C2, C4, C13), while the Huangshui River showed the largest gaps in per capita water availability and hydrological connectivity (IM% = 100%). The Yangtze River mainly had improvement potential in sediment pollution (IM% 35%) and informatization-based management (IM% 33%). In the extended Three-Rivers-One-Lake scenario, Qinghai Lake’s largest gaps were in the proportion of soil erosion area (IM% 80%) and riparian vegetation coverage (IM% 30%), whereas the Golmud and Huangshui rivers continued to show improvement potential in water-ecological connectivity, soil and water conservation, and informatization governance. Analysis of improvement space concentration (CR5) indicated that CR5 ranged from 0.73 to 0.99 in the Three-River scenario and from 0.89 to 1.00 in the Three-Rivers-One-Lake scenario, demonstrating that overall gaps were concentrated in a few key indicators, consistent with previous findings [22,25].
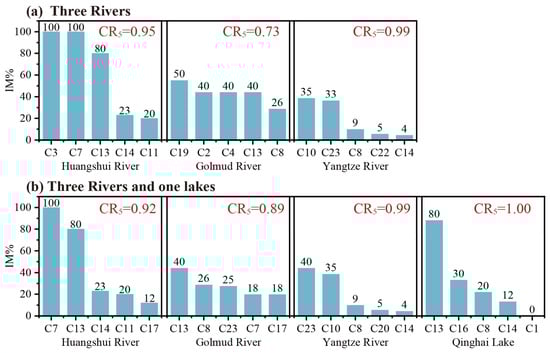
Figure 6.
Improvement Potential IM% Calculation Results (CR5 = Sum of Top 5 IM%/Sum of All IM%).
The closeness results at the criterion level (Table 3) reveal structural differences among the water bodies. In the Three-River scenario, the Golmud River performed well in shoreline management (0.810) and pollution prevention (1.000), but scored lowest in the ecological restoration layer, indicating that ecosystem recovery has not yet been systematically implemented. The Huangshui River exhibited the highest closeness in water law enforcement management (0.960) but performed poorly in shoreline management (0.080) and water environment governance (0.000), reflecting insufficient spatial regulation and pollution control. The Yangtze River showed the highest overall closeness, with water resource protection (1.000) and ecological restoration (0.996) approaching the ideal, though the water law enforcement layer remained relatively low (0.123), suggesting room for improvement in cross-regional supervision. In the Three-Rivers-One-Lake scenario, the Yangtze River maintained advantages in shoreline management (0.958) and ecological restoration (0.989). The Golmud River’s ecological restoration closeness increased from 0.000 to 0.568, indicating early effects of governance interventions. Qinghai Lake reached ideal values in pollution prevention and law enforcement layers, but shoreline management and ecological restoration remained relatively low. The Huangshui River showed improvement in pollution prevention and ecological restoration, yet shoreline management and environmental governance layers remained weak, highlighting insufficient governance coordination.
Table 3.
Three-River and Three-River-One-Lake Scenario Criterion-Level Closeness.
Cross-object set difference analysis (Table 4) indicated that the Golmud River exhibited a “1(+), 1(0), 3(−)” pattern, with the largest increase in the ecological restoration layer (+0.568) and a mean absolute change of 0.146. The Huangshui River showed a “3 positive, 1 zero, 1 negative” pattern, with notable improvement in pollution prevention (+0.220) and a mean absolute change of 0.105. The Yangtze River experienced minimal changes “1(+), 0(0), 4(−)”, with the smallest mean absolute change (0.068). Overall, the Golmud River demonstrated the largest structural adjustment, reflecting dynamic improvements in ecological restoration and governance optimization; the Huangshui River followed, showing a shift toward balancing supervision and pollution control; the Yangtze River remained stable and mature, with differences converging, illustrating systematic variations in health structure and governance priorities among the water bodies.
Table 4.
Three-River Scenario Criterion-Level Closeness Differences.
4. Conclusions
This study integrates the WQI and AHP-TOPSIS to assess the health of four representative water bodies on the Qinghai–Tibet Plateau across water resources, environment, ecology, and management functions. Results show pronounced spatial differentiation: the Yangtze River (Qinghai section, closeness 0.736) represents the “ecological conservation type”; the Golmud River (0.602) is the “natural restoration type”; the Huangshui River (0.297) corresponds to the “pollution management type”; and Qinghai Lake (0.404) is the “nutrient control type.”
Comparison between the three-river and three-river–one-lake scenarios indicates that river health rankings remain stable, but including Qinghai Lake lowers overall C values and shifts management priorities, highlighting the value of integrated river–lake assessments for optimizing resource allocation. The AHP-TOPSIS model effectively identifies both overall health and criterion-level bottlenecks, providing guidance for differentiated management: conservation for the Yangtze River, preventive measures for the Golmud River, remediation for the Huangshui River, and nutrient control for Qinghai Lake.
From a sustainability perspective, such an integrated health assessment directly supports targets aligned with the Sustainable Development Goals (SDGs) for clean water and ecosystem conservation by linking water quality status, ecological integrity, and governance performance to differentiated management pathways for high-altitude river–lake systems. Limitations include the subjectivity in weight determination and reliance on 2022–2023 data, which may not capture interannual variability. Future work could incorporate remote sensing and dynamic weighting for enhanced objectivity and real-time monitoring. The framework offers scientific support for water resource protection and ecological security planning on the plateau.
Supplementary Materials
The following supporting information can be downloaded at: https://www.mdpi.com/article/10.3390/su18010079/s1, Table S1: Weights of the Indicator System for the Three-River Scenario; Table S2: Pairwise Comparison Matrix of the Criterion Level (Three-River Scenario); Table S3: CI, CR Consistency Verification (Three-River Scenario); Table S4: Weights of the Indicator System for the Three-Rivers-and-One-Lake Scenario; Table S5: Pairwise Comparison Matrix of the Criterion Level (Three-Rivers–One-Lake Scenario); Table S6: CI, CR Consistency Verification (Three-Rivers–One-Lake Scenario).
Author Contributions
Conceptualization, Y.Z., R.L. and S.J.; methodology, Y.Z.; software, Y.Z.; validation, Y.Z., R.L. and S.J.; formal analysis, Y.Z.; investigation, Y.Z.; resources, R.L.; data curation, Y.Z.; writing—original draft preparation, Y.Z.; writing—review and editing, Y.Z., R.L. and S.J.; visualization, Y.Z.; supervision, R.L. and S.J.; project administration, Y.Z. All authors have read and agreed to the published version of the manuscript.
Funding
This research received no external funding.
Institutional Review Board Statement
Not applicable.
Informed Consent Statement
Not applicable.
Data Availability Statement
The data presented in this study are available on request from the corresponding author.
Conflicts of Interest
The authors declare no conflicts of interest.
Abbreviations
The following abbreviations are used in this manuscript:
| TP | Total phosphorus |
| NH3–N | Ammonia nitrogen |
| DO | Dissolved oxygen |
| CODMn | Permanganate index |
| pH | Potential of hydrogen |
| AHP | Analytic Hierarchy Process |
| TOPSIS | Technique for Order Preference by Similarity to Ideal Solution |
| WQI | Water Quality Index |
References
- Reid, A.J.; Carlson, A.K.; Creed, I.F.; Eliason, E.J.; Gell, P.A.; Johnson, P.T.J.; Kidd, K.A.; MacCormack, T.J.; Olden, J.D.; Ormerod, S.J.; et al. Emerging Threats and Persistent Conservation Challenges for Freshwater Biodiversity. Biol. Rev. 2019, 94, 849–873. [Google Scholar] [CrossRef]
- Capon, S.J.; Stewart-Koster, B.; Bunn, S.E. Future of Freshwater Ecosystems in a 1.5 °C Warmer World. Front. Environ. Sci. 2021, 9, 784642. [Google Scholar] [CrossRef]
- Zhu, L.; Ju, J.; Qiao, B.; Liu, C.; Wang, J.; Yang, R.; Ma, Q.; Guo, L.; Pang, S. Physical and Biogeochemical Responses of Tibetan Plateau Lakes to Clim Ate Change. Nat. Rev. Earth Environ. 2025, 6, 284–298. [Google Scholar] [CrossRef]
- Yan, Y.; Cao, J.; Gu, Y.; Huang, X.; Liu, X.; Hu, Y.; Wu, S. An Evaluation of Ecosystem Quality and Its Response to Aridity on the Qinghai–Tibet Plateau. Remote Sens. 2024, 16, 3461. [Google Scholar] [CrossRef]
- Zhang, J.; Liu, J.; Jin, J.; Ma, T.; Wang, G.; Liu, H.; Min, X.; Wang, H.; Lin, J.; Bao, Z.; et al. Evolution and Trend of Water Resources in Qinghai-Tibet Plateau. Bull. Chin. Acad. Sci. (Chin. Version) 2019, 34, 1264–1273. (In Chinese) [Google Scholar] [CrossRef]
- Lei, Y.; Yao, T.; Yang, K.; Sheng, Y.; Kleinherenbrink, M.; Yi, S.; Bird, B.W.; Zhang, X.; Zhu, L.; Zhang, G. Lake Seasonality across the Tibetan Plateau and Their Varying Relationship with Regional Mass Changes and Local Hydrology. Geophys. Res. Lett. 2017, 44, 892–900. [Google Scholar] [CrossRef]
- Faustini, J.M.; Kaufmann, P.R.; Herlihy, A.T.; Paulsen, S.G. Assessing Stream Ecosystem Condition in the United States. Eos Trans. Am. Geophys. Union 2009, 90, 309–310. [Google Scholar] [CrossRef]
- Niemi, G.; Wardrop, D.; Brooks, R.; Anderson, S.; Brady, V.; Paerl, H.; Rakocinski, C.; Brouwer, M.; Levinson, B.; McDonald, M. Rationale for a New Generation of Indicators for Coastal Waters. Environ. Health Perspect. 2004, 112, 979–986. [Google Scholar] [CrossRef] [PubMed]
- Verdonschot, P.F.M.; Moog, O. Tools for Assessing European Streams with Macroinvertebrates: Major Re Sults and Conclusions from the STAR Project. Hydrobiologia 2006, 566, 299–309. [Google Scholar] [CrossRef]
- Zhang, J.; Dong, Z.; Sun, D.; Wang, J. Complete River Health Assessment Index System Based on Eco-Regional Method According to Dominant Ecological Functions. Shuili Xuebao (J. Hydraul. Eng.) 2010, 41, 883–892. (In Chinese) [Google Scholar] [CrossRef]
- Li, Y.; Li, Q.; Jiao, S. River Health Evaluation Based on Improved Analytic Hierarchy Process, CRITIC Method and Compound Fuzzy Matter-Element VIKOR Model. Chin. J. Ecol. 2022, 41, 822–832. (In Chinese) [Google Scholar] [CrossRef]
- Xiong, C.; Zhang, R.; Xu, Y.; Zhang, W.; Chen, P.; Wang, L. Health Assessment on Rivers in Shanghai City Using Benthic Index of Biotic Integrity. J. Lake Sci. 2015, 27, 1067–1078. (In Chinese) [Google Scholar] [CrossRef]
- Zhang, Y.; Qu, X.; Wang, S.; Zhu, Y.; Liu, X.; Zhang, H.; Zhang, M.; Sun, S. River Health Assessment of Hun River Basin Based on Benthic Index of Biological Integrity. Resour. Environ. Yangtze Basin 2020, 29, 1374–1386. [Google Scholar]
- Bao, Y.; Tian, B.; Zhang, Y.; Qu, K.; Li, W.; Qian, J. River Health Assessment in Xiong’an New Area. Acta Ecol. Scinica 2021, 41, 5988–5997. (In Chinese) [Google Scholar]
- Hu, W.; Li, W.; Wang, L.; Su, Y.; Sun, X.; Li, J.; Chen, Q. Health Assessment of Small and Medium Rivers Based on GA-BP Optimization Model. Acta Ecol. Scinica 2021, 41, 1786–1797. (In Chinese) [Google Scholar]
- Zou, X.; Yang, Z.; Zheng, Z.; Shi, F.; Shao, K.; Guan, B.; Wan, C. Health Assessment of River Habitat in Typical Regions of the Yangtze River Mainstream. Resour. Environ. Yangtze Basin 2020, 29, 2219–2228. (In Chinese) [Google Scholar]
- Uddin, M.G.; Nash, S.; Olbert, A.I. A Review of Water Quality Index Models and Their Use for Assessing Sur Face Water Quality. Ecol. Indic. 2021, 122, 107218. [Google Scholar] [CrossRef]
- Mogane, L.K.; Masebe, T.; Msagati, T.A.M.; Ncube, E. A Comprehensive Review of Water Quality Indices for Lotic and Lentic e Cosystems. Environ. Monit. Assess. 2023, 195, 926. [Google Scholar] [CrossRef]
- Kannel, P.R.; Lee, S.; Lee, Y.-S.; Kanel, S.R.; Khan, S.P. Application of Water Quality Indices and Dissolved Oxygen as Indicator s for River Water Classification and Urban Impact Assessment. Environ. Monit. Assess. 2007, 132, 93–110. [Google Scholar] [CrossRef]
- Govindan, K.; Jepsen, M.B. ELECTRE: A Comprehensive Literature Review on Methodologies and Applic Ations. Eur. J. Oper. Res. 2016, 250, 1–29. [Google Scholar] [CrossRef]
- Madzík, P.; Falát, L. State-of-the-Art on Analytic Hierarchy Process in the Last 40 Years: L Iterature Review Based on Latent Dirichlet Allocation Topic Modelling. PLoS ONE 2022, 17, e0268777. [Google Scholar] [CrossRef] [PubMed]
- Pandey, V.; Komal; Dincer, H. A Review on TOPSIS Method and Its Extensions for Different Application s with Recent Development. Soft Comput. 2023, 27, 18011–18039. [Google Scholar] [CrossRef]
- Choudhary, K.; Boori, M.S.; Shi, W.; Valiev, A.; Kupriyanov, A. Agricultural Land Suitability Assessment for Sustainable Development u Sing Remote Sensing Techniques with Analytic Hierarchy Process. Remote Sens. Appl. Soc. Environ. 2023, 32, 101051. [Google Scholar] [CrossRef]
- Ekmekcioğlu, Ö.; Koc, K.; Özger, M. Stakeholder Perceptions in Flood Risk Assessment: A Hybrid Fuzzy AHP-T OPSIS Approach for Istanbul, Turkey. Int. J. Disaster Risk Reduct. 2021, 60, 102327. [Google Scholar] [CrossRef]
- Basílio, M.P.; Pereira, V.; Costa, H.G.; Santos, M.; Ghosh, A. A Systematic Review of the Applications of Multi-Criteria Decision Aid Methods (1977–2022). Electronics 2022, 11, 1720. [Google Scholar] [CrossRef]
- Jozaghi, A.; Alizadeh, B.; Hatami, M.; Flood, I.; Khorrami, M.; Khodaei, N.; Ghasemi Tousi, E. A Comparative Study of the AHP and TOPSIS Techniques for Dam Site Selection Using GIS: A Case Study of Sistan and Baluchestan Province, Iran. Geosciences 2018, 8, 494. [Google Scholar] [CrossRef]
- Hamidifar, H.; Ghorbani, M.K.; Bakhshandeh, M.A.; Gholami, S. A Multi-Criteria Multidimensional Model for Optimal Selection of Rural Water Supply Systems. AQUA-Water Infrastruct. Ecosyst. Soc. 2023, 72, 1042–1056. [Google Scholar] [CrossRef]
- Brown, R.M.; McClelland, N.I.; Deininger, R.A.; O’Connor, M.F. A Water Quality Index—Crashing the Psychological Barrier. In Proceedings of the Indicators of Environmental Quality; Thomas, W.A., Ed.; Springer: Boston, MA, USA, 1972; pp. 173–182. [Google Scholar]
- GB 3838-2002; Environmental Quality Standards for Surface Water. China Environmental Science Press: Beijing, China, 2002. Available online: https://english.mee.gov.cn/Resources/standards/water_environment/quality_standard/200710/t20071024_111792.shtml (accessed on 1 October 2025).
- Brown, R.M.; McClelland, N.I.; Deininger, R.A.; Tozer, R.G. A Water Quality Index—Do We Dare? Water Sew. Work. 1970, 117, 339–343. [Google Scholar]
- Sutadian, A.D.; Muttil, N.; Yilmaz, A.G.; Perera, B.J.C. Development of River Water Quality Indices—A Review. Environ. Monit. Assess. 2015, 188, 58. [Google Scholar] [CrossRef]
- Tyagi, S.; Sharma, B.; Singh, P.; Dobhal, R. Water Quality Assessment in Terms of Water Quality Index. Am. J. Water Resour. 2020, 1, 34–38. [Google Scholar] [CrossRef]
- Ao, H.; Wu, C.; Xiong, X.; Jing, L.; Huang, X.; Zhang, K.; Liu, J. Water and Sediment Quality in Qinghai Lake, China: A Revisit after Half a Century. Environ. Monit. Assess. 2014, 186, 2121–2133. [Google Scholar] [CrossRef]
- Wang, L.; Liang, T. Distribution Characteristics of Phosphorus in the Sediments and Overlying Water of Poyang Lake. PLoS ONE 2015, 10, e0125859. [Google Scholar] [CrossRef] [PubMed]
- Wu, Z.; Zhang, D.; Cai, Y.; Wang, X.; Zhang, L.; Chen, Y. Water Quality Assessment Based on the Water Quality Index Method in Lake Poyang: The Largest Freshwater Lake in China. Sci. Rep. 2017, 7, 17999. [Google Scholar] [CrossRef]
- Deng, L.; Chen, K.; Liu, Z.; Wu, B.; Chen, Z.; He, S. Spatiotemporal Variation Evaluation of Water Quality in Middle and Lower Han River, China. Sci. Rep. 2022, 12, 14125. [Google Scholar] [CrossRef]
- Liu, K.; Xiao, Y.; Yang, H.; Zhang, Y.; Qi, Z.; Wang, S.; Luo, Y. Evolution Characteristics of Golmud River Runoff Based on Swat Model. J. Eng. Geol. 2023, 31, 12. (In Chinese) [Google Scholar]
- Yu, R.; Gai, J.; Bai, Q.; Zhou, W.; Tang, H.; Huang, Y. The Current Situation of Soil Pollution and Suggestions for Prevention and Control Measures in the Huangshui River Basin of Qinghai Province. Agric. Compr. Dev. China 2024, 16–19. (In Chinese). Available online: https://clst.cau.edu.cn/module/download/downfile.jsp?filename=cf0b1a7911a442edbd22b07877775375.pdf (accessed on 16 December 2025).
- Zheng, X.-N.; Wu, D.-X.; Huang, C.-Q.; Wu, Q.-Y.; Guan, Y.-T. Impacts of Hydraulic Retention Time and Inflow Water Quality on Algal Growth in a Shallow Lake Supplied with Reclaimed Water. Water Cycle 2022, 3, 71–78. [Google Scholar] [CrossRef]
- Wu, Y.; Wang, S.; Ni, Z.; Li, H.; May, L.; Pu, J. Emerging Water Pollution in the World’s Least Disturbed Lakes on Qinghai-Tibetan Plateau. Environ. Pollut. 2021, 272, 116032. [Google Scholar] [CrossRef]
- Li, G.; Zhou, J.; Deng, D.; Du, M.; Meng, Y.; Dai, L.; Peng, Q.; Wang, L. Understanding the Relationship Between Water Quality and Soil Nutrient Dynamics in Qinghai Lake Through Statistical and Regression Models. Water 2025, 17, 472. [Google Scholar] [CrossRef]
- Yan, L.; Sun, M.; Yao, X.; Gong, N.; Li, X.; Qi, M. Lake Water in the Tibet Plateau: Quality Change and Current Status Evaluation. Acta Sci. Circumstantiae 2018, 38, 11. (In Chinese) [Google Scholar]
Disclaimer/Publisher’s Note: The statements, opinions and data contained in all publications are solely those of the individual author(s) and contributor(s) and not of MDPI and/or the editor(s). MDPI and/or the editor(s) disclaim responsibility for any injury to people or property resulting from any ideas, methods, instructions or products referred to in the content. |
© 2025 by the authors. Licensee MDPI, Basel, Switzerland. This article is an open access article distributed under the terms and conditions of the Creative Commons Attribution (CC BY) license.