Abstract
The caldén (Neltuma caldenia) forest, a xerophytic low-stature ecosystem in central Argentina, faces increasing threats from land use change and desertification. This study assesses the capability of full-polarimetric L-band SAR data from the Argentine SAOCOM-1A satellite to characterise forest attributes in this ecosystem. We computed the Generalised Radar Vegetation Index (GRVI) and compared it with aboveground biomass and tree canopy cover data from the Second National Forest Inventory, under fire and non-fire conditions. We also assessed other SAR indices and polarimetric decompositions. GRVI values exhibited limited variability relative to the broad range of field-estimated biomass, and most regression models were not statistically significant. Nevertheless, GRVI effectively distinguished woody from non-woody vegetation and showed a weak correlation with canopy cover. Statistically significant, albeit weak, correlations were also observed between biomass and specific polarimetric components, such as the helix term of the Yamaguchi decomposition and the Pauli volume component. Key challenges included limited spatial and temporal coverage of SAOCOM-1A data and the distribution of field plots. Despite these limitations, our results support the use of GRVI for land cover monitoring in semiarid regions, emphasising the importance of multitemporal data, integration with C-band SAR, and enhanced field sampling to improve forest attribute modelling.
1. Introduction
Human activities have profoundly altered Earth’s systems in recent decades, most notably through land use change and increased greenhouse gas emissions that drive global temperature rise and intensify extreme events such as droughts, wildfires, and floods [1,2,3,4]. In this context, understanding and quantifying the carbon cycle has become a scientific priority [5]. Forests are central to the carbon cycle, acting as major carbon sinks, while their degradation or loss through wildfires and land use change contributes significantly to atmospheric CO2 emissions. Accurate estimation of aboveground biomass (AGB) and other forest attributes via remote sensing is, therefore, essential for monitoring forest carbon dynamics and informing sustainable management policies [6].
Recent advances in remote sensing have enabled large-scale forest biomass mapping [6,7,8,9], with SAR—particularly P- and L-band—becoming essential for improving forest classification and biomass estimation due to its ability to penetrate forest canopies and interact with woody structures [9,10,11,12,13]. Beyond backscatter intensity, polarimetric SAR (PolSAR) data offer additional insights by enabling the analysis of spatial and temporal vegetation changes through scattering mechanisms linked to vegetation attributes [14]. PolSAR data enhance biomass modelling by providing the full scattering matrix. This allows coherence and phase statistics, as well as backscatter coefficients and band ratios, to be included in biomass models [15]. In this context, radar vegetation indices, such as the Generalised Radar Vegetation Index (GRVI), have been developed to exploit the full polarimetric properties of SAR data for vegetation characterisation. The GRVI is based on geodesic distances between Kennaugh matrices projected onto a unit sphere, quantifying similarity between observed and theoretical volume scattering models [14,16]. This index has demonstrated utility for crop monitoring, capturing the temporal dynamics of biophysical parameters such as plant area index and vegetation water content [14].
Biomass estimation using SAR data has shown promising accuracy, with RMSE values of 14 t ha−1 to 18 t ha−1; however, errors may approach 100 t ha−1 in high-biomass forests [17] due to the wavelength used and the characteristics of the forest structure. These limitations can be partially mitigated by incorporating coherence, phase statistics, and polarimetric decompositions, which extend the dynamic range of SAR sensitivity [17,18]. While radar metrics such as intensity, phase, and coherence support forest characterisation, their effectiveness is not always transferable across forest types or acquisition geometries [15]. In contrast, the GRVI—based on the generalised volume scattering model of Antropov et al. [19] and a modulation parameter () sensitive to morphological change—offers a more robust alternative due to its capacity to capture vegetation volume scattering [16].
The Comisión Nacional de Actividades Espaciales (CONAE) has launched two L-band synthetic aperture radar (SAR) satellites: SAOCOM-1A (2018) and SAOCOM-1B (2020), primarily designed for soil moisture monitoring and emergency applications. SAOCOM data are available in single and dual polarisation modes, as well as full quad-polarimetric mode, with different incidence angle ranges and spatial resolutions depending on the acquisition mode [20]. These satellites are among the few full polarimetric SAR systems currently in orbit and are considered high-performance sensors [21]. Moreover, they provide surface characterisation in the L-band, which, as previously mentioned, is among the most suitable bands for biomass estimation [9,13].
Most studies aimed at modelling biomass and other forest attributes have been conducted in tropical forests, which are the most extensive and biodiverse forests on the planet [22], whereas dryland forests are often under-represented in global biomass estimation products and remote sensing research, despite their extensive coverage and ecological importance [23]. In this study, we explore the capability of SAOCOM-1A data to model forest attributes in xerophytic caldén (Neltuma caldenia) woodlands located in central Argentina. This ecosystem is currently fragmented and forms a heterogeneous mosaic of vegetation types, shaped by natural environmental variability [24] and more than a century of human disturbance [25]. The present combination of anthropogenic pressure and prevailing natural conditions renders these forests especially vulnerable to desertification [26]. The objective of this study was to conduct an exploratory analysis of the relationship between full polarimetric SAOCOM-1A data and caldén forest attributes, particularly aboveground biomass and canopy cover, in order to evaluate the potential of L-band SAR data—specifically through the Generalised Radar Vegetation Index (GRVI) [14], but also through other relevant SAR-derived parameters—for characterising this type of forest. This work makes two principal contributions to the field. Firstly, it contributes to the study of dry forests through the utilisation of full polarimetric data. Secondly, it aims to facilitate the use of Argentine satellite SAOCOM imagery for these and other applications by providing the code for processing this data in a public repository (see Section 2.3.1).
2. Materials and Methods
2.1. Study Area
The caldén (Neltuma caldenia) forest is located in central Argentina [27], covering an area of 169,333 km2 and extending 782 in a north–south direction (Figure 1). This region is characterised by semiarid conditions, with many dunes, salt flats, and highly permeable substrates with low water availability [26]. Annual rainfall ranges from 400 mm to 700 mm from west to east, and the region experiences a high thermal amplitude, with a mean annual temperature of 16 °C. The landscape consists of a well-drained, gently undulating plain. Soils are sandy and poorly structured, with low organic matter, resulting in susceptibility to both water and wind erosion. According to the USDA soil taxonomy [28], soils are classified as mollisols and entisols.
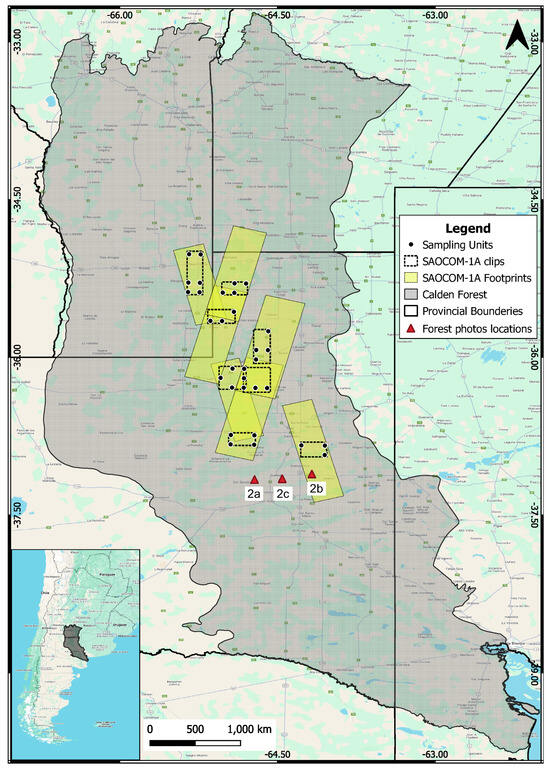
Figure 1.
Location of the caldén (Neltuma caldenia) forest in central Argentina, the sampling units from the Second National Native Forest Inventory used in this study, the footprints of the selected SAOCOM-1A images, and the image subsets used for GRVI calculation. Red triangles show the locations of photos showing the different forest formations in Figure 2.
The caldén forest is a low xerophytic formation (average height of ) situated in a transitional biogeographic zone. Its structure and composition vary due to natural heterogeneity in relief and soils, as well as anthropogenic pressures such as deforestation, selective logging, altered fire regimes, and overgrazing [26]. Dominated by species of the genus Neltuma, the forest includes a tree layer typically composed of caldén [27], a graminoid–herbaceous layer, and may include a shrub layer. It often features a park-like appearance, characterised by isolated trees or tree clusters set within a grassland matrix. Three main forest formations have been described based on tree density and understory composition:
- 1.
- Open forest with grasses: it present perennial grasses, few shrubs, 5.6 m2 ha−1 of basal area and about 98 trees per hectare (Figure 2a);
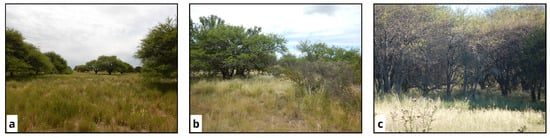 Figure 2. Open caldén (Neltuma caldenia) forest with grasses (a), open forest with shrubs (b), and closed forest (c). Photographs taken by the first author. These images are illustrative only, intended to provide a general view of the forest characteristics. They do not correspond to the sampling points but derive from a previous study, as photographs of the actual sampling points from the Second National Native Forest Inventory dataset were not available.
 - 2.
- Open forest with shrubs: similar in structure to the previous type, but with greater shrub cover (Figure 2b);
- 3.
- Closed forest: it has a basal area of 18 m2 ha−1 and about 290 trees per hectare (Figure 2c).
Other physiognomies in the region include shrublands, grasslands, and croplands [26]. The primary productive activity is extensive livestock grazing, primarily involving cattle and sheep, which is based on the continuous grazing of natural grasslands and silvopastoral systems. Elevated stocking rates lead to high grazing pressure on the herbaceous–graminoid layer and affect the regrowth of woody species due to trampling [26].
The caldén forest was shaped by both environmental variability and over a century of human intervention [24,25]. Although the proportion of woody cover has remained relatively stable since 1880, major structural changes have occurred, including forest losses due to agricultural expansion in the east, pasture conversion in the west, and woody encroachment in central areas [25]. Historical records reveal a long fire history (1787–1993) with variable intervals and increasing frequency after European settlement, coinciding with land clearing and grazing [29]. Frequent, low-intensity fires once maintained open savanna states, while the introduction of livestock disrupted fire–grass feedbacks, facilitating thicketization and altering species composition through seed dispersal and grazing effects [30]. These combined fire and grazing dynamics have strongly influenced forest structure, carbon storage, and regeneration [31]. Understanding the interacting processes of fire, grazing, and woody encroachment is essential for the sustainable management and restoration of caldén ecosystems, which require re-establishing grass–low-intensity fire feedbacks and controlling livestock pressure [32,33].
2.2. Materials
2.2.1. SAR Data
This study employed L-band imagery (central frequency 1275 MHz and ) acquired by the SAOCOM-1A satellite, launched in October 2018, as part of the SAOCOM mission (Table 1), which provides full polarimetric SAR data [34]. The images were acquired in Stripmap mode, and the SLC quad-pol product was used, with range and azimuth resolutions of approximately . Seven images, acquired between 16 August and 8 October 2019, were selected based on their overlap with three or more vegetation sampling units (SUs) from the Second National Native Forest Inventory. These images correspond to the winter of 2019, the driest period available according to precipitation records, in order to minimise the influence of soil moisture and better capture vegetation structure [35]. Among the selected images, three were acquired during ascending orbits and four during descending orbits, with acquisition sub-modes varying among beams S5, S6, S7, and S8. All SAOCOM images were radiometrically calibrated and included amplitude and phase information for all four polarisations (HH, HV, VV, and VH).

Table 1.
Main characteristics of the Argentine SAOCOM mission. Source: [21].
The images were preprocessed using SNAP software, v.8.0.0 [36], applying Range-Doppler Terrain Correction to both the real and imaginary components, using the SRTM 3Sec Digital Elevation Model (DEM) with a spatial resolution of 90 [37]. The corrected images had a pixel spacing of approximately 7 m × 7 m. To optimise processing time, each image was clipped around the SUs (Figure 1), as they were not distributed across the entire scene.
We calculated the Generalised Radar Vegetation Index (GRVI) for each SU using the R programming language [38,39], following the processing criteria established in the literature [14,16]. All processing was done using the EPSG 4326 coordinate system (Geographic Coordinates, WGS84 Datum). The image analysis was carried out on a computer with the following specifications: Intel© Core(TM) i7-6560U CPU @ 2.20 GHz, 16.0 GB RAM, 64 bit OS, Intel(R) Iris(R) Graphics 540, running Windows 10.
2.2.2. Vegetation Data
The caldén forest attributes were obtained from the Second National Native Forest Inventory [35], developed by the Ministry of Environment and Sustainable Development of Argentina as a tool for guiding public policies on sustainable forest management and conservation. The sampling units (SUs) were surveyed between January 2019 and August 2020 using a systematic design based on a grid of equidistant points spaced 10 . Each SU consists of two concentric circular plots: Plot A covers 1000 m2 (radius of ) and includes all woody individuals with a diameter at breast height (DBH) ≥ 10 , while Plot B covers 255 m2 (radius of 9 ) and includes individuals with a DBH between 5 and 10 [35]. From all available SUs in the area of the caldén forest, 32 were selected based on their overlap with the available SAOCOM-1A images. Among these, 20 SUs were associated with descending orbit images and 12 with ascending orbits. In terms of acquisition sub-modes, 9 SUs were present in images acquired in sub-mode S5, 13 in S6, 3 in S7, and 7 in S8.
2.3. Methods
2.3.1. Generalised Radar Vegetation Index
The GRVI can be more precisely described as the Generalised Volume Scattering Model-Based Radar Vegetation Index, as it measures the similarity between the observed Kennaugh matrix K and the generalised volume scattering model matrix for each pixel [40]. The index has an intuitive formulation, is easy to implement, and is computationally efficient [14]. It is defined as:
where is the similarity term and is a modulation parameter. The similarity term is calculated as , where is a geodesic distance. This concept was proposed by Ratha et al. [41] for change detection and later applied in classification [42]. The K matrix is a real, symmetric, matrix expressed in power, and it preserves backscatter information [42]. To compute the geodesic distance involved in the term , each K matrix is projected onto a unit sphere (radius 1), which forms a hypersurface in 16-dimensional Euclidean space. The geodesic distance is the shortest path between two points on this sphere along a great circle and reflects the similarity between two matrices—the greater the distance, the less similar they are [16]. This metric is not affected by uniform scaling of K, making it suitable for characterising scattering mechanisms. Matrices close on this unit sphere are similar (), and those far apart are dissimilar. This comparison is made between the observed K matrix and an ideal reference model, specifically the generalised volume scattering model developed by Antropov et al. [19]. This model was designed to represent a wide range of vegetation canopies and has proven effective for extracting vegetation structure from PolSAR data, especially when using full-polarimetric L-band imagery [19]. The second component in the GRVI equation, , is calculated as the ratio between the minimum (p) and maximum (q) geodesic distances between the observed K matrix and four canonical target matrices: trihedral, cylinder, dihedral, and narrow dihedral [43].
GRVI values range from 0 to 1. A value of indicates that the observed matrix belongs to the set of canonical targets (), while indicates that K is equivalent to [14]. Since vegetation typically exhibits volume scattering, GRVI values close to 1 are expected in vegetated areas. In this study, the GRVI was computed using the R programming language, following the methodology proposed by Ratha et al. [14] and Mandal et al. [16,43], and the calculation flow is shown in Figure 3. The code is available in a public GitHub repository together with a SAOCOM data sample: https://github.com/InstitutoGulich/Tesis-MAIE-Elisa-Frank-Buss.git (accessed on 21 November 2025). A multilooking was applied to the clipped SAOCOM-1A images, resulting in pixels of approximately 15 m × 15 m. GRVI values were extracted for each pixel containing a SU. Initially, the index was analysed in its unfiltered form, as originally proposed [14]. Additionally, a focal filter was applied to reduce speckle. To better represent vegetation at each SU, summary statistics were calculated using a pixel window centred on each SU, based on the filtered GRVI.
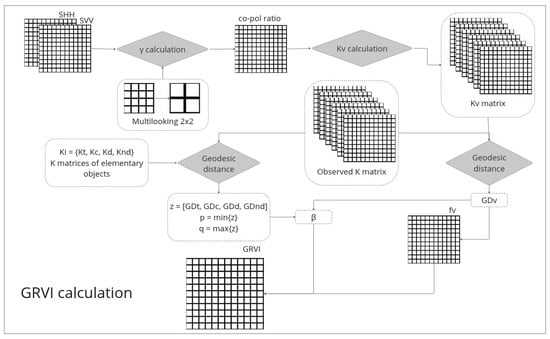
Figure 3.
Calculation flow considered to calculate the GRVI index from SAOCOM-1A image data.
2.3.2. Other SAR Image Properties
We computed additional SAR indices and commonly used polarimetric decompositions for comparison with the GRVI results [10,18]: the Radar Vegetation Index (RVI) [44], the Canopy Structure Index (CSI), the Volume Scattering Index (VSI), and the Biomass Index (BMI) [45]. For decompositions, we calculated the Cloude and Pottier 1996 [46], van Zyl 1992 [47], Freeman and Durden 1998 [48], Yamaguchi 2005 [49], and Pauli decomposition [15]. In addition, we extracted backscatter intensity values for the four SAOCOM-1A polarisations (VV, VH, HH, HV), along with the VV/VH and HH/HV ratios.
We used a consistent processing chain in SNAP software for the indices and decompositions: a multilooking was first applied to the images, followed by the calculation of each index or decomposition. A Lee Sigma speckle filter with a window was then applied, and finally, terrain correction was performed using the above-mentioned SRTM DEM (90 ), resulting in a pixel size of approximately 15 m × 15 m.
2.3.3. Aboveground Biomass and Tree Cover
For each SU, aboveground biomass (AGB, t ha−1, hereafter referred to as biomass) was first estimated for each individual tree or shrub using the allometric equation developed by Chave et al. [50]:
where DBH () is the diameter at breast height, H () is the height, and is the wood density per species when available; otherwise, it is per genus or family. Biomass estimation followed the procedure proposed by Hernández Stefanoni et al. [51], and was implemented in R using the BIOMASS package. The resulting values were then converted to tonnes per hectare (t ha−1) based on the area of each plot (A or B), and the total biomass per SU was calculated as the sum of all individual biomass values.
Additionally, the database provided canopy cover data, defined as the projection of the vegetation crowns onto the ground, measured as a percentage using the line-intercept method [35]. For this analysis, the percentage of total tree cover—i.e., the crown projection of all woody individuals taller than 3 —was included. Biomass and total tree cover values were analysed by forest type—closed (11 SUs), open with shrubs (16 SUs), and open with grasses (5 SUs)—and by fire occurrence, since fire can rapidly alter both forest attributes.
2.4. Statistical Analysis
A series of regression models was employed to assess the relationship between biomass and the GRVI, using a significance level of . The analysis began with a simple linear regression using biomass as the dependent variable and the GRVI value of the pixel as the independent variable. This was then repeated using the average filtered GRVI from a pixel window. As these initial models did not produce favourable results, the analysis was progressively refined by testing polynomial regressions up to the fourth degree, quantile regressions, and mixed models [52]. The mixed models allowed for the inclusion of additional factors, such as SAOCOM-1A image acquisition parameters (orbit and submode) and SU attributes, like forest type and fire occurrence. In addition, regression analyses were conducted using total tree cover as the dependent variable instead of biomass. The exploratory analysis was further extended to evaluate the relationships between biomass and total tree cover with other SAR indices and polarimetric decomposition components, as well as backscatter coefficients from the four polarisations and the HH/HV and VV/VH ratios.
3. Results
3.1. Generalised Radar Vegetation Index
In GRVI maps (Figure 4), values close to 0 correspond to surface (single-bounce) backscatter areas (shown in red or orange in Figure 4), while higher values are associated with volume scattering (green and blue areas). Single-pixel GRVI values for SUs ranged from 0.21 to 0.63 (), whereas average values at pixel windows exhibited a narrower range, from 0.28 to 0.41 (). These results suggest that the combination of speckle filtering and averaging may reduce the index’s ability to detect variability within the same vegetation type. GRVI values did not show clear differences between ascending and descending orbits, nor between the different acquisition submodes (Figure 5).
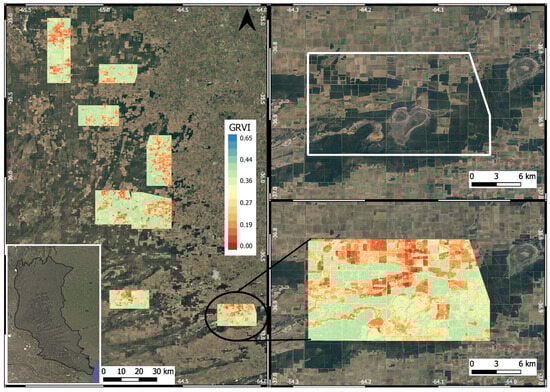
Figure 4.
GRVI maps obtained with a focal filter applied to eight SAOCOM-1A image subsets from winter 2019 for the caldén (Neltuma caldenia) forest (left) in central Argentina. A zoomed-in view of one subset is shown at the bottom right and the same area is displayed using a Google Satellite image for comparison (top right). Forest areas appear in green.
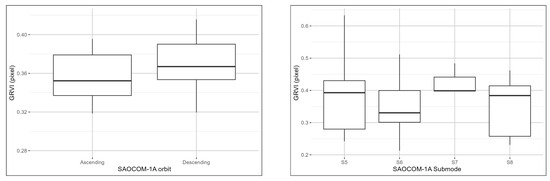
Figure 5.
GRVI pixel values from SAOCOM-1A images acquired in winter 2019 for pixels containing sampling units from the caldén (Neltuma caldenia) forest in central Argentina, grouped by orbit type (left: ascending (), descending ()) and acquisition submode (right: S5 (), S6 (), S7 (), or S8 ()).
3.2. Aboveground Biomass and Tree Canopy Cover
The biomass estimated for the caldén forest gave a mean value of 44.07 t ha−1, with a minimum of 5.62 t ha−1 and a maximum of 127.27 t ha−1. Eleven out of the thirty-two SUs showed signs of fire. The SU with the minimum biomass value had fire indications, while the one with the highest biomass did not (Figure 6). On average, SUs affected by fire had lower biomass ( t ha−1) compared to those without fire signs ( t ha−1). Tree canopy cover had a mean value of 52.2%, ranging from 0% to 100%. The zero value likely corresponds to SUs near forest clearings where transect placement may have missed existing trees or where individuals had the required DBH but were shorter than 3 m, the minimum height for inclusion in the canopy cover estimate. Canopy cover was similar between SUs with and without fire signs (with fire: 50.83%, without fire: 52.92%), although the latter group showed greater interquartile variability (Figure 7).
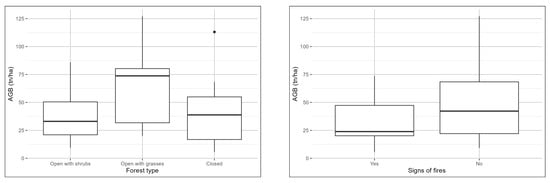
Figure 6.
Aboveground biomass values (/) calculated from the Second National Native Forest Inventory [35] data for caldén (Neltuma caldenia) forest of central Argentina, by physiognomy (closed (), open with grasses (), and open with shrubs (), left), the black dot is an outlier; and according to whether the sampling units (SUs) showed signs of fire (YES, ) or not (NO, ) (right).
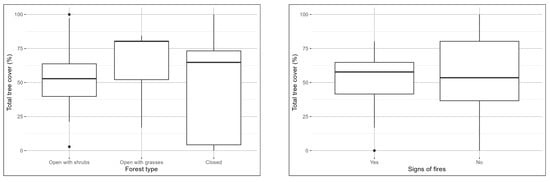
Figure 7.
Total tree canopy cover (%) obtained from the Second National Native Forest Inventory [35] data for caldén (Neltuma caldenia) forest of central Argentina, by physiognomy (closed (), open with grasses (), and open with shrubs (), left), and by fire occurrence, based on whether the sampling units (SUs) showed signs of fire (YES, ) or not (NO, ) (right). The black dots are outliers.
Open caldén forest with grass showed the highest biomass values ( t ha−1, 5 SUs), while the closed forest and open forest with shrubs had lower and similar values ( t ha−1 (11 SUs) and t ha−1 (16 SUs), respectively); cf. Figure 6. In relation to tree cover, the open forest with grasses also showed the highest values (), while the closed and open forests with shrubs had lower and similar values ( and , respectively) (Figure 7).
3.3. Relationship Between GRVI, Biomass and Canopy Cover
The analysis of biomass data plotted against GRVI values revealed a significant dispersion of the data points (Figure 8). Simple linear regressions between these variables were not statistically significant, irrespective of whether the single-pixel GRVI values () or the pixel window average () were employed. Polynomial regressions up to the fourth degree were also tested (see Appendix A); however, none were statistically significant, with exceeding .
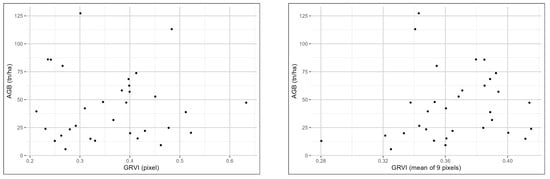
Figure 8.
Aboveground biomass (t ha−1), derived from the Second National Native Forest Inventory [35] for the caldén (Neltuma caldenia) forest of central Argentina (), as a function of the SAOCOM-1A-derived GRVI value of the pixel corresponding to each sampling unit, without applying any speckle filtering (left). A comparable relationship is presented using the mean GRVI value computed from the 9 neighboring pixels after applying a focal speckle filter (right).
We also explored the influence of fire occurrence and forest type on the biomass–GRVI relationship. No clear trends were found when analysing SUs with and without fire signs separately. For each forest type, separate linear regressions were applied (Figure 9), but none showed significant results (). However, for the closed forest, removing one SU improved the model (, model: , and ; Figure 10); however, there was no clear reason to justify excluding that SU. Quantile regressions were also tested, with most above , except for the -quantile () and the -quantile () (see Appendix A).
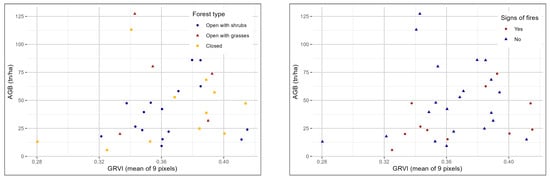
Figure 9.
Aboveground biomass (t ha−1), derived from the Second National Native Forest Inventory [35] for the caldén (Neltuma caldenia) forest of central Argentina (), is shown as a function of the mean GRVI value computed from 9 pixels in SAOCOM-1A images acquired in winter 2019. Sampling units are grouped by forest physiognomy (closed, open with grasses, and open with shrubs, left) and by fire occurrence (YES or NO, right).
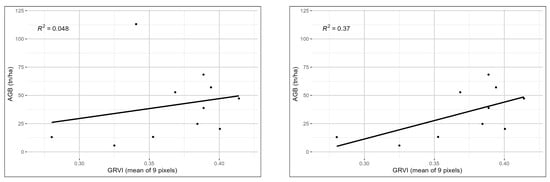
Figure 10.
Simple linear regression between aboveground biomass (t ha−1) calculated from the Second National Native Forest Inventory [35] data for caldén (Neltuma caldenia) forest of central Argentina, and the GRVI values obtained from SAOCOM-1A images acquired in winter 2019 as a mean of 9 pixels for sampling units (SUs) classified as closed forest (, left). The same relationship is shown excluding the SU () that exhibited a divergent pattern, with high biomass (113.09 t ha−1) and a relatively low GRVI value () (right). The linear regression line and the value are included.
A simple linear regression between total tree canopy cover and GRVI resulted in (Figure 11). One SU showed a large residual when checking model assumptions and had a notably low GRVI value. Visual inspection of the GRVI image revealed that this SU was located near a non-woody area (e.g., firebreak), and in the SAOCOM-1A image, it fell within a mixed pixel between forest and cleared land. The exclusion of this point yielded a statistically significant linear model (, model: ), though the explained variance remained weak (). Excluding this SU from the biomass–GRVI regression did not improve the results. Additionally, mixed models were tested to assess the effect of the SAOCOM-1A acquisition parameters (orbit type and submode) on the relationship between biomass and the GRVI (see Appendix A), but none of these models were statistically significant ().
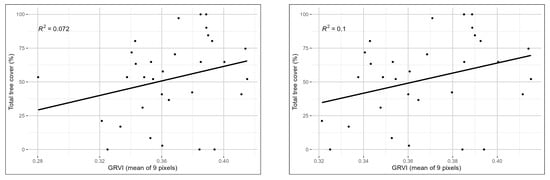
Figure 11.
Simple linear regression between total tree canopy cover (%) obtained from the Second National Native Forest Inventory [35] for caldén (Neltuma caldenia) forest of central Argentina, and the GRVI values obtained from SAOCOM-1A images acquired in winter 2019 as a mean of 9 pixels for sampling units (SUs), including all 32 SUs (, left) and excluding 1 SU (, right). The linear regression line and the value are included.
3.4. Other Radar Image Properties
A statistically significant relationship was identified between biomass and the helix scattering component derived from the Yamaguchi decomposition (, model: , , see Figure 12). A weaker yet still statistically significant association was observed for the volume scattering component from the Pauli decomposition (, model: , , see Figure 12). These results suggest that polarimetric decomposition components, particularly helix scattering, contribute to biomass estimation, albeit with limited explanatory power. The remaining SAR indices, backscatter coefficients, polarisation ratios, and other decomposition components did not show statistically significant relationships ().
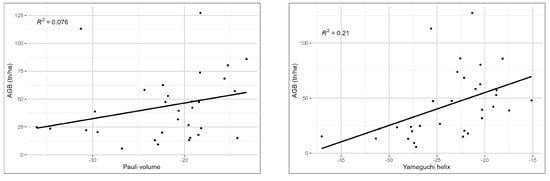
Figure 12.
Aboveground biomass (t ha−1) calculated from the Second National Native Forest Inventory [35] data for caldén (Neltuma caldenia) forest of central Argentina, as a function of the volume (green) component from the Pauli decomposition (, left) and the helix component from the Yamaguchi decomposition (, right), both obtained from SAOCOM-1A images acquired in winter 2019. The linear regression line and the value are included.
4. Discussion
This study aimed to explore the relationship between fully polarimetric SAOCOM-1A data and xerophytic caldén forest attributes—specifically, aboveground biomass and canopy cover—to assess the potential of L-band SAR data for characterising this forest type. The analysis focused primarily on the Generalised Radar Vegetation Index (GRVI) [14], along with other relevant SAR-derived parameters. The investigation of semiarid environments in Argentina is of particular importance, given that arid and semiarid regions occupy approximately 70% of the country’s land area and are highly susceptible to desertification processes [53].
Previous studies have shown the potential of SAR data for biomass characterisation in semiarid woodlands. Iglesias [53] demonstrated that L-band imagery can effectively distinguish woody vegetation types based on structural differences, although biomass estimation is limited by signal saturation above 80 t ha−1. Alvarez et al. [54] evaluated the ecological condition of the Chaco Serrano by estimating structural variables using both optical (Sentinel-2) and SAR (SAOCOM and Sentinel-1) data. In their work, volume components and GRVI effectively distinguished grasslands, shrublands, and forests, though they were less effective at separating forest types based on species composition. In another recent study [55], researchers utilised SAOCOM imagery to distinguish forested areas from other land cover types in arid and semiarid regions of Argentina. Backscattering coefficients from various SAOCOM polarisations, along with components derived from several polarimetric decompositions, were employed as predictor variables. Parameters from the Yamaguchi decomposition proved especially effective in differentiating cover types with distinct vertical structures. The authors concluded that full polarimetric SAR data substantially enhance the ability to discriminate among forest covers in these environments.
Biomass modelling in the semiarid caldén forest, using data from the Second National Native Forest Inventory [35], yielded inconclusive results but provided valuable insights. GRVI values showed limited variability (0.21 to 0.63) despite a broad range of observed biomass (5.62 t ha−1 to 127.27 t ha−1). Most regression models showed weak or non-significant relationships. Some positive trends were found in closed forest units, and a weak yet significant relationship was observed between GRVI and canopy cover (), contrasting with stronger results observed in other ecosystems [9]. Among radar-derived features, only the volume component from the Pauli decomposition and the helix component from the Yamaguchi decomposition were significantly associated with biomass, although the latter is typically linked to artificial structures [56,57].
No effect of incidence angle or acquisition submode (ranging from 25° to 33°) was detected on GRVI values (Figure 5), despite the known angular sensitivity in some polarisations [48,58,59]. Model performance may have been affected by the use of a single SAOCOM-1A image per sampling unit, and limited scene availability hindered the implementation of multitemporal analyses [60]. However, previous research has demonstrated that single acquisitions can yield satisfactory results under certain conditions [17].
While SAR data did not allow for distinguishing forest categories by density or biomass content, GRVI effectively separated woody from non-woody vegetation (Figure 4), consistent with findings by Alvarez et al. [60] and Pereira et al. [61]. Similar challenges in differentiating forest categories have been reported in the Amazon, likely due to structural complexity and L-band saturation. Likewise, Luo et al. [62] found that C-band SAR could separate vegetation from non-vegetated surfaces but could not discriminate between vegetation classes by height, whereas P-band provided better sensitivity to vertical structure.
L-band radar is generally considered more suitable for trunk biomass estimation, while C-band is more sensitive to canopy structure [11,18]. The caldén forest, characterised by low stature, xerophytic traits, and broad, horizontal crowns (Figure 2), typically exhibits low biomass (<150 t ha−1) and is often in early successional stages due to fire and deforestation [29,63]. In sparse areas, soil can strongly influence backscatter. Although L-band is generally effective in low-biomass forests [9,13,15], Zeng et al. [18] found better results with C-band in subtropical forests, suggesting that radar performance depends on forest structure and composition. Future studies in the caldén forest should, therefore, test biomass modelling using C-band data. Additionally, the use of simple regression models in this exploratory analysis may have limited predictive accuracy. Advanced machine learning methods such as Random Forest, XGBoost, and LightGBM have shown improved performance in biomass estimation [6,8], even under complex conditions, and should be considered for future modelling efforts.
The field data utilised in this study are subject to certain limitations. Some sampling units were located near disturbed areas, such as firebreaks or roads, which introduced high variability in the estimates of forest attributes. This pattern reflects the design of the Second National Native Forest Inventory [35], which established uniformly spaced sampling units based on a systematic grid. Although more sampling units were available, many lacked overlap with SAOCOM scenes, further reducing the sample size. The distribution and quality of field plots are crucial for biomass modelling [8], and while small, well-positioned samples can be effective [17,18], others advocate for larger datasets [64]. Plot design is often constrained by logistical factors, leading to uncertainty in measurements and model performance [64]. Recent studies have addressed this by incorporating LiDAR data to strengthen SAR-based biomass models [8,18].
5. Conclusions
This study conducted an exploratory analysis of full polarimetric SAOCOM-1A data to characterise the semiarid caldén forest in central Argentina, focusing on the Generalised Radar Vegetation Index (GRVI) for estimating biomass and canopy cover. Although GRVI-based forest attribute modelling yielded inconclusive results overall, some positive trends in closed forest areas suggest potential for further investigation. Additionally, GRVI effectively distinguished woody from non-woody land covers, highlighting its value for broader classification tasks. To improve modelling accuracy, future work should incorporate multitemporal analyses, additional radar frequencies such as Sentinel-1 C-band, and more extensive and representative field data. Reliable, spatially explicit information on forest attributes is essential for sustainable forest management. Machine learning techniques that integrate remote sensing data with environmental variables offer promising approaches in this sense [40]. Given the ability of radar systems to operate independently of weather and illumination conditions, applying tools like GRVI to under-represented ecosystems such as semiarid forests is key to advancing biomass and other forest attribute monitoring at regional and national scales.
Author Contributions
Conceptualisation: E.F.B., A.C.F. and J.P.A.; writing of original draft and preparation: E.F.B.; writing of review and editing: A.C.F. and J.P.A.; supervision: A.C.F. and J.P.A.; data curation: E.F.B. All authors have read and agreed to the published version of the manuscript.
Funding
This research was funded by a CONAE grant to E.F.B.
Institutional Review Board Statement
Not applicable.
Informed Consent Statement
Not applicable.
Data Availability Statement
The code and a SAOCOM data sample are available in the Github repository: https://github.com/InstitutoGulich/Tesis-MAIE-Elisa-Frank-Buss.git (accessed on 21 December 2025).
Acknowledgments
The authors acknowledge the contribution of CONAE, through the scholarship that enabled the completion of the master’s thesis of the first author, from which this paper is derived, and the provision of the SAOCOM imagery. We also thank the Ministry of Environment and Sustainable Development of Argentina for providing data from the Second National Native Forest Inventory and the spatial layers on the distribution of Argentina’s phytogeographical regions. Thanks are also due to Paccioretti P.A. for his support in the various analyses tested. The authors would also like to thank the editors, as well as the anonymous reviewers, for their valuable comments.
Conflicts of Interest
The authors declare no conflicts of interest.
Abbreviations
The following abbreviations are used in this manuscript:
| AGB | Aboveground Biomass |
| DBH | Diameter at Breast Height |
| DEM | Digital Elevation Model |
| EPSG | European Petroleum Survey Group |
| GRVI | Generalised Radar Vegetation Index |
| LiDAR | Light Detection and Ranging |
| PolSAR | Polarimetric Synthetic Aperture Radar |
| RMSE | Root Mean Square Error |
| SAOCOM | Satélite Argentino de Observación COn Microondas |
| SAR | Synthetic Aperture Radar |
| SRTM | Shuttle Radar Topography Mission |
| SU | Sampling Unit (plural = SUs) |
| WGS84 | World Geodetic System 1984 |
Appendix A
To complement the main text, we include the results of the principal tested models here. Although none of these models reached statistical significance, they are presented for completeness.
Table A1.
Results of different analyses carried out to predict attributes of the caldén (Neltuma caldenia) forest, using SAOCOM-1A SAR data, and biomass and tree cover values derived from field measurements of the Second National Native Forest Inventory [35].
Table A1.
Results of different analyses carried out to predict attributes of the caldén (Neltuma caldenia) forest, using SAOCOM-1A SAR data, and biomass and tree cover values derived from field measurements of the Second National Native Forest Inventory [35].
| Model | Dependent Variable | Predictor Variable | Equation | p-Value | |
|---|---|---|---|---|---|
| Linear regression | |||||
| AGB | GRVI_pixel | 0.00 | 0.94 | ||
| AGB | GRVI_media | 0.02 | 0.52 | ||
| Closed forest AGB | GRVI_media | 0.05 | 0.51 | ||
| Closed forest AGB (n = 10) | GRVI_media | 0.37 | 0.06 | ||
| Tree cover | GRVI_pixel | 0.07 | 0.11 | ||
| Tree cover (n = 31) | GRVI_media | 0.10 | 0.05 | ||
| AGB | Pauli green component | 0.14 | 0.03 | ||
| AGB | Yamaguchi helix component | 0.21 | 0.01 | ||
| Quantile regressions | |||||
| quantile: 0.1 | AGB | GRVI_media | – | 0.10 | |
| quantile: 0.2 | AGB | GRVI_media | – | 0.42 | |
| quantile: 0.3 | AGB | GRVI_media | – | 0.45 | |
| quantile: 0.4 | AGB | GRVI_media | – | 0.24 | |
| quantile: 0.5 | AGB | GRVI_media | – | 0.06 | |
| quantile: 0.6 | AGB | GRVI_media | – | 0.29 | |
| quantile: 0.7 | AGB | GRVI_media | – | 0.16 | |
| quantile: 0.8 | AGB | GRVI_media | – | 0.49 | |
| quantile: 0.9 | AGB | GRVI_media | – | 0.36 | |
| quantile: 0.1 | Tree cover | GRVI_media | – | 0.87 | |
| quantile: 0.2 | Tree cover | GRVI_media | – | 0.22 | |
| quantile: 0.3 | Tree cover | GRVI_media | – | 0.29 | |
| quantile: 0.4 | Tree cover | GRVI_media | – | 0.13 | |
| quantile: 0.5 | Tree cover | GRVI_media | – | 0.48 | |
| quantile: 0.6 | Tree cover | GRVI_media | – | 0.53 | |
| quantile: 0.7 | Tree cover | GRVI_media | – | 0.23 | |
| quantile: 0.8 | Tree cover | GRVI_media | – | 0.40 | |
| quantile: 0.9 | Tree cover | GRVI_media | – | 0.37 | |
| Polynomial regressions | |||||
| Second order | AGB | GRVI_pixel | 0.08 | 0.29 | |
| Third order | AGB | GRVI_media | 0.10 | 0.39 | |
| Fourth order | AGB | GRVI_media | 0.10 | 0.56 | |
| Second order | Tree cover | GRVI_media | 0.07 | 0.33 | |
| Third order | Tree cover | GRVI_media | 0.12 | 0.26 | |
| Fourth order | Tree cover | GRVI_media | 0.13 | 0.39 | |
| Linear mixed models | |||||
| Factor: SAOCOM orbit (A: ascending, D: descending) | AGB | GRVI_media | 0.01 | 0.79 | |
| Factor: SAOCOM submode (S5, S6, S7, S8) | AGB | GRVI_media | + 11.96 (S6) + 47.40 (S7) + 5.88 (S8) | 0.19 | 0.20 |
| Factor: SAOCOM orbit (A: ascending, D: descending) | Tree cover | GRVI_media | 0.08 | 0.27 | |
| Factor: SAOCOM submode (S5, S6, S7, S8) | Tree cover | GRVI_media | - 8.09 (S6) + 27.06 (S7) + 12.78 (S8) | 0.21 | 0.14 |
References
- Winkler, K.; Fuchs, R.; Rounsevell, M.; Herold, M. Global land use changes are four times greater than previously estimated. Nat. Commun. 2021, 12, 2501. [Google Scholar] [CrossRef] [PubMed]
- Forster, P.M.; Smith, C.J.; Walsh, T.; Lamb, W.F.; Lamboll, R.; Hauser, M.; Ribes, A.; Rosen, D.; Gillett, N.; Palmer, M.D.; et al. Indicators of Global Climate Change 2022: Annual update of large-scale indicators of the state of the climate system and human influence. Earth Syst. Sci. Data 2023, 15, 2295–2327. [Google Scholar] [CrossRef]
- Potapov, P.; Hansen, M.C.; Pickens, A.; Hernandez-Serna, A.; Tyukavina, A.; Turubanova, S.; Zalles, V.; Li, X.; Khan, A.; Stolle, F.; et al. The Global 2000-2020 Land Cover and Land Use Change Dataset Derived From the Landsat Archive: First Results. Front. Remote Sens. 2022, 3, 856903. [Google Scholar] [CrossRef]
- Pausas, J.G.; Keeley, J.E. Wildfires and global change. Front. Ecol. Environ. 2021, 19, 387–395. [Google Scholar] [CrossRef]
- Dang, H.N.; Ba, D.D.; Trung, D.N.; Viet, H.N.H. A Novel Method for Estimating Biomass and Carbon Sequestration in Tropical Rainforest Areas Based on Remote Sensing Imagery: A Case Study in the Kon Ha Nung Plateau, Vietnam. Sustainability 2022, 14, 6857. [Google Scholar] [CrossRef]
- Li, Y.; Li, M.; Wang, Y. Forest Aboveground Biomass Estimation and Response to Climate Change Based on Remote Sensing Data. Sustainability 2022, 14, 4222. [Google Scholar] [CrossRef]
- Shiney, S.S.A.; Geetha, R.; Seetharaman, R.; Shanmugam, M. Leveraging Deep Learning Models for Targeted Aboveground Biomass Estimation in Specific Regions of Interest. Sustainability 2024, 16, 4864. [Google Scholar] [CrossRef]
- Song, J.; Liu, X.; Adingo, S.; Guo, Y.; Li, Q. A Comparative Analysis of Remote Sensing Estimation of Aboveground Biomass in Boreal Forests Using Machine Learning Modeling and Environmental Data. Sustainability 2024, 16, 7232. [Google Scholar] [CrossRef]
- Naidoo, L.; Mathieu, R.; Main, R.; Kleynhans, W.; Wessels, K.; Asner, G.; Leblon, B. Savannah woody structure modelling and mapping using multi-frequency (X-, C- and L-band) Synthetic Aperture Radar data. ISPRS J. Photogramm. Remote Sens. 2015, 105, 234–250. [Google Scholar] [CrossRef]
- Wiederkehr, N.C.; Gama, F.F.; Castro, P.B.N.; Bispo, P.d.C.; Balzter, H.; Sano, E.E.; Liesenberg, V.; Santos, J.R.; Mura, J.C. Discriminating Forest Successional Stages, Forest Degradation, and Land Use in Central Amazon Using ALOS/PALSAR-2 Full-Polarimetric Data. Remote Sens. 2020, 12, 3512. [Google Scholar] [CrossRef]
- Woodhouse, I.H. Introduction to Microwave Remote Sensing; Taylor & Francis Group: Boca Raton, FL, USA, 2006; p. 397. [Google Scholar]
- Wulder, M.A.; Franklin, S.E. Understanding Forest Disturbance and Spatial Pattern: Remote Sensing and GIS Approaches, 1st ed.; CRC Press: Boca Raton, FL, USA, 2006; p. 246. [Google Scholar]
- Schlund, M.; Davidson, M. Aboveground Forest Biomass Estimation Combining L- and P-Band SAR Acquisitions. Remote Sens. 2018, 10, 1151. [Google Scholar] [CrossRef]
- Ratha, D.; Mandal, D.; Kumar, V.; Mcnairn, H.; Bhattacharya, A.; Frery, A.C. A Generalized Volume Scattering Model-Based Vegetation Index from Polarimetric SAR Data. IEEE Geosci. Remote Sens. Lett. 2019, 16, 1791–1795. [Google Scholar] [CrossRef]
- Hajnsek, I.; Desnos, Y.L. (Eds.) Polarimetric Synthetic Aperture Radar; Remote Sensing and Digital Image Processing; Springer International Publishing: Cham, Switzerland, 2021; Volume 25, pp. 221–253. [Google Scholar] [CrossRef]
- Mandal, D.; Kumar, V.; Ratha, D.; Lopez-Sanchez, J.M.; Bhattacharya, A.; McNairn, H.; Rao, Y.S.; Ramana, K.V. Assessment of rice growth conditions in a semi-arid region of India using the Generalized Radar Vegetation Index derived from RADARSAT-2 polarimetric SAR data. Remote Sens. Environ. 2020, 237, 111561. [Google Scholar] [CrossRef]
- Liu, Z.; Michel, O.O.; Wu, G.; Mao, Y.; Hu, Y.; Fan, W. The Potential of Fully Polarized ALOS-2 Data for Estimating Forest Above-Ground Biomass. Remote Sens. 2022, 14, 669. [Google Scholar] [CrossRef]
- Zeng, P.; Zhang, W.; Li, Y.; Shi, J.; Wang, Z. Forest Total and Component Above-Ground Biomass (AGB) Estimation through C-and L-band Polarimetric SAR Data. Forests 2022, 13, 442. [Google Scholar] [CrossRef]
- Antropov, O.; Rauste, Y.; Hame, T. Volume scattering modeling in PolSAR decompositions: Study of ALOS PALSAR data over boreal forest. IEEE Trans. Geosci. Remote Sens. 2011, 49, 3838–3848. [Google Scholar] [CrossRef]
- Seppi, S.; López-Martínez, C.; Joseau, M.J. An Assessment of SAOCOM L -Band PolInSAR Capabilities for Canopy Height Estimation: A Case Study Over Managed Forests in Argentina. IEEE J. Sel. Top. Appl. Earth Obs. Remote Sens. 2024, 17, 5001–5014. [Google Scholar] [CrossRef]
- INVAP en la Misión SAOCOM. Available online: http://saocom.invap.com.ar/ (accessed on 14 September 2021).
- Flores-Anderson, A.I.; Herndon, K.E.; Thapa, R.B.; Cherrington, E. THE SAR HANDBOOK Comprehensive Methodologies for Forest Monitoring and Biomass Estimation; NASA Marshall Space Flight Center: Huntsville, AL, USA, 2019; pp. 1–307. [CrossRef]
- David, R.M.; Rosser, N.J.; Donoghue, D.N. Improving above ground biomass estimates of Southern Africa dryland forests by combining Sentinel-1 SAR and Sentinel-2 multispectral imagery. Remote Sens. Environ. 2022, 282, 113232. [Google Scholar] [CrossRef]
- Frank Buss, M.E.; Leizica, E.; Peinetti, R.; Noellemeyer, E. Relationships between landscape features, soil properties, and vegetation determine ecological sites in a semiarid savanna of central Argentina. J. Arid Environ. 2020, 173, 104038. [Google Scholar] [CrossRef]
- González-Roglich, M.; Swenson, J.J.; Villarreal, D.; Jobbágy, E.G.; Jackson, R.B. Woody Plant-Cover Dynamics in Argentine Savannas from the 1880s to 2000s: The Interplay of Encroachment and Agriculture Conversion at Varying Scales. Ecosystems 2015, 18, 481–492. [Google Scholar] [CrossRef]
- Menéndez, J.; La Rocca, S. Primer Inventario Nacional De Bosques Nativos. Segunda Etapa: Inventario De Campo De La Región Espinal Distritos Caldén Y Ñandubay; Technical Report; Secretaría de Ambiente y Desarrollo Sustentable de la Nación: Buenos Aires, Argentina, 2007.
- Cabrera, A.L. Regiones Fitogeográficas Argentinas; Editorial ACME S.A.C.I: Buenos Aires, Argentina, 1976. [Google Scholar]
- Casagrande, G. Inventario Integrado de los Recursos Naturales de la provincia de La Pampa; Universidad Nacional de la Pampa: Santa Rosa, Argentina, 1980. [Google Scholar]
- Medina, A.A.; Dussart, E.G.; Estelrich, H.D.; Morici, E. Reconstrucción de la historia del fuego en un bosque de Prosopis caldenia (Burk.) de Arizona, sur de la provincia de San Luis. Multequina 2000, 9, 91–98. [Google Scholar]
- Peinetti, R.; Pereyra, M.; Kin, A.; Sosa, A. Effects of cattle ingestion on viability and germination rate of calden (Prosopis caldenia) seeds. J. Range Manag. 1993, 46, 483. [Google Scholar] [CrossRef]
- González-Roglich, M.; Swenson, J.J.; Jobbágy, E.G.; Jackson, R.B. Shifting carbon pools along a plant cover gradient in woody encroached savannas of central Argentina. For. Ecol. Manag. 2014, 331, 71–78. [Google Scholar] [CrossRef]
- Bogino, S.; Roa-Giménez, S.C.; Velasco-Sastre, A.T.; Cangiano, M.L.; Risio-Allione, L.; Rozas, V. Synergetic effects of fire, climate, and management history on Prosopis caldenia recruitment in the Argentinean pampas. J. Arid Environ. 2015, 117, 59–66. [Google Scholar] [CrossRef]
- Peinetti, H.R.; Bestelmeyer, B.B.T.; Chirino, C.C.C.; Kin, A.G.A.; Frank Buss, M.E.M. Generalized and Specific State-and-Transition Models to Guide Management and Restoration of Caldenal Forests. Rangel. Ecol. Manag. 2019, 72, 230–236. [Google Scholar] [CrossRef]
- Comisión Nacional de Actividades Espaciales. SAOCOM-1 Level 1 Product Format; Technical Report; Comisión Nacional de Actividades Espaciales: Buenos Aires, Argentina, 2020.
- Ministerio de Ambiente y Desarrollo Sostenible. Segundo Inventario Nacional De Bosques Nativos (INBN2). Informe Regiones forestales Espinal y Delta e islas del río Paraná. Primera Revisión; Technical Report; Ministerio de Ambiente y Desarrollo Sostenible: Buenos Aires, Argentina, 2020.
- European Space Agency. SNAP—ESA Sentinel Application Platform v8.0.0. Available online: https://step.esa.int/main/snap-8-0-released (accessed on 23 May 2022).
- NASA Jet Propulsion Laboratory. NASA Shuttle Radar Topography Mission Global 3 Arc Second [Data Set]. 2013. Available online: https://www.earthdata.nasa.gov/data/catalog/lpcloud-srtmgl3-003 (accessed on 19 May 2022).
- R Core Team. R: A Language and Environment for Statistical Computing; R Foundation for Statistical Computing: Vienna, Austria, 2021. [Google Scholar]
- RStudio Team. RStudio: Integrated Development Environment for R; RStudio, PBC: Boston, MA, USA, 2022. [Google Scholar]
- Li, H.; Lu, J.; Tian, G.; Yang, H.; Zhao, J.; Li, N. Crop Classification Based on GDSSM-CNN Using Multi-Temporal RADARSAT-2 SAR with Limited Labeled Data. Remote Sens. 2022, 14, 3889. [Google Scholar] [CrossRef]
- Ratha, D.; De, S.; Celik, T.; Bhattacharya, A. Change Detection in Polarimetric SAR Images Using a Geodesic Distance Between Scattering Mechanisms. IEEE Geosci. Remote Sens. Lett. 2017, 14, 1066–1070. [Google Scholar] [CrossRef]
- Ratha, D.; Bhattacharya, A.; Frery, A.C. Unsupervised classification of PolSAR data using a scattering similarity measure derived from a geodesic distance. IEEE Geosci. Remote Sens. Lett. 2018, 15, 151–155. [Google Scholar] [CrossRef]
- Mandal, D.; Ratha, D.; Bhattacharya, A.; Kumar, V.; McNairn, H.; Rao, Y.S.; Frery, A.C. A Radar Vegetation Index for Crop Monitoring Using Compact Polarimetric SAR Data. IEEE Trans. Geosci. Remote Sens. 2020, 58, 6321–6335. [Google Scholar] [CrossRef]
- Kim, Y.; Van Zyl, J.J. A time-series approach to estimate soil moisture using polarimetric radar data. IEEE Trans. Geosci. Remote Sens. 2009, 47, 2519–2527. [Google Scholar] [CrossRef]
- Pope, K.O.; Rey-Benayas, J.M.; Paris, J.F. Radar remote sensing of forest and wetland ecosystems in the Central American tropics. Remote Sens. Environ. 1994, 48, 205–219. [Google Scholar] [CrossRef]
- Cloude, S.; Pottier, E. A review of target decomposition theorems in radar polarimetry. IEEE Trans. Geosci. Remote Sens. 1996, 34, 498–518. [Google Scholar] [CrossRef]
- Van Zyl, J.J. Application of Cloude’s target decomposition theorem to polarimetric imaging radar data. Radar Polerimetry 1992, 1748, 184–191. [Google Scholar]
- Freeman, A.; Durden, S.L. A three-component scattering model for polarimetric SAR data. IEEE Trans. Geosci. Remote Sens. 1998, 36, 963–973. [Google Scholar] [CrossRef]
- Yamaguchi, Y.; Moriyama, T.; Ishido, M.; Yamada, H. Four-component scattering model for polarimetric SAR image decomposition. IEEE Trans. Geosci. Remote Sens. 2005, 43, 1699–1706. [Google Scholar] [CrossRef]
- Chave, J.; Réjou-Méchain, M.; Búrquez, A.; Chidumayo, E.; Colgan, M.S.; Delitti, W.B.; Duque, A.; Eid, T.; Fearnside, P.M.; Goodman, R.C.; et al. Improved allometric models to estimate the aboveground biomass of tropical trees. Glob. Chang. Biol. 2014, 20, 3177–3190. [Google Scholar] [CrossRef]
- Hernández Stefanoni, J.L.; Castillo Santiago, M.Á.; Mauricio, J.A.; Mas, J.F.; Tun Dzul, F.; Dupuy Rada, J.M. Mapeo de la Biomasa Aérea de los Bosques Mediante Datos de Sensores Remotos y R; El Colegio de la Frontera Sur: Chetumal, Mexico; Centro de Investigación Científica de Yucatán: Mérida, Mexico, 2021; p. 129. [Google Scholar]
- West, B.T.; Welch, K.B.; Galecki, A.T. Linear Mixed Models; Number Mi; Chapman and Hall/CRC: Boca Raton, FL, USA, 2014; pp. 5–24. [Google Scholar] [CrossRef]
- Iglesias, M.d.R. Utilización de SAR Para la Estimación de Biomasa Forestal en el Chaco Aemiárido; Technical Report; Instituto Mario Gulich: Córdoba, Argentina, 2013. [Google Scholar]
- Alvarez, M.P.; Bellis, L.M.; Arcamone, J.R.; Silvetti, L.E.; Gavier-Pizarro, G. Ecological condition indicators for dry forest: Forest structure variables estimation with NDVI texture metrics and SAR variables. Remote Sens. Appl. Soc. Environ. 2025, 37, 101485. [Google Scholar] [CrossRef]
- Agost, L.; Pascual, I.; Britos, H.A. Use of Argentine SAOCOM SAR polarimetric L-band satellites for classification of arid and semiarid native forests. Int. J. Remote Sens. 2025, 46, 2568–2586. [Google Scholar] [CrossRef]
- Yamaguchi, Y. Polarimetric SAR Imaging; CRC Press: Boca Raton, FL, USA, 2020. [Google Scholar] [CrossRef]
- Persson, H.J.; Mukhopadhyay, R.; Huuva, I.; Fransson, J.E. Comparison of Boreal Biomass Estimations Using C- and X-Band Polsar. In Proceedings of the IGARSS 2022—2022 IEEE International Geoscience and Remote Sensing Symposium, Kuala Lumpur, Malaysia, 17–22 July 2022; pp. 5555–5558. [Google Scholar] [CrossRef]
- Huang, W.; Sun, G.; Ni, W.; Zhang, Z.; Dubayah, R. Sensitivity of multi-source SAR backscatter to changes in forest aboveground biomass. Remote Sens. 2015, 7, 9587–9609. [Google Scholar] [CrossRef]
- Liesenberg, V. Mapping Tropical Successional Forest Stages using Multifrequency Sar. In Proceedings of the IEEE International Geoscience and Remote Sensing Symposium, IGARSS 2022, Kuala Lumpur, Malaysia, 17–22 July 2022; pp. 5638–5641. [Google Scholar] [CrossRef]
- Alvarez, M.P.; Silvetti, L.E.; Arcamone, J.R.; Pizarro, G.G.; Bellis, L.M. Evaluation of the Response of Vegetation Covers to PolSAR Decomposition Variables in L-Band. In Proceedings of the 2024 7th IEEE Biennial Congress of Argentina, ARGENCON 2024, San Miguel de Tucuman, Argentina, 6–8 June 2018; Institute of Electrical and Electronics Engineers Inc.: Piscataway, NJ, USA, 2024. [Google Scholar] [CrossRef]
- Pereira, L.O.; Freitas, C.C.; Sant’Anna, S.J.S.; Reis, M.S. ALOS/PALSAR Data Evaluation for Land Use and Land Cover Mapping in the Amazon Region. IEEE J. Sel. Top. Appl. Earth Obs. Remote Sens. 2016, 9, 5413–5423. [Google Scholar] [CrossRef]
- Luo, Z.; Du, L.; Liu, L.; Gan, Y.; Liu, K.; Li, C. Study on Polarimetric Scattering Characteristics of Different Band SAR Images Based on Chinese Airborne Sar System. In Proceedings of the IEEE International Geoscience and Remote Sensing Symposium, IGARSS 2022, Kuala Lumpur, Malaysia, 17–22 July 2022; pp. 2546–2549. [Google Scholar] [CrossRef]
- Medina, A.A. Fire regime reconstruction in a Prosopis caldenia woodland, La Pampa, Argentina. Bosque 2007, 28, 234–240. [Google Scholar] [CrossRef]
- Khati, U.; Lavalle, M.; Singh, G. The Role of Time-Series L-Band SAR and GEDI in Mapping Sub-Tropical Above-Ground Biomass. Front. Earth Sci. 2021, 9, 1–17. [Google Scholar] [CrossRef]
Disclaimer/Publisher’s Note: The statements, opinions and data contained in all publications are solely those of the individual author(s) and contributor(s) and not of MDPI and/or the editor(s). MDPI and/or the editor(s) disclaim responsibility for any injury to people or property resulting from any ideas, methods, instructions or products referred to in the content. |
© 2025 by the authors. Licensee MDPI, Basel, Switzerland. This article is an open access article distributed under the terms and conditions of the Creative Commons Attribution (CC BY) license.