Abstract
Groundwater wells are essential for sustaining biodiversity in arid and hyper-arid regions. Wells are easily affected by external disturbances, particularly in hyper-arid regions like the Siwa Oasis, where the environmental variables influencing groundwater communities remain understudied. This study assessed the quality of several groundwater wells and agricultural drains based on the physical, chemical and hydrochemical parameters. The results classified the wells and drains into three distinct groups: (1) highly mineralized, carbonated systems with high concentrations of potassium, calcium, sodium, magnesium, chloride, and sulfate, and an average electrical conductivity (EC) of 12.01 mS/cm; (2) low-mineralized wells with an average EC of 2.15 mS/cm; and (3) a moderate one averaging 7.77 mS/cm. The major ions were dominated by Na+ (59.3%) and Mg2+ (26.8%) for cations, and Cl− (79.1%) and SO42− (13.4%) for anions in meq/L. Collectively, the evaluation based on total dissolved solids (TDS), sodium percentage (Na%), sodium adsorption ratio (SAR), and the US Salinity Laboratory (USSL) diagram revealed that about 80% of the analyzed wells are unsuitable for irrigation, with only three wells (W03, W12, and W16) deemed suitable for drinking. These findings confirmed a critical vulnerability of the oasis ecosystem. The uncontrolled and extensive use of finite, non-renewable aquifers for agricultural and other purposes is directly exacerbating water salinization and soil sodicity, posing a threat to the future sustainability of the oasis’s water resources.
1. Introduction
Freshwater scarcity has become a critical global challenge, threatening the livelihoods of billions of people. Increasing population growth, climate change, industrialization, and urbanization are all contributing to the rising demand for clean and reliable water resources [1,2]. Currently, several countries are facing severe water shortages, which are intensifying competition for water and lead to socioeconomic problems, particularly in agricultural, industrial, and domestic sectors [3,4]. Additionally, water scarcity has drastic ecological consequences, threatening biodiversity and ecosystem stability [5].
The excessive increase in dissolved solutes from various sources—such as agricultural flux, intrusion of saline water, industrial wastes, anthropogenic activities, and mineral dissolution—has exacerbated the salinization of groundwater. This degradation poses a direct threat to water supplies and greatly impacts agricultural, leading to reduced crop productivity and soil degradation [6].
Therefore, multifaceted efforts, including proper management, pollution control efforts, and the adoption of modern irrigation techniques, are needed to safeguard this invaluable resource, which is vital for both human health and sustainable socio-economic development [7,8].
Dependence on groundwater has become an essential in response to the scarcity of freshwater, particularly in semi-arid and arid regions, where it is important for domestic, agricultural, and industrial needs [9,10]. Industrialization, agriculture expansion, and rapid urbanization have greatly impacted groundwater quality [11]. Dissolved solutes, originating from both geological sources and human activities, contribute to the deterioration of groundwater characteristics [12]. Elevated concentrations of these solutes pose serious health risks. Increased nitrate values can lead to blue baby syndrome, “methemoglobinemia”, digestive tract cancer and other disorders [13,14]. Arsenic contamination represents one of the most dangerous groundwater issues, leading to various skin diseases, especially skin carcinoma [15].
The Siwa Oasis is situated in the arid Western Desert, Egypt. It is renowned for its natural beauty and cultural significance. Surrounded by sand dunes, rocky landscapes, and salt flats, it is famous for its olive and date palm groves; hot freshwater wells; and hypersaline, pristine salt lakes. Groundwater wells in the Siwa Oasis serve as a lifeline for local communities and are a vital resource for sustainable agricultural needs. These wells are fed primarily by two key aquifers: the Tertiary carbonate aquifer and the Nubian aquifer. In addition, the oasis owns several pristine freshwater wells that supply numerous wells scattered throughout the oasis [16,17]. Agriculture in Siwa, particularly olive and date palm cultivation, depends mainly on these wells. However, in recent years, many wells have experienced increasing salinity, negatively impacting both the yield and quality of the oasis’s main crops.
The urgent development of a management plan for the finite groundwater resource of the Siwa Oasis is essential for maintaining the oasis’s long-time sustainability. These non-renewable water resources (wells) face great environmental threats. This study assesses the hydrochemical status of certain key wells and agricultural drains, thereby measuring a core sustainability challenge: degradation of water quality, particularly from water salinization, which is linked to unsustainable and extensive agricultural use of aquifers. This salinization has drawbacks that impact soil health through increasing sodicity, reducing crop production, and threatening food security and ecological integrity. In this respect, the investigation of water quality is vital to defining and addressing the challenges facing the sustainable development of the oasis, as it offers the essential empirical data required for implementing effective management frameworks for this vital resource that are essential to ensure its continued availability in this unique desert environment [18]. To achieve a prolonged agricultural sustainability, including crop safety, reliable local production of food, and public health, integrated water resource management is necessary, particularly in the case of water scarcity and variable water quality, as observed in the Siwa Oasis [19]
This study aims (1) to assess the groundwater quality based on physico-chemical and hydrochemical characteristics; (2) to classify groundwater systems according to their mineralization levels; (3) to identify suitability for agricultural irrigation and human consumption; and (4) to assess the extent to which human activities and natural environmental factors affect groundwater quality
2. Materials and Methods
2.1. Site Description
The historic Siwa Oasis, a major Egyptian urban oasis in the Western Desert, is located approximately 23 m below sea level. It occupies an area of about 1100 km2 between the Qattarah Depression and Great Sand Sea, situated about 750 km from Cairo and 50 km from Eastern Egyptian–Libyan borders [20]. This elongated landscape—about 80 long and 9–28 km in width—is dominated by saline lakes, salt flats (sabkhas), and marches, with cultivated land accounting about 5% of its total area [21]. A detailed summary of the Siwa Oasis’s morphological, geological, and hydrology criteria is found in Table 1 and Figure 1. The most-studied water bodies are artificial wells constructed around the emergence sites. These structures, made of stones, vary in size from tens to several hundred square meters in area and are 1–10 m deep. Their water levels are managed to meet irrigation needs. The clear well water is transported through concrete channels primarily for agricultural, and sometimes also for recreational purposes. The high water clarity enables light penetration, promoting the growth of dense microbial biofilms at the bottom. As these biofilms die, they detach, forming thick, floating microbial mats.

Table 1.
The major morphological, geological, and hydrological features of the Siwa Oasis [22,23,24].
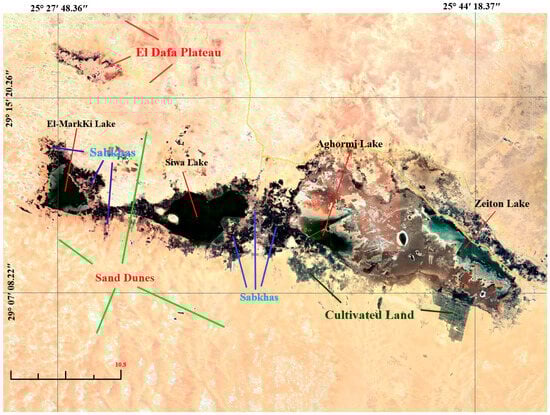
Figure 1.
Geological map of the Siwa Oasis, showing major formations and structures.
2.2. Sampling Program and Water Sampling
During four successive seasons, from winter 2023 to autumn 2023, a total of 80 water samples were collected from subsurface points at seventeen wells and three main agricultural drains (Table 2 and Figure 2). A Ruttner water sampler (2.5 L) was employed to collect the water samples. Care was taken to avoid collecting water samples near any floating microbial mats when present. The collected samples were kept in clean, labeled bottles.
Table 2.
Collected samples from the main drain and wells in the Siwa Oasis.

Figure 2.
Map of the Siwa Oasis, showing the locations of sampled wells and agricultural drains Red symbols denote the sampling wells and drains, while blue shapes indicate the main saline lakes in Siwa Oasis.
2.3. Chemical Analysis
Water quality analysis followed the standard methods outlined by APHA [25]. In situ parameters, including pH, temperature, turbidity (NTU), salinity (‰), and electrical conductivity (mS/cm), were measured directly using a calibrated multi-parameter probe (Hanna model HI9829). TDS values were determined using the oven-drying method at 180 °C. Dissolved oxygen was quantified via modified Winkler method, and a 5-day method was used to determine the biological oxygen demand. Chemical oxygen demand was analyzed using potassium permanganate method. Major ions were measured titrimetrically for carbonate, bicarbonate, magnesium, calcium, and chloride. Meanwhile, sulfate concentration was evaluated turbidimetrically, and spectrophotometrically quantified at 420 nm. The flame photometer model (Jenway Felsted UK) was used for measuring sodium and potassium values. Nutrient salts analysis for nitrite (NO2−), nitrate (NO3−), ammonium ion (NH4+), orthophosphate (PO43−), total phosphorus, and silicate was performed colorimetrically using a double-beam spectrophotometer (model Jenway 6800 UV/VIS).
2.4. Water Quality and Irrigation Indices
Water quality index (WQI) was conducted according to the method provided by the Canadian Council of Ministers of the Environment (CCME) [26]. Data of fecal coliform used for the WQI calculation were sourced from a published study by Abdelkarim et al. [18] that investigated the biological characteristics of the same sampling sites. Additional indices—including the base-exchange index (r1), meteoric-genesis index (r2), chloro-alkaline indices (CAI 1 and CAI II), and sodium adsorption ratio (SAR)—were conducted to evaluate water suitability for irrigation. The equations used for calculating these indices are summarized in Table 3.
Table 3.
Equations utilized for calculating various water indices for drinking, geochemical, and irrigation purposes.
3. Results and Discussion
3.1. Physico-Chemical Properties
Table 4 shows the measured contents of some physico-chemical variables from the sampled sites, with the corresponding drinking water guideline limits cited by World Health Organization [32]. The water suitability for drinking is strongly influenced by pH levels; values below 6.5 can make water corrosive, while those above 9 may pose health risks [33]. The mean values of pH for the analyzed samples varied from 7.06 to 8.75, which fall within the standard acceptable pH range (6.5–9.0) and indicate an alkaline nature. Water temperature averaged 21.36 °C and varied from 16.60 to 27.75 °C. However, certain wells (for example, W16) are naturally geothermally warm, with values reaching up 44.26 °C, a value that surpasses the permissible limits of 35 °C.
Table 4.
Mean physico-chemical characteristics of primary agricultural drains and certain wells in the Siwa Oasis versus WHO [32] groundwater guidelines.
Salinity, TDS, and EC showed similar spatial trends among the water samples, reflecting their intrinsic relationship [34]. TDS values varied from 0.170 to 8.62 g/L, salinity ranged from 0.15 to 7.73 ‰, and EC ranged from 0.32 to 13.45 mS/cm. Applying Todd’s classification for groundwater based on TDS values [35]—fresh (0.25–1.00 g/L), brackish (1.00–10.00 g/L), and saline (10.0–100.0 g/L)—only three wells (17.6%) were categorized as fresh, whereas the majority (82.4%) fell within the brackish category. As a result, most wells in the studied samples exceeded the permissible TDS thresholds for both irrigation water (1500 mg/L) and drinking water (1000 mg/L).
Turbidity measurements fell within normal ranges, ranging from 0.31 to 13.58 NTU. Concentrations of dissolved oxygen (DO) were generally elevated in cooler wells, with a mean of approximately 4.00 mg/L. Conversely, warmer wells exhibited reduced DO values, especially in W16, where a temperature of 44.26 °C corresponded to a DO content of just 1.24 mg/L [36]. Both BOD and COD showed limited variation, within slightly narrow ranges of 0.21–2.28 mg/L and 0.62–18.87 mg/L. Neither parameter surpassed standard permissible limits for drinking and irrigation water.
Nitrite (NO2−-N) concentrations were marginally higher in drainage water compared to well water, with values ranging from 1.87 to 7.98 µg/L. Nitrate (NO3−-N) values varied between 175.5 and 1620.2 µg/L. The notably elevated nitrate values at sites W16 and W06 are likely due to human influences, such as agricultural runoff, animal waste, and soil leaching [37]. Ammonium ion (NH4+-N) concentrations varied widely, from 25.2 to 285.3 µg/L. Ammonium levels were lower than nitrate concentration in the study area, reflecting the oxidation of ammonia to nitrate via nitrification process, especially in presence of DO [38]. Orthophosphate (PO43−) and total phosphorus (TP) values followed a similar distribution trend, with concentrations ranging from 9.30 to 204.8 µg/L and from 46.4 to 1023.6 µg/L, respectively.
3.2. Hydrogeochemical Criteria of Groundwater
Estimating the major cation and anion contents in groundwater is essential for categorizing its hydrochemical type. The concentration and distribution of these ions are largely controlled by the water–rock interaction in the aquifer [39]. Sodium (Na+) and magnesium (Mg2+) ions were the predominant cations, constituting average ratios of 59.3% and 26.8% of the total cationic equivalent (in meq/L). Their concentration ranges were 0.87–79.3 meq/L and 0.76–39.12 meq/L, respectively. In contrast, Ca2+ and K+ contributed smaller proportions, averaging 8.7% and 5.2%, with concentrations ranging from 0.19 to 11.9 meq/L and from 0.23 and 5.98 meq/L (Table 5). The rock weathering and mineral dissolution from the soils are the principal factors for the elevated levels of Na+ and Mg2+ ions among the major cations [40]. The notably lower concentration of Ca2+ relative to Na+ suggests an active cation-exchange process, reflecting a higher dominance of alkali metals over alkaline earth metals in the groundwater system [41].
Table 5.
The ionic composition of main agricultural drains and some wells in the Siwa Oasis.
Chloride (Cl−) and sulfate (SO42−) ions were predominant anions, comprising average ratios of 79.1% and 13.4% of the total anionic equivalent (in meq/L), with concentrations ranging from 0.37 to 93.79 meq/L and 0.18 to 26.57 meq/L, respectively. These were followed by bicarbonate (HCO3−) ions, which accounted for 3.5% of total anions, with values varied between 1.23 and 5.33 meq/L. It is clear that the concentrations of major cations and anions exceeded the WHO’s permissible limits [32] in most samples, except in wells W03, W12, and W16. Therefore, only these three wells (W03, W12, and W16) were deemed suitable for drinking and irrigation purposes. Overall, the relative abundance of major ions, based on their percentage of the total ionic equivalent (in meq/L), followed the order Cl− (39.97%) > Na+ (29.31%) > Mg2+ (13.29%) > SO42− (8.86%) > Ca2+ (4.30%) > K+ (2.56%) > HCO3− (1.71%) (Figure 3).
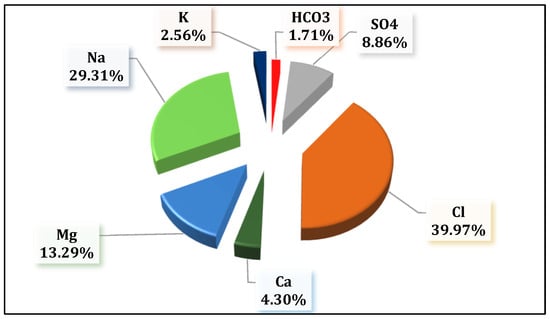
Figure 3.
Average dominance percentage of major anion and cation concentrations (meq/L) of the studied area.
To verify analytical accuracy, the ion-balance error was calculated for major anion and cation concentrations using Appelo and Postma [42]. The data revealed that 95% of the analyzed samples fell within the acceptable error range, with only one sample exceeding the 5% (Table 5).
3.3. Water Quality Assessment for Drinking Water
The water quality indices (WQIs) were computed using two distinct methods (Equations (1) and (2), Table 3) to assess water suitability for drinking. Each index considers different chemical parameters. The CCME-WQI [26] includes all studied parameters, whereas NSF-WQI [27] focuses on turbidity, change in temperature, DO, pH, BOD, TP, NO3, and fecal coliform bacteria (FC). Both indices were calculated for wells (W01–W17) but were not applicable for drainage water samples (D1-D3) (Figure 4). The results show that only 17.6% of the wells (W03, W12, and W16) are suitable for drinking-water purposes, classified as “good” with a score of ≥71% [43]. The remaining 82.4% of samples were classified as undesirable for drinking. According to Davies and DeWiest [44], drinking-water suitability based on TDS concentrations is classified as follows: <500 mg/L is desirable, 500–1000 mg/L is permissible, and >1000 mg/L is unsuitable. The TDS results confirmed that most of the samples exceeded the unsuitable threshold (>1000 mg/L), making them unfit for human consumption [45,46].
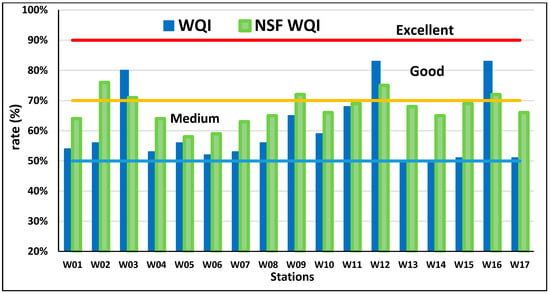
Figure 4.
Water quality indices for assessing groundwater’s suitability as drinking water, the horizontal lines represent distinct WQI thresholds: >91 (red line, Excellent), 71–90 (yellow line Good), and 51–70 (blue line, Medium).
3.4. Hydrogeochemical Types and Evaluation of Groundwater
Piper [47] introduced an effective diagram based on the relative proportions of major ions. This diagram is used to identify the hydrogeochemical water types according to their position in the diamond part of the diagram. The major anion and cation concentrations are represented in the diagram as milliequivalents per liter (meq/L). The left triangle of the diagram displays the dominant cations, the right triangle shows the dominant anions, and their combined relationships are reflected in the central diamond. Groundwater samples with similar characteristics aggregate together in the diagram, making it easier to distinguish and identify the different water types. Plotting the results on a Piper diagram (Figure 5) revealed that 65% of the samples were Na+ type and 35% were mixed type based on cation content. For anions, 95% of the samples were Cl− type, and 5% were HCO3 type. Consequently, four groundwater types were identified: 65% of the samples were Na-Cl type, 25% were Ca-Cl type, 5% were Mg-HCO3 type, and 5% were mixed (no dominant facies). These findings indicate that the primary hydrochemical facies is HCO3·Cl-Na·Ca type, which suggests influences from anthropogenic activities and evaporation processes [48].
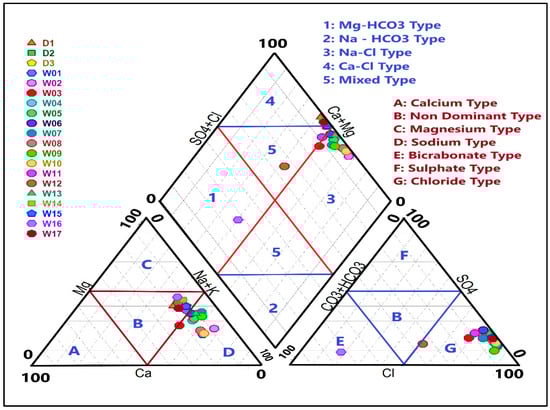
Figure 5.
Piper diagram showing the hydrogeochemical types of the studied area.
There are three main natural factors—evaporation, precipitation, and rock weathering—governed the hydrochemistry of groundwater. Gibbs [49] introduced an effective plot that demonstrates the controlling mechanisms between total dissolved solids (TDS) against the weight ratios of Na+/(Na+ + Ca2+) and Cl−/(Cl− + HCO3−). The data (Figure 6) declare that Na+/(Na+ + Ca2+) ratios ranged from 0.7 to 0.9, with all samples located in the evaporation-dominant zone of the Gibbs diagram, indicating that evaporation–precipitation processes are the principal natural factor affecting groundwater chemistry in the studied area. Furthermore, the high Na+/(Na+ + Ca2+) ratios suggest a strong role for the cation exchange in shaping the groundwater’s hydrochemistry composition [50]. The Cl−/(Cl− + HCO3−) ratios ranged from 0.1 to 0.9, with the majority of samples falling within the evaporation zone, assuming that evaporation–precipitation interactions are the main natural factor determining the chemistry of groundwater. Approximately 10% of anion weight ratios fell into the rock-dominance zone, indicating that rock weathering exerts a minor influence on groundwater in a subset of the samples.

Figure 6.
Gibbs plot illustrating geochemical process of groundwater in the studied area (Dashed lines represented the dominant geochemical fields, arrows reveal the evolution direction of hydrochemical with salinity, red and blue dots represented the sampled wells.
Matthes [28] developed indices to classify groundwater hydrochemical facies independently on Piper plots. He used the concentrations of Na+, Cl−, and SO42− in meq/L to calculate the base-exchange index (r1). By adding the concentration of K+ to these ions, he created the meteoric-genesis index (r2) (Equations (3) and (4) in Table 3). The values of r1 and r2 are presented in Table 6. Approximately 85% of the samples have an r1 < 1 (negative values), indicating that water facies belong to the Na+-SO42− type. In contrast, wells W03, W12, and W16 have an r1 > 1 (positive values), classifying them as Na+-HCO3− facies. Similarly, r2 follows the same trend as r1, with 85% of wells showing an r2 < 1, suggesting long-time residence through deep meteoric percolation. This phenomenon indicates that the main factor influencing deep meteoric percolation is the continuous exploitation of water, combined with low rainfall in this arid region, which causes water levels to drop and create favorable conditions for ion exchange in the aquifer, leading to ion enrichment [51,52].
Table 6.
Evaluation of key water quality indices for drinking, geochemical, and irrigation suitability in some agricultural drains and selected wells of the Siwa Oasis.
Schoeller [29] conducted the chloro-alkaline indices (CAI-I and CAI-II, as defined by Equations (5) and (6) in Table 3) to determine whether ion-exchange between groundwater and aquifer rocks involves forward or reverse reactions. Negative values for both indices signify a reverse ion-exchange process, where calcium (Ca2+) and magnesium (Mg2+) ions in the water are exchanged with sodium (Na+) and potassium (K+) ions held in the clay minerals, reflecting a chloro-alkaline disequilibrium. In contrast, positive values suggest a forward base-exchange process, in which Na+ and K+ ions from water are exchanged with Ca2+ and Mg2+ ions in the rocks. The calculated values of CAI-I and CAI-II are presented in Table 6. The majority of sampled wells show positive values, indicating a dominant base-exchange process. A few wells (W03, W12, and W16) exhibit negative values, indicating a chloro-alkaline disequilibrium process in these three wells.
3.5. Water Quality Assessment for Irrigation Uses
Assessing groundwater characteristics for irrigation uses is a crucial issue, as it directly impacts the agricultural productivity and sustainability [53,54]. Several parameters must be evaluated to determine the suitability of groundwater for irrigation, with the chemical composition of the water being a key factor governing the suitability of water for irrigational uses [1,55]. Ayers and Westcott [56] classified waters based on TDS levels for irrigational purposes as follows: TDS < 450 mg/L is considered “none” and suitable for irrigation, 450–2000 mg/L is classified as “moderate”, and TDS > 2000 mg/L is “severe”. In this study, TDS concentrations ranged from 160 to 10,240 mg/L. The class “none” included 10% of samples (<450 mg/L), the class “moderate” represented 15% of samples (450–2000 mg/L), and the class “severe” represented 80% of the studied samples.
Several indices were calculated to determine the suitability of the groundwater for irrigation, including the sodium adsorption ratio (SAR) and sodium percentage (Na%) (Equations (7) and (8) in Table 3), and their values are shown in Table 6. The sodium percentage (Na%) is a crucial indicator of sodium hazard [57]. Na% values ranged from 54.2 to 77.4%. Based on the standard classification, approximately 40% of the groundwater samples fell into the permissible category (Na% = 40–60%), while 60% of samples were classified as doubtful (Na% = 60–80%).
Wilcox [31] developed a diagram relating sodium percentage (Na%) to electrical conductivity that is widely used to assess irrigation suitability. As shown in Figure 7, over 80% of samples fell into the unsuitable category, revealing that groundwater from most wells is not ideal for irrigation. Only a small proportion of samples were classified as excellent (5%), permissible (5%), and doubtful (5%). These results collectively suggest that the groundwater has poor overall suitability for irrigation. Additionally, elevated sodium levels in the studied wells are attributed to significant water–rock interaction, which promotes cation exchange, as well as intensive agricultural activities and fertilizer use, which may contribute additional sodium to the aquifer.
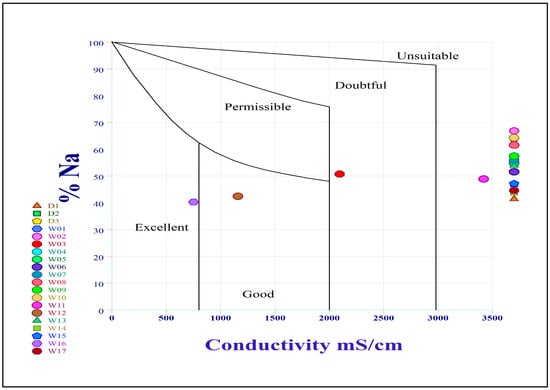
Figure 7.
Wilcox diagram illustrating the suitability of groundwater samples for irrigational purposes.
The sodium adsorption ratio (SAR) index provides insights into the potential hazard of sodium on cultivated crops. Continuous irrigation with high-SAR water can drastically degrade the soil quality [58]. An increased SAR leads to progressive soil alkalization, which is often more harmful than soil salinization. Sodium accumulation causes soil particles to compact and disperse, reducing air and water permeability in soil with time. This results in decreased water uptake by plants and, ultimately, poor plant growth [14].
The groundwater is classified into four categories based on SAR ratio (Table 3): excellent (SAR < 10), good (SAR = 10–18), doubtful (SAR = 18–26), and unsuitable (SAR > 26). In this study, SAR values fluctuated between 1.27 and 17.72, with an average value of 11.88. Only three wells (20% of the groundwater samples), with SAR values < 10, were classified as excellent and can be confidently considered suitable for irrigation. The remaining wells, while falling within the “good” category (SAR < 18), have values approaching the upper limit of this class and are near the threshold of the “doubtful” category. Moreover, other irrigation indices (such as %Na) collectively indicate that most wells are unsuitable for irrigation despite their acceptable SAR values.
The U.S. Salinity Laboratory (USSL) diagram, which plots SAR versus electrical conductivity, provides a detailed assessment of irrigation suitability [26]. Figure 8 illustrates this classification according to the USSL diagram. Only 5% of the samples fell into the C2S1 class (medium salinity/low sodium), indicating irrigation suitability. Approximately 10% fell into the C3S1 class (high salinity/low sodium), which is considered doubtful for irrigation. The majority of samples were classified as C4S3 and C4S4 (high salinity/high sodium), indicating that most of the studied groundwater is unsuitable for irrigation.
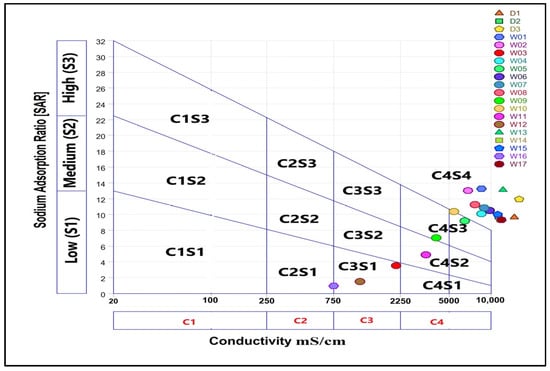
Figure 8.
USSL diagram for classifying irrigation waters according to the relationship between SAR and EC.
4. Conclusions
This study assessed the groundwater quality of the Siwa Oasis by characterizing the physical, chemical, and hydrochemical properties of certain selected wells and agricultural drains. The results of physico-chemical parameters and major ion concentrations offer detailed insights into the current conditions of this vital aquifer system. The findings reveal clear degradation of water quality and severely limit its usability. Water quality indices (WQI and NSF-WQI) and elevated total dissolved solids (TDS) levels indicate that most wells are unsuitable for drinking. Similarly, indices such as sodium percentage (Na%), sodium adsorption ratio (SAR), and the USSL diagram reveal that approximately 80% of the wells are unsuitable for irrigation due to high salinity and sodicity risks.
The salinization of the wells was identified as geogenic, resulting from mineral dissolution within the geological formation of the aquifer. To safeguard this critical resource, proper management is required. First, the pumping rate must be controlled to regulate artesian flow in order to avoid upwelling of deeper, saline water. Second, a desalination treating process (e.g., reverse osmosis) is necessary to implement in order to produce suitable potable water. For agricultural use, adopting salinity-tolerant crops and advanced management for irrigation—such as drip systems—is essential to minimize salinity and sodicity of soils.
Sustaining the aquifer’s viability for long periods of time depends on continuous monitoring of groundwater levels and quality to maintain a sustainable hydraulic balance, avoid deterioration of water quality, and ensure the long-term sustainability of this vital resource.
Author Contributions
M.H.H.A. and M.S.A. conceptualized and designed the study and collected the samples from field. M.H.H.A., A.D.G.A.-A., and K.M.A. carried out the analytical works with the assistance and guidance of M.S.A. Data interpretation and manuscript writing were performed by M.H.H.A. All authors have read and agreed to the published version of the manuscript.
Funding
This research received no external funding.
Institutional Review Board Statement
Not applicable.
Informed Consent Statement
Not applicable.
Data Availability Statement
All data generated or analyzed during this study are included in this published article.
Conflicts of Interest
The authors declare that they have no competing interests.
References
- Davraz, A.; Batur, B. Hydrogeochemistry characteristics of groundwater and health risk assessment in Yalvaç–Gelendost basin (Turkey). Appl. Water Sci. 2021, 11, 67. [Google Scholar] [CrossRef]
- Shemer, H.; Wald, S.; Semiat, R. Challenges and solutions for global water scarcity. Membranes 2023, 13, 612. [Google Scholar] [CrossRef]
- Liu, J.; Gao, Z.; Wang, Z.; Xu, X.; Su, Q.; Wang, S.; Qu, W.; Xing, T. Hydrogeochemical processes and suitability assessment of groundwater in the Jiaodong Peninsula, China. Environ. Monit. Assess. 2020, 192, 384. [Google Scholar] [CrossRef] [PubMed]
- Yuan, R.; Li, Z.; Guo, S. Health risks of shallow groundwater in the five basins of Shanxi, China, Geographical, geological and human activity roles. Environ. Pollut. 2023, 316, 120524. [Google Scholar] [CrossRef] [PubMed]
- Saleh, A.; Gad, A.; Ahmed, A.; Arman, H.; Farhat, H.I. Groundwater Hydrochemical Characteristics and Water Quality in Egypt’s Central Eastern Desert. Water 2023, 15, 971. [Google Scholar] [CrossRef]
- Bahir, M.; Ouazar, D.; Ouhamdouch, S.; Zouari, K. Assessment of groundwater mineralization of alluvial coastal aquifer of essaouira basin (Morocco) using the hydrochemical facies evolution diagram (HFE-Diagram). Groundw. Sustain. Dev. 2020, 11, 100487. [Google Scholar] [CrossRef]
- Huang, L.; Sun, Z.; Zhou, A.; Bi, J.; Liu, Y. Source and Enrichment Mechanism of Fluoride in Groundwater of the Hotan Oasis within the Tarim Basin, Northwestern China. Environ. Pollut. 2022, 300, 118962. [Google Scholar] [CrossRef]
- Nyika, J.; Magnone, D.; Gould, I. Groundwater salinization challenges in agriculturally valuable low-lying North Sea region: A review. Clean. Water 2024, 2, 100052. [Google Scholar] [CrossRef]
- Wang, W.; Mwiathi, N.F.; Li, C.; Luo, W.; Zhang, X.; An, Y.; Zhang, M.; Gong, P.; Liu, J.; Gao, X. Assessment of shallow aquifer vulnerability to fluoride contamination using modified AHP-DRASTICH model as a tool for effective groundwater management, a case study in Yuncheng Basin, China. Chemosphere 2022, 286, 131601. [Google Scholar] [CrossRef]
- Xiao, Y.; Hao, Q.; Zhang, Y.; Zhu, Y.; Yin, S.; Qin, L.; Li, X. Investigating sources, driving forces and potential health risks of nitrate and fluoride in groundwater of a typical alluvial fan plain. Sci. Total Environ. 2022, 802, 149909. [Google Scholar] [CrossRef]
- Khatri, N.; Tyagi, S.; Rawtani, D.; Tharmavaram, M.; Kamboj, R.D. Analysis and assessment of ground water quality in Satlasana Taluka, Mehsana district, Gujarat, India through application of water quality indices. Groundw. Sustain. Dev. 2020, 10, 100321. [Google Scholar] [CrossRef]
- Chen, K.; Liu, Q.; Peng, W.; Liu, X. Source apportionment and natural background levels of major ions in shallow groundwater using multivariate statistical method, a case study in Huaibei Plain, China. J. Environ. Manag. 2022, 301, 113806. [Google Scholar] [CrossRef]
- Su, H.; Kang, W.; Li, Y.; Li, Z. Fluoride and nitrate contamination of groundwater in the Loess Plateau, China, sources and related human health risks. Environ. Pollut. 2021, 286, 117287. [Google Scholar] [CrossRef]
- Wang, H.; Yang, Q.; Ma, H.; Liang, J. Chemical compositions evolution of groundwater and its pollution characterization due to agricultural activities in Yinchuan Plain, northwest China. Environ. Res. 2021, 200, 111449. [Google Scholar] [CrossRef]
- Rinklebe, J.; Antoniadis, V.; Shaheen, S.M.; Rosche, O.; Altermann, M. Health risk assessment of potentially toxic elements in soils along the Central Elbe River, Germany. Environ. Int. 2019, 126, 76–88. [Google Scholar] [CrossRef]
- Elnazer, A.A.; Salman, S.A.; Mohamed, Y.M.; Stafford, J.; Davies, P.; El Nazer, H.A. Siwa Oasis groundwater quality, factors controlling spatial and temporal changes. Environ. Monit. Assess. 2023, 195, 61. [Google Scholar] [CrossRef] [PubMed]
- Salman, S.A.; Abu El Ella, E.M.; Seleem, E.M.; Elnazer, A.A. Groundwater quality and environmental investigations in Siwa Oasis, Egypt. Int. J. Recent Adv. Multidiscip. Res. 2018, 5, 3951–3958. [Google Scholar]
- Abdelkarim, M.S.; Ali, M.H.; Othman, A.A.; Gaber, K.M.; Mahmoud, A.M.; Belal, D. Evaluation of microbiological criteria, planktonic communities and trophic state of groundwater resources in Siwa Oasis, Western Desert, Egypt. Sci. Rep. 2025, 15, 31090. [Google Scholar] [CrossRef]
- Chandan, A.; John, M.; Potdar, V. Achieving UN SDGs in food supply chain using blockchain technology. Sustainability 2023, 15, 2109. [Google Scholar] [CrossRef]
- Masoud, A.; Koike, K. Tectonic architecture through Landsat-7 ETM+/SRTM DEM-derived lineaments and relationship to the hydrogeologic setting in Siwa region, NW Egypt. J. Afr. Earth Sci. 2006, 45, 467–477. [Google Scholar] [CrossRef]
- Abdel-Gawad, A.M.; El Abd, E.A.; Gedamy, Y.R. Geological characteristics of shallow groundwater aquifer and its relation to hydrochemical features and bacteriological pollutants in Siwa Oasis Egypt. Int. J. Environ. 2020, 9, 17–147. [Google Scholar] [CrossRef]
- Ibrahim, S.A. Studies On Groundwater Possibilities in the Northern Part of the Western Desert-Egypt. Ph.D. Thesis, Cairo University, Cairo, Egypt, 1991; p. 292. [Google Scholar]
- Abdulaziz, M.A.; Faid, A.M. Evaluation of the groundwater resources potential of Siwa Oasis using three-dimensional multilayer groundwater flow model, Mersa Matruh Governorate, Egypt. Arab. J. Geosci. 2013, 8, 659–675. [Google Scholar] [CrossRef]
- Elsheikh, A.E.; Mohallel, S.A.; Ezzeldin, H.A.; El Ammawy, M.A.; Lateif, R.M.A. Hydrogeological and hydrogeochemical insights on the salinization of the shallow groundwater aquifer in Siwa Oasis–Western Desert–Egypt. Sci. Afr. 2023, 20, e01742. [Google Scholar] [CrossRef]
- American Public Health Association (APHA). Standard Methods of the Examination of Water and Waste Water, 23th rd. ed; AWWA: Denver, CO, USA; WPC: College Park, MD, USA, 2017; ISBN 978-0-87553-287-5. [Google Scholar]
- CCME Canadian Council of Ministers of the Environment. Canadian water quality guidelines for the protection of aquatic life, Water Quality Index 1.0, User’s Manual. In Canadian Environmental Quality Guidelines, 1999; Canadian Council of Ministers of the Environment: Winnipeg, MB, Canada, 2007. [Google Scholar]
- Ott, W. Environmental Indices, Theory and Practice; Ann Arbor Science Publishers, Inc.: Ann Arbor, MI, USA, 1978. [Google Scholar]
- Matthes, G. The Properties of Groundwater; Wiley: New York, NY, USA, 1982. [Google Scholar]
- Schoeller, H. Qualitative Evaluation of Groundwater Resources (In Methods and Techniques of Groundwater Investigation and Development. Water Resour. Ser. 1967, 33, 44–52. [Google Scholar]
- Richards, L.A. Diagnosis and Improvement of Saline and Alkali Soils. In US Dept Agriculture Handbook # 60; Supt. Documents; U. S. Government Printing Office: Washington, DC, USA, 1968. [Google Scholar]
- Wilcox, L.V. The quality of water for irrigation use. US Dep. Agric. Technol. Bull. 1948, 40, 962. [Google Scholar]
- WHO. Guidelines for Drinking-Water Quality, 4th ed.; World Health Organization: Geneva, Switzerland, 2011.
- Abdelkarim, M.S.; Belal, D.M.; Flefil, N.S.; Hegab, M.H.; Mahmoud, A.M.; Al-Afify, A.D.; Aly, W.; Ali, M.H. Ecosystem and Commercializing of Fish in a Rich-Minerals, Low-Salinity Closed Lake. Water Air Soil Pollut. 2023, 234, 626. [Google Scholar] [CrossRef]
- Mahmoud, A.M.; Ali, M.H.; Abdelkarim, M.S.; Al-Afify, A.D. Chemical, biochemical, and bioactivity studies on some soda lakes, Wadi El-Natrun, Egypt. Environ. Monit. Assess. 2024, 196, 436. [Google Scholar] [CrossRef] [PubMed]
- Todd, D.K. Groundwater Hydrology; Wiley: New York, NY, USA, 1980. [Google Scholar]
- Goher, M.E.; Ali, M.H. Monitoring of water quality characteristics and some heavy metals in water, sediment and macrophytes in Main Khors of Lake Nasser Egypt. J. Egypt. Acad. Soc. Environ. Dev. 2009, 10, 109–122. [Google Scholar]
- Krishna Kumar, S.; Bharani, R.; Magesh, N.S.; Godson, P.S.; Chandrasekar, N. Hydrogeochemistry and groundwater quality appraisal of part of south Chennai coastal aquifers, Tamil Nadu, India using WQI and fuzzy logic method. Appl. Water Sci. 2014, 4, 341–350. [Google Scholar] [CrossRef]
- Rao, N.S. Nitrate pollution and its distribution in the groundwater of Srikakulam district, Andhra Pradesh, India. Environ. Geol. 2006, 51, 631–645. [Google Scholar] [CrossRef]
- Subramani, T.; Rajmohan, N.; Elango, L. Groundwater geochemistry and identification of hydrogeochemical processes in a hard rock region, Southern India. Environ. Monit. Assess. 2010, 162, 123–137. [Google Scholar] [CrossRef] [PubMed]
- Stallard, R.F.; Edmond, J.M. Geochemistry of the Amazon, the influence of geology and weathering environment on the dissolved load. J. Geophys. Res. 1983, 88, 9671–9688. [Google Scholar] [CrossRef]
- Li, X.Y.; Wu, H.; Qian, H.; Gao, Y.Y. Groundwater chemistry regulated by hydrochemical processes and geological structures, a case study in Tongchuan, China. Water 2018, 10, 338. [Google Scholar] [CrossRef]
- Appelo, C.A.J.; Postma, D. Geochemistry, Groundwater and Pollution; CRC Press: Boca Raton, FL, USA, 1996. [Google Scholar]
- Ali, M.H.; Abdelkarim, M.S.; Salem, S.G.; Al-Afify, A.D. Integrated Evaluation of Potential Trace Elements and Pollution Indices in Wadi El-Natrun Saline Lake, Egypt: A Multidimensional Approach to Aquatic Ecosystem Health. Water Air Soil Pollut. 2025, 236, 747. [Google Scholar] [CrossRef]
- Davies, S.N.; DeWiest, R.J.M. Hydrogeology; John Wiley and Sons: New York, NY, USA, 1966; 463p. [Google Scholar]
- Alam, F. Evaluation of hydrogeochemical parameters of groundwater for suitability of domestic and irrigational purposes, a case study from central Ganga Plain, India. Arab. J. Geosci. 2014, 7, 4121–4131. [Google Scholar] [CrossRef]
- Hussein, H.A.; Ricka, A.; Kuchovsky, T.; El Osta, M.M. Groundwater hydrochemistry and origin in the south-eastern part of Wadi El Natrun, Egypt. Arab. J. Geosci. 2017, 10, 170. [Google Scholar] [CrossRef]
- Piper, A.M. A graphic procedure in the geochemical interpretation of water-analyses. Eos Trans. Am. Geophys. Union 1944, 256, 914–928. [Google Scholar] [CrossRef]
- Al-Omran, A.M.; Aly, A.A.; Al-Wabel, M.I.; Sallam, A.S.; Al-Shayaa, M.S. Hydrochemical characterization of groundwater under agricultural land in arid environment, a case study of Al-Kharj, Saudi Arabia. Arab. J. Geosci. 2016, 9, 68. [Google Scholar] [CrossRef]
- Gibbs, R.J. Mechanisms controlling world water chemistry. Science 1970, 170, 1088–1090. [Google Scholar] [CrossRef]
- Wu, C.; Wu, X.; Qian, C.; Zhu, G. Hydrogeochemistry and groundwater quality assessment of high fluoride levels in the Yanchi endorheic region, northwest China. Appl. Geochem. 2018, 98, 404–417. [Google Scholar] [CrossRef]
- Tamma Rao, G.; Gurunadha Rao, V.V.; Srinivasa Rao, Y.; Ramesh, G. Study of hydrogeochemical processes of the groundwater in Ghatprabha river sub-basin, Bagalkot District, Karnataka, India. Arab. J. Geosci. 2013, 6, 2447–2459. [Google Scholar] [CrossRef]
- Sunkari, E.D.; Abu, M.; Zango, M.S. Geochemical evolution and tracing of groundwater salinization using different ionic ratios, multivariate statistical and geochemical modelling approaches in a typical semi-arid basin. J. Contam. Hydrol. 2021, 236, 103742. [Google Scholar] [CrossRef]
- Salifu, M.; Aidoo, F.; Hayford, M.S.; Adomako, D.; Asare, E. Evaluating the suitability of groundwater for irrigational purposes in some selected districts of the Upper West region of Ghana. Appl. Water Sci. 2017, 7, 653–662. [Google Scholar] [CrossRef]
- Xu, P.; Feng, W.; Qian, H.; Zhang, Q. Hydrogeochemical characterization and irrigation quality assessment of shallow groundwater in the Central-Western Guanzhong Basin, China. Int. J. Environ. Res. Public Health 2019, 16, 1492. [Google Scholar] [CrossRef] [PubMed]
- Gao, Z.; Liu, J.; Feng, J.; Wang, M.; Wu, G. Hydrogeochemical characteristics and the suitability of groundwater in the alluvial-diluvial plain of southwest Shandong Province, China. Water 2019, 11, 1577. [Google Scholar] [CrossRef]
- Ayers, R.S.; Westcott, D.W. Water Quality for Agriculture (No. 29); Food and Agriculture Organization of the United Nations: Rome, Italy, 1985. [Google Scholar]
- Kawo, N.S.; Karuppannan, S. Groundwater quality assessment using water quality index and GIS technique in Modjo River Basin, central Ethiopia. J. Afr. Earth Sci. 2018, 147, 300–311. [Google Scholar] [CrossRef]
- Fipps, G. Irrigation Water Quality Standards and Salinity Management Strategies; B-1667, 4-03; Texas Agricultural Extension Service; Texas A&M University System: College Station, TX, USA, 2003; pp. 1–19. [Google Scholar]
Disclaimer/Publisher’s Note: The statements, opinions and data contained in all publications are solely those of the individual author(s) and contributor(s) and not of MDPI and/or the editor(s). MDPI and/or the editor(s) disclaim responsibility for any injury to people or property resulting from any ideas, methods, instructions or products referred to in the content. |
© 2025 by the authors. Licensee MDPI, Basel, Switzerland. This article is an open access article distributed under the terms and conditions of the Creative Commons Attribution (CC BY) license.