Abstract
Piggery farming is the largest source of livestock manure in South Korea, yet greenhouse gas (GHG) data from piggery wastewater treatment systems remain limited. This study quantified methane (CH4) and nitrous oxide (N2O) fluxes from a full-scale treatment facility to develop stage-, seasonal-, and diurnal-specific emission factors. Continuous laser-based monitoring using a PVC air-pool chamber was applied across raw wastewater storage, an anoxic nitrogen-conversion reactor, and strongly aerated nitrification units. Mean CH4 fluxes ranged from 1.1 to 15.6 mg s−1 m−2 peaking in summer, while N2O fluxes ranged from 0.01 to 17,971 mg s−1 m−2, with maxima in fall. Emissions were dominated by two functional zones: aerated basins where vigorous mixing enhanced CH4 stripping, and an upstream anoxic reactor where oxygen instability and nitrite accumulation produced extreme N2O peaks. Derived emission factors were 0.11 kg CH4 head−1 yr−1 and 45.2 kg N2O head−1 yr−1, equivalent to 3.1 and 12,300 kg CO2-eq head−1 yr−1. CH4 variability was controlled mainly by treatment stage and temperature, whereas N2O was governed by internal redox conditions. These results refine emission factors for inventories and underscore the need for improved aeration stability and denitrification control to reduce GHG emissions from piggery wastewater systems.
1. Introduction
Greenhouse gas (GHG) emissions, particularly methane (CH4) and nitrous oxide (N2O), are major contributors to global climate change. Agriculture accounts for approximately 9 to 18% of global anthropogenic GHG emissions, with livestock manure management recognized as a significant source of both CH4 and N2O [1]. International frameworks such as the Paris Agreement emphasize the need for accurate GHG quantification to guide mitigation strategies [2], yet emissions from livestock wastewater remain difficult to characterize due to methodological inconsistencies, high spatial and temporal variability, and limited emission factor (EF) datasets [3,4].
South Korea has pledged carbon neutrality by 2050 [5], with livestock-sector mitigation identified as a key priority. As of 2023, the national livestock population reached roughly 190 million head, including 11.09 million pigs [6]. Piggery operations generate the largest share of manure in Korea, contributing about 39% (≈19.7 million tons yr−1) of the national total [7]. Despite this, comprehensive CH4 and N2O emission factors for piggery wastewater treatment processes remain scarce, as most previous studies have focused on barn-level or slurry-pit emissions. This gap limits the refinement of national inventories and assessment of mitigation opportunities [8,9].
Quantifying GHG emissions from pig manure systems remains challenging because emissions vary widely with chamber configuration, sampling frequency, environmental conditions, and treatment-stage operation [8,10,11,12]. Flux-gradient and micrometeorological approaches can be difficult to apply in complex wastewater environments such as aeration basins and storage tanks [13,14]. Emissions also respond strongly to operational and seasonal conditions: CH4 generally increases during warm periods, while N2O often peaks in cooler, oxygen-limited conditions [13,14]. Existing empirical models only partially capture these dynamics, contributing to uncertainty in current inventories [15,16].
Advances in laser-based gas analyzers and automated monitoring systems now allow high-resolution CH4 and N2O measurements with improved stability and sensitivity [17,18,19,20]. However, their application in piggery wastewater treatment systems remains limited, and localized emission factors reflecting diurnal and seasonal variability are lacking [21].
This study quantifies CH4 and N2O emissions from a commercial piggery wastewater treatment facility and evaluates how fluxes vary across treatment stages, diurnal periods, and seasons. By deriving stage- and time-resolved emission factors, this work fills a critical data gap in Korea’s GHG inventory framework and provides empirical guidance for designing low-emission wastewater treatment strategies under warm, humid agricultural conditions.
2. Materials and Methods
2.1. Waste Water Treatment Plant and Weather Conditions
The study was conducted at a commercial pig farm located in Baeksan-myeon, Jojong-ri, Kimje City, South Korea (35°52′1.31″ N, 126°52′41.31″ E). Figure 1 illustrates the four-season classification system applied in this study for seasonal flux analysis. Table 1 presents the average monthly weather characteristics of the study area during the monitoring period. The experimental site geographical location and layout of the swine wastewater treatment system used for GHG monitoring are represented in Figure 2. The pig farm houses approximately 9000 pigs, generating an average 16.47 of solid waste and 25.65 of effluent. The treatment plant is a self-purification wastewater treatment system designed based on aerobic and anaerobic processes to degrade organic content at multiple treatment stages (Figure 2B).
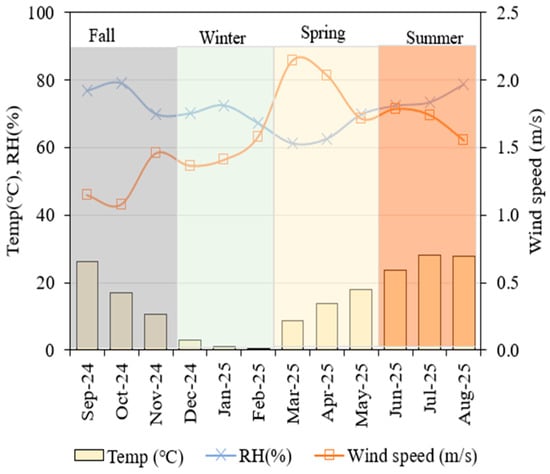
Figure 1.
Seasonal variations in ambient environmental conditions (temperature, relative humidity, and wind speed) obtained from the nearest Korea Meteorological Administration (KMA) station during the measurement period. Wind speed corresponds to the standard 10 m measurement height.

Table 1.
Average annual weather conditions of the study area during the experiment period.
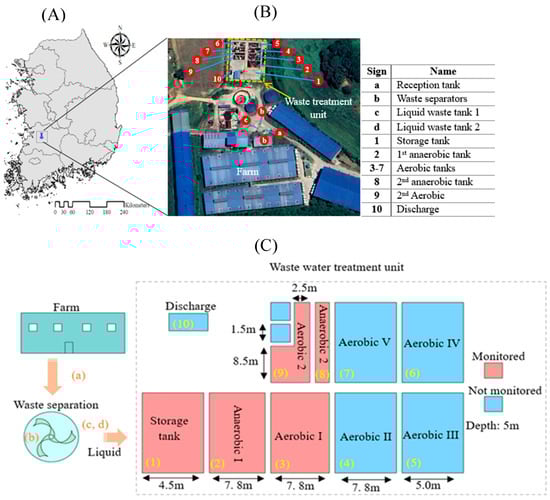
Figure 2.
Experimental site location and layout of the wastewater treatment system used for GHG monitoring. (A) Geographical location of the study site in Korea. (B) Aerial view of the farm and waste treatment facility showing sampling points (1 to10) and key units (a to d). (C) Illustration of the treatment sequence, tank dimensions, and sampling stages.
From Figure 2, the treatment process begins at Tank (a), where raw waste is received before undergoing a separation process at (b) to divide solid and liquid waste fractions. The liquid waste is then stored in liquid waste tanks (c) and (d) before being pumped into the treatment unit. The wastewater first accumulates in an underground storage tank (Stage 1) and then moves to the anaerobic treatment stage (Stage 2), where microorganisms break down organic matter under oxygen-deficient conditions, releasing GHG as a byproduct. Following this, the waste undergoes aerobic treatment (Stages 3 to 7), where organic matter is further degraded in aeration tanks (Aerobic 1–5) under oxygen-rich conditions. Secondary anaerobic treatment occurs in Anaerobic Tank 2 (Stage 8), followed by secondary aerobic treatment in Aerobic Tank 2 (Stage 9) before final discharge.
Figure 2C provides a detailed layout of the wastewater handling process, technical specifications of the treatment unit, and GHG monitoring points considered in this study. The CH4 and N2O emissions were monitored at three main stages: pre-treatment (raw waste storage), primary treatment (anaerobic and aerobic stages), and secondary treatment (anaerobic and aerobic stages).
2.2. Equipment and GHGs Collection
2.2.1. Equipment
A custom floating PVC air-pool chamber was installed at Stages 2, 3, 8, and 9 to enable continuous gas capture while preventing corrosion from wastewater emissions (Figure 3). The chamber measured 1.22 m × 2.44 m × 0.60 m (collection area 2.98 m2) and was connected to flexible air ducts, an air blower, and 0.25-inch Teflon tubing for transport to the analyzer (Figure 4a). At Stage 1, where chamber deployment was not possible due to the underground location and restricted access, a stainless-steel cover with two inlet ports and one outlet port was used, and gas was extracted using 117 m3 s−1 blowers (Figure 4b).
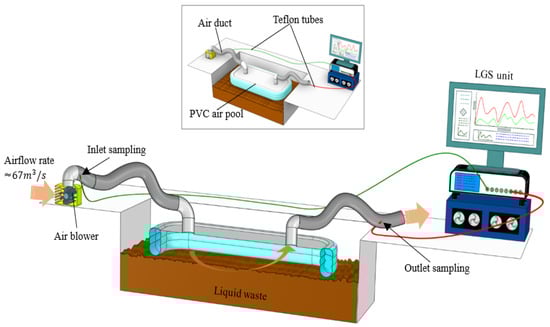
Figure 3.
Schematic illustration of gas collection and monitoring setup, showing the isometric and cross-sectional views of the PVC air pool system. The setup includes an air blower airflow, Teflon sampling tubes for inlet and outlet gas collection, and a laser gas spectrometer (LGS) unit for real-time CH4 and N2O measurement.
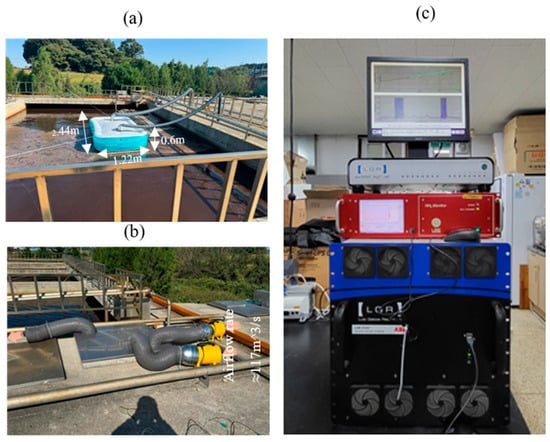
Figure 4.
Field installation and analytical system used for GHG flux monitoring. (a) Floating PVC air pool chamber deployed at monitoring stages 2, 3, 8, and 9; (b) gas collection and transfer setup at the raw-water storage tank (stage 1) and (c) Laser Gas Analyzer (LGR) unit.
Gas concentrations were measured using a laser-based analyzer (ABB Measurement & Analytics, Quebec City, QC, Canada; LGR-ICOS™ GLA351-N2OM1; Figure 4c). The analyzer alternated between CH4 and N2O using its internal optical-switching mechanism. All sampled gas was conveyed through Teflon tubing to minimize adsorption or chemical loss. Sensor detection ranges and measurement methods are summarized in Table 2.
Table 2.
Measurement range, interval, and method of the gas sensors.
Before each monthly monitoring event, the analyzer was calibrated using certified low- and high-concentration CH4 and N2O standards. Calibration checks included zero stability, span accuracy, and spectral-fit performance according to manufacturer guidelines.
2.2.2. Gas Collection
Monitoring was performed for ten 24-h campaigns from 6 September 2024 to 30 August 2025, covering autumn, winter, spring, and summer. During each campaign, continuous sampling was conducted at all five treatment stages. The PVC chamber inlets and outlets were monitored simultaneously, with the inlet measurements serving as the blank reference. The detailed monitoring days and seasonal coverage are represented in Table 3.
Table 3.
Monitoring period and seasonal coverage.
CH4 and N2O were recorded at 1-s intervals producing up to 86,400 measurements per stage per day. Approximately 90% of all measurements were retained after quality control and used in flux calculation. Measurements were grouped into morning (06:00 to 12:00), afternoon (12:00 to 18:00), evening (18:00 to 00:00), and night (00:00 to 06:00) for seasonal flux aggregation. Negative values were treated as zeros while occasional gaps due to operational interruptions were treated as missing data and excluded from averaging.
Environmental variables, including temperature and humidity, were obtained from the Korea Meteorological Administration (KMA) for each monitoring day and were used to assess the influence of weather conditions on GHG flux patterns.
2.3. Data Analysis and Emission Flux Calculation
2.3.1. CH4 and N2O Analysis
The collected GHG emission data were analyzed to assess seasonal and treatment stage variations in CH4 and N2O fluxes. Seasonal classification was based on local meteorological records, and data were grouped into spring, summer, fall and winter to study environmental effects on emission trends. To characterize diurnal behavior, all hourly fluxes were assigned to four 6 h periods including morning (06:00 to 12:00), afternoon (12:00 to 18:00), evening (18:00 to 00:00), and night (00:00 to 06:00). For treatment-stage characterization, emission data were categorized according to pre-treatment (raw waste storage), primary treatment (anaerobic tank I and aerobic I), and secondary treatment (anaerobic II and aerobic II) stages.
Descriptive statistics (mean, standard deviation, coefficient of variation) were used to characterize greenhouse gas. The differences among groups were evaluated using one-way ANOVA, followed by Tukey’s HSD multiple comparison test (p < 0.05) where appropriate. To quantify the influence of environmental factors, linear regression was applied with temperature and relative humidity as covariates based on the model as shown in Equation (1). All statistical analyses and graphical visualizations were performed using OriginPro 2025b SR1 (OriginLab Corporation, Northampton, MA, USA).
2.3.2. CH4 and N2O Flux Calculation
Flux rates were calculated using standard gas flux equations, integrating measured gas concentrations, air flow rates, and environmental parameters (Equation (2)).
where is the greenhouse house gas flux , and are the outlet and inlet greenhouse gas concentrations (, is the atmospheric air pressure (pa), is the air flow rate through the chamber system (), is the ambient air temperature (K), is the molar gas constant () and A is the effective area of the chamber ().
2.3.3. Emission Factors Calculation
Measured fluxes for each treatment stage were aggregated across the four daily measurement periods and seasons. For each stage and season the daily representative flux was obtained as the Mean of the four period-level fluxes [9,22]. The daily emissions were calculated as:
where is the daily representative flux, is the stage emitting surface area (), 86,400 converts seconds to days and converts to . Seasonal total emissions were obtained by multiplying by the number of days in each season (). The annual emissions per stage were then computed as follows.
Overall treatment plant annual emissions () were the sum of all stage totals. Per animal emission factors were calculated by dividing by the average number of pigs on the farm. -equivalent emission factors were derived using IPCC AR6 GWP100 values (CH4 = 27.2, N2O = 273) [9].
3. Results and Discussion
3.1. Diurnal GHG Flux Characteristics
Diurnal CH4 and N2O fluxes showed clear 6-h interval patterns across the monitoring period (Figure 5). CH4 fluxes were highest during the evening and night (7.2 and 7.0 respectively), with secondary peak in the morning hours (5.8 ). The lowest mean Flux occurred during the afternoon (3.2 ). CH4 variability remained comparatively narrow, with coefficient of variation (CV) ranging from 1.7 at night to 3.4 in the morning.
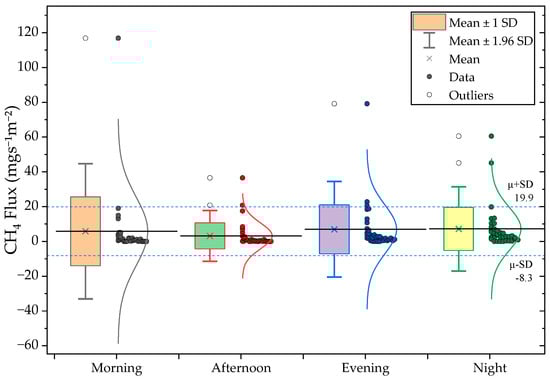
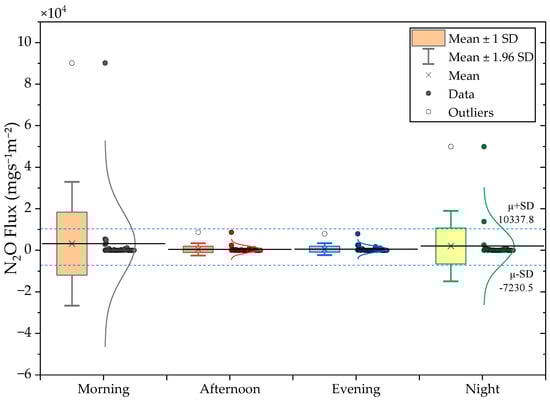
Figure 5.
(Top) CH4 and (Bottom) N2O diurnal flux distributions for Morning, Afternoon, Evening, and Night periods.
N2O fluxes exhibited far greater diurnal variability. The highest mean Flux occurred during morning hours (3174.6 ), followed by a secondary night peak (2056.5 ). Afternoon emissions were substantially lower, being 7.2- and 4.6-fold lower than morning and evening Fluxes, respectively. Table 4 summarizes the of diurnal CH4 and N2O flux statistics. The high CV values (2.6–4.8) underline the instability of N2O production and release, which is strongly influenced by rapid operational and biochemical transitions such as changes in oxygen availability and nitrification–denitrification cycling. These findings are consistent with previous studies showing that N2O emissions from livestock wastewater systems often occur in short-lived bursts linked to intermittent aeration and redox shifts [23,24].
Table 4.
Summary of diurnal CH4 and N2O flux statistics from pig wastewater treatment system. Values represent the Mean, standard deviation (SD), standard error (SE), coefficient of variation (CV), and maximum observed flux (n =35 per period).
3.2. Treatment Stage Specific GHG Flux Characteristics
Treatment-stage flux distributions are shown in Figure 6 and summarized in Table 5. CH4 emissions varied markedly across the system, with the highest mean flux observed in Aeration Tank II (27.8 mg m−2 s−1). Short-term CH4 peaks (up to 119.8 mg m−2 s−1) coincided with strong turbulence events, which likely released CH4 accumulated within sludge flocs. Such aeration-driven stripping has been reported in both municipal and livestock wastewater systems [22,25,26,27]). Lower CH4 fluxes in Anaerobic Tank II and the raw-water tank (2.8–3.7 mg m−2 s−1) align with reduced substrate availability, higher redox potential, and possible ammonia inhibition, conditions known to suppress methanogenesis [28,29,30,31].
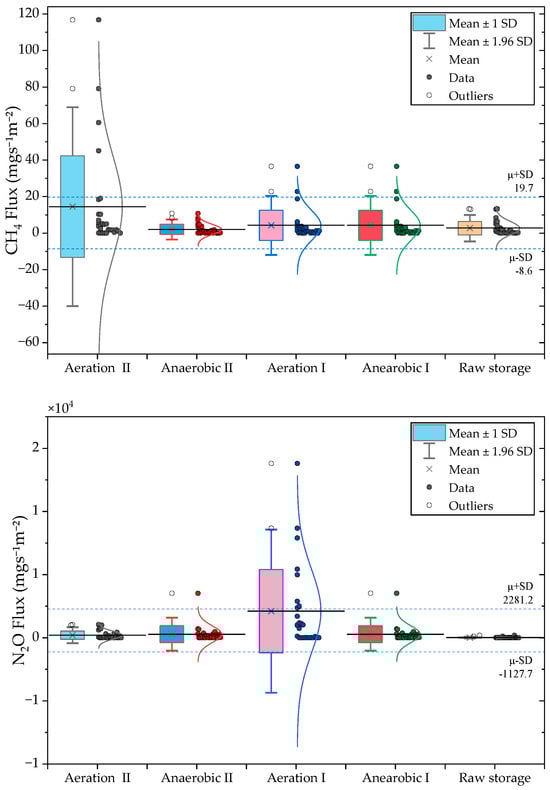
Figure 6.
Treatment stage variability in CH4 and N2O fluxes measured across the swine wastewater process.
Table 5.
Summary of treatment stage specific CH4 and N2O flux statistics from pig wastewater treatment system. Values represent the Mean, standard deviation (SD), standard error (SE), coefficient of variation (CV), and maximum observed flux (n = 35 per stage).
N2O emissions were highly stage dependent. Anaerobic Tank I produced the highest mean and peak fluxes (5163.9 mg m−2 s−1 and 90,162.9 mg m−2 s−1, respectively), reflecting unstable nitrification–denitrification processes driven by oxygen fluctuations, nitrite accumulation, and low C/N ratios. Similar extreme N2O peaks have been observed in pig-slurry and intermittently aerated reactors, where up to 18% of influent nitrogen may be emitted as N2O [32,33]. The high CV in Anaerobic Tank I (3.7) reinforces the episodic nature of N2O production, consistent with wastewater studies showing large temporal variability in N2O yields [22,34].
By contrast, Aeration Tank II and the raw-water tank exhibited minimal N2O emissions (<300 ), likely due to more stable redox environments where nitrite does not accumulate and denitrification proceeds fully to N2 [24,35]. These contrasting emission behaviors indicate that CH4 and N2O mitigation strategies must target different stages and processes. CH4 mitigation should focus on mixing and turbulence control, whereas N2O reduction requires improving biochemical stability through controlled aeration, adequate carbon supply, and prevention of nitrite accumulation.
3.3. Seasonal GHG Flux Characteristics
Seasonal CH4 and N2O flux patterns are shown in Figure 7 and Table 6. CH4 fluxes exhibited moderate but consistent seasonal variability, with the lowest values in summer (3.2 ) and the highest in late fall and winter (7.0 to 7.2 ). These patterns reflect temperature-driven changes in methanogenic and methanotrophic activity, as well as differences in gas–liquid transfer efficiency under cooler conditions [36]. Persistent CH4 generation in winter likely arises from thermally buffered sludge layers [37].
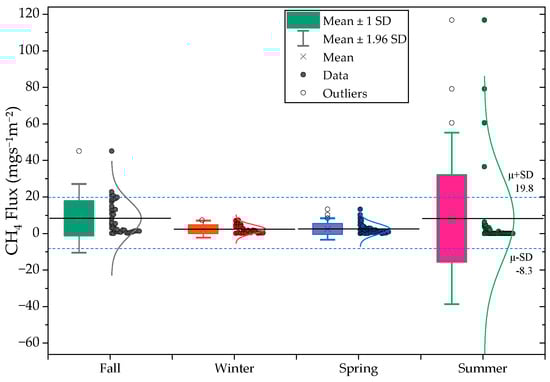
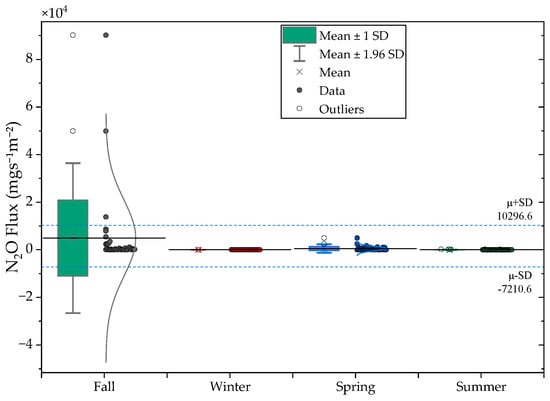
Figure 7.
Seasonal variations in CH4 (top) and N2O (bottom) fluxes across the monitoring period.
Seasonal N2O fluxes were again dominated by Anaerobic Tank I (mean = 5163.9 , max = 90,162.9 ), consistent with nitrogen transformation instability rather than climatic influence. Aeration Tank II and the raw-water tank continued to exhibit low fluxes (<300 ). These results reaffirm that N2O emissions in this system are governed primarily by operational and biochemical factors rather than seasonal temperature or humidity conditions.
Table 6.
Summary of seasonal CH4 and N2O flux statistics from the swine wastewater treatment system. Values represent the Mean, standard deviation (SD), standard error (SE), coefficient of variation (CV), and maximum observed flux for each 6-h monitoring interval (n = 35 per period).
Table 6.
Summary of seasonal CH4 and N2O flux statistics from the swine wastewater treatment system. Values represent the Mean, standard deviation (SD), standard error (SE), coefficient of variation (CV), and maximum observed flux for each 6-h monitoring interval (n = 35 per period).
| Seasons | GHG | Mean | SD | SE | CV | Max |
|---|---|---|---|---|---|---|
| Spring | CH4 | 5.8 | 19.8 | 3.3 | 3.4 | 116.8 |
| N2O | 3174.6 | 15,199.2 | 2569.1 | 4.8 | 90,162.9 | |
| Summer | CH4 | 3.2 | 7.5 | 1.3 | 2.3 | 36.5 |
| N2O | 439.9 | 1501.4 | 253.8 | 3.4 | 8671.8 | |
| Fall | CH4 | 7.0 | 14.1 | 2.4 | 2.0 | 79.1 |
| N2O | 543.6 | 1434.7 | 242.5 | 2.6 | 7900.4 | |
| Winter | CH4 | 7.2 | 12.4 | 2.1 | 1.7 | 60.5 |
| N2O | 2056.5 | 8650.5 | 1462.2 | 4.2 | 49,913.1 |
3.4. Effect of Environmental Factors on GHG Emission Fluxes
The seasonal relationships between GHG fluxes and environmental variables are shown in Figure 8. CH4 fluxes exhibited a very strong positive correlation with temperature (r = 0.97; R2 = 0.95), confirming that methanogenesis intensifies under warmer conditions. Relative humidity (RH) showed a moderate negative correlation with CH4 flux (r = −0.63; R2 = 0.39), indicating that drier, more ventilated conditions enhance gas transfer and promote CH4 release. These patterns are consistent with previous studies showing strong microclimatic control over CH4 emissions from stored and aerated pig manure [36,37,38].
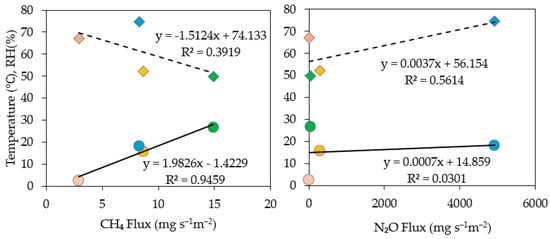
Figure 8.
Seasonal scale linear regressions between GHG flux and temperature (○), and relative humidity (◇). Each color represents a seasonal mean: Spring, Summer, Fall, and Winter. Each point represents a seasonal mean (n = 4: Spring, Summer, Fall, Winter). Regression equations and R2 values are shown for each relationship.
For N2O, the seasonal relationship with temperature was weak (r = 0.17; R2 = 0.03), suggesting that temperature plays only a minor role at the seasonal scale. In contrast, RH displayed a strong positive correlation with N2O flux (r = 0.75; R2 = 0.56), implying greater N2O accumulation under humid, oxygen-limited conditions that favor incomplete denitrification. This finding aligns with studies showing that N2O production in wastewater systems is driven primarily by internal biochemical dynamics rather than external temperature changes [34,35,39].
3.5. Greenhouse Gas Emission Factors
Emission factor calculation yielded annual emissions of 1.01 × 10³ kg CH4 yr−1 and 4.07 × 10⁵ kg N2O yr−1 for the wastewater treatment system. When normalized by the average herd population of 9000 pigs, the corresponding emission factors were 0.11 kg CH4/ head/year and 45.2 kg N2O head−1 yr−1. Expressed in CO2-equivalent units using IPCC AR6 100-year global warming potentials (CH4 = 27.2; N2O = 273), the resulting emission factors were 3.1 kg CO2-eq head−1 yr−1 for CH4 and 1.23 × 10⁴ kg CO2-eq head−1 yr−1 for N2O.
Stage-level emissions showed different spatial patterns for CH4 and N2O within the treatment system (Table 7). The largest CH4 emissions originated from Aeration Tank I, Aeration Tank II, and Anaerobic Tank I. In contrast, N2O emissions were highly concentrated, as Anaerobic Tank I and Aeration Tank I collectively accounted for more than 90 percent of the total annual N2O released. This concentration of N2O emissions indicates that a small portion of the treatment process is responsible for most of the system’s greenhouse-gas output and reflects unstable nitrogen transformation conditions in those units.
Table 7.
Annual CH4 and N2O emissions by treatment stage, percentage contributions, and system-level emission factors.
The CH4 emission factor obtained in this study (0.11 kg CH4 head−1 yr−1) lies at the lower edge of values reported for swine wastewater treatment systems, which typically range from 0.1–1.0 kg CH4 head−1 yr−1 in full-scale biological treatment processes [22]. This consistency reflects the predominantly aerobic conditions in the treatment train, which suppress methanogenesis. In contrast, the N2O emission factor measured here (45.2 kg N2O head−1 yr−1) is several orders of magnitude higher than values reported for optimized nitrogen removal systems, where per-head N2O emissions generally fall between 0.001 and 0.01 kg N2O head−1 yr−1, and only 0.5–3% of influent nitrogen is typically emitted as N2O-N. These elevated emissions align with the exceptionally high N2O fluxes observed in Anaerobic Tank I and Aeration Tank I. Overall, the system’s greenhouse-gas footprint is dominated by these localized N2O hotspots, indicating that focused improvements in aeration control, carbon availability, and nitrogen transformation processes in these units could substantially reduce total emissions.
4. Conclusions
This study quantified CH4 and N2O emissions from a full-scale piggery wastewater treatment system and developed treatment stage and time-resolved emission factors. CH4 emissions were strongly influenced by temperature and gas transfer dynamics, with higher fluxes during warm periods and in aerated units, particularly during morning and night when mixing intensity and thermal gradients favored release. In contrast, N2O emissions were dominated by biochemical instability in Anaerobic Tank I, where oxygen fluctuations, nitrite accumulation, and incomplete denitrification produced extreme and irregular peaks.
Annual emission factors were 0.11 kg CH4 head−1 yr−1 and 45.2 kg N2O head−1 yr−1, equivalent to 3.1 and kg CO2-eq head−1 yr−1, respectively. More than 90% of N2O emissions originated from a single treatment stage, underscoring the disproportionate influence of nitrification–denitrification instability on system-wide greenhouse-gas release.
These findings indicate that mitigation must be focused on the distinct mechanisms driving each gas. CH4 reductions should focus on minimizing the physical release of accumulated gas, for example, by moderating aeration-induced turbulence, improving mixing uniformity to limit anaerobic microsites within aerobic reactors, and applying surface covers or gas-collection hoods in areas prone to vigorous stripping. In contrast, N2O mitigation requires stabilization of the nitrogen transformation pathway. This involves maintaining consistent dissolved oxygen conditions to prevent abrupt redox oscillations, ensuring adequate carbon availability for complete denitrification, and employing real-time monitoring of oxygen and intermediate nitrogen species to avoid nitrite accumulation. Improving the operational stability of Anaerobic Tank I, including reducing unintended oxygen intrusion and homogenizing mixing, is likely to yield substantial reductions given its outsized contribution to total N2O emissions.
The emission factors developed in this work enhance the accuracy of livestock greenhouse-gas inventories and offer process-specific insights that can inform low-emission wastewater treatment design. Future research will incorporate wastewater chemical characteristics and microbial community analysis to strengthen mechanistic understanding, and on developing dynamic emission factor models that integrate operational data and climatic variability to support climate-smart livestock facility management.
Author Contributions
Conceptualization, A.K.K., I.-H.S. and I.-S.K.; methodology, A.K.K. and I.-S.K.; software, A.K.K.; validation, A.K.K., I.-H.S. and I.-S.K.; formal analysis, A.K.K.; investigation, A.K.K.; resources, I.-H.S. and I.-S.K.; data curation, I.-S.K.; writing—original draft preparation, A.K.K.; writing—review and editing, A.K.K.; visualization I.-S.K.; supervision I.-H.S. and I.-S.K.; project administration, I.-S.K.; funding acquisition, I.-H.S. and I.-S.K. All authors have read and agreed to the published version of the manuscript.
Funding
This research was supported by the Rural Development Administration’s ‘Climate Change Mitigation and Low-Carbon Agricultural Technology Development’ research project (project number: RS-2023-00221189).
Institutional Review Board Statement
Not applicable.
Informed Consent Statement
Not applicable.
Data Availability Statement
Research data available upon request.
Conflicts of Interest
The authors declare no conflicts of interest.
Abbreviations
The following abbreviations are used in this manuscript:
| GHG | Greenhouse Gas |
| CH4 | Methane |
| N2O | Nitrous Oxide |
| EF | Emission Factor |
| RH | Relative Humidity |
| FTIR | Fourier Transform Infrared Spectroscopy |
| LGR | Los Gatos Research (laser-based gas analyzer) |
| AGSC | Automated Gas Sampling Chamber |
| ANOVA | Analysis of Variance |
| ANCOVA | Analysis of Covariance |
| SD | Standard Deviation |
| SE | Standard Error |
| CV | Coefficient of Variation |
| R2 | Coefficient of Determination |
| p | Probability Value (Significance Level) |
| η2 | Partial Eta Squared (Effect Size) |
| PVC | Polyvinyl Chloride |
| COD | Chemical oxygen demand |
References
- Gerber, P.; Steinfeld, H.; Henderson, B.; Mottet, A.; Opio, C.; Dijkman, J.; Tempio, G. Reducing Enteric Methane and Livelihoods Win-Win Opportunities for Farmers; FAO: Rome, Italy, 2013; Volume 14, ISBN 9789251079201. [Google Scholar]
- Delbeke, J.; Runge-Metzger, A.; Slingenberg, Y.; Werksman, J. The Paris Agreement. In Towards a Climate-Neutral Europe Curbing the Trend; Routledge: Oxfordshire, UK, 2015; pp. 24–45. [Google Scholar] [CrossRef]
- Rivera Moncada, A.; Dupas, M.C.; Tempio, G.; Lanzoni, L.; Li, Y.; Rakotovao, N.; Wisser, D.; Gilbert, M. Sensitivity Analysis of Parameters, Emission Factors, and Coefficients for Estimating Animal Emissions of Ruminant Species in the Global Livestock Environmental Assessment Model (GLEAM). Int. J. Life Cycle Assess. 2025. [Google Scholar] [CrossRef]
- Graham, M.W.; Butterbach-Bahl, K.; du Toit, C.J.L.; Korir, D.; Leitner, S.; Merbold, L.; Mwape, A.; Ndung’u, P.W.; Pelster, D.E.; Rufino, M.C.; et al. Research Progress on Greenhouse Gas Emissions From Livestock in Sub-Saharan Africa Falls Short of National Inventory Ambitions. Front. Soil Sci. 2022, 2, 927452. [Google Scholar] [CrossRef]
- Government of Republic of Korea. The Government of the Republic of Korea 2050 Carbon Neutral Strategy of the Republic of Korea: Towards a Sustainable and Green Society; Government of Republic of Korea: Seoul, Republic of Korea, 2020; pp. 1–131.
- Statistics Korea. Livestock Statistics in the Fourth Quarter of 2013; Statistics Korea: Daejeon, Republic of Korea, 2013; Volume 2024, pp. 11–12. Available online: https://unfccc.int/sites/default/files/resource/LTS1_RKorea.pdf (accessed on 8 December 2025).
- Ministry of Agriculture, Food and Rural Affairs (MAFRA). 2023 Livestock Manure Generation and Management Statistics Report 2024; MAFRA: Mafra, Portugal, 2024.
- Symeon, G.K.; Akamati, K.; Dotas, V.; Karatosidi, D.; Bizelis, I.; Laliotis, G.P. Manure Management as a Potential Mitigation Tool to Eliminate Greenhouse Gas Emissions in Livestock Systems. Sustainability 2025, 17, 586. [Google Scholar] [CrossRef]
- Eska, N.; Lee, J.S.; Park, K.H. Greenhouse Gas Emissions from Livestock: Sources, Estimation, and Mitigation. J. Anim. Sci. Technol. 2024, 66, 1083–1098. [Google Scholar] [CrossRef] [PubMed]
- Al Zahra, W.; Ikhsan Shiddieqy, M.; Anisa, R.; Yani, A.; Priyo Purwanto, B. The Dynamics of Nitrous Oxide and Methane Emissions from Various Types of Dairy Manure at Smallholder Dairy Farms as Affected by Storage Periods. Waste Manag. 2024, 183, 10–20. [Google Scholar] [CrossRef]
- Philippe, F.X.; Nicks, B. Review on Greenhouse Gas Emissions from Pig Houses: Production of Carbon Dioxide, Methane and Nitrous Oxide by Animals and Manure. Agric. Ecosyst. Environ. 2015, 199, 10–25. [Google Scholar] [CrossRef]
- Montes, F.; Meinen, R.; Dell, C.; Rotz, A.; Hristov, A.N.; Oh, J.; Waghorn, G.; Gerber, P.J.; Henderson, B.; Makkar, H.P.S.; et al. SPECIAL TOPICS-Mitigation of Methane and Nitrous Oxide Emissions from Animal Operations: II. A Review of Manure Management Mitigation Options. J. Anim. Sci. 2013, 91, 5070–5094. [Google Scholar] [CrossRef] [PubMed]
- Ro, K.S.; Johnson, M.H.; Stone, K.C.; Hunt, P.G.; Flesch, T.; Todd, R.W. Measuring Gas Emissions from Animal Waste Lagoons with an Inverse-Dispersion Technique. Atmos. Environ. 2013, 66, 101–106. [Google Scholar] [CrossRef]
- Gu, D.; Liu, Y.; Zhao, W.; Qiu, S.; Cui, N.; Hu, X.; Zhao, P. Status of Research on Greenhouse Gas Emissions from Wastewater Collection Systems. Water 2023, 15, 2512. [Google Scholar] [CrossRef]
- Jensen, S.A.; Webb, J.R.; Simpson, G.L.; Baulch, H.M.; Leavitt, P.R.; Finlay, K. Seasonal Variability of CO2, CH4, and N2O Content and Fluxes in Small Agricultural Reservoirs of the Northern Great Plains. Front. Environ. Sci. 2022, 10, 895531. [Google Scholar] [CrossRef]
- Vechi, N.T.; Falk, J.M.; Fredenslund, A.M.; Edjabou, M.E.; Scheutz, C. Methane Emission Rates Averaged over a Year from Ten Farm-Scale Manure Storage Tanks. Sci. Total Environ. 2023, 904, 166610. [Google Scholar] [CrossRef]
- Wilkinson, J.; Bors, C.; Burgis, F.; Lorke, A.; Bodmer, P. Measuring CO2 and CH4 with a Portable Gas Analyzer: Closed-Loop Operation, Optimization and Assessment. PLoS ONE 2018, 13, E0193973, Correction in PLoS ONE 2019, 14, e0206080. https://doi.org/10.1371/journal.pone.0206080. [Google Scholar] [CrossRef] [PubMed]
- Stiefvater, G.; Hespos, Y.; Wiedenmann, D.; Lambrecht, A.; Brunner, R.; Wöllenstein, J. A Portable Laser Spectroscopic System for Measuring Nitrous Oxide Emissions on Fertilized Cropland. Sensors 2023, 23, 6686. [Google Scholar] [CrossRef] [PubMed]
- Briz, S.; Barrancos, J.; Nolasco, D.; Melián, G.; Padrón, E.; Pérez, N. New Method for Estimating Greenhouse Gas Emissions from Livestock Buildings Using Open-Path FTIR Spectroscopy. Remote Sens. Clouds Atmos. XIV 2009, 7475, 747510. [Google Scholar] [CrossRef]
- Cattaneo, M.; Tayà, C.; Burgos, L.; Morey, L.; Noguerol, J.; Provolo, G.; Cerrillo, M.; Bonmatí, A. Assessing Ammonia and Greenhouse Gas Emissions from Livestock Manure Storage: Comparison of Measurements with Dynamic and Static Chambers. Sustainability 2023, 15, 15987. [Google Scholar] [CrossRef]
- Hassouna, M.; van der Weerden, T.J.; Beltran, I.; Amon, B.; Alfaro, M.A.; Anestis, V.; Cinar, G.; Dragoni, F.; Hutchings, N.J.; Leytem, A.; et al. DATAMAN: A Global Database of Methane, Nitrous Oxide, and Ammonia Emission Factors for Livestock Housing and Outdoor Storage of Manure. J. Environ. Qual. 2023, 52, 207–223. [Google Scholar] [CrossRef]
- Osada, T.; Shiraishi, M.; Hasegawa, T.; Kawahara, H. Methane, Nitrous Oxide and Ammonia Generation in Full-Scale Swine Wastewater Purification Facilities. Front. Environ. Sci. Eng. 2017, 11, 10. [Google Scholar] [CrossRef]
- Su, J.J.; Chen, Y.J. Monitoring of Greenhouse Gas Emissions from Farm-Scale Anaerobic Piggery Waste-Water Digesters. J. Agric. Sci. 2018, 156, 739–747. [Google Scholar] [CrossRef]
- Yamashita, T.; Shiraishi, M.; Yokoyama, H.; Ogino, A.; Yamamoto-Ikemoto, R.; Osada, T. Evaluation of the Nitrous Oxide Emission Reduction Potential of an Aerobic Bioreactor Packed with Carbon Fibres for Swine Wastewater Treatment. Energies 2019, 12, 1013. [Google Scholar] [CrossRef]
- Lens, P.N.; De Poorter, M.P.; Cronenberg, C.C.; Verstraete, W.H. Sulfate Reducing and Methane Producing Bacteria in Aerobic Wastewater Treatment Systems. Water Res. 1995, 29, 871–880. [Google Scholar] [CrossRef]
- Litti, Y.V.; Nekrasova, V.K.; Kulikov, N.I.; Siman’kova, M.V.; Nozhevnikova, A.N. Detection of Anaerobic Processes and Microorganisms in Immobilized Activated Sludge of a Wastewater Treatment Plant with Intense Aeration. Microbiology 2013, 82, 690–697. [Google Scholar] [CrossRef]
- Zhang, D.; Li, H.; Li, X.; Ao, D.; Wang, N. Source of Methanogens and Characteristics of Methane Emission in Two Wastewater Treatment Plants in Xi’an. Water 2024, 16, 2101. [Google Scholar] [CrossRef]
- Wang, J.; Zhang, J.; Xie, H.; Qi, P.; Ren, Y.; Hu, Z. Methane Emissions from a Full-Scale A/A/O Wastewater Treatment Plant. Bioresour. Technol. 2011, 102, 5479–5485. [Google Scholar] [CrossRef]
- Belmonte, M.; Hsieh, C.F.; Figueroa, C.; Campos, J.L.; Vidal, G. Effect of Free Ammonia Nitrogen on the Methanogenic Activity of Swine Wastewater. Electron. J. Biotechnol. 2011, 14. [Google Scholar] [CrossRef]
- Pu, Y.; Tang, J.; Zeng, T.; Hu, Y.; Yang, J.; Wang, X.; Huang, J.; Abomohra, A. Pollutant Removal and Energy Recovery from Swine Wastewater Using Anaerobic Membrane Bioreactor: A Comparative Study with Up-Flow Anaerobic Sludge Blanket. Water 2022, 14, 2438. [Google Scholar] [CrossRef]
- Riaño, B.; García-González, M.C. Greenhouse Gas Emissions of an On-Farm Swine Manure Treatment Plant—Comparison with Conventional Storage in Anaerobic Tanks. J. Clean. Prod. 2015, 103, 542–548. [Google Scholar] [CrossRef]
- Béline, F.; Martinez, J. Nitrogen Transformations during Biological Aerobic Treatment of Pig Slurry: Effect of Intermittent Aeration on Nitrous Oxide Emissions. Bioresour. Technol. 2002, 83, 225–228. [Google Scholar] [CrossRef]
- Kishida, N.; Kim, J.H.; Kimochi, Y.; Nishimura, O.; Sasaki, H.; Sudo, R. Effect of C/N Ratio on Nitrous Oxide Emission from Swine Wastewater Treatment Process. Water Sci. Technol. 2004, 49, 359–365. [Google Scholar] [CrossRef]
- Law, Y.; Ye, L.; Pan, Y.; Yuan, Z. Nitrous Oxide Emissions from Wastewater Treatment Processes. Philos. Trans. R. Soc. B Biol. Sci. 2012, 367, 1265–1277. [Google Scholar] [CrossRef] [PubMed]
- Xie, Y.; Jiang, C.; Kuai, B.; Xu, S.; Zhuang, X. N2O Emission Reduction in the Biological Nitrogen Removal Process for Wastewater with Low C/N Ratios: Mechanisms and Strategies. Front. Bioeng. Biotechnol. 2023, 11, 1247711. [Google Scholar] [CrossRef] [PubMed]
- Hilgert, J.E.; Amon, B.; Amon, T.; Belik, V.; Dragoni, F.; Ammon, C.; Cárdenas, A.; Petersen, S.O.; Herrmann, C. Methane Emissions from Livestock Slurry: Effects of Storage Temperature and Changes in Chemical Composition. Sustainability 2022, 14, 9934. [Google Scholar] [CrossRef]
- Sommer, S.G.; Petersen, S.O.; Møller, H.B. Algorithms for Calculating Methane and Nitrous Oxide Emissions from Manure Management. Nutr. Cycl. Agroecosyst. 2004, 69, 143–154. [Google Scholar] [CrossRef]
- Park, K.H.; Thompson, A.G.; Marinier, M.; Clark, K.; Wagner-Riddle, C. Greenhouse Gas Emissions from Stored Liquid Swine Manure in a Cold Climate. Atmos. Environ. 2006, 40, 618–627. [Google Scholar] [CrossRef]
- Massara, T.M.; Malamis, S.; Guisasola, A.; Baeza, J.A.; Noutsopoulos, C.; Katsou, E. A Review on Nitrous Oxide (N2O) Emissions during Biological Nutrient Removal from Municipal Wastewater and Sludge Reject Water. Sci. Total Environ. 2017, 596–597, 106–123. [Google Scholar] [CrossRef] [PubMed]
Disclaimer/Publisher’s Note: The statements, opinions and data contained in all publications are solely those of the individual author(s) and contributor(s) and not of MDPI and/or the editor(s). MDPI and/or the editor(s) disclaim responsibility for any injury to people or property resulting from any ideas, methods, instructions or products referred to in the content. |
© 2025 by the authors. Licensee MDPI, Basel, Switzerland. This article is an open access article distributed under the terms and conditions of the Creative Commons Attribution (CC BY) license.