Quantitative Comparison of China’s Multi-Level Carbon Peaking Policies Based on Natural Language Processing



Abstract
1. Introduction
2. Data and Methods
2.1. Data Source
2.2. Methodology
2.2.1. Natural Language Processing
- (1)
- Data cleaning [33]: Remove the guiding ideology, departments responsible for division of labor, etc. from the text and standardize the text format.
- (2)
- Use Jieba for word segmentation and extract the key words and their weights in each policy text. Jieba is a Python-based (Python 3.11.7) Chinese natural language processing toolkit widely used for Chinese text segmentation, keyword extraction, and weight calculation.
- (3)
- Policy classification: Extract policy instruments from the text based on key words and uniformly define the remaining policy content as policy objectives.
- (4)
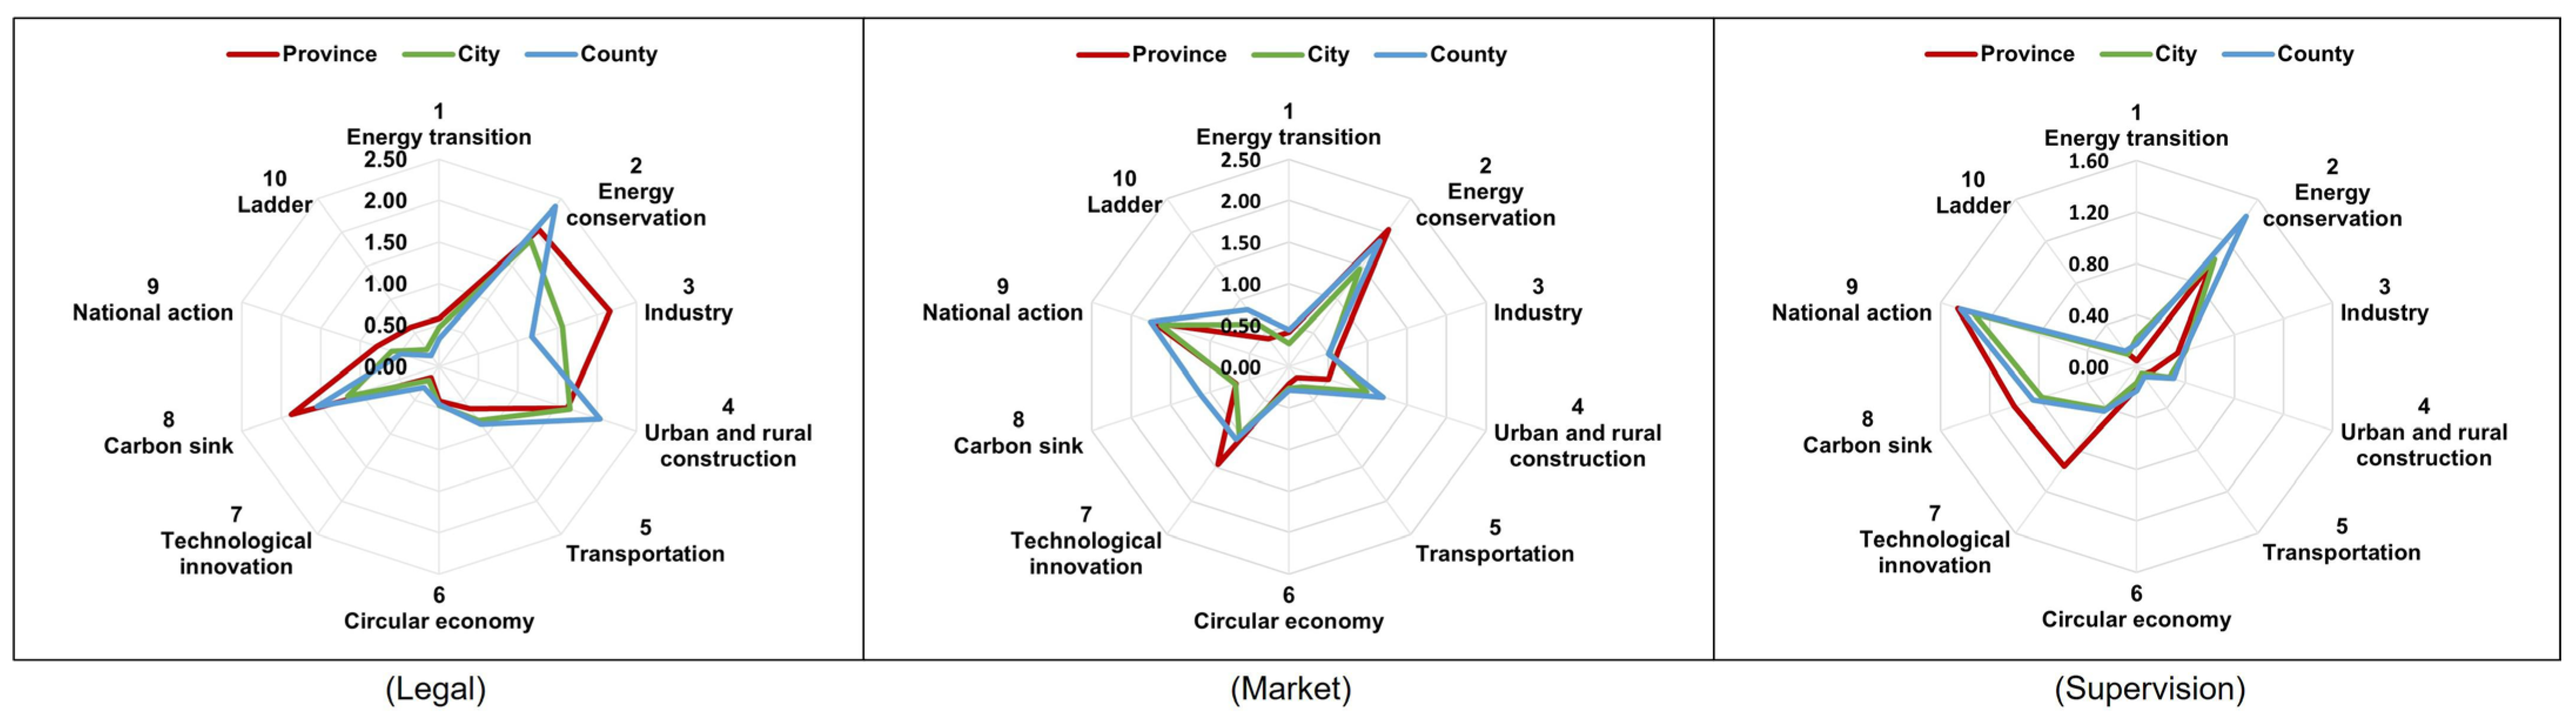
- Policy instrument scoring: Existing studies primarily classify policy instruments into 3–4 categories, such as command-and-control, market-based incentives, public participation, and composite types [26,34,35]. Examples include taxes [27], subsidies [36], tradable permits [37], economic support, technological innovation, and management improvements [38]. The choice of policy instruments by governments is influenced by multiple factors [17], and different instruments have varying effects on policy implementation outcomes [39,40]. A preliminary analysis of carbon peaking implementation plans reveals that their policy instruments are highly concentrated in three dimensions: regulation establishment, market regulation, and execution supervision. This specificity leads to significant differences in the type composition, mechanism of action, and implementation pathways; command-and-control instruments lean toward legislation, while public participation instruments lean toward public oversight. Therefore, drawing on Liao (2018) [34], this paper classifies policy instruments into legal (rigid constraints through laws, standards, approvals, etc.), market (guidance through economic means like pricing, fiscal, taxation, and finance), and supervision (ensuring execution through mechanisms like assessment, evaluation, rewards, and penalties). The keywords and scores for each instrument type are 3, 2, and 1, respectively (Table 1). It is noteworthy that a single policy sentence may contain multiple instrument keywords. However, following the uniqueness principle, each sentence was assigned to only one instrument category, with prioritization in the order of legal > market > supervision.
- (5)
- Manual marking of policy targets: One third of the policy target documents are randomly selected for manual annotation. Most existing studies’ scores are based on the precision of textual descriptions. For instance, A 4-level scoring system (3, 2.25, 1.5, 0.75) for energy-saving targets was established based on the clarity of expression [26]. Building on this, this paper categorizes policy targets into three types based on whether the text contains precise numerical values and key elements. Sentences with specific quantified values were classified as the precise type and scored as 3; texts that did not contain key elements such as a time and place or were expressed ambiguously were classified as the vague type and received a score of 1. Texts that fell between the two were uniformly set as the general type and received a score of 2 (Table 1).
- (6)
- Calculation of policy intensity: At present, there is no unified standard for the definition of and calculation method for policy intensity in various studies. In existing research, policy intensity has been conceptualized primarily through two distinct approaches. One approach defines policy intensity as the product of the policy instrument intensity and policy target intensity, emphasizing that these two components together constitute the complete dimension of policy intervention [24]. Another approach expands this model by incorporating the factor of the policy level, defining policy intensity as the product of the policy instrument intensity, policy target intensity, and policy level intensity, thereby offering a more comprehensive characterization of a policy’s overall impact [26]. Since this study investigates hierarchical differences, it refers to the method of Zhang et al. (2022) [24], defining policy intensity as the product of the policy target intensity and policy instrument intensity:
2.2.2. Machine Learning
3. Results
3.1. Policy Keywords
3.2. Hierarchical Differences in Policy Instruments
3.3. Hierarchical Differences in Policy Targets
3.4. Hierarchical Differences in Policy Intensity
4. Discussion
5. Conclusions
5.1. Key Findings
5.2. Policy Implications
5.3. Limitations and Future Research Directions
Supplementary Materials
Author Contributions
Funding
Institutional Review Board Statement
Informed Consent Statement
Data Availability Statement
Conflicts of Interest
References
- Michaelowa, A.; Shishlov, I.; Brescia, D. Evolution of International Carbon Markets: Lessons for the Paris Agreement. WIREs Clim. Change 2019, 10, e613. [Google Scholar] [CrossRef]
- Plataniotis, A. Transforming Our World: Interdisciplinary Insights on the Sustainable Development Goals. Available online: https://egd-report-2023.unsdsn.org/ (accessed on 25 November 2025).
- He, W.; Yang, Y.; Gu, W. A Comparative Analysis of China’s Provincial Carbon Emission Allowances Allocation Schemes by 2030: A Resource Misallocation Perspective. J. Clean. Prod. 2022, 361, 132192. [Google Scholar] [CrossRef]
- Sullivan, E.; Fraussen, B.; Braun, C. Lead, Link, or Leverage? An Integrative Framework to Assess Different Government Roles in Collaborative Governance Processes across Political Systems. Policy Stud. J. 2025, 53, 971–993. [Google Scholar] [CrossRef]
- Bunea, A.; Nørbech, I. Does Public Participation Foster Stakeholder Support for Policy Proposals? Evidence from the European Union. Policy Stud. J. 2025, psj.70027. [Google Scholar] [CrossRef]
- Colantone, I.; Di Lonardo, L.; Margalit, Y.; Percoco, M. The Political Consequences of Green Policies: Evidence from Italy. Am. Polit. Sci. Rev. 2024, 118, 108–126. [Google Scholar] [CrossRef]
- Anfinson, K. Capture or Empowerment: Governing Citizens and the Environment in the European Renewable Energy Transition. Am. Polit. Sci. Rev. 2023, 117, 927–939. [Google Scholar] [CrossRef]
- Zhang, S.; Ma, X.; Cui, Q.; Liu, J. Does the Low Carbon Transition Impact Urban Resilience? Evidence from China’s Pilot Cities for Carbon Emissions Trading. Res. Sq. 2024. [Google Scholar] [CrossRef] [PubMed]
- Full Text: Working Guidance for Carbon Dioxide Peaking and Carbon Neutrality in Full and Faithful Implementation of the New Development Philosophy. Available online: https://english.www.gov.cn/policies/latestreleases/202110/25/content_WS61760047c6d0df57f98e3c21.html (accessed on 16 December 2025).
- China Maps Path to Carbon Peak, Neutrality Under New Development Philosophy. Available online: https://english.www.gov.cn/policies/latestreleases/202110/24/content_WS61755fe9c6d0df57f98e3bed.html (accessed on 16 December 2025).
- Jiang, X.; Xie, F. Decomposition Analysis of Carbon Emission Drivers and Peaking Pathways for Key Sectors under China’s Dual Carbon Goals: A Case Study of Jiangxi Province, China. Sustainability 2024, 16, 5811. [Google Scholar] [CrossRef]
- Wei, Y.-M.; Chen, K.; Kang, J.-N.; Chen, W.; Wang, X.-Y.; Zhang, X. Policy and Management of Carbon Peaking and Carbon Neutrality: A Literature Review. Engineering 2022, 14, 52–63. [Google Scholar] [CrossRef]
- Jia, X.; Zhang, Y.; Tan, R.R.; Li, Z.; Wang, S.; Wang, F.; Fang, K. Multi-Objective Energy Planning for China’s Dual Carbon Goals. Sustain. Prod. Consum. 2022, 34, 552–564. [Google Scholar] [CrossRef]
- Full Text: Carbon Peaking and Carbon Neutrality China’s Plans and Solutions. Available online: https://english.www.gov.cn/archive/whitepaper/202511/08/content_WS690ee812c6d00ca5f9a076cd.html (accessed on 16 December 2025).
- Fu, C.; Liao, L.; Mo, T.; Chen, X. How China’s Great Bay Area Policies Affect the National Identity of Hong Kong Youth—A Study of a Quasi-Natural Experiment Based on the Difference-in-Differences Model. Behav. Sci. 2023, 13, 644. [Google Scholar] [CrossRef]
- Cantarelli, P.; Belle, N.; Hall, J.L. Information Use in Public Administration and Policy Decision-making: A Research Synthesis. Public Adm. Rev. 2023, 83, 1667–1686. [Google Scholar] [CrossRef]
- Krause, R.M.; Hawkins, C.V.; Park, A.Y.S.; Feiock, R.C. Drivers of Policy Instrument Selection for Environmental Management by Local Governments. Public Adm. Rev. 2019, 79, 477–487. [Google Scholar] [CrossRef]
- Gao, M. The Impacts of Carbon Trading Policy on China’s Low-Carbon Economy Based on County-Level Perspectives. Energy Policy 2023, 175, 113494. [Google Scholar] [CrossRef]
- Li, T.; Song, S.; Yang, Y. Driving Restrictions, Traffic Speeds and Carbon Emissions: Evidence from High-Frequency Data. China Econ. Rev. 2022, 74, 101811. [Google Scholar] [CrossRef]
- Nabernegg, S.; Bednar-Friedl, B.; Muñoz, P.; Titz, M.; Vogel, J. National Policies for Global Emission Reductions: Effectiveness of Carbon Emission Reductions in International Supply Chains. Ecol. Econ. 2019, 158, 146–157. [Google Scholar] [CrossRef]
- Lin, B.; Chen, Y. Impacts of Policies on Innovation in Wind Power Technologies in China. Appl. Energy 2019, 247, 682–691. [Google Scholar] [CrossRef]
- Wu, J.; Nie, X.; Wang, H. Are Policy Mixes in Energy Regulation Effective in Curbing Carbon Emissions? Insights from China’s Energy Regulation Policies. J. Policy Anal. Manag. 2024, 43, 1152–1184. [Google Scholar] [CrossRef]
- He, P.; Wang, Q.-C.; Shen, G.Q. The Carbon Emission Implications of Intensive Urban Land Use in Emerging Regions: Insights from Chinese Cities. Urban. Sci. 2024, 8, 75. [Google Scholar] [CrossRef]
- Zhang, G.; Gao, Y.; Li, J.; Su, B.; Chen, Z.; Lin, W. China’s Environmental Policy Intensity for 1978–2019. Sci. Data 2022, 9, 75. [Google Scholar] [CrossRef] [PubMed]
- Wu, L.; Huang, Z.; Zhang, X.; Wang, Y. Harmonizing Existing Climate Change Mitigation Policy Datasets with a Hybrid Machine Learning Approach. Sci. Data 2024, 11, 580. [Google Scholar] [CrossRef] [PubMed]
- Dong, X.; Wang, C.; Zhang, F.; Zhang, H.; Xia, C. China’s Low-Carbon Policy Intensity Dataset from National- to Prefecture-Level over 2007–2022. Sci. Data 2024, 11, 213. [Google Scholar] [CrossRef]
- Li, B.; Fu, E.; Yang, S.; Lin, J.; Zhang, W.; Zhang, J.; Lu, Y.; Wang, J.; Jiang, H. Measuring China’s Policy Stringency on Climate Change for 1954–2022. Sci. Data 2025, 12, 188. [Google Scholar] [CrossRef]
- Xiaolong, T.; Christensen, T. Leading Groups: Public Sector Reform with Chinese Characteristics in a Post-NPM Era. Int. Public Manag. J. 2023, 26, 66–86. [Google Scholar] [CrossRef]
- Wu, Y.; Wang, C.; Ji, R.; Li, Y.; Yang, J.; Wang, Y.; Li, R.; Wu, M.; Chen, J.; Yang, J. Metricizing Policy Texts: Comprehensive Dataset on China’s Agri-Policy Intensity Spanning 1982–2023. Sci. Data 2024, 11, 528. [Google Scholar] [CrossRef] [PubMed]
- Cheng, S.H.; Augustin, C.; Bethel, A.; Gill, D.; Anzaroot, S.; Brun, J.; DeWilde, B.; Minnich, R.C.; Garside, R.; Masuda, Y.J.; et al. Using Machine Learning to Advance Synthesis and Use of Conservation and Environmental Evidence. Conserv. Biol. 2018, 32, 762–764. [Google Scholar] [CrossRef]
- Tripathy, J.K.; Sethuraman, S.C.; Cruz, M.V.; Namburu, A.; P., M.; R., N.K.; S, S.I.; Vijayakumar, V. Comprehensive Analysis of Embeddings and Pre-Training in NLP. Comput. Sci. Rev. 2021, 42, 100433. [Google Scholar] [CrossRef]
- Tang, T.; Tang, X.; Yuan, T. Fine-Tuning BERT for Multi-Label Sentiment Analysis in Unbalanced Code-Switching Text. IEEE Access 2020, 8, 193248–193256. [Google Scholar] [CrossRef]
- Carvalho, S.A.; Lazaro, L.L.B.; Young, A.F.; Coelho, R.R.A.; Ortega, F.J.M.; Hecksher, C.B.M.C.; Cardoso, J.R.; Ferreira, J.S.W.; Jacobi, P.R.; Junior, A.P.; et al. Assessing the Alignment of Brazilian Local Government Plans with the United Nations’ Sustainable Development Goals. Sustainability 2024, 16, 10672. [Google Scholar] [CrossRef]
- Liao, Z. Content Analysis of China’s Environmental Policy Instruments on Promoting Firms’ Environmental Innovation. Environ. Sci. Policy 2018, 88, 46–51. [Google Scholar] [CrossRef]
- Yi, M.; Fang, X.; Wen, L.; Guang, F.; Zhang, Y. The Heterogeneous Effects of Different Environmental Policy Instruments on Green Technology Innovation. Int. J. Environ. Res. Public Health 2019, 16, 4660. [Google Scholar] [CrossRef]
- Zhang, Z.; Chen, Y.; Mishra, A.K.; Ni, M. Effects of Agricultural Subsidy Policy Adjustment on Carbon Emissions: A Quasi-Natural Experiment in China. J. Clean. Prod. 2025, 487, 144603. [Google Scholar] [CrossRef]
- Zhang, L.; Xue, L.; Zhou, Y. How Do Low-Carbon Policies Promote Green Diffusion among Alliance-Based Firms in China? An Evolutionary-Game Model of Complex Networks. J. Clean. Prod. 2019, 210, 518–529. [Google Scholar] [CrossRef]
- Zhang, L.; Qin, Q.; Wei, Y.-M. China’s Distributed Energy Policies: Evolution, Instruments and Recommendation. Energy Policy 2019, 125, 55–64. [Google Scholar] [CrossRef]
- Jager, N.W.; Newig, J.; Challies, E.; Kochskämper, E. Pathways to Implementation: Evidence on How Participation in Environmental Governance Impacts on Environmental Outcomes. J. Public Adm. Res. Theory 2020, 30, 383–399. [Google Scholar] [CrossRef]
- Li, H.; Zhu, X.; Chen, J.; Jiang, F. Environmental Regulations, Environmental Governance Efficiency and the Green Transformation of China’s Iron and Steel Enterprises. Ecol. Econ. 2019, 165, 106397. [Google Scholar] [CrossRef]
- Firebanks-Quevedo, D.; Planas, J.; Buckingham, K.; Taylor, C.; Silva, D.; Naydenova, G.; Zamora-Cristales, R. Using machine learning to identify incentives in forestry policy: Towards a new paradigm in policy analysis. For. Policy Econ. 2022, 134, 102624. [Google Scholar] [CrossRef]
- Sabbah, T.; Selamat, A.; Selamat, M.H.; Al-Anzi, F.S.; Viedma, E.H.; Krejcar, O.; Fujita, H. Modified Frequency-Based Term Weighting Schemes for Text Classification. Appl. Soft Comput. 2017, 58, 193–206. [Google Scholar] [CrossRef]
- Passalis, N. Learning Bag-of-Embedded-Words Representations for Textual Information Retrieval. Pattern Recognit. 2018, 81, 254–267. [Google Scholar] [CrossRef]
- Dey, A.; Jenamani, M.; Thakkar, J.J. Senti-N-Gram: An n -Gram Lexicon for Sentiment Analysis. Expert. Syst. Appl. 2018, 103, 92–105. [Google Scholar] [CrossRef]
- Shiri Harzevili, N.; Alizadeh, S.H. Mixture of Latent Multinomial Naive Bayes Classifier. Appl. Soft Comput. 2018, 69, 516–527. [Google Scholar] [CrossRef]
- Wankhade, M.; Rao, A.C.S.; Kulkarni, C. A Survey on Sentiment Analysis Methods, Applications, and Challenges. Artif. Intell. Rev. 2022, 55, 5731–5780. [Google Scholar] [CrossRef]
- Saura, J.R.; Palacios-Marqués, D.; Ribeiro-Soriano, D. Exploring the Boundaries of Open Innovation: Evidence from Social Media Mining. Technovation 2023, 119, 102447. [Google Scholar] [CrossRef]
- Wang, Q.; Zhang, F.; Li, R.; Sun, J. Does Artificial Intelligence Promote Energy Transition and Curb Carbon Emissions? The Role of Trade Openness. J. Clean. Prod. 2024, 447, 141298. [Google Scholar] [CrossRef]
- Holladay, J.S.; Mohsin, M.; Pradhan, S. Environmental Policy Instrument Choice and International Trade. Environ. Resource Econ. 2019, 74, 1585–1617. [Google Scholar] [CrossRef]
- Zhu, Y.; Hu, Y.; Zhu, Y. Can China’s Energy Policies Achieve the “Dual Carbon” Goal? A Multi-Dimensional Analysis Based on Policy Text Tools. Environ. Dev. Sustain. 2024. [Google Scholar] [CrossRef]
- Casady, C.B.; Petersen, O.H.; Brogaard, L. Public Procurement Failure: The Role of Transaction Costs and Government Capacity in Procurement Cancellations. Public Manag. Rev. 2023, 1–28. [Google Scholar] [CrossRef]
- Ferreira, C.; Broughton, K.; Broadhurst, K.; Ferreira, J. Collaborative Innovation in a Local Authority – ‘Local Economic Development-by-Project’? Public Manag. Rev. 2024, 26, 1405–1423. [Google Scholar] [CrossRef]
- Yang, J.; Ding, X. Textual Analysis of China’s Environmental Policies from the Perspective of Policy Instruments. Sustainability 2024, 16, 9787. [Google Scholar] [CrossRef]
- Mu, R.; Cui, T. Facilitating Inter-Municipal Collaboration through Mandated Collaborative Platform: Evidence from Regional Environmental Protection in China. Public Manag. Rev. 2024, 26, 1684–1705. [Google Scholar] [CrossRef]
- United Nations Framework Convention on Climate Change. In Proceedings of the United Nations Conference on Environment and Development, Rio de Janeiro, Brazil, 3–14 June 1992; Available online: https://unfccc.int/process-and-meetings/united-nations-framework-convention-on-climate-change (accessed on 20 December 2025).
- Cinar, E.; Simms, C.; Trott, P.; Demircioglu, M.A. Public Sector Innovation in Context: A Comparative Study of Innovation Types. Public Manag. Rev. 2024, 26, 265–292. [Google Scholar] [CrossRef]
- Qin, Q.; Wen, Z.; Zhou, Z.; Fan, B. Leveraging Social Media for New Energy Vehicle Policy Diffusion in China: A Central-Local Government Interaction Analysis. Transp. Res. Part. A Policy Pract. 2025, 195, 104459. [Google Scholar] [CrossRef]
- Magazzino, C.; Mele, M.; Schneider, N. A Machine Learning Approach on the Relationship among Solar and Wind Energy Production, Coal Consumption, GDP, and CO2 Emissions. Renew. Energy 2021, 167, 99–115. [Google Scholar] [CrossRef]
- Zhang, Z.; Liu, Y.; Ma, T. Assessing Spatiotemporal Characteristics and Driving Factors of Urban Public Buildings Carbon Emissions in China: An Approach Based on LMDI Analysis. Atmosphere 2023, 14, 1280. [Google Scholar] [CrossRef]
- Guo, C.; Yu, J. Determinants and Their Spatial Heterogeneity of Carbon Emissions in Resource-Based Cities, China. Sci. Rep. 2024, 14, 5894. [Google Scholar] [CrossRef]
- Zhang, P.; Wang, H. Do Provincial Energy Policies and Energy Intensity Targets Help Reduce CO2 Emissions? Evidence from China. Energy 2022, 245, 123275. [Google Scholar] [CrossRef]
- Huo, T.; Cao, R.; Xia, N.; Hu, X.; Cai, W.; Liu, B. Spatial Correlation Network Structure of China’s Building Carbon Emissions and Its Driving Factors: A Social Network Analysis Method. J. Environ. Manag. 2022, 320, 115808. [Google Scholar] [CrossRef] [PubMed]
- Gorus, M.S. Do Tight Environmental Regulations Cause Economic Contraction? Panel Evidence from the European Countries. Nat. Resour. Forum 2024, 48, 663–680. [Google Scholar] [CrossRef]
- Yao, S.; Zhang, S.; Zhang, X. Renewable Energy, Carbon Emission and Economic Growth: A Revised Environmental Kuznets Curve Perspective. J. Clean. Prod. 2019, 235, 1338–1352. [Google Scholar] [CrossRef]
- Liu, Y.; Ma, H. Evaluation of China’s ESG Policy Texts Based on the “Instrument-Theme-Subject” Framework. Sustainability 2025, 17, 7796. [Google Scholar] [CrossRef]
- Wandelt, S.; Zhang, Y.; Sun, X. Sustainable Aviation Fuels: A Meta-Review of Surveys and Key Challenges. J. Air Transp. Res. Soc. 2025, 4, 100056. [Google Scholar] [CrossRef]
- Watson, M.J.; Machado, P.G.; Da Silva, A.V.; Saltar, Y.; Ribeiro, C.O.; Nascimento, C.A.O.; Dowling, A.W. Sustainable Aviation Fuel Technologies, Costs, Emissions, Policies, and Markets: A Critical Review. J. Clean. Prod. 2024, 449, 141472. [Google Scholar] [CrossRef]
- Shahabuddin, M.; Alam, M.T.; Krishna, B.B.; Bhaskar, T.; Perkins, G. A Review on the Production of Renewable Aviation Fuels from the Gasification of Biomass and Residual Wastes. Bioresour. Technol. 2020, 312, 123596. [Google Scholar] [CrossRef]
- Liu, Y.; Du, M.; Yang, L.; Cui, Q.; Liu, Y.; Li, X.; Zhu, N.; Li, Y.; Jiang, C.; Zhou, P.; et al. Mitigation Policies Interactions Delay the Achievement of Carbon Neutrality in China. Nat. Clim. Change 2025, 15, 147–152. [Google Scholar] [CrossRef]
- Liu, R.; Zhang, Y. Quantifying Global Cooperation in the Sustainable Development Goals. Sustainability 2025, 17, 11283. [Google Scholar] [CrossRef]
- Xing, Q.; Wu, C.; Chen, F.; Liu, J.; Pradhan, P.; Bryan, B.A.; Schaubroeck, T.; Carrasco, L.R.; Gonsamo, A.; Li, Y.; et al. Intranational Synergies and Trade-Offs Reveal Common and Differentiated Priorities of Sustainable Development Goals in China. Nat. Commun. 2024, 15, 2251. [Google Scholar] [CrossRef]
- Mills-Novoa, M.; Liverman, D.M. Nationally Determined Contributions: Material Climate Commitments and Discursive Positioning in the NDCs. WIREs Clim. Change 2019, 10, e589. [Google Scholar] [CrossRef]
- Song, W.; Cao, S.; Du, M.; Lu, L.; Guo, H.; Wang, S.; Liu, Y.; Li, X. Provincial Localization Framework for SDGs in China: Enhancing Support for Sustainable Governance. Appl. Geogr. 2025, 175, 103505. [Google Scholar] [CrossRef]
- Xiao, S.; Zhu, X. Bureaucratic Control and Strategic Compliance: How Do Subnational Governments Implement Central Guidelines in China? J. Public. Adm. Res. Theory 2022, 32, 342–359. [Google Scholar] [CrossRef]
- Ma, W.; Hoppe, T.; De Jong, M. Policy Accumulation in China: A Longitudinal Analysis of Circular Economy Initiatives. Sustain. Prod. Consum. 2022, 34, 490–504. [Google Scholar] [CrossRef]





| Dimension | Category | Score | Keywords and Examples |
|---|---|---|---|
| Policy instrument | Legal | 3 | Laws, standards, approvals, violations, and irregularities, etc. |
| Market | 2 | Taxation, electricity prices, finance, loans, bonds, credit, etc. | |
| Supervision | 1 | Assessment, evaluation, commendation, rewards, criticism, etc. | |
| Policy target | Precise | 3 | By 2025, the proportion of non-fossil energy consumption will reach 24% |
| By 2025, the annual utilization volume of bulk solid waste will reach approximately 4 million tons | |||
| General | 2 | During the “15th Five-Year Plan” period, carbon emissions in the construction sector continued to decline | |
| By 2025, a provincial carbon benefit application platform will be initially established | |||
| Vague | 1 | Develop agricultural and forestry biomass power generation and waste incineration power generation in accordance with local conditions | |
| Develop hydropower in accordance with local conditions and encourage the expansion and potential tapping of hydropower capacity |
| Model Combination | Report | Best Parameters Found | |||||
|---|---|---|---|---|---|---|---|
| Parameter | Accuracy | Precision | Recall | F1 | C | Gamma | Kernel |
| TF-IDF+SVM | 0.87 | 0.87 | 0.87 | 0.87 | 100 | 0.1 | rbf |
| Level | Legal | Market | Supervision | Total | |||
|---|---|---|---|---|---|---|---|
| Quantity | Proportion | Quantity | Proportion | Quantity | Proportion | Quantity | |
| Country | 26.0 | 47.3% | 22.0 | 40.0% | 7.0 | 12.7% | 55.0 |
| Province | 17.8 | 35.5% | 23.4 | 45.5% | 9.5 | 19.0% | 50.7 |
| City | 13.4 | 31.1% | 19.5 | 45.0% | 9.6 | 23.9% | 42.5 |
| County | 13.0 | 30.6% | 19.9 | 45.9% | 9.8 | 23.4% | 42.7 |
| Level | Precise | General | Vague | Total | |||
|---|---|---|---|---|---|---|---|
| Quantity | Proportion | Quantity | Proportion | Quantity | Proportion | Quantity | |
| Country | 19.0 | 6.9% | 38.0 | 13.8% | 218.0 | 79.3% | 275.0 |
| Province | 23.7 | 8.5% | 47.3 | 17.1% | 205.4 | 74.4% | 276.4 |
| City | 23.0 | 9.2% | 48.7 | 19.6% | 176.2 | 71.2% | 247.9 |
| County | 21.6 | 8.4% | 43.7 | 17.7% | 179.5 | 73.8% | 244.8 |
| Dimension | Sub-Dimension | Specific Indicator | Policy Instrument Intensity | Policy Target Intensity | Policy Intensity | |||
|---|---|---|---|---|---|---|---|---|
| Correlation Coefficient | p Value | Correlation Coefficient | p Value | Correlation Coefficient | p Value | |||
| Economic Level | Regional GDP | Regional GDP (CNY 100 million) 2023 | −0.28 | 0.20 | −0.30 | 0.17 | −0.33 | 0.13 |
| Per Capita Economic Indicators | Per Capita Regional GDP (CNY/person) 2023 | −0.51 | 0.01 | −0.48 | 0.02 | −0.49 | 0.02 | |
| Per Capita Disposable Income of All Residents (CNY) 2023 | −0.50 | 0.01 | −0.46 | 0.03 | −0.48 | 0.02 | ||
| Per Capita Consumption Expenditure of All Residents (CNY) 2023 | −0.49 | 0.02 | −0.45 | 0.03 | −0.47 | 0.02 | ||
| Industrial Structure | Value Added by Primary Industry (CNY 100 million) 2023 | 0.04 | 0.84 | −0.08 | 0.71 | −0.04 | 0.86 | |
| Value Added by Secondary Industry (CNY 100 million) 2023 | −0.18 | 0.42 | −0.19 | 0.39 | −0.22 | 0.30 | ||
| Value Added by Tertiary Industry (CNY 100 million) 2023 | −0.37 | 0.08 | −0.38 | 0.07 | −0.41 | 0.05 | ||
| Value Added by Industry (CNY 100 million) 2023 | −0.18 | 0.40 | −0.18 | 0.42 | −0.22 | 0.31 | ||
| Value Added by Construction (CNY 100 million) 2023 | −0.13 | 0.56 | −0.24 | 0.27 | −0.23 | 0.30 | ||
| Value Added by Agriculture, Forestry, Animal Husbandry, and Fishery (CNY 100 million) 2023 | 0.04 | 0.87 | −0.08 | 0.71 | −0.04 | 0.84 | ||
| Value Added by Wholesale and Retail Trade (CNY 100 million) 2023 | −0.25 | 0.25 | −0.26 | 0.24 | −0.30 | 0.16 | ||
| Value Added by Transport, Storage, and Postal Services (CNY 100 million) 2023 | −0.26 | 0.23 | −0.24 | 0.26 | −0.29 | 0.18 | ||
| Value Added by Accommodation and Catering Services (CNY 100 million) 2023 | −0.22 | 0.30 | −0.30 | 0.16 | −0.30 | 0.16 | ||
| Value Added by Financial Intermediation (CNY 100 million) 2023 | −0.45 | 0.03 | −0.46 | 0.03 | −0.48 | 0.02 | ||
| Value Added by Real Estate (CNY 100 million) 2023 | −0.28 | 0.20 | −0.32 | 0.13 | −0.34 | 0.11 | ||
| Value Added by Other Industries (CNY 100 million) 2023 | −0.42 | 0.05 | −0.43 | 0.04 | −0.45 | 0.03 | ||
| Population Size | Total Population | Year-End Resident Population (10,000 persons) 2023 | −0.09 | 0.68 | −0.18 | 0.41 | −0.17 | 0.44 |
| Urbanization and Density | Urbanization Rate (%) 2023 | −0.30 | 0.16 | −0.25 | 0.25 | −0.27 | 0.21 | |
| Urban Population Density (persons/km2) 2019 | 0.10 | 0.66 | −0.06 | 0.77 | −0.04 | 0.86 | ||
| Environment and Ecology | Carbon Emissions | Total Greenhouse Gas Emissions (10,000 tons CO2 equivalent) 2021 | −0.04 | 0.87 | 0.18 | 0.41 | 0.09 | 0.70 |
| Per Capita Greenhouse Gas Emissions (tons CO2 equivalent/person) 2021 | 0.07 | 0.74 | 0.39 | 0.06 | 0.28 | 0.20 | ||
| Greenhouse Gas Emissions per Unit GDP (tons CO2 equivalent/10,000 yuan) 2021 | 0.13 | 0.55 | 0.39 | 0.07 | 0.29 | 0.17 | ||
| Greening and Ecology | Urban Green Space Area (10,000 hectares) 2023 | −0.16 | 0.45 | −0.12 | 0.57 | −0.18 | 0.42 | |
| Forest Coverage Rate (%) 2023 | 0.20 | 0.37 | −0.22 | 0.31 | 0.00 | 1.00 | ||
| Forest Area (10,000 hectares) 2023 | 0.11 | 0.63 | 0.08 | 0.72 | 0.12 | 0.60 | ||
| Forestry Land Area (10,000 hectares) 2023 | 0.11 | 0.62 | 0.17 | 0.44 | 0.17 | 0.43 | ||
| Energy Consumption and Production | Energy Consumption | Electricity Consumption (100 million kWh) 2023 | −0.17 | 0.45 | −0.07 | 0.75 | −0.14 | 0.51 |
| Coal Consumption (10,000 tons) 2019 | 0.11 | 0.62 | 0.31 | 0.15 | 0.24 | 0.27 | ||
| Kerosene Consumption (10,000 tons) 2019 | −0.51 | 0.01 | −0.54 | 0.01 | −0.53 | 0.01 | ||
| Gasoline Consumption (10,000 tons) 2019 | −0.19 | 0.39 | −0.20 | 0.36 | −0.20 | 0.36 | ||
| Natural Gas Consumption (100 million cubic meters) 2019 | −0.23 | 0.30 | −0.28 | 0.19 | −0.29 | 0.17 | ||
| Energy Production | Investment in Energy Industry (100 million yuan) 2017 | −0.03 | 0.89 | 0.05 | 0.81 | −0.02 | 0.94 | |
| Electricity Generation (100 million kWh) 2021 | −0.10 | 0.64 | 0.04 | 0.87 | −0.04 | 0.86 | ||
Disclaimer/Publisher’s Note: The statements, opinions and data contained in all publications are solely those of the individual author(s) and contributor(s) and not of MDPI and/or the editor(s). MDPI and/or the editor(s) disclaim responsibility for any injury to people or property resulting from any ideas, methods, instructions or products referred to in the content. |
© 2025 by the authors. Licensee MDPI, Basel, Switzerland. This article is an open access article distributed under the terms and conditions of the Creative Commons Attribution (CC BY) license.
Share and Cite
Zhen, M.; Li, H.; Wang, Y. Quantitative Comparison of China’s Multi-Level Carbon Peaking Policies Based on Natural Language Processing. Sustainability 2026, 18, 296. https://doi.org/10.3390/su18010296
Zhen M, Li H, Wang Y. Quantitative Comparison of China’s Multi-Level Carbon Peaking Policies Based on Natural Language Processing. Sustainability. 2026; 18(1):296. https://doi.org/10.3390/su18010296
Chicago/Turabian StyleZhen, Mengmeng, Huimin Li, and Yufei Wang. 2026. "Quantitative Comparison of China’s Multi-Level Carbon Peaking Policies Based on Natural Language Processing" Sustainability 18, no. 1: 296. https://doi.org/10.3390/su18010296
APA StyleZhen, M., Li, H., & Wang, Y. (2026). Quantitative Comparison of China’s Multi-Level Carbon Peaking Policies Based on Natural Language Processing. Sustainability, 18(1), 296. https://doi.org/10.3390/su18010296