1. Introduction
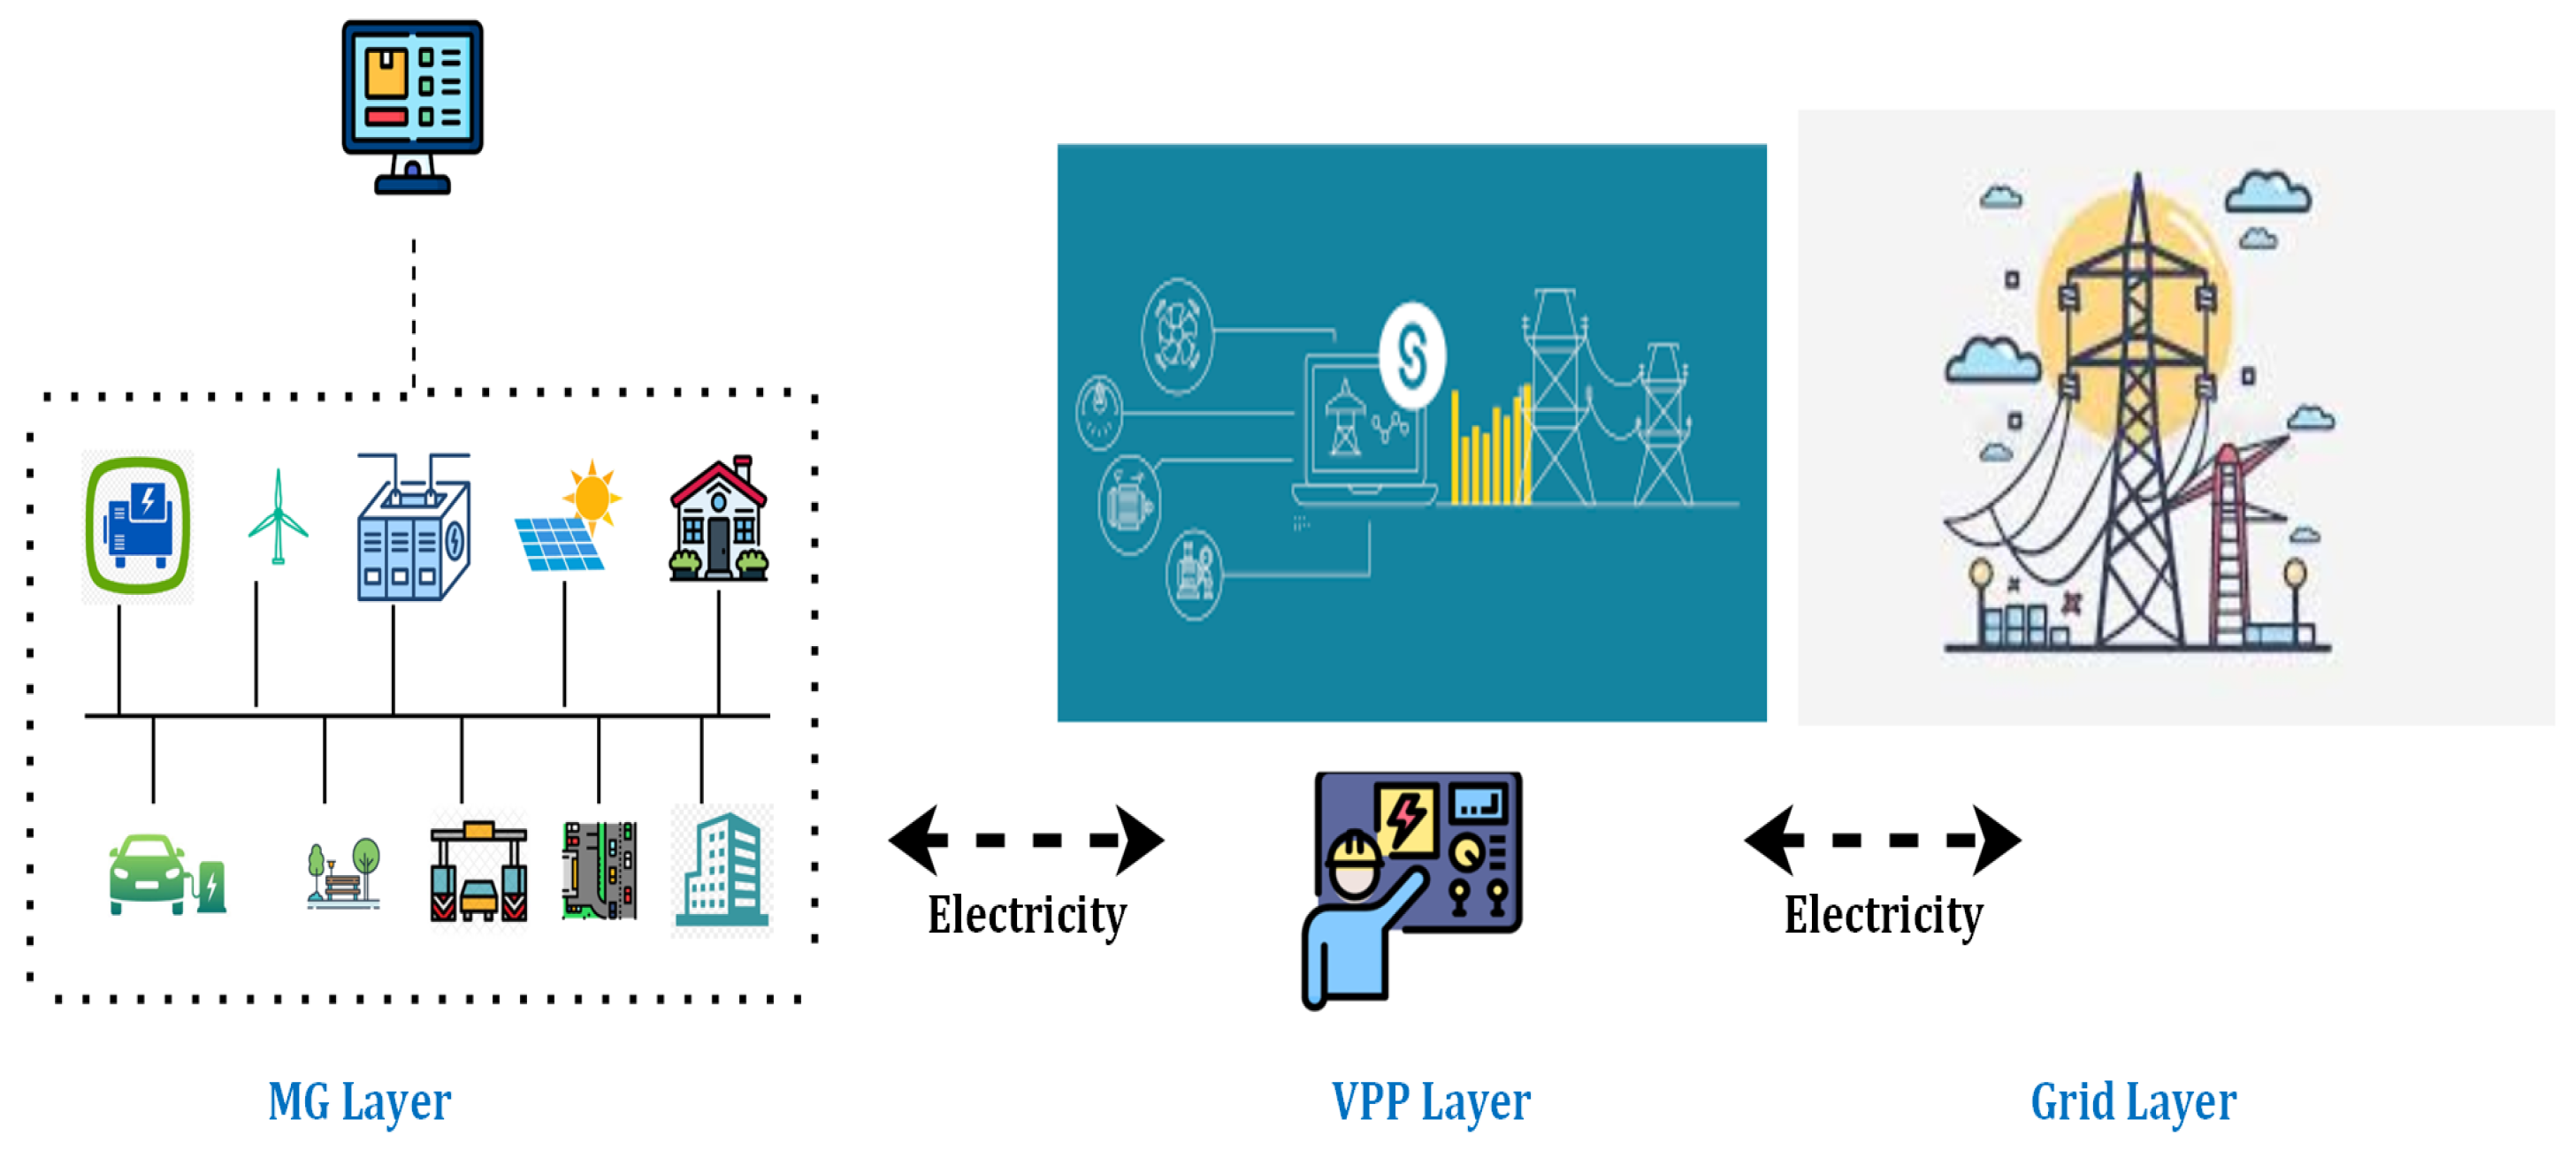
The rising need for a sustainable and reliable energy supply and the worldwide push for decarbonization are part of heightened energy management difficulties. A microgrid (MG) operates independently or in cooperation with the main grid and satisfies the energy demands of residential and non-residential users. However, the integration of multi-microgrids (MMGs) in settlements and along networks of roads raises a number of particularly significant difficulties, such as the synchronization between the local energy source and storage systems with their load. This can be achieved through the creation of virtual power plants (VPPs) that work as aggregates of distributed energy resources (DERs) and optimize the working of the MGs in the interconnected grid system. Global climate change and greenhouse gas (GHG) emissions are compelling a transition towards decarbonized energy systems through a wider utilization of the distributed energy resources, but a significant barrier to this is the impracticality of managing and integrating directly too many DERs, which are geographically widespread and have diverse economic and social particularities, in the energy market. The virtual power plant represents one solution for transregional aggregation of the diverse DERs, such as renewable energy sources (RESs), energy storage systems (ESSs), flexible loads and electric vehicles (EVs) to facilitate their management in a tidy portfolio. The quest for sustainable growth in the 21st century has added a lot of complexity to energy planning, which now needs to optimize a lot of different techno-economic and environmental requirements at the same time [
1].
An essential part of the contemporary energy landscape is the strategic planning of the infrastructure for electric vehicle charging. The authors in [
2] proposed an integrated approach to EV charging station design that specifically takes into consideration the intricate influence of vehicle route patterns on the best location for stations. It was observed that their method, which makes use of an advanced two-stage adaptive cooperative evolutionary clustering algorithm, may successfully lower overall building costs without sacrificing service coverage. At the same time, MGs are becoming more and more important for maximizing the use of dispersed renewable energy sources. The two main hierarchical steps of this optimization process are individual MG optimization, which focuses on internal energy balance and economic dispatch, and MMG optimization, which controls power flows and transactions among connected MGs. In these systems, efficient and intelligent energy scheduling is crucial to maximizing the use of distributed energy resources. These scheduling strategies have a direct and significant impact on important performance metrics, including overall energy efficiency, supply reliability during grid failures, and maintaining power quality for sensitive loads [
3]. The natural insecurities in renewable energy are being solved using advanced computing methods. In [
4], the authors established an ideal scheduling platform of the MGs through the integration of a robust optimization platform and probabilistic prediction using machine learning. The hybrid solution solved severe problems of uncertainty in the periodicity of the renewable energy supply and sudden rises and falls in the energy market prices, enhancing the resiliency of the system in terms of both operations and finances. To further enhance real-time control, authors in [
5] proposed a novel supervised learning approach for optimal power scheduling in isolated MGs. The optimal charge–discharge choices for battery energy storage systems were successfully simulated and replicated by this method, which significantly lowers daily operating expenses. Isolated, single-MG systems have inherent constraints and are frequently insufficient to provide the whole gamut of contemporary energy demands, especially at larger scales, as research and real-world applications in distributed energy have developed. The creation and spread of MMG systems were directly influenced by this realization. These MMG systems significantly increase the quality and penetration of renewable energy integration by facilitating power exchange and ancillary service support amongst nearby MGs. Compared to isolated MGs or conventional centralized grid systems, this interconnected architecture increases the diversity, resilience, and environmental sustainability of regional electricity consumption [
6]. The authors in [
7] presented a real-time optimization control technique based on the collaborative energy storage concept in order to handle the heightened complexity of these systems. This approach improves the MMG system’s overall resilience and dependability, making it more capable of withstanding and recovering from both external grid disturbances and internal errors.
In VPPs with many MGs, energy management is a complex area at the nexus of smart grids, control theory, optimization, and artificial intelligence (AI), particularly for energy price prediction. The state-of-the-art solutions make extensive use of algorithmic and system-level innovations. VPPs integrate distributed energy resources, such as MGs, energy storage, renewable energy sources, and programmable loads, to operate as a unified entity inside energy markets. The heterogeneity of MGs, which differ in resource types, controllability, and operational constraints, needs sophisticated management and coordination frameworks [
8]. These systems address the stochastic character of renewable energy, flexibility in responding to market signals, and the attainment of common objectives such as cost reduction and resilience [
9]. To maximize local and global goals (cost, reliability, and emission reduction), energy management systems (EMSs) for VPPs use distributed or hierarchical coordination techniques [
10]. Primary, secondary, and tertiary levels are all integrated in hierarchical control, which handles market involvement, stability, and local optimization, respectively [
11]. With established savings and stability benefits, distributed control, which is frequently based on cooperative game theory and multi-agent systems, allows for decentralized decision-making while promoting coalition building and prosumer engagement [
12]. To improve operational and financial performance, modern EMSs also use electric vehicles, demand response (DR), and sophisticated supply and demand forecasting [
13].
Smart contracts and market-based coordination facilitate local energy trade across and within MGs, including peer-to-peer and transactive energy markets [
14,
15]. In decentralized operations, blockchain and IoT technologies are being utilized more and more to guarantee traceability, transparency, and safe data exchange [
16,
17]. MG cluster management frequently entails optimizing multi-timescale scheduling, real-time, intra-day, and day-ahead using distributed or rolling horizon methodologies [
18]. In order to participate in the market, scheduling algorithms must incorporate locational marginal prices, congestion control, and auxiliary service offering [
19,
20]. Predicting energy prices is essential because it allows for the best possible scheduling, bidding, and involvement in both day-ahead and real-time markets. Although they have been used historically for price forecasting, methods such as regression models, ARIMA, and exponential smoothing may have trouble with volatility and non-linearity [
11]. Predictive accuracy is improved by supervised learning techniques like random forests, support vector machines (SVMs), gradient boosting, and ensemble approaches (including meta-ensemble learning) [
21,
22], especially when working with high-dimensional, non-linear data. For prosumer-based management systems, it has been demonstrated that ensemble approaches, which combine several weak learners, improve load and price prediction [
23]. The capacity of recurrent neural networks (RNNs), particularly Long Short-Term Memory (LSTM) networks, to identify long-term dependencies in time series data has led to their widespread adoption. LSTMs perform better than classical approaches, especially when addressing fluctuating renewables and predicting under uncertainty [
21,
22]. Often utilized as a preprocessing step for forecasting, unsupervised methods such as K-means clustering are employed for load and prosumer classification, scenario reduction, and anomaly detection [
24]. To better adapt to various MG characteristics and market structures, hybrid frameworks include optimization, machine learning, and clustering [
11]. Recent developments train agents to react dynamically to market conditions by using reinforcement learning (RL) for adaptive pricing and bidding strategies [
25]. While maintaining operational trust and data privacy, VPPs are able to predict and react to real-time price signals on their own [
26].
In the electricity market, a VPP operator acts as an intermediary, facilitating communication between participating MGs and the main grid. Exclusive communication between each MG and the VPP strikes a balance between the interests of each MG and successfully protects their operational privacy [
27]. A VPP, in contrast to independently run MGs, offers coordinated energy management for several MGs. It does this by managing a varied portfolio of dispersed energy resources, such as demand response assets, photovoltaics, wind turbines, and energy storage systems, and by encouraging operational synergies between them. The VPP has to balance the interests of all parties involved in the aggregation framework, in addition to overseeing energy exchanges with the main grid. Operational cost reduction, privacy protection, and operational simplification are the main goals for individual MGs. On the other hand, VPP operators are primarily driven by the revenue they make by enabling energy transactions between the main grid and the MG group [
28]. There are several methods for this cooperation in the literature. A data-driven decision-making methodology was suggested in [
29] to optimize scheduling for the following day based on past activity trends. An architecture for ensuring day-ahead commitments for MG support services was proposed by [
30], who expanded on hierarchical control in VPPs. Similarly, using a lower-level tracking error model to improve trajectory accuracy and an upper-level quadratic program to reduce the rebound effect, the authors developed a reliable technique for aggregating thermostatically regulated loads [
31]. In [
32], a model-free deep reinforcement learning (DRL) method for controlling regenerative braking energy storage in railway systems was presented. Their approach, which was developed as a Markov Decision Process (MDP) with a multistage reward function, outperformed conventional techniques by increasing key energy objectives by more than 5%. In order to maximize renewable integration, flexible loads, and low-carbon economic operation while guaranteeing electric vehicle charging satisfaction, authors in [
33] presented an improved Dueling Double Deep Q-Network for MG energy management that uses a mixed penalty function. Recent studies have further expanded the operational complexity and optimization needs of MMG systems. For example, integrated underfrequency load shedding strategies have been proposed to enhance stability in islanded MGs containing diverse load categories. At the same time, other works have explored bidirectional time-of-use electricity pricing through multilevel game-theoretic formulations for MMG environments [
34,
35]. Hierarchical and multi-agent coordination frameworks of operational optimization of an MMG system and VPPs have been explored in recent studies of DRL-based systems. Nevertheless, the majority of the current strategies concentrate on one of the coordination levels, either centralized VPP-level dispatch or microgrid-level scheduling, thus restricting the system-wide coordination [
36,
37]. Existing energy trading and coordination studies have mainly focused on the short-term operational goals of reducing costs and market efficiency using pricing and dispatching mechanisms, whereas longer-term techno-economic and environmental effects are usually handled separately [
38].
With these developments, evident gaps exist in current DRL-based VPP studies. To begin with, internal price prediction and real-time MG dispatch are not jointly modeled in the majority of studies in a common learning environment. Second, preservation of privacy is usually mandated implicitly as opposed to explicitly by the decentralized observation and learning processes. Third, the coordination of heterogeneous MGs with different resource compositions under a single VPP structure remains insufficiently explored. Lastly, techno-economic and environmental effects are not usually considered simultaneously as part of DRL-based energy management models. Inspired by such constraints, this paper provides a three-step, multi-agent DRL model that combines internal pricing, distributed MG scheduling, and coordination of VPP-level energy storage and maintains MG privacy and allows conducting a comprehensive techno-economic–environmental performance analysis. The explicit modeling of the sequential and interrelated nature of decisions in a multi-stakeholder system is a significant divergence from conventional approaches. Second, the study presents a complex multi-agent DRL solution in which each MG and the VPP are represented as independent agents. The conflicting financial interests of the participating MGs and the VPP operator are automatically balanced by this method. Its model-free design, which functions without explicit system models, improves scalability and practicality. Third, to quantitatively illustrate the additional operational and economic advantages of the fully integrated framework, the work offers a comprehensive analysis against three precisely defined benchmark cases: isolated MGs operation and a centralized storage sharing model, and integrated VPP operation. Lastly, the suggested approach addresses a significant issue in real-world MG aggregation by providing a privacy-preserving solution since the DRL agents can develop efficient tactics based on local observations and minimal information exchange.
The main contributions of this study are presented below.
- 1.
A three-stage DRL-based framework for VPP energy management that coordinates internal pricing, MG dispatch, and centralized storage operations in a sequential, closed-loop process.
- 2.
A multi-agent DRL methodology that autonomously learns to balance the economic objectives of the VPP operator and the individual MGs, deriving a mutually beneficial scheduling scheme without relying on explicit system models.
- 3.
The enhanced performance and incremental value of the suggested coordinated strategy are demonstrated by an extensive performance assessment that compares three operational cases: isolated MGs, centralized storage sharing, and integrated VPP operation.
- 4.
A practical and expandable solution for MMG systems that improves financial results while protecting each participant’s privacy and independence.
- 5.
An integrated decision-making framework that combines sustainability assessment with techno-economic and emission-reduction objectives.
The sections of this paper are as follows: The system framework and models are introduced in
Section 2 The MMG’s energy management strategies are formulated in
Section 3. The case study and an analysis of the numerical results are covered in
Section 4. The paper concludes with
Section 5, which provides a comprehensive summary and directions for future research.
3. Energy Management Strategy for MMG
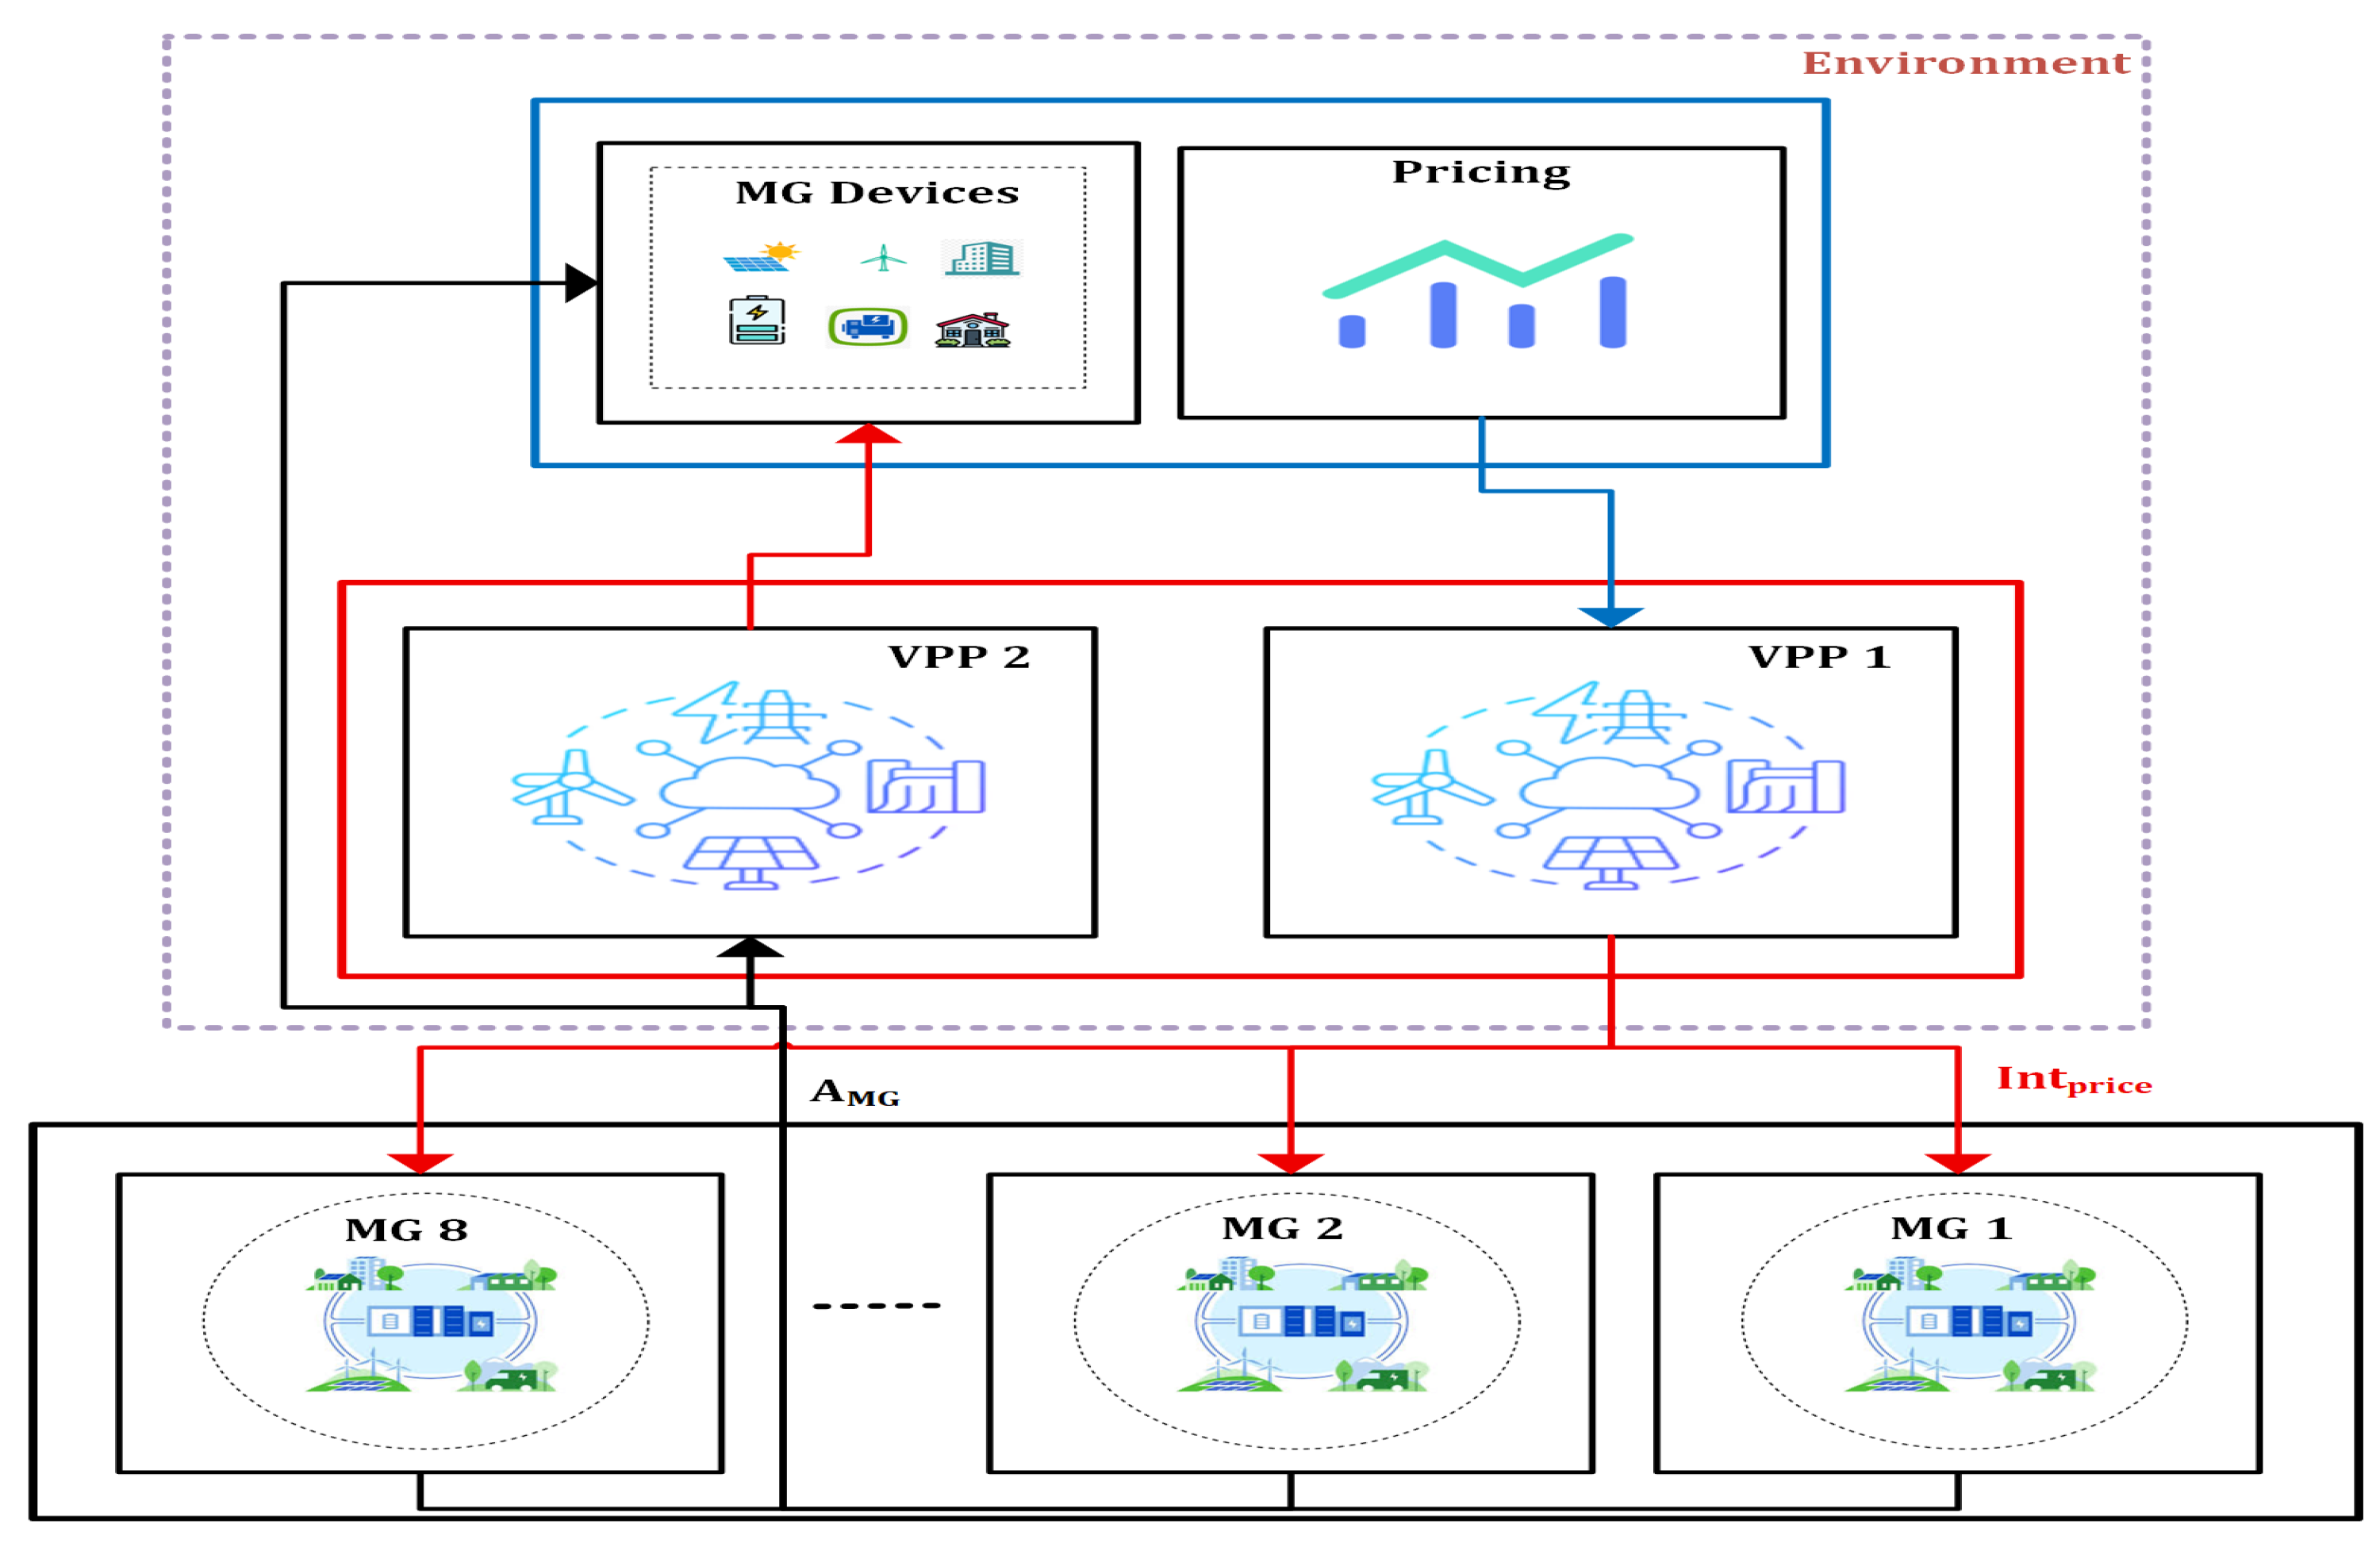
The suggested framework involves a coordination mechanism based on a sequence of operations, which involves internal price setting, distributed MG dispatch, and centralized storage optimization. This multi-agent, model-free, deep reinforcement learning algorithm allows the system to self-manage the competing goals of the VPP and the MGs. The privacy of the suggested framework is achieved by the localized observation and decentralized decision-making. The non-sensitive aggregated variables (net load and price-related feedback) are exchanged by each MG only, and no internal data (generation schedules, DG fuel characteristics, ESS parameters, EV charging behaviors, flexible load attributes, and cost structures) is shared with other parties. The VPP agent does not have any form of interaction with the MG states but only with internal price signals, so that proprietary technical or economic information is not exposed. Such a design allows the DRL agents to be informed about policies that only consider information pertinent to their own environment, which ensures the privacy of MG without disorganized work.
3.1. Multi-Agent-Based Deep Reinforcement Learning Strategy
This multi-stage framework is structured around a deep reinforcement learning (DRL) process comprising three sequential phases: retail price setting, MG optimization, and VPP energy storage system scheduling. The model assumes perfect foresight of daily average external market prices and the daily average load profiles for each MG as predetermined inputs. The decision-making problem for each agent is formally defined through a Markov decision process (MDP) characterized by the following components.
3.1.1. Reinforcing VPP Efficiency: MDP-Based Internal Pricing Strategy
VPP Agent 1 establishes internal retail prices for the MGs by dynamically reconciling their specific demand profiles with prevailing external market prices.
In the proposed reinforcement learning model for energy management, the state at time
t captures the condition of the MG, including the state of the internal pricing system. Guided by the electricity price set by the VPP, the MG will optimize its electricity consumption strategy. It will then feed back the optimized electricity demand (price-dependent) to the VPP.
where
represents the scheduled load normalized by its average value for MG
i at time
t, and
defines the net cumulative internal price adjustment across the scheduling horizon.
The variable
represents the normalized internal electricity price for MG
i at time
t, a formulation that enhances neural network training. The actual price is recovered via denormalization in Equation (
25).
The internal pricing mechanism aims to maximize profit from electricity transactions. However, considerable daily fluctuation in MG net loads causes high volatility in the VPP’s reward signal, potentially destabilizing the training process. To address this instability, the following reward function is proposed:
The reward signal is normalized with a baseline correction term, which is calculated as the product of the average load and average price. This modification seeks to reduce the volatility in rewards caused by daily fluctuation in load and pricing.
3.1.2. MDP-Driven Demand Response Strategy
The MG operator must determine the operational schedule for all controllable assets; consequently, this study formulates their decision-making process as an MDP.
The state of the MG at time
t is observed as follows:
The state includes the load ratio , (planned to average), the previous energy storage state of charge , the prior diesel generator output , and the cumulative amount of transferred load .
The action
defines the dispatch setpoints for all schedulable resources within MG
i at time
t.
where
,
and
denote the normalized control actions for the energy storage system, diesel generator, and transferable load, respectively.
The objective function minimizes the total system operating cost. Consequently, the reward is defined as the negative value of the MG’s total operational expenditure. To stabilize training against daily load and price volatility, subtract a baseline compensation term from the reward. This term is calculated as the product of the average load and the average price.
where
,
, and
denote the costs associated with electricity procurement, DG operation, and transferable load scheduling, respectively. Compensation of transferable load
is 0.05
$/kWh [
28].
3.1.3. Reinforcing VPP Efficiency: MDP-Based ESS Strategy
After determining the aggregate MG demand, the VPP operator develops a dispatch plan for its centralized energy storage system (ESS). This function relates to VPP Agent 2.
The system state observed at time
t is defined as follows:
where
denotes the normalized total load, calculated as the ratio of the load at time
t to the mean load.
A fundamental limitation for action denormalization is that the ESS’s discharge power, as determined by
, must be limited to the MMG’s entire net load at time
t.
The goal of the VPP’s energy storage system dispatch is to meet the aggregate power demand of the MGs at the lowest cost. As a result, the reward function is expressed as follows:
The functions of reward in Equations (
26), (
30) and (
35) will be designed so that they are the inverse of the total operation cost to be minimized by each agent. In the case of the MG agents, the reward is combined linearly without any extra weighting factors on the cost of electricity purchasing, diesel generator (DG) fuel cost, and transferable load (TL) compensation cost. This takes care of the fact that every component of cost will contribute proportionately based on the actual economic value of the same. The baseline terms that are incorporated in the reward formation are merely presented as a variance-reduction mechanism to reduce the volatility of rewards in the training procedure and do not affect the fundamental optimization objective. Any physical or operational constraints, such as energy storage state-of-charge (SOC) limits, DG power output and ramp-rate constraints, and transferable load (TL) limits, are imposed by explicit action-space limitation. The infeasible actions produced by the DRL agents are limited before execution, such that the state of the systems never leaves the realistic operating range. The method does not involve any fines or rewards in the form of a penalty and enhances the stability of training, besides ensuring physically possible control measures.
3.2. Implementation of Internal Price Setting
The internal electricity price is modeled as a decision variable that is set by the VPP using a DRL-based internal price setting mechanism. The VPP pricing agent chooses the internal price at every time step to maximize long-term operational goals given predefined pricing constraints, and does not approximate any external or internal price signal. To align the VPP operator and participating MGs, internal electricity pricing must follow the constraint provided in Equation (
14). Non-compliance with this regulation would result in hefty financial penalties for the VPP operator. Since only the enforcement with rewards cannot guarantee strict adherence, this work uses a powerful constraint-handling framework where the direct-action space mapping is utilized.
The cross-temporal character of the internal price restriction poses a substantial hurdle for direct implementation within the DRL algorithm. To overcome this, the restriction in Equation (
14) is reformed into Equation (
36), integrating the average external price. This modified version looks at the cumulative change in prices only, and a solution can be easily managed. These three steps are then followed to ensure rigorous constraint satisfaction at every operating interval.
Compute the total cumulative price adjustment permitted up to the final time period T. This establishes the global constraint that the entire sequence of adjustments must satisfy.
Working backwards from
T recursively calculate the feasible price range for each time step. This ensures every interim adjustment remains within the limits (Equation (
13)) and can still achieve the final target from Step 1.
At each time step, intersect the DRL agent’s proposed action with the corresponding feasible range from Step 2. The final executed action is the agent’s raw action projected onto this admissible set, ensuring all constraints are met.
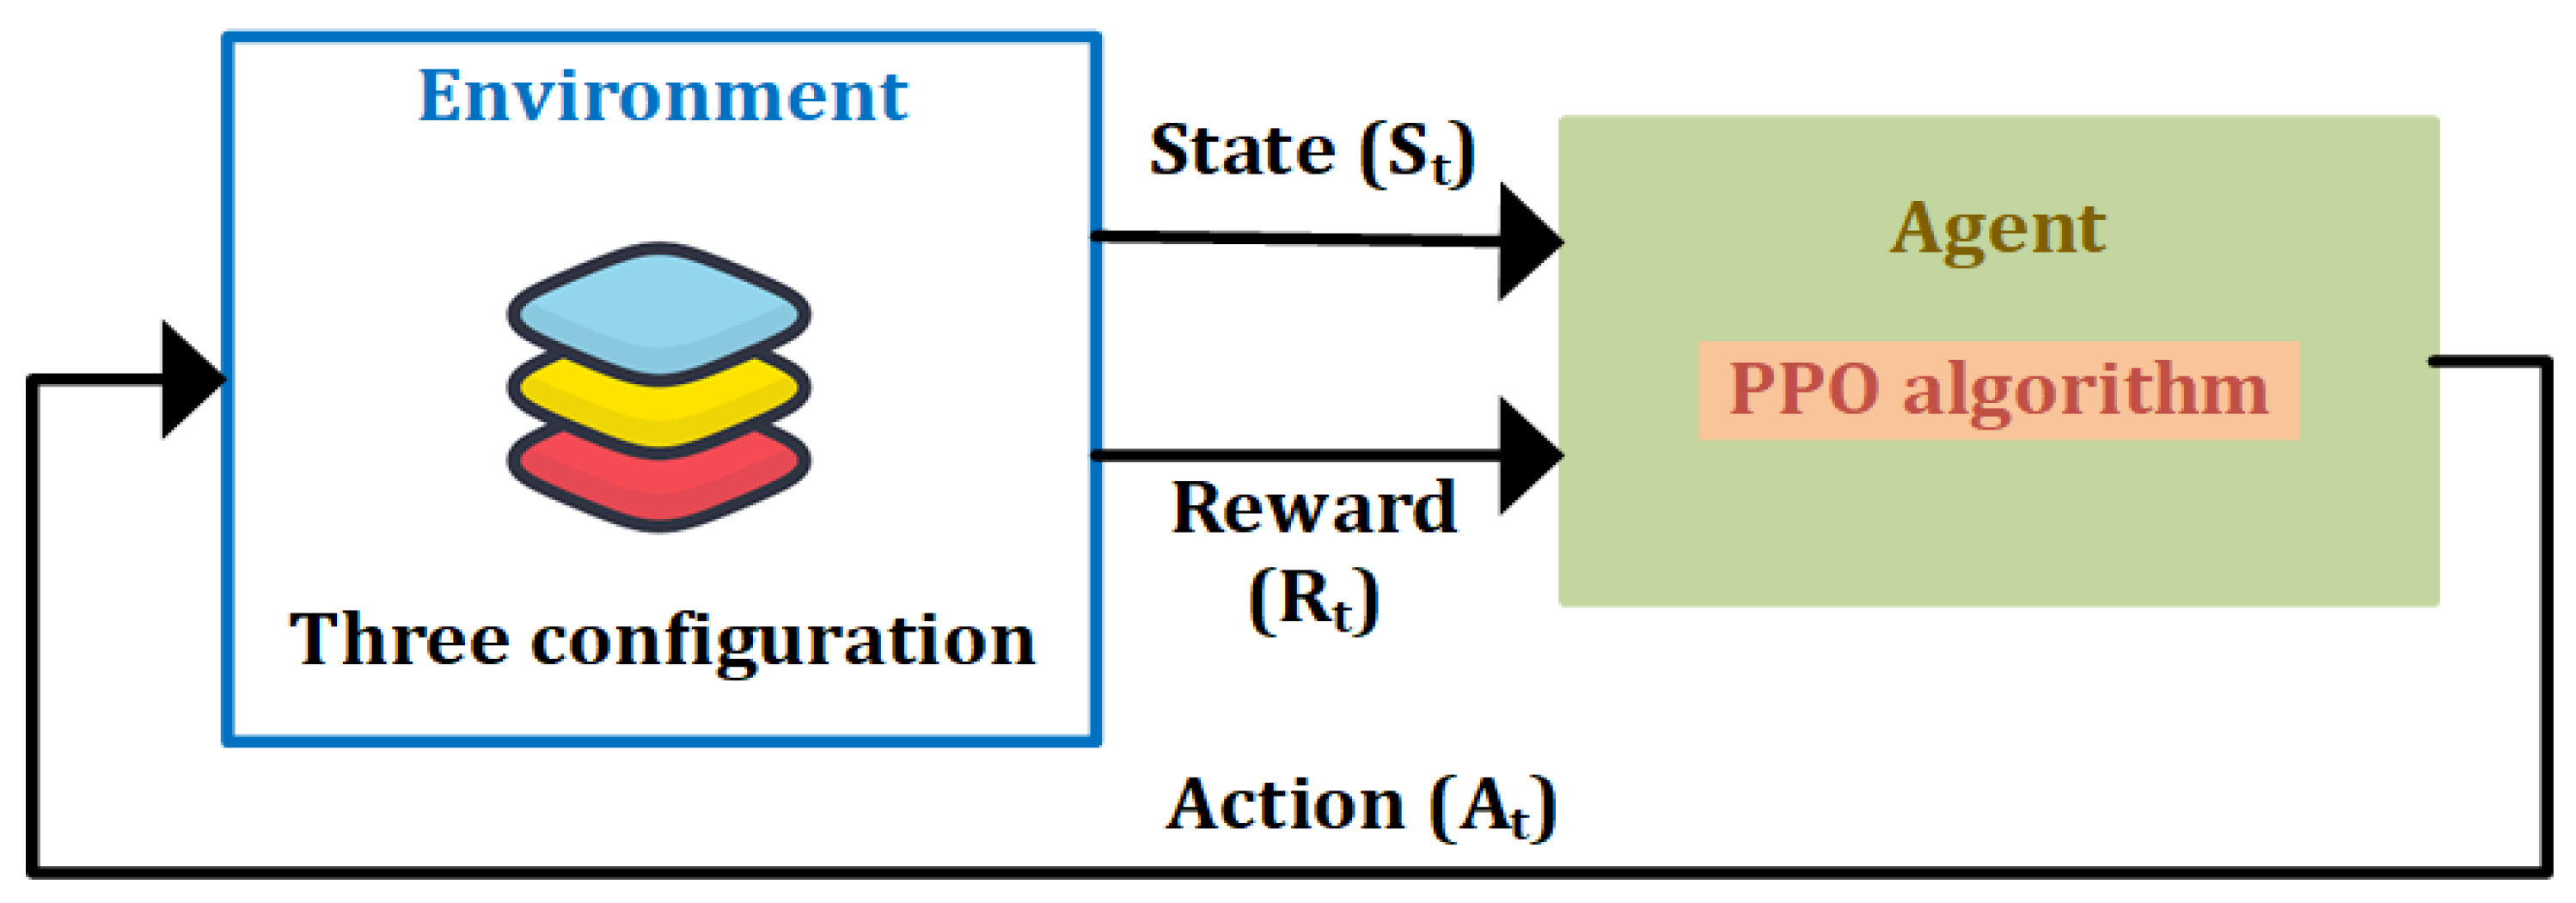
This study employs the proximal policy optimization (PPO) algorithm, a deep reinforcement learning (DRL) method, to solve the formulated problem. PPO’s core principle involves constraining the divergence between successive policy updates to prevent destabilizing large policy shifts, typically achieved through a specialized clipping mechanism. In reinforcement learning, a policy defines the agent’s strategy for interacting with its environment. Formally, it is a function that maps states from the state space to actions from the action space, dictating which action to take in any given situation.
Figure 2 shows the PPO architecture. This design effectively balances the exploitation of improvements from a new policy with the stability inherited from the previous one. Unlike value-based approaches such as Deep Q-Network (DQN), which derive policies from learned value functions, policy-based methods like PPO directly optimize the action-selection policy. This is implemented by representing the policy
with parameters
and optimizing these parameters via gradient ascent. The PPO algorithm updates
by combining two key objective functions: one for policy loss and another for value function loss.
The objective is optimized using the probability ratio , which compares the current policy to the previous policy. This ratio is weighted by the advantage estimate and constrained by a clipping function dependent on a predefined threshold . The expectation is computed over the current sample batch. Simultaneously, the value function is updated by minimizing the error between the estimated value and the target value . In the PPO algorithm, the policy and value function parameters are updated by optimizing their respective gradients. By interacting with the environment over multiple iterations and continuously refining the policy, the algorithm gradually converges to the optimal action strategy.
3.3. Model Training
Several DRL agents are used in the multi-stage energy management framework, which calls for a unique training process. An overview of the proposed methodology is presented below.
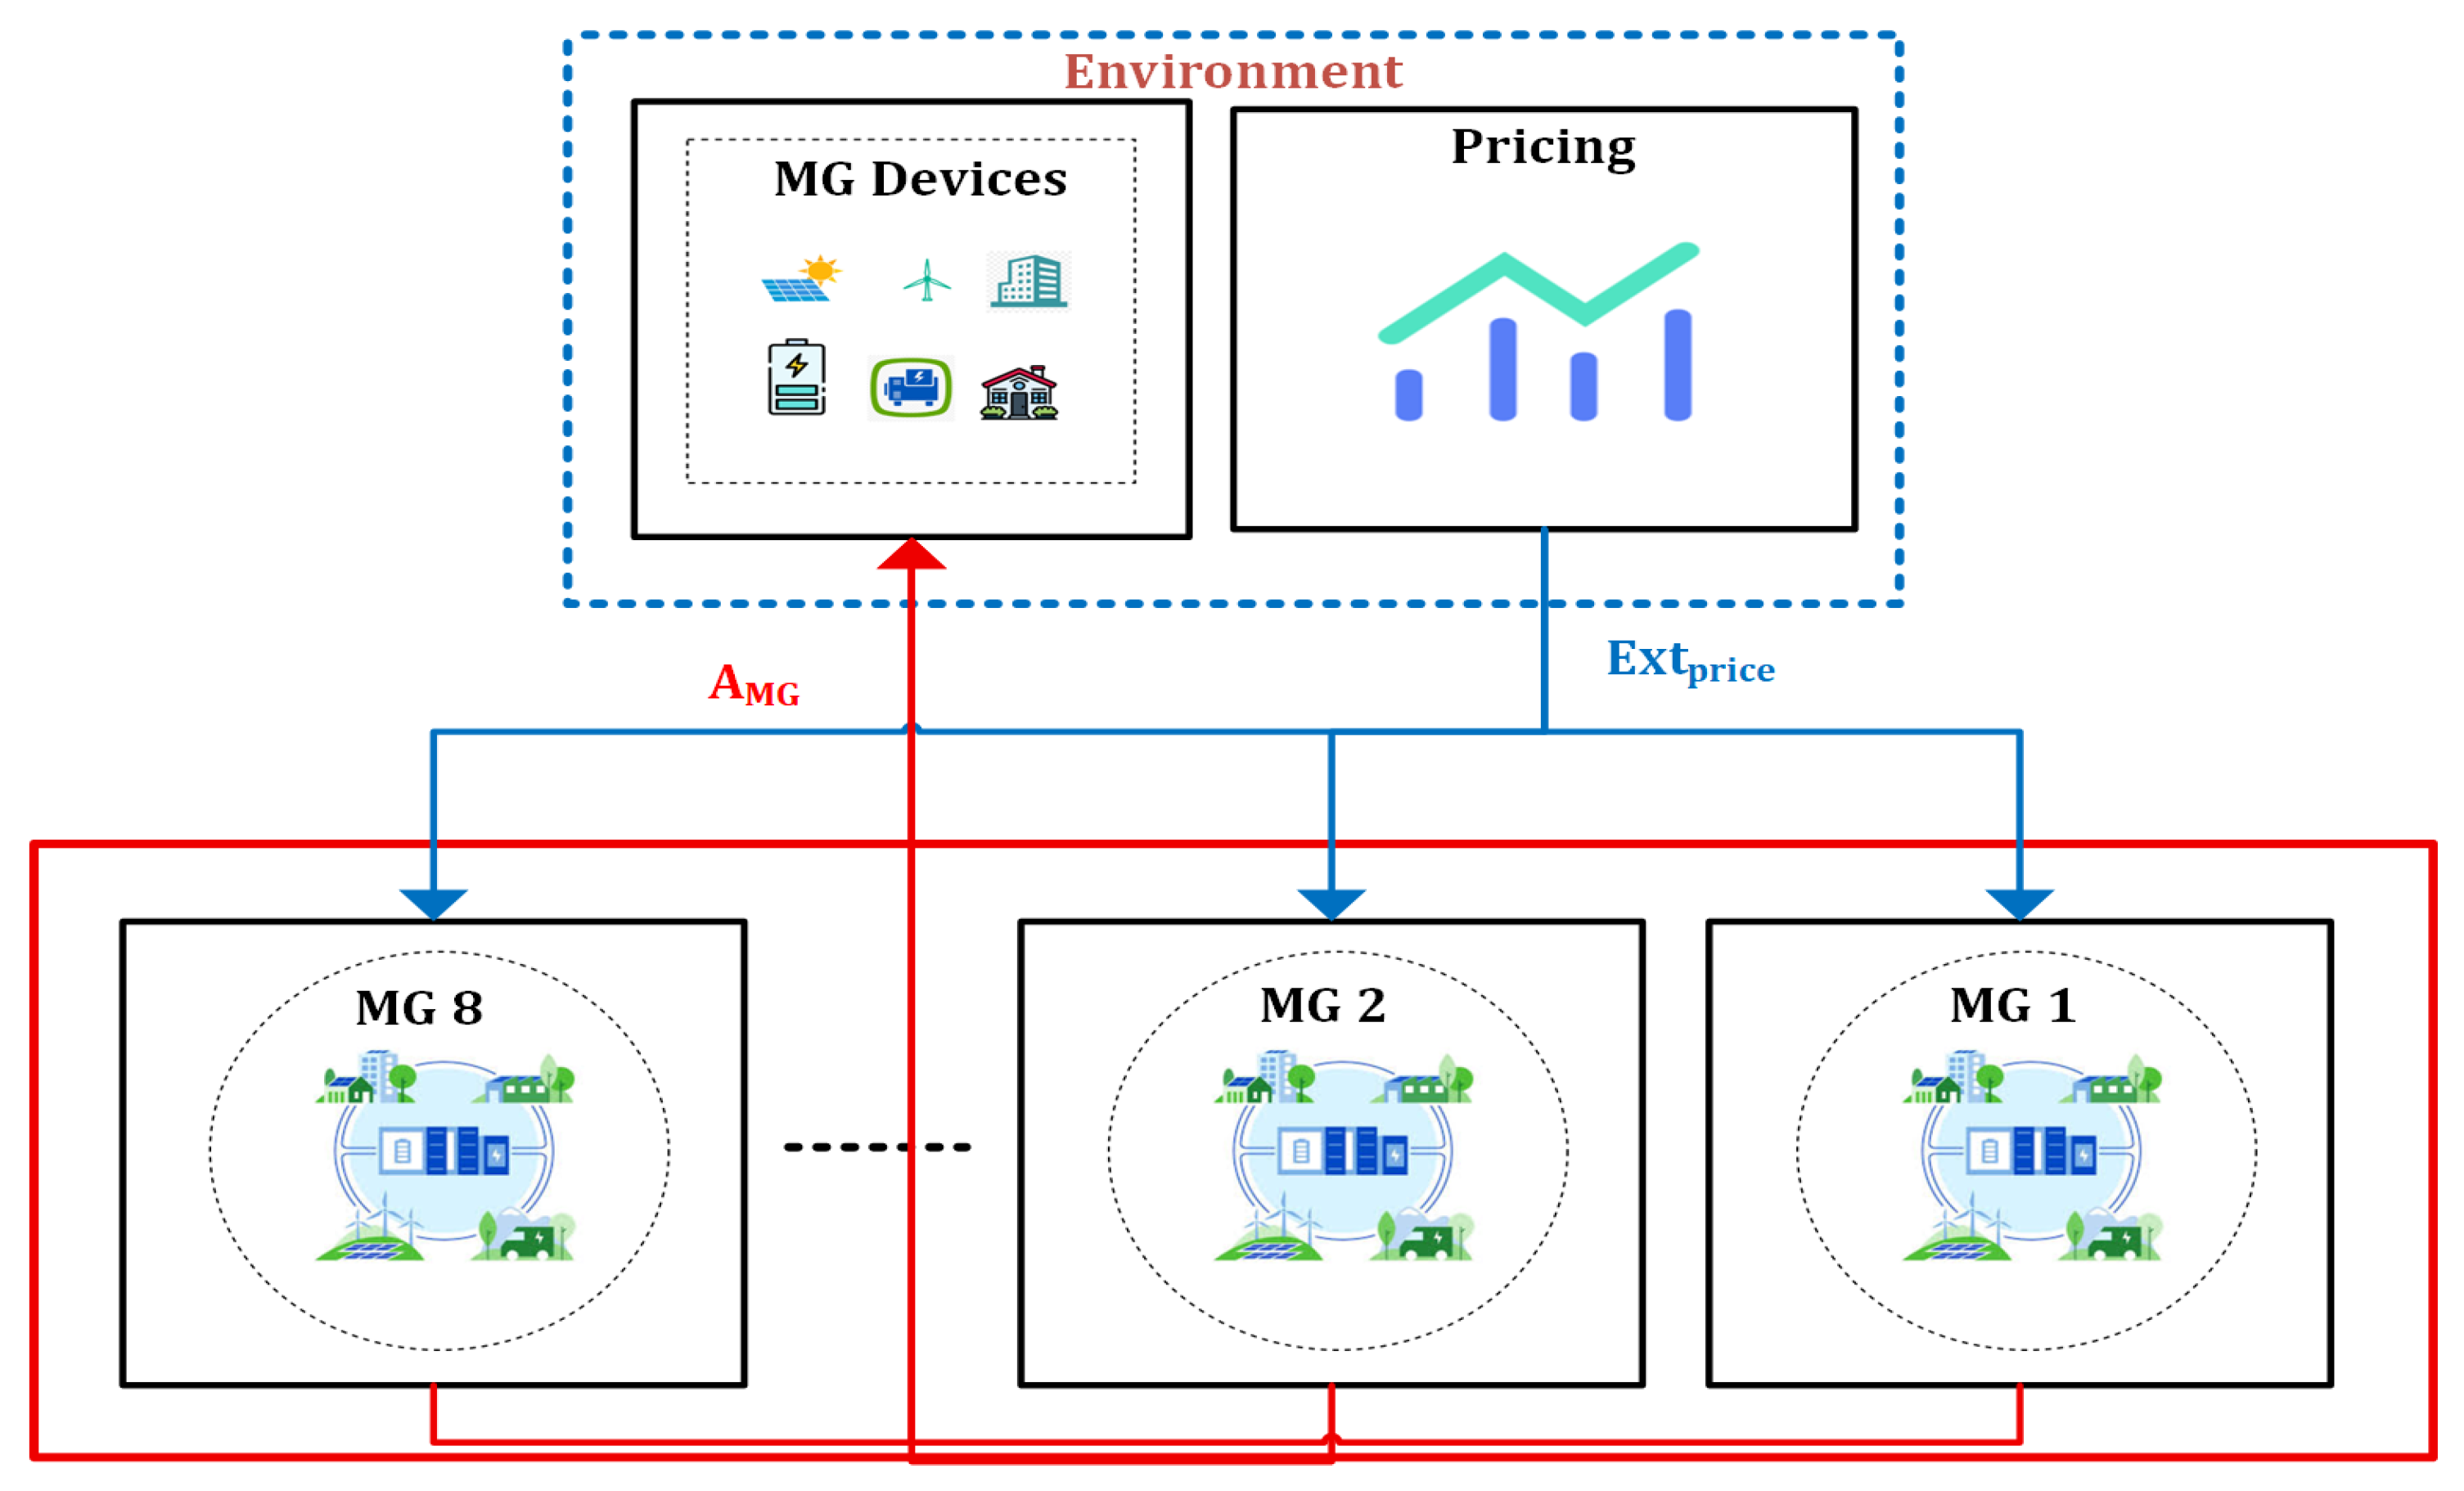
3.3.1. MG Agent Training Phase
In the first training phase, when internal price setting is not established, MG agents are trained using external electricity prices. VPP agents are not involved in the process and are still inactive at this point. Based on internal operational data and external price signals, each MG agent creates scheduling decisions. It then carries out the appropriate activities for its controllable devices. Through reinforcement learning, the results of these activities yield incentives that are utilized to adjust the parameters of the corresponding MG agent. Each MG agent trains alone in its own environment during this phase since MGs are not able to communicate with one another. As shown in
Figure 3, this isolation leads to the creation of unique operating methods suited to the unique device configurations and features of each MG.
3.3.2. VPP Agent Training Phase
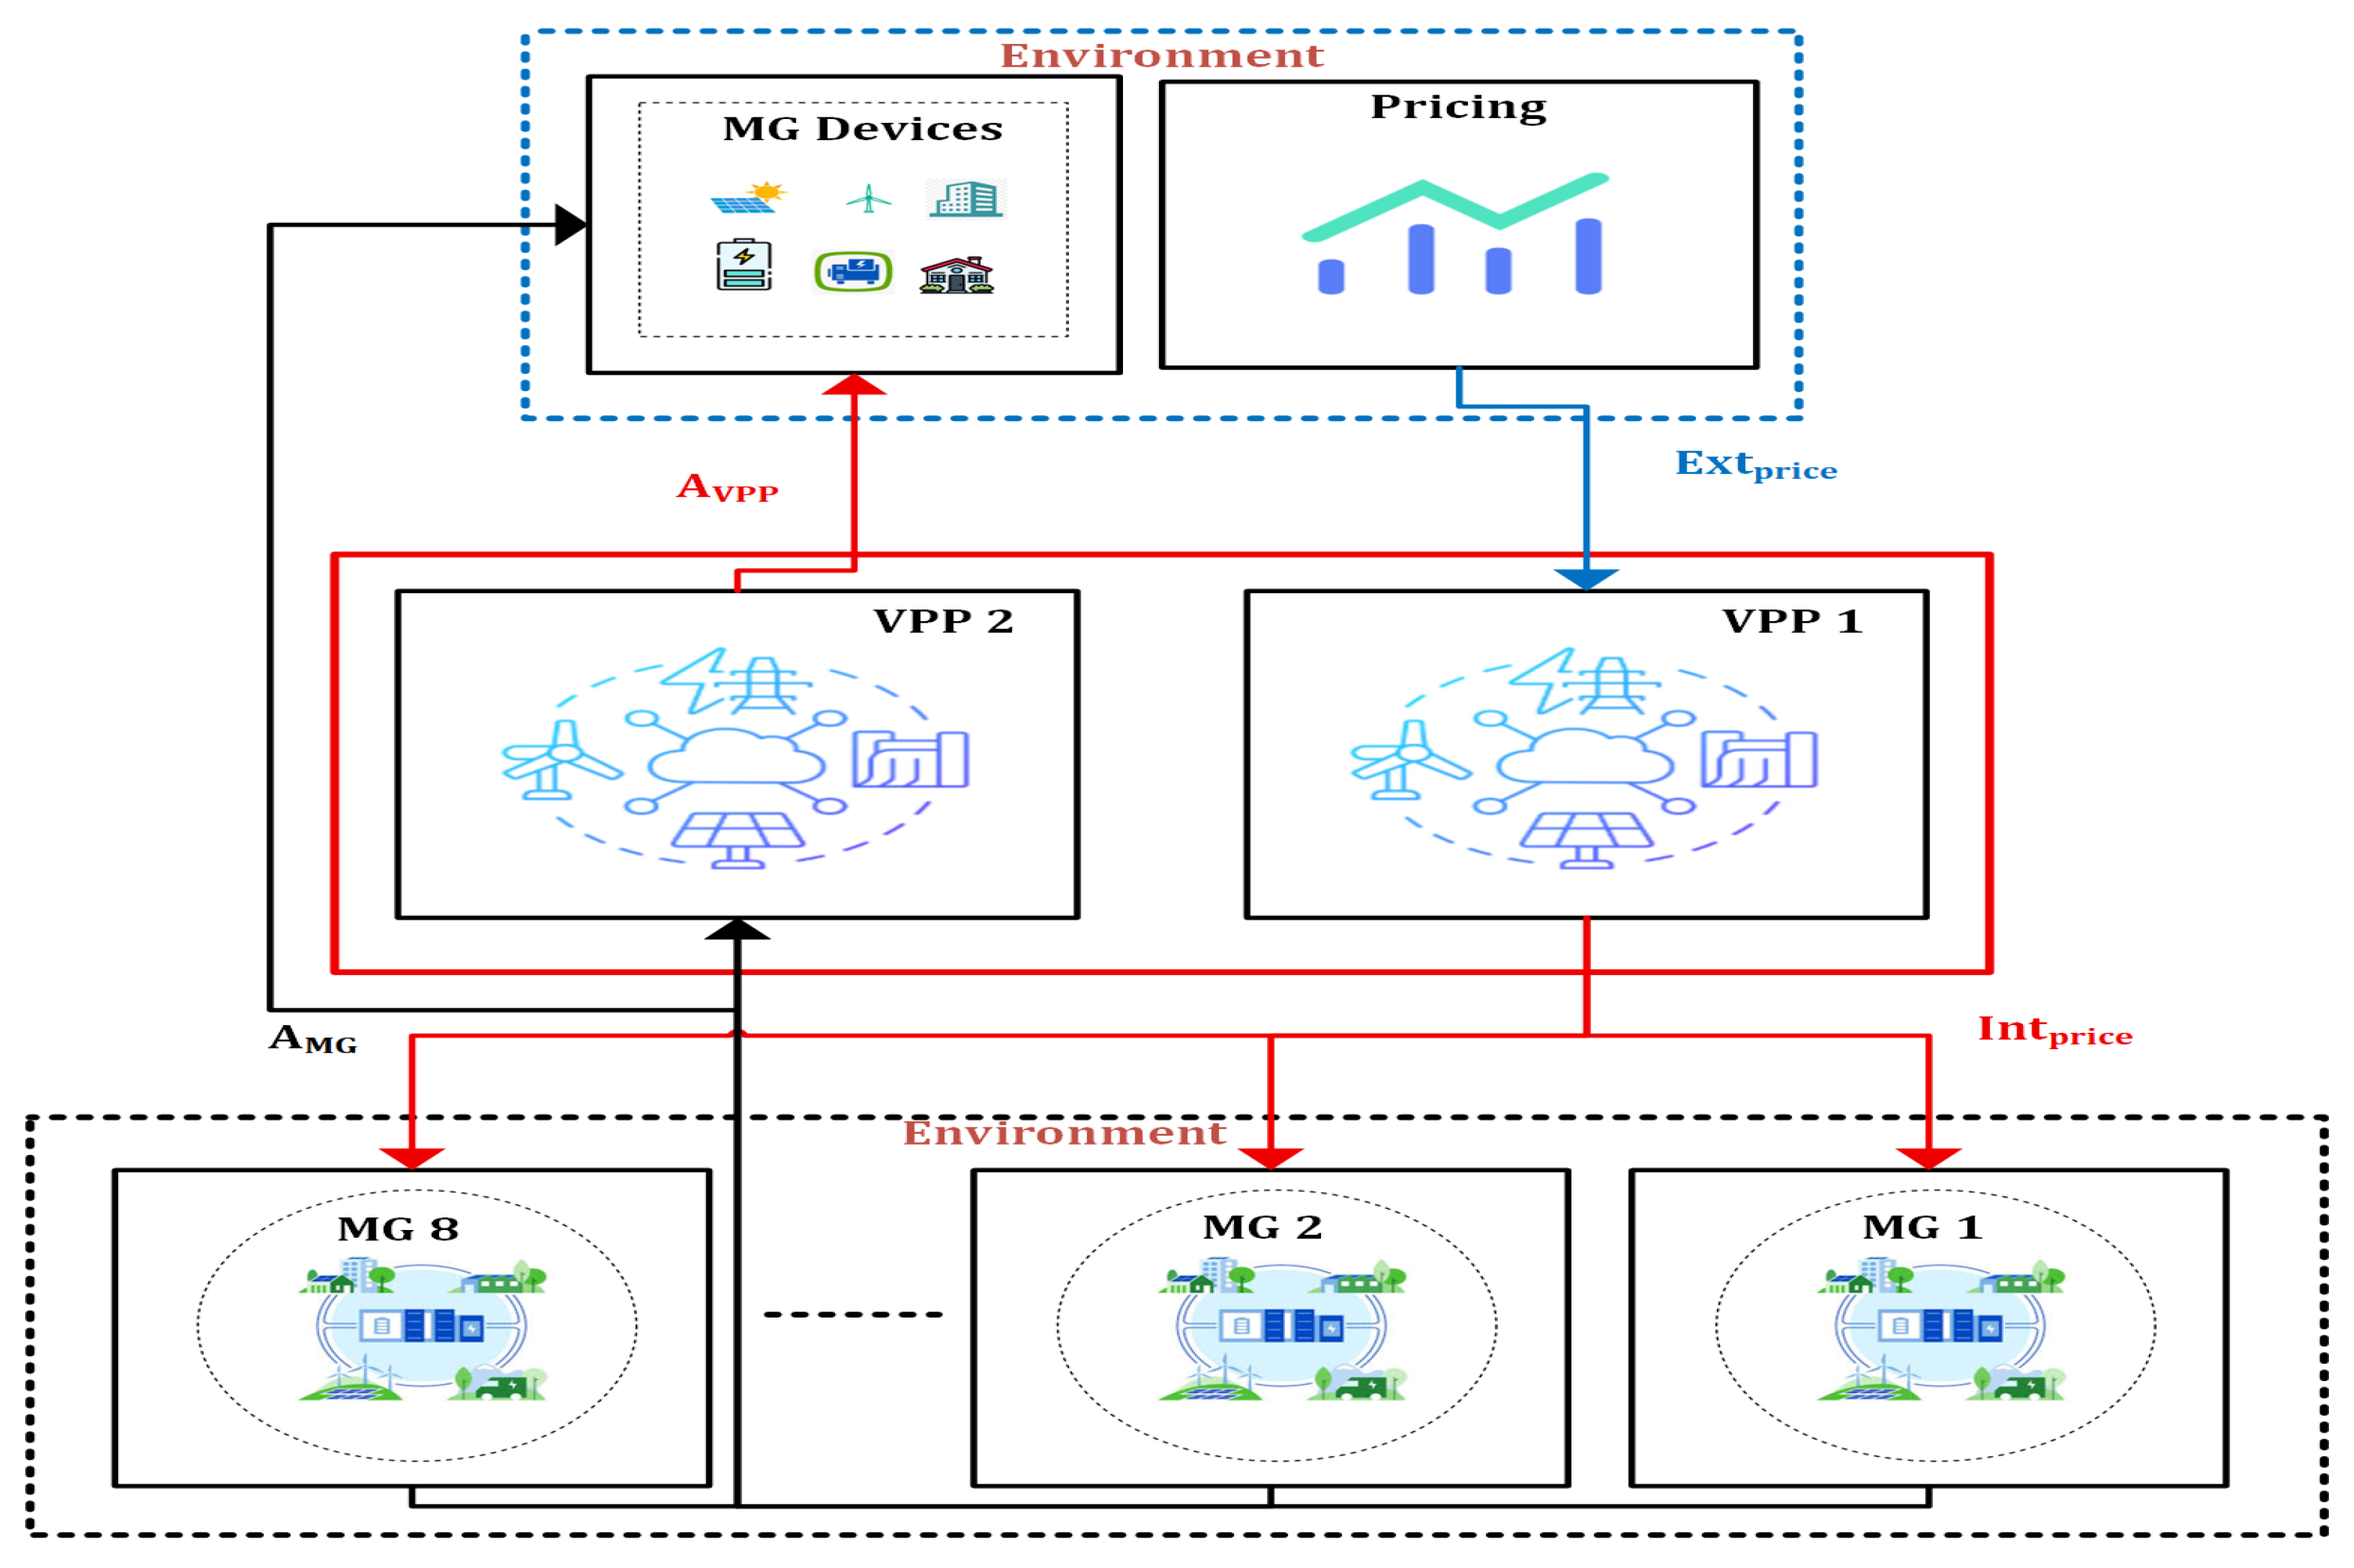
The MG agents are included as part of the environment for later VPP agent training after they have been trained initially. Two independent agents share the responsibilities of the VPP aggregator in order to manage different functions: Agent 1 uses external price data to determine internal electricity price settings, and Agent 2 manages the energy storage system (ESS) dispatch based on external prices, net power balance, and total load. In order to preserve environmental stability during the training phase, these VPP agents go through independent training procedures without direct inter-agent contact.
Figure 4 illustrates how MG agents train VPP agents.
3.3.3. MG Agent Training Phase by VPP
Upon completion of VPP agent training, these agents are incorporated into the environment for fine-tuning the MG agents’ parameters. In this phase, MG agents utilize the internal price settings provided by VPP Agent 1 as a primary input to determine their operational schedules. The resulting demand profiles from all MGs are subsequently aggregated and fed to VPP Agent 2 as part of its input state, completing the integrated feedback loop illustrated in
Figure 5.
3.3.4. Convergence
Repeat steps
Section 3.3.2 and
Section 3.3.3, alternately training the MG and VPP agents. After each training round, test the agents and record the results. MG agent parameters are fixed when training VPP agents and vice versa. Monitor reward variation to determine convergence. If the difference in average rewards between rounds is less than 5%, training is considered converged and ends; otherwise, training continues. The pseudo-code for the multi-agent three-stage DRL training procedure is listed as Algorithm 1. A structured multi-agent three-stage learning process is proposed to train the framework, which includes (i) independent pre-training of MG agents, (ii) independent pre-training of the VPP internal price setting agent and the VPP ESS agent and (iii) alternating joint fine-tuning of all the agents in the integrated environment. The individual agents of the MGs are initially trained to serve optimal local scheduling with the help of external electricity costs, but not with VPP coordination. Equally, the VPP pricing and ESS agents are trained with aggregated responses of MG. In the joint fine-tuning stage, every agent communicates in a sequence in every episode by using internal price setting, distributed MG scheduling and VPP ESS control. A moving-average reward criterion is used to measure convergence, i.e., convergence is attained once the relative change in average reward is less than a set threshold across successive episodes.
| Algorithm 1 Multi-agent three-stage DRL training procedure. |
- 1:
Initialize MG agents , VPP pricing agent and VPP ESS agent - 2:
Initialize policy network and value network - 3:
Set hyperparameters: learning rate , discount factor , clipping factor , and number of episodes - 4:
Phase I: Independent Pre-Training - 5:
for each MG agent i do - 6:
for episode = 1 to 200,000 do - 7:
Observe local MG state - 8:
Receive external market price - 9:
Select scheduling action - 10:
Execute MG operation and observe reward - 11:
Update policy using PPO - 12:
end for - 13:
end for - 14:
for episode = 1 to 200,000 do - 15:
Observe aggregated MG demand and external price - 16:
Select internal electricity price - 17:
Observe reward - 18:
Update policy using PPO - 19:
end for - 20:
for episode = 1 to 200,000 do - 21:
Observe aggregated net load and external price - 22:
Select ESS action - 23:
Observe ESS reward - 24:
Update policy using PPO - 25:
end for - 26:
Phase II: Alternating Joint Fine-Tuning - 27:
for episode = 1 to 20,000 do - 28:
Stage 1: Internal Price Setting - 29:
Set internal electricity price - 30:
Stage 2: Distributed MG Scheduling - 31:
for each MG agent i do - 32:
Observe state and price - 33:
Select scheduling action - 34:
Execute MG operation - 35:
end for - 36:
Stage 3: VPP ESS Scheduling - 37:
Observe total MG net load - 38:
Select ESS action - 39:
Compute rewards for all agents - 40:
Update , , and using PPO - 41:
end for - 42:
Convergence Criterion - 43:
Monitor moving-average rewards for all agents - 44:
Terminate training if relative reward change for K consecutive episodes
|
4. Case Study and Numerical Results
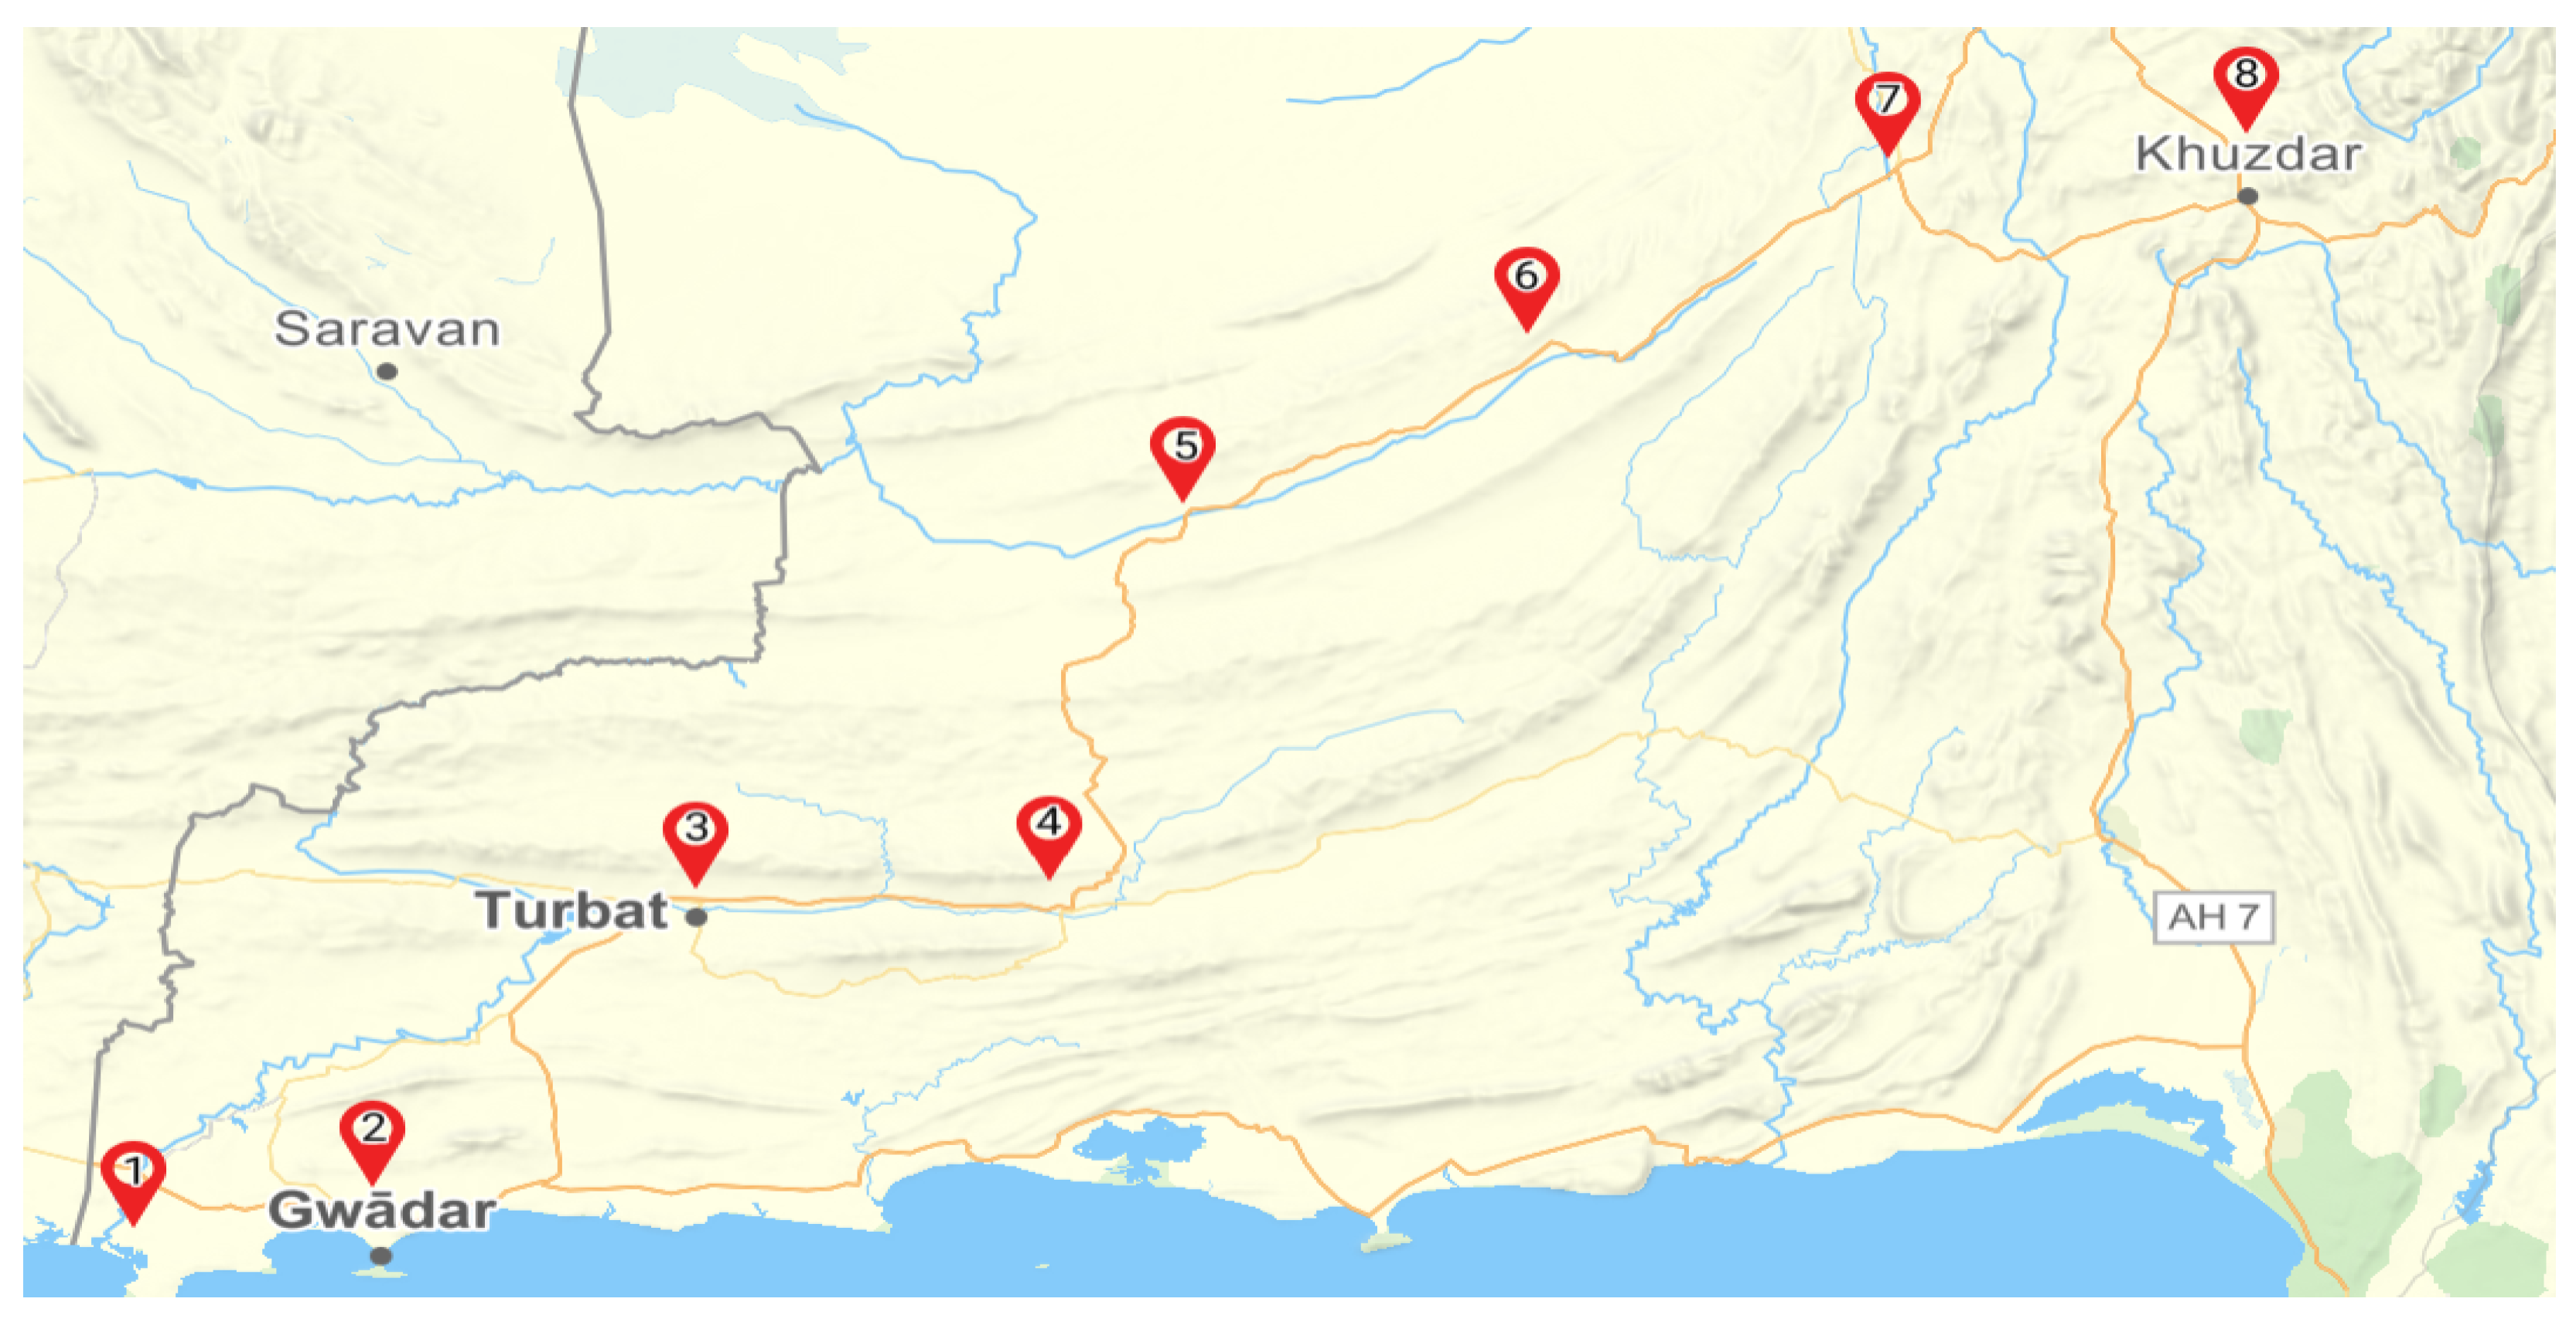
This section presents a comprehensive performance evaluation of the proposed framework through numerical simulations. A workstation with an Intel i7-8700 processor and 16 GB of RAM was used to develop and run the full model in a coordinated environment using MATLAB 2024a and Python 3.10. A 60-min resolution is used in the scheduling horizon. As shown in
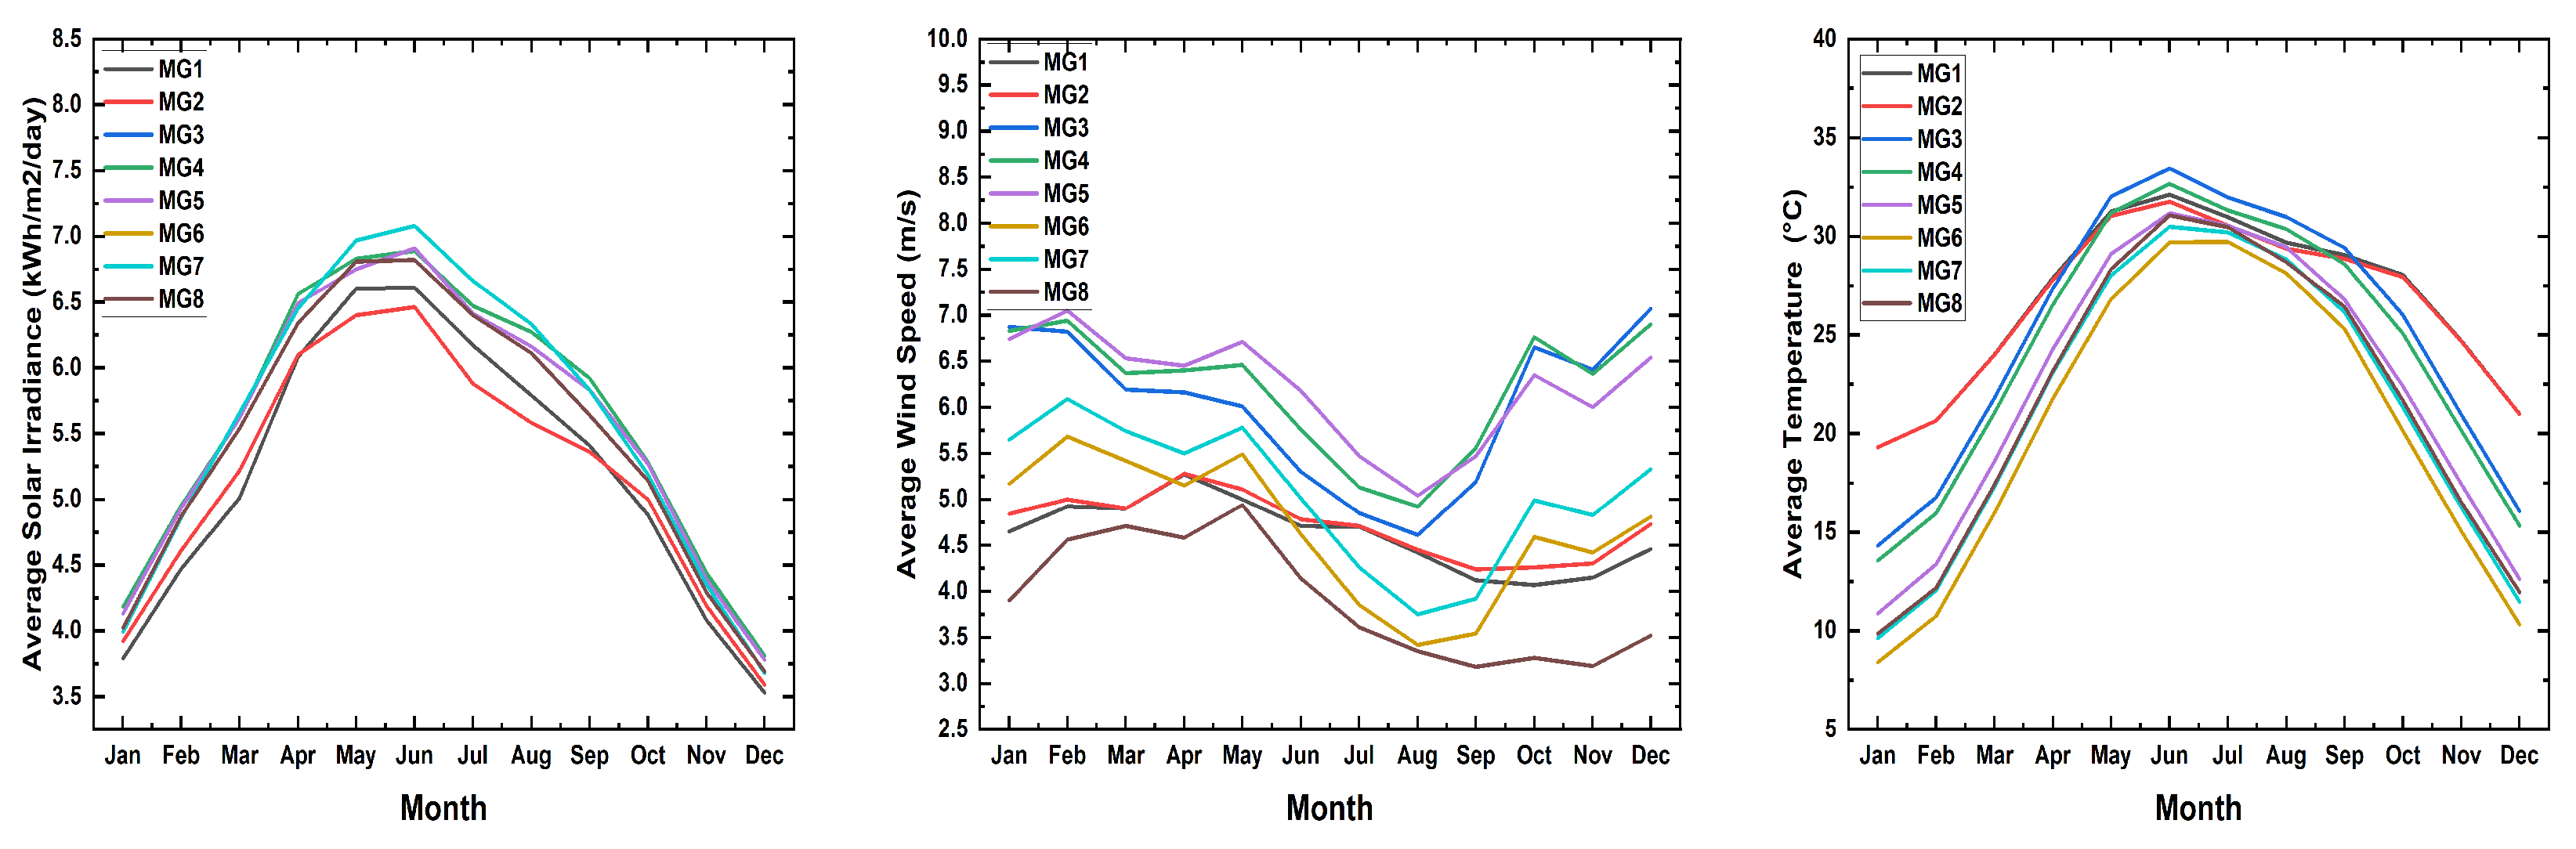
Figure 6, eight typical sites from western Pakistan were chosen for case studies in order to verify the efficacy of the model. The corresponding meteorological data [
47], including average temperature, solar radiation, and wind speed profiles, are presented in
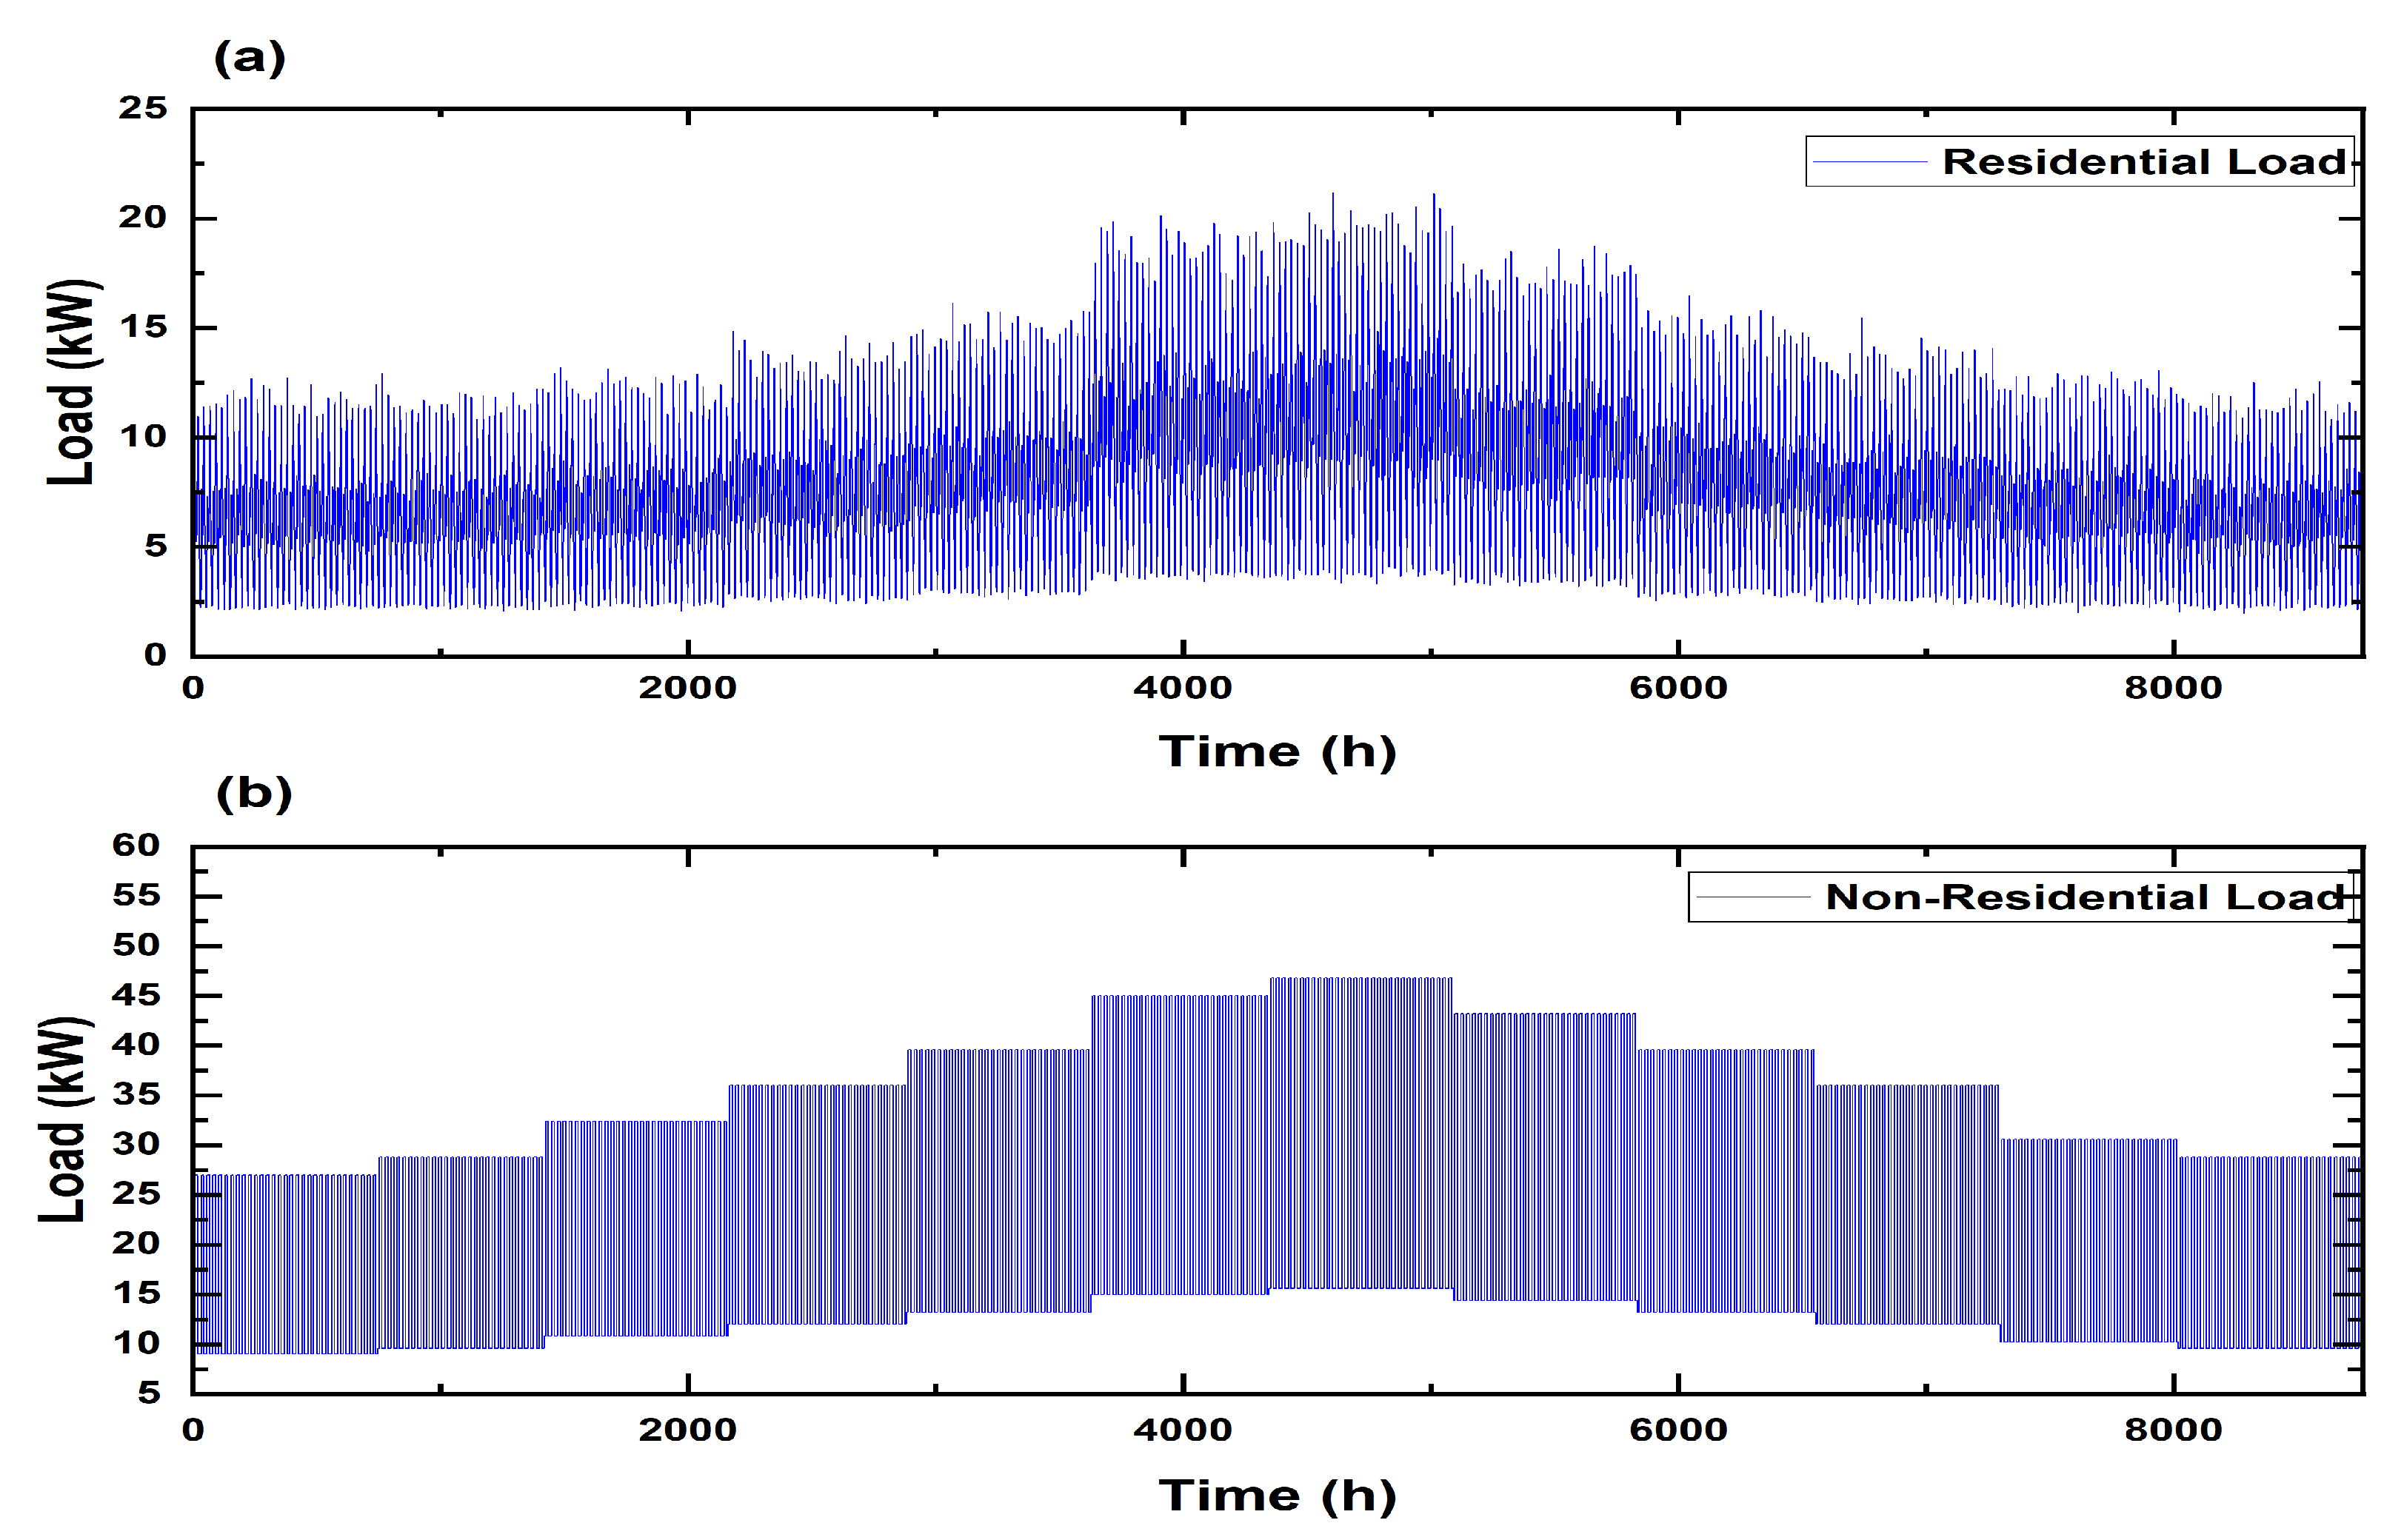
Figure 7, while
Figure 8 illustrates the annual energy demands. Energy load profiles were developed using standardized procedures based on consumption characteristics [
48].
4.1. Simulation Settings
This study simulates a virtual power plant comprising eight heterogeneous MGs, with their respective configurations detailed in
Table 1.
Table 2 specifies the simulation parameters for the proposed strategy. Wholesale electricity prices are based on 2024 trading data from the PJM Interconnection [
49]. The dataset is partitioned into 80% for training and 20% for testing. The multi-agent deep reinforcement learning (DRL) models were trained on the training set and validated on the testing set, while all comparative benchmark methods were evaluated directly on the testing data.
This study proposes a multi-stage DRL-based framework for VPP energy management. To thoroughly evaluate its performance, three distinct operational cases are analyzed and compared.
Case 1 (baseline-isolated MGs): involves neither coordination nor sharing of energy. Every MG functions independently, balancing supply and demand using just its own resources. Every MG has its own self-reliant operation, where none of them is coordinated at VPP or even with internal price settings. Every MG has the same DRL-based local scheduling agent as that of the proposed framework, except that the agent does not react to an internal price setting, but to the external price of the electricity market itself. There is no information sharing and coordination between MGs, and VPP does not affect MG functions. The case is an example of an intelligent yet non-coordinated benchmark, which makes it possible to evaluate the contribution of VPP-based coordination instead of the sophistication of controllers.
Case 2 (centralized storage sharing): In this case, MGs function autonomously without coordinated dispatch or internal pricing setting. To enable aggregated power balancing, a centralized ESS is implemented at the VPP level. To maintain methodological consistency, the centralized ESS is managed using the same DRL-based control technique as in the suggested framework. MGs continue to optimize locally depending on external prices since they do not receive internal price signals. Internal price-based coordination is not included in this scenario, which isolates the impact of centralized storage sharing.
Case 3 (integrated VPP operation): Include internal energy price settings for MGs established by the VPP agent, and it represents the entire suggested structure. The multi-stage method in this case allows for completely coordinated functioning.
The core of Case 3 is the following sequential decision-making process:
Stage 1 (VPP pricing): Based on operational information gathered from each MG, including load, generation, and storage status, as well as the wholesale energy price, the VPP agent calculates the internal retail electricity price for the MGs.
Stage 2 (MG scheduling): Each MG’s energy management system modifies the operation of its internal resources, such as local ESS, dispatchable generators, and any flexible loads, in response to the retail price. The VPP agent then receives the revised net load data.
Stage 3 (Centralized ESS & market clearing): Based on the total net load of all MGs, the VPP agent determines the charging/discharging schedule for its centralized ESS. The net energy balance, which is determined by subtracting the total MG load from the central ESS dispatch, is then used by the VPP to conduct wholesale market transactions.
The goal of this model-free DRL framework is to automatically balance the conflicting goals of the MGs and the VPP in order to arrive at an ideal scheduling plan that benefits both parties. The incremental advantages of the suggested coordinated technique over conventional isolated operation and simpler storage-sharing models will be illustrated through a comparative study of these three scenarios. The system’s economic performance, self-sufficiency, and MG interaction power are evaluated across several scenarios to validate the proposed technique. The research assumes that there is enough redundancy in the energy transmission system to reliably support the necessary inter-MG energy exchanges.
4.2. MG Performance
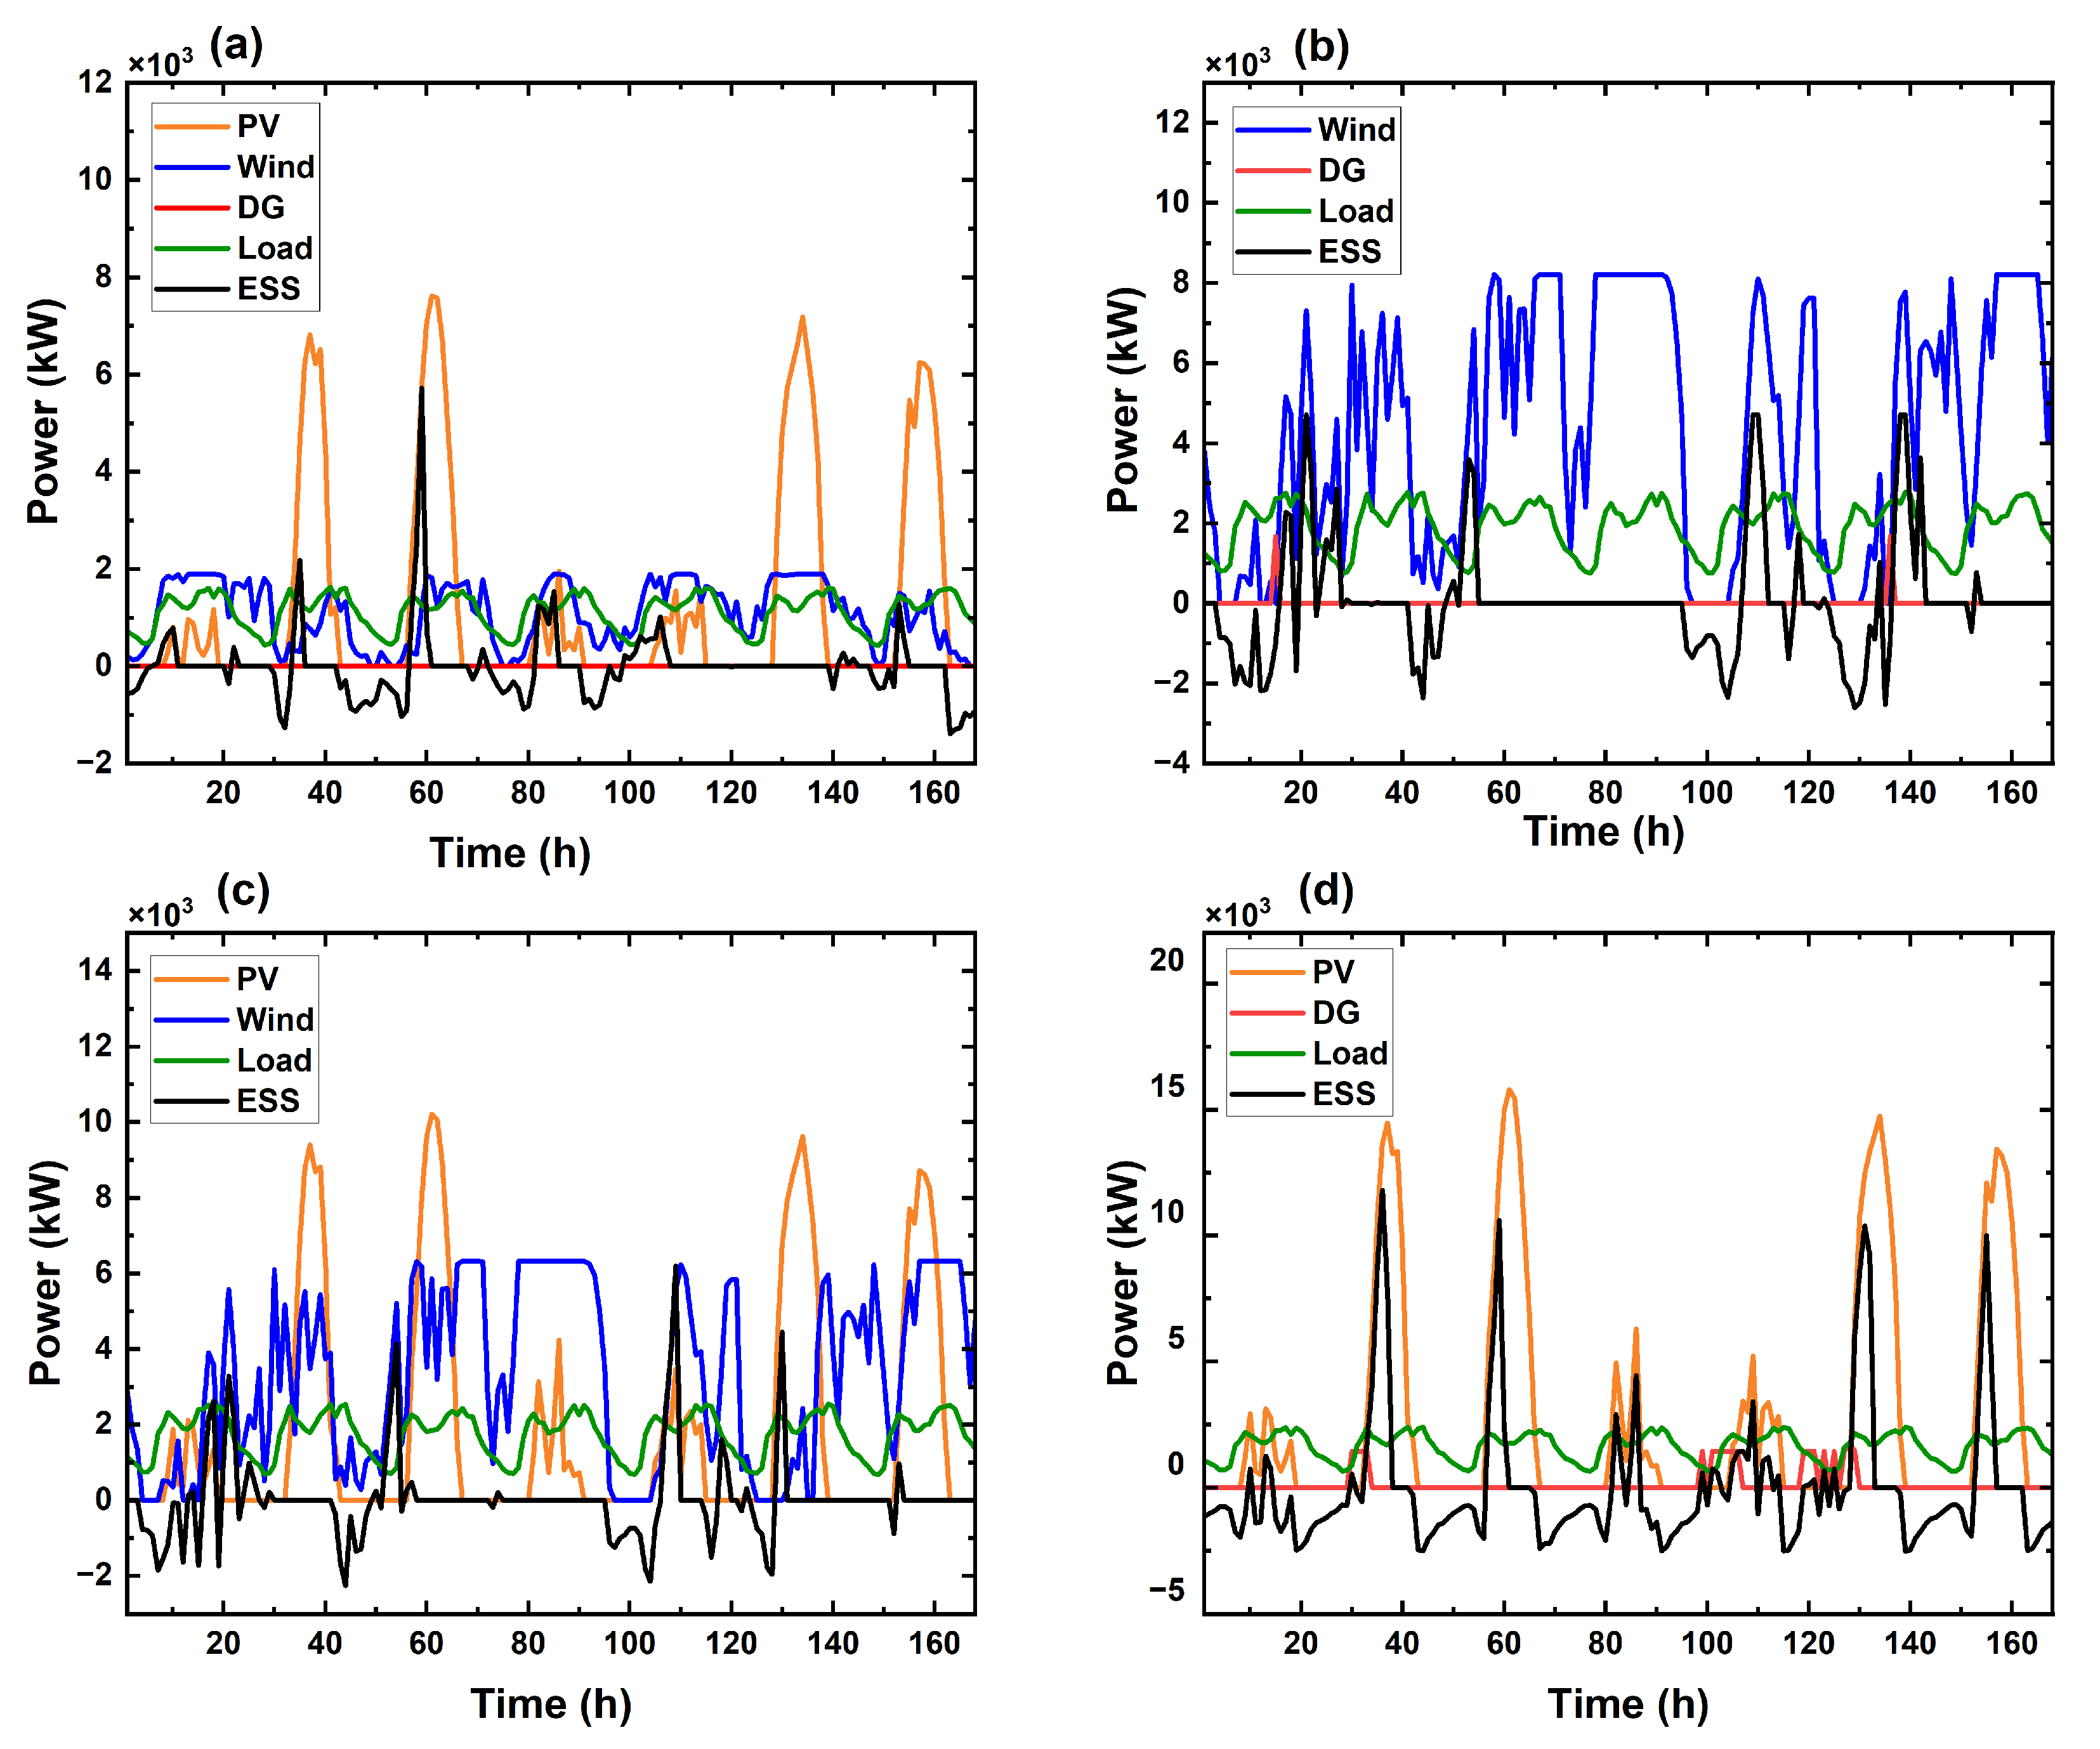
The scheduling results for the non-cooperative MG configuration in Case 1 are shown in
Figure 9, emphasizing the difficult energy balancing dynamics. To handle the varying load demand, the MG is forced to rely solely on its internal resources, mainly limited energy storage (ESS), a diesel engine, and intermittent PV and wind power. The ESS absorbs extra energy during times of high renewable generation, but the MG is still susceptible to supply and demand imbalances. The activation of the DG highlights the system’s need for costly and carbon-intensive production to maintain stability, particularly during periods of low renewable energy or load peaks. This emphasizes the disadvantages of isolated operation and reinforces the need for coordinated energy management by resulting in wasteful resource consumption, increased operating costs, and a larger reduction in the amount of renewable energy that is available.
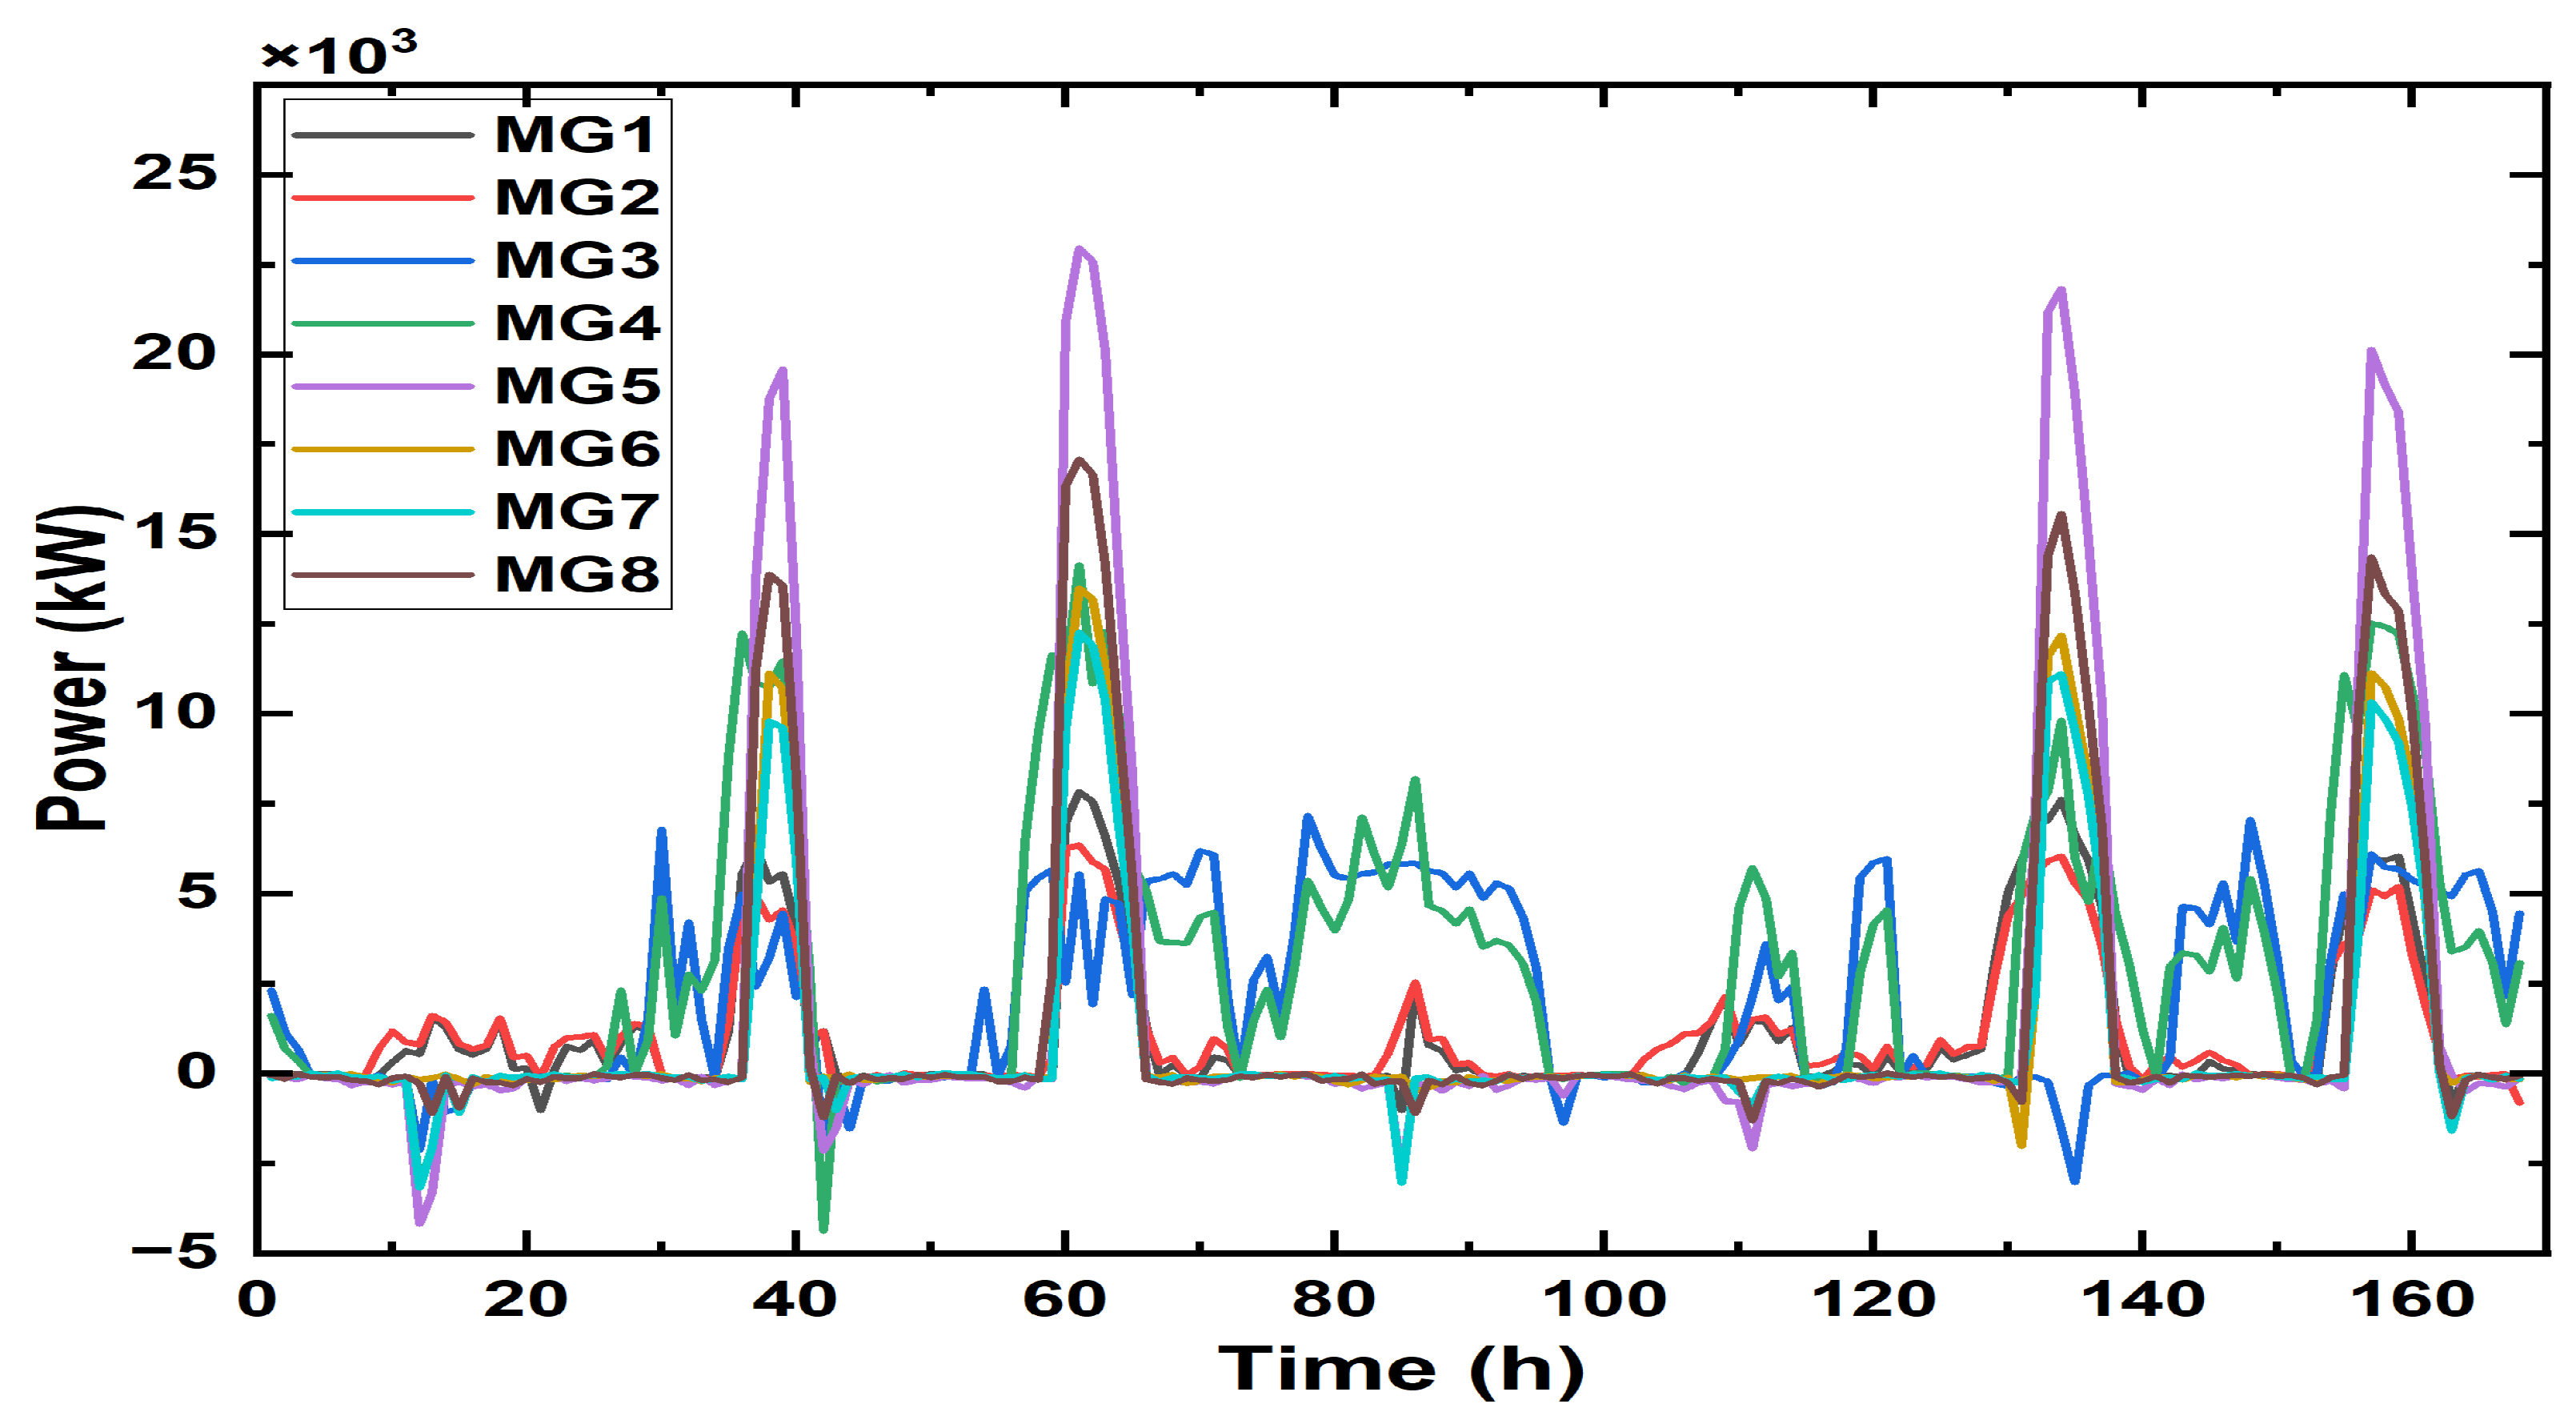
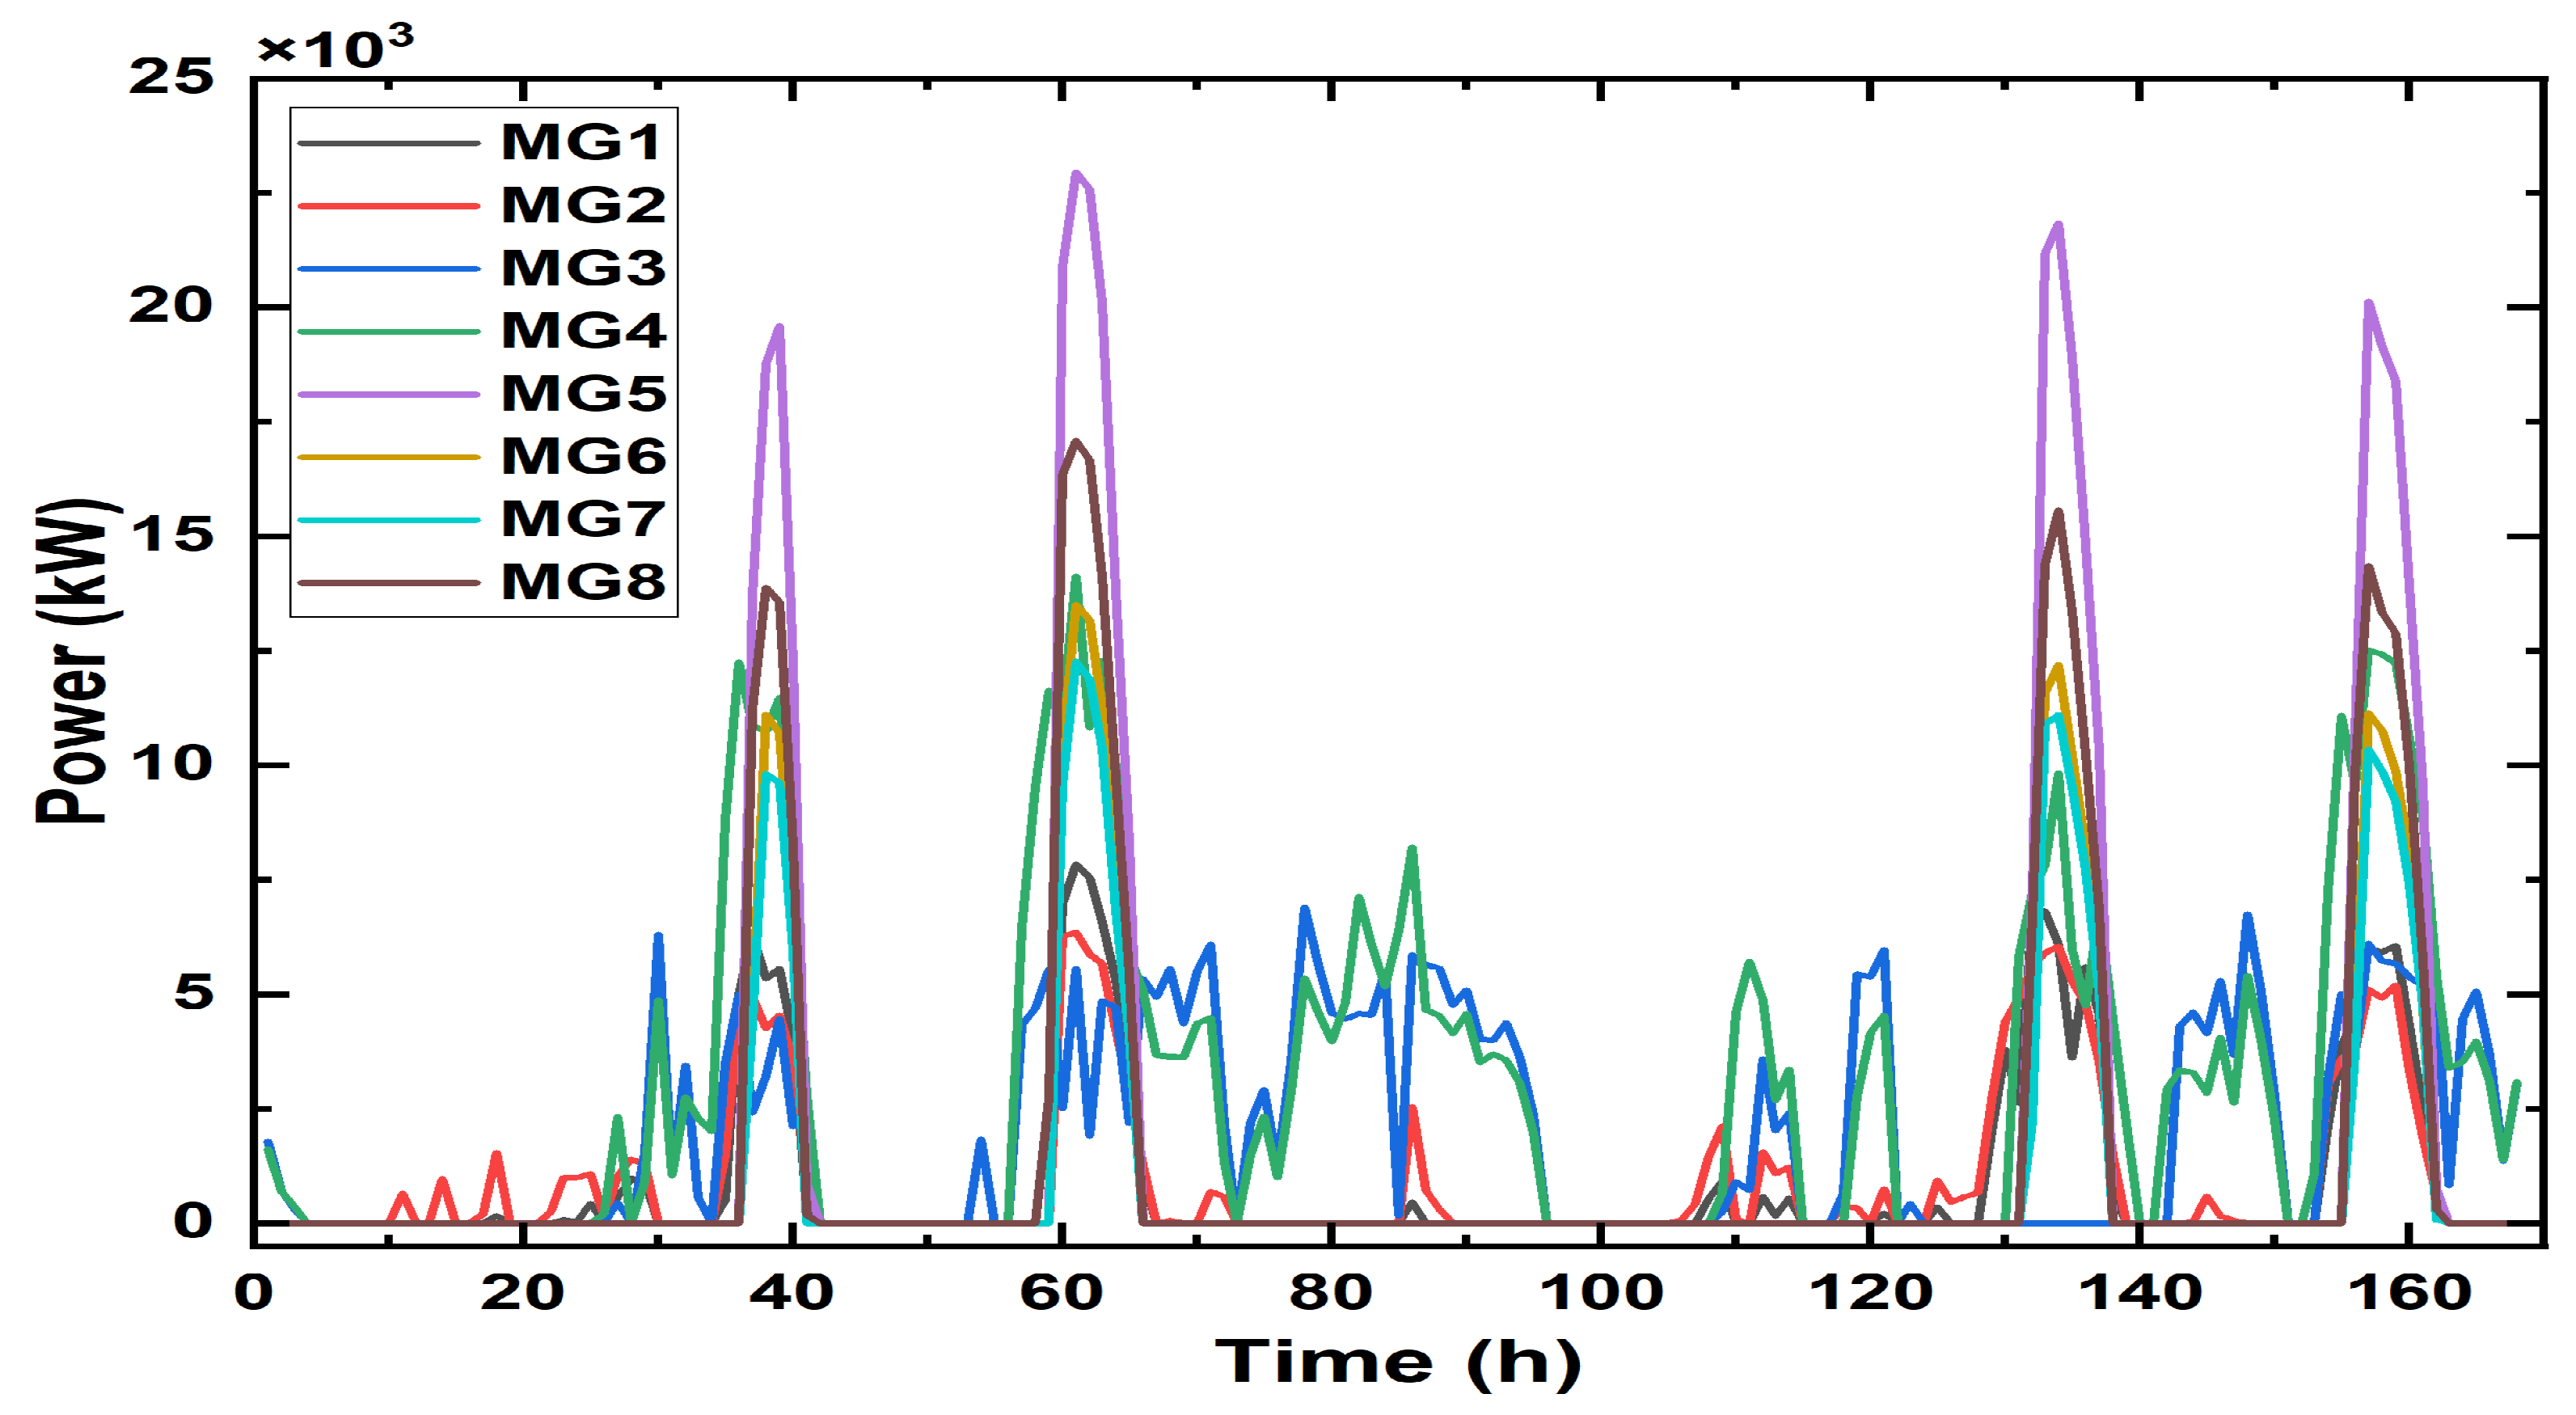
Figure 10 displays the net energy profiles of the eight MGs (MG 1–8) before coordination. Notable oscillations and periods of both surplus (positive) and deficit (negative) energy are characteristics of these profiles. This variation highlights the inherent instability of solitary operation. The stabilizing effect of Case 2, however, is depicted in
Figure 11, where energy sharing is made possible by the VPP’s centralized energy storage system (ESS). The aggregate net energy profile is successfully smoothed by the VPP’s optimization of the central ESS charging and discharging schedules. The centralized ESS serves as a buffer, absorbing collective surpluses and discharging during collective shortfalls, even as individual MG imbalances continue. As a result, net energy fluctuations are less severe, and system stability is improved. The lack of dynamic internal price setting, however, restricts the capacity to actively influence the behavior of individual MGs; in other words, the VPP largely responds to imbalances rather than actively averting them through price signals. When compared to the isolated baseline (Case 1), this case shows that centralized storage sharing alone can greatly increase resource utilization and dependability; however, more complex coordination methods may be able to achieve even greater improvements.
4.3. VPPs Performance
The VPP uses a decision-making process to formulate its decision-making process. Real-time external market prices and operational information from participating MGs, including load and generation characteristics, are incorporated into the state space. The VPP agent calculates an ideal internal price for the MGs based on this state. Within a restricted flexibility factor , this price is allowed to vary from the external price . This enables the model to dynamically balance demand response, grid conditions, and the economic goals of the VPP. The MG optimizes its operations for cost-effectiveness in response to internal pricing signals, which are generated from external market prices and internal load levels. In order to avoid costly grid electricity at times of high prices, it deliberately turns on its distributed generation (DG) or discharges its energy storage system. On the other hand, it takes advantage of temporal price arbitrage by charging the ESS during times of low prices.
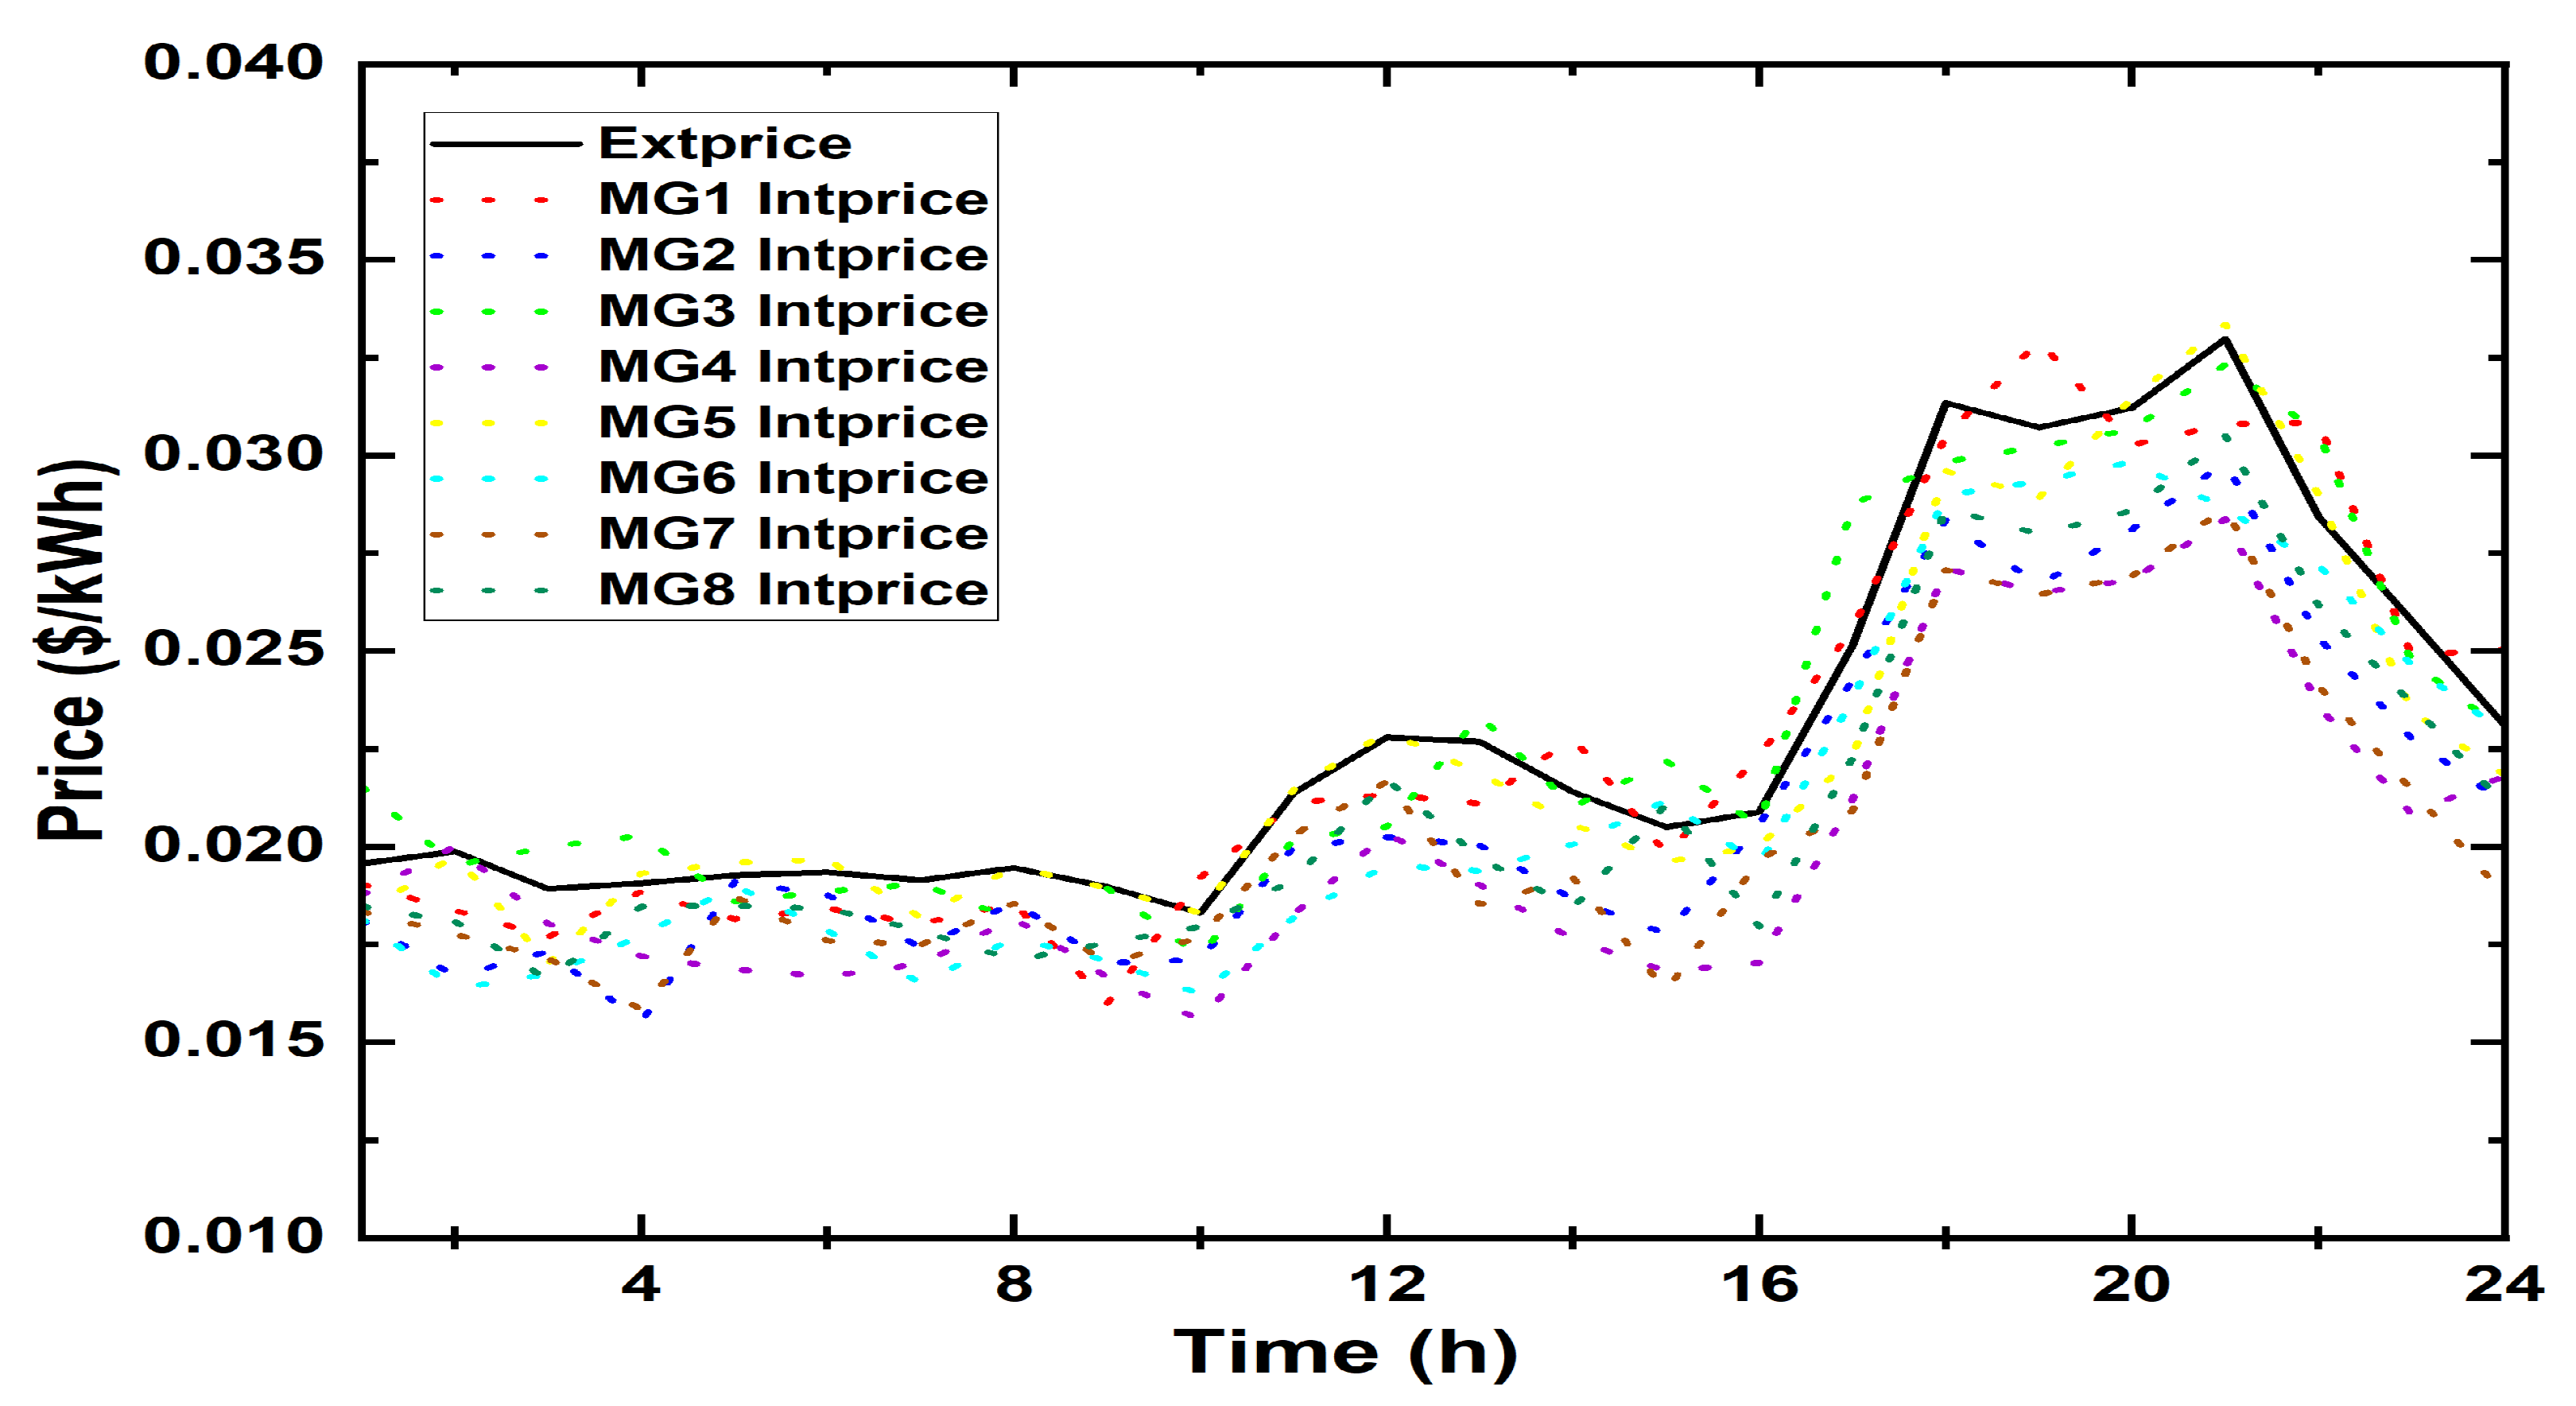
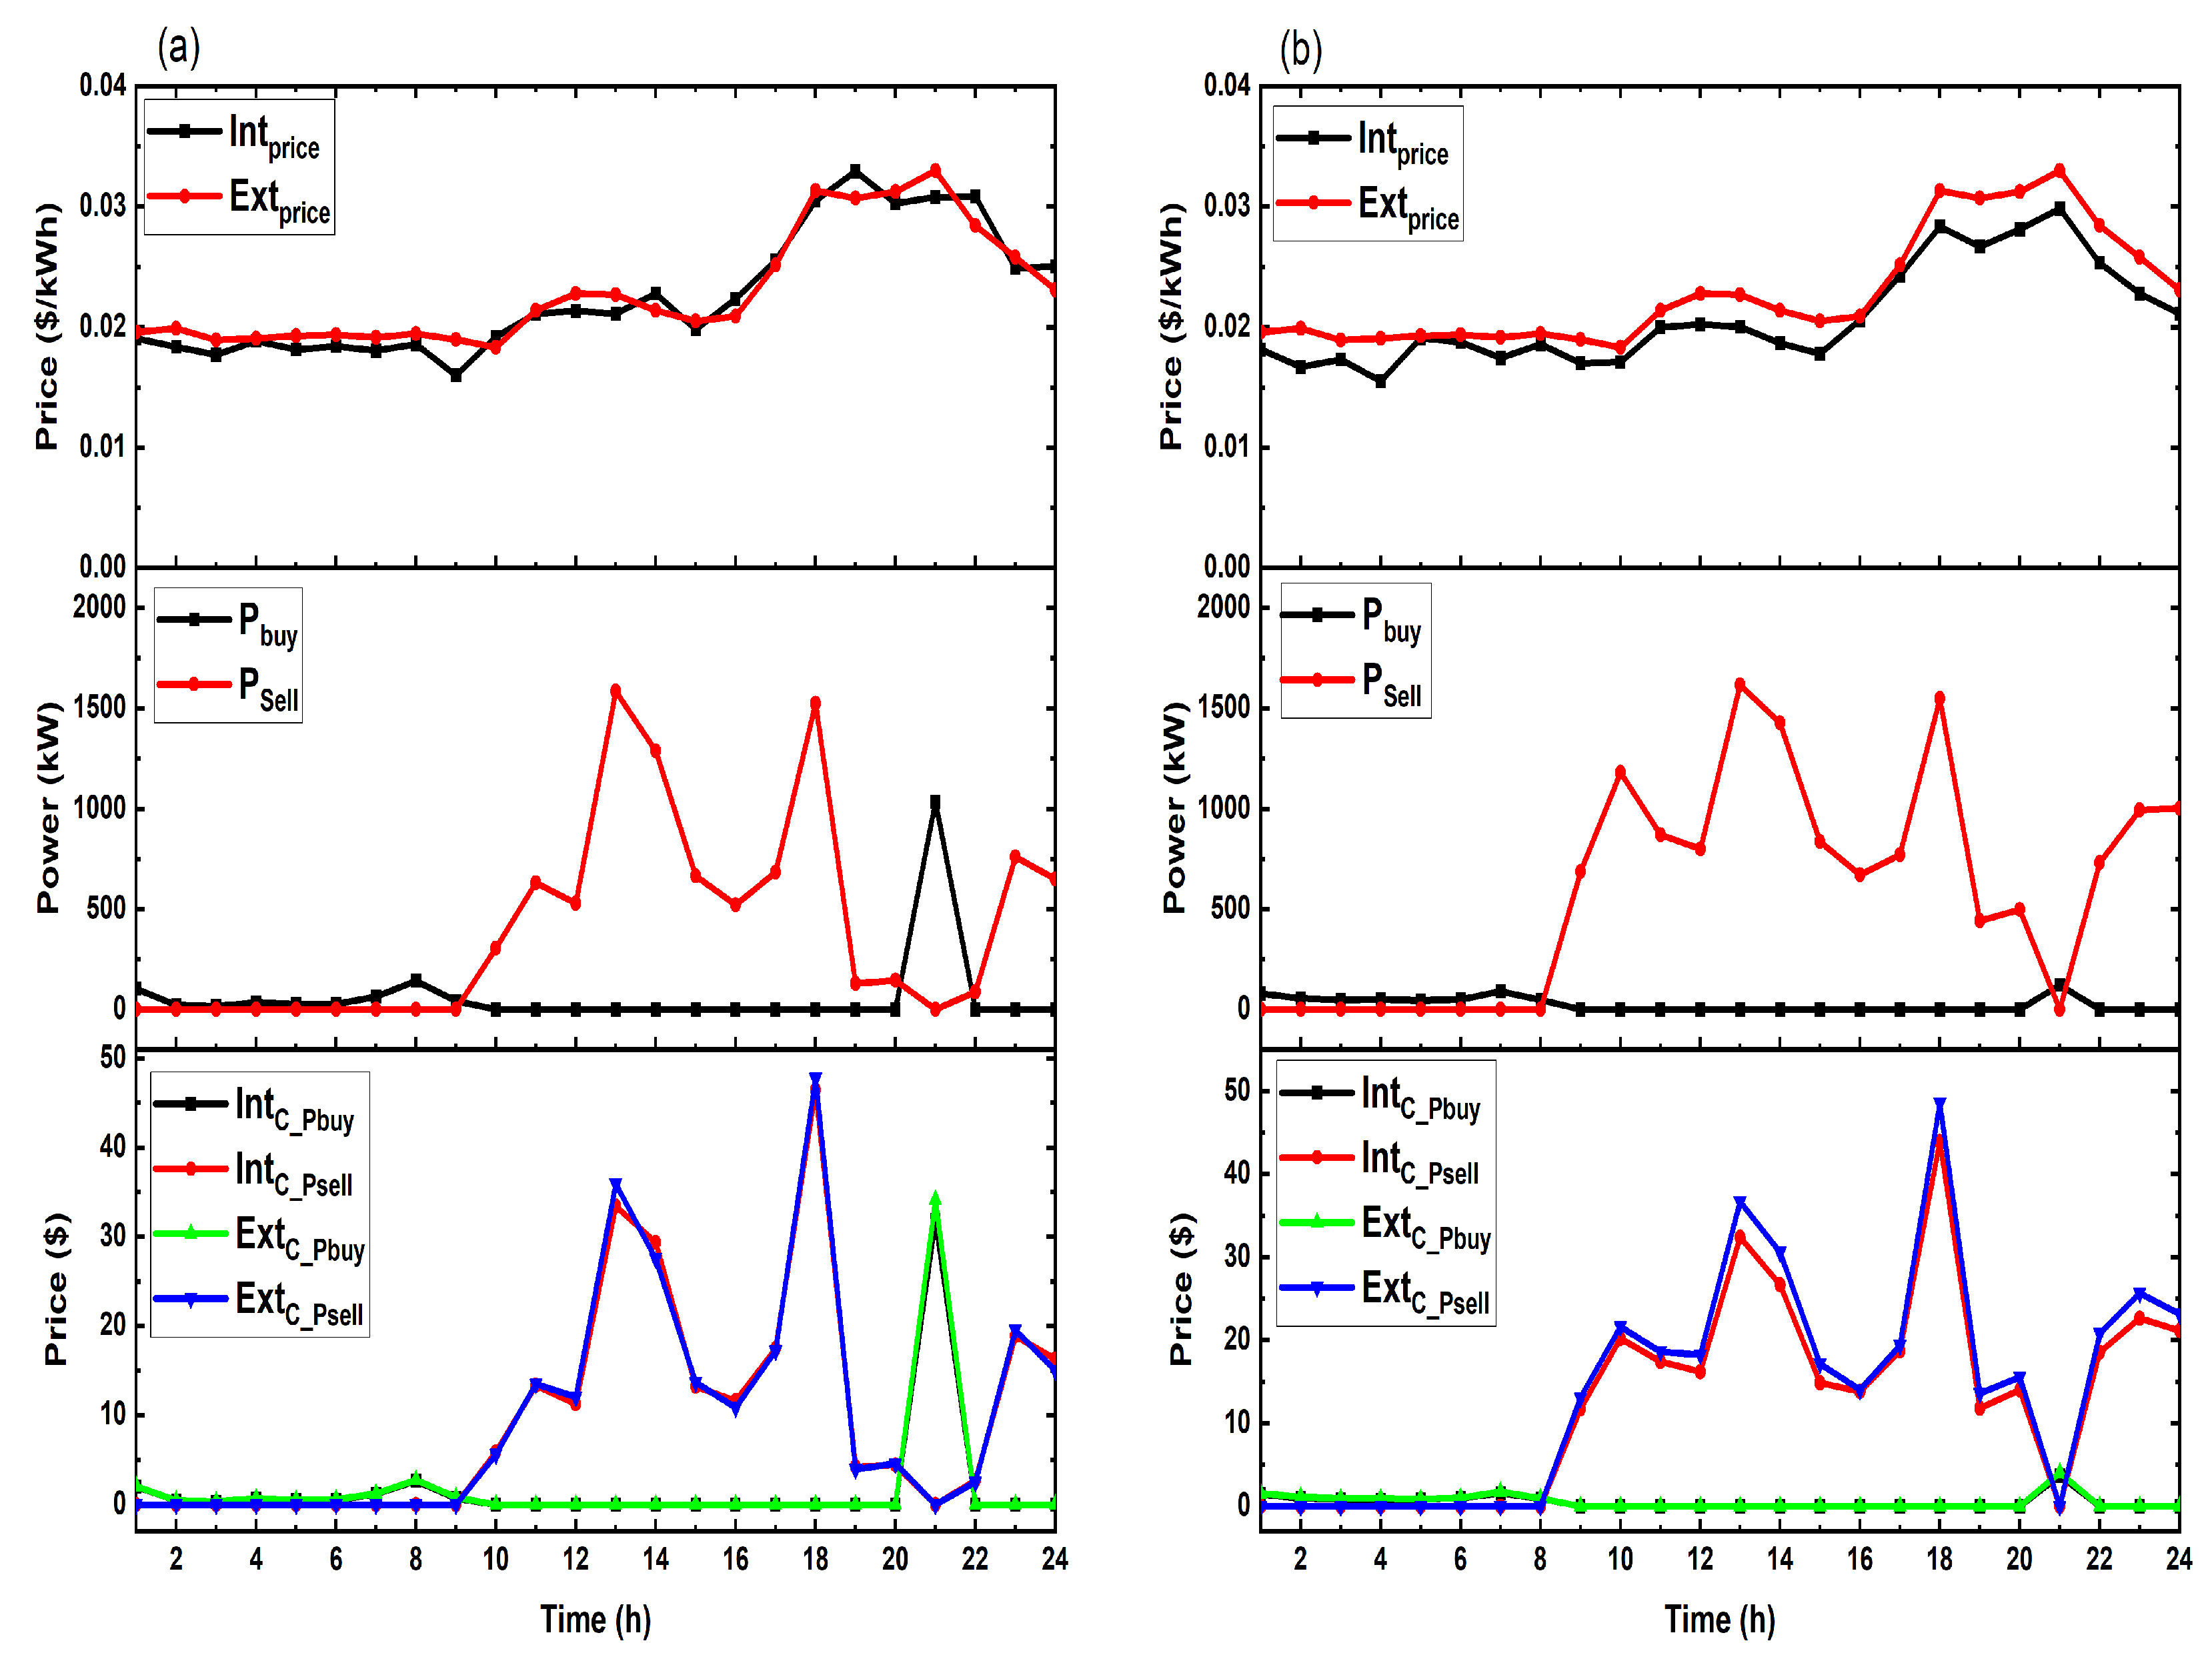
This section compares the energy trading performance of many MGs in Case 3, weighing the financial advantages of direct wholesale market participation vs. an internal pricing scheme for VPPs over 24 h with real-time decision-making. The VPP’s dynamic pricing strategy, which tailors internal rates for each MG according to their unique operational features and current situations, is illustrated in
Figure 12. The findings show that VPP aggregation benefits participating MGs financially. The findings highlight the ability of the VPP operator to establish advantageous internal trading circumstances for its aggregated MGs, which is a major advantage of the suggested hierarchical energy management system. The VPP lowers its net vulnerability to the unstable wholesale market by strategically planning the centralized energy storage system and using excess energy from one MG to fill in the gaps of another. The VPP operator can offer internal prices that are steadier and often lower than peak external prices due to this internal balancing act. The graph shows that the internal price stays below the external price during important buying times for MGs.
The cost-saving benefit for MG1 from the VPP’s internal pricing structure over direct market trading is shown in
Figure 13a. Because of this, MG1’s internal energy purchase price is cheaper, as shown by the fact that its total cost through the VPP is about
$40.67 as opposed to about
$43.42 on the open market. As demonstrated by the 6.4% decrease in energy prices for MG1, the VPP serves as a strategic aggregator, protecting MGs from high market volatility and fostering a more favorable internal market, which leads to observable cost reductions. This demonstrates how well the collaborative model works to increase the distributed energy resources’ profitability.
Figure 13b indicates the savings in costs MG2 achieves based on the internal pricing structure of the VPP. Trade is facilitated through VPP whereby the cost of energy procurement to MG2 is lowered to a definite economic advantage of
$11.90 compared to the market rate of
$13.07. This cost efficiency is attributed to the optimized internal pricing system that uses coordinated storage operation and MMG complementarity that is provided by the VPP. These results indicate that the proposed structure can be scaled to different MGs and consumption patterns.
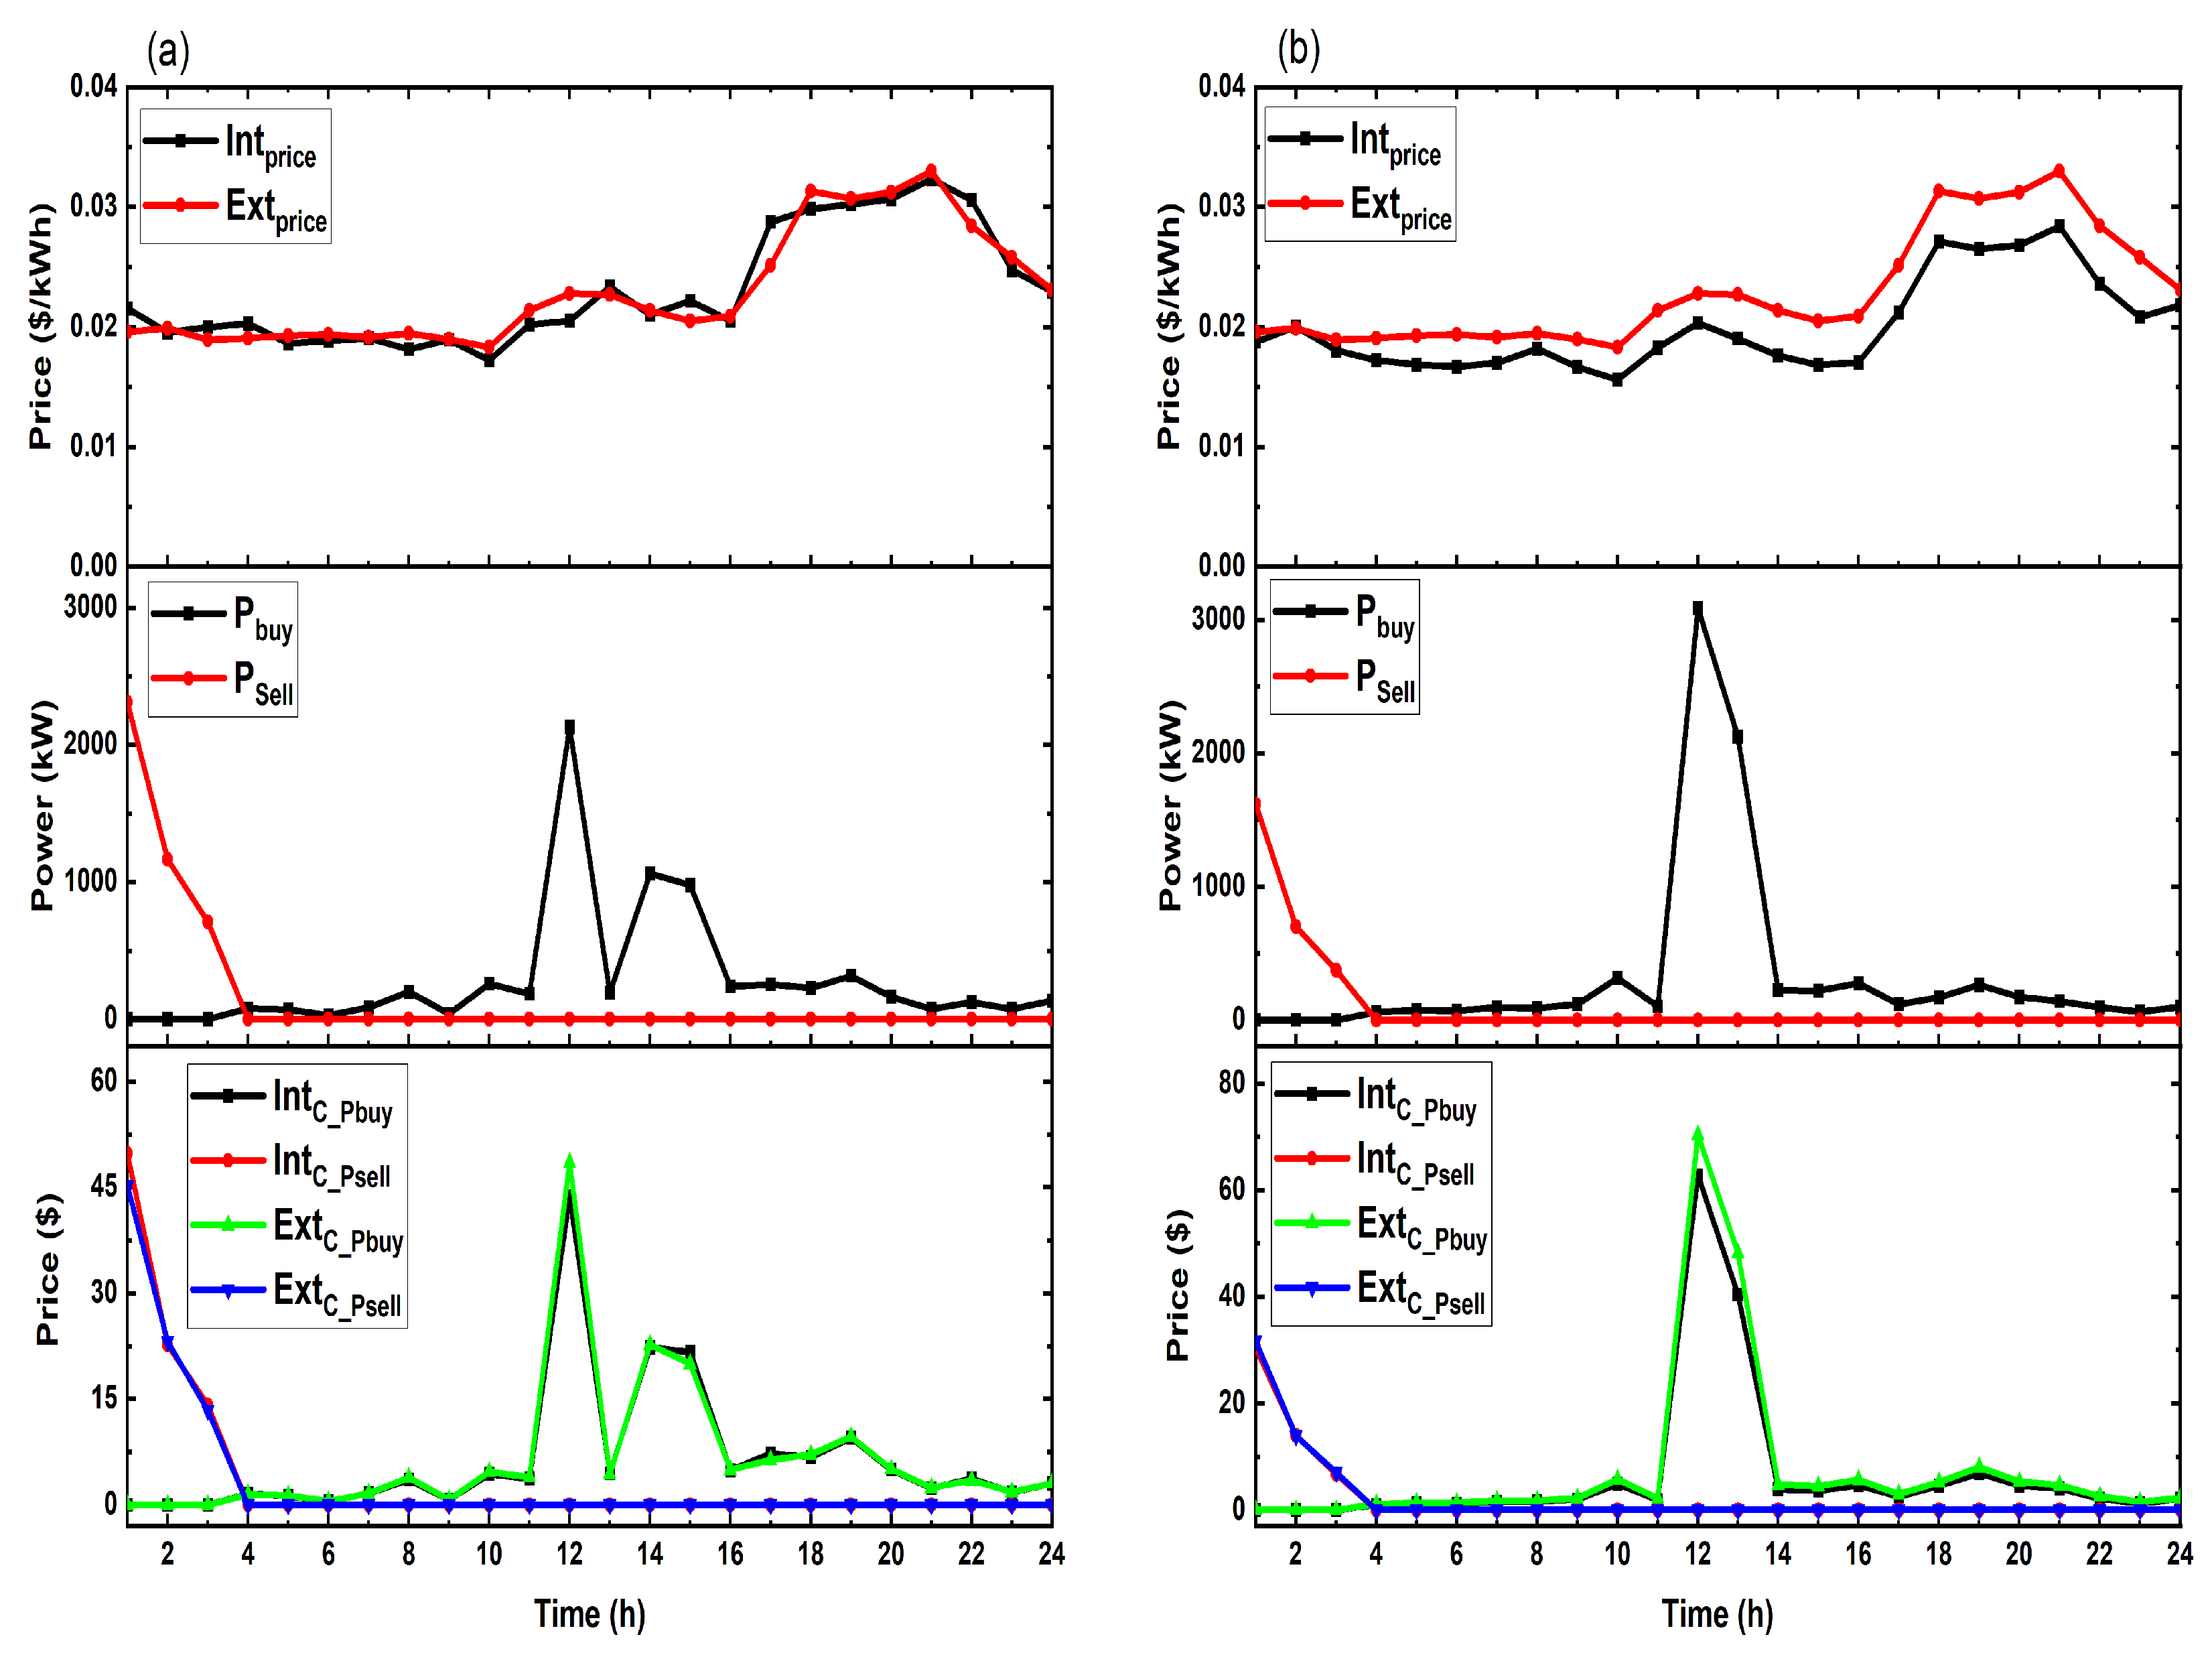
As illustrated in
Figure 14a, the internal pricing of the VPP helps to cushion the PV-deficient MG3 against the peak prices in the market and hence its costs of energy are minimized by approximately 2.4% in the time periods of peak demand. Under VPP membership, MG3, with high reliance on external electricity because of the absence of local PV production, reduces its energy costs by approximately 2.4%, dropping the cost per kilowatt-hour to a prohibitive market price of
$157.80 to
$154.02. The VPP can use its resources in a better manner to prevent the fluctuation of wholesale prices, and this is the critical role that it serves in assisting the MGs with limited resources by ensuring that the whole process is carried out carefully to supply the MGs with limited resources between 11:00 and 16:00, which is during the peak hours. The result confirms that the framework may ensure economic viability and operational stability for the most vulnerable participants in the energy ecosystem. As seen in
Figure 14b, the VPP framework offers a notable 13.50% decrease in energy purchasing prices, demonstrating great economic efficiency for the participating MG4.
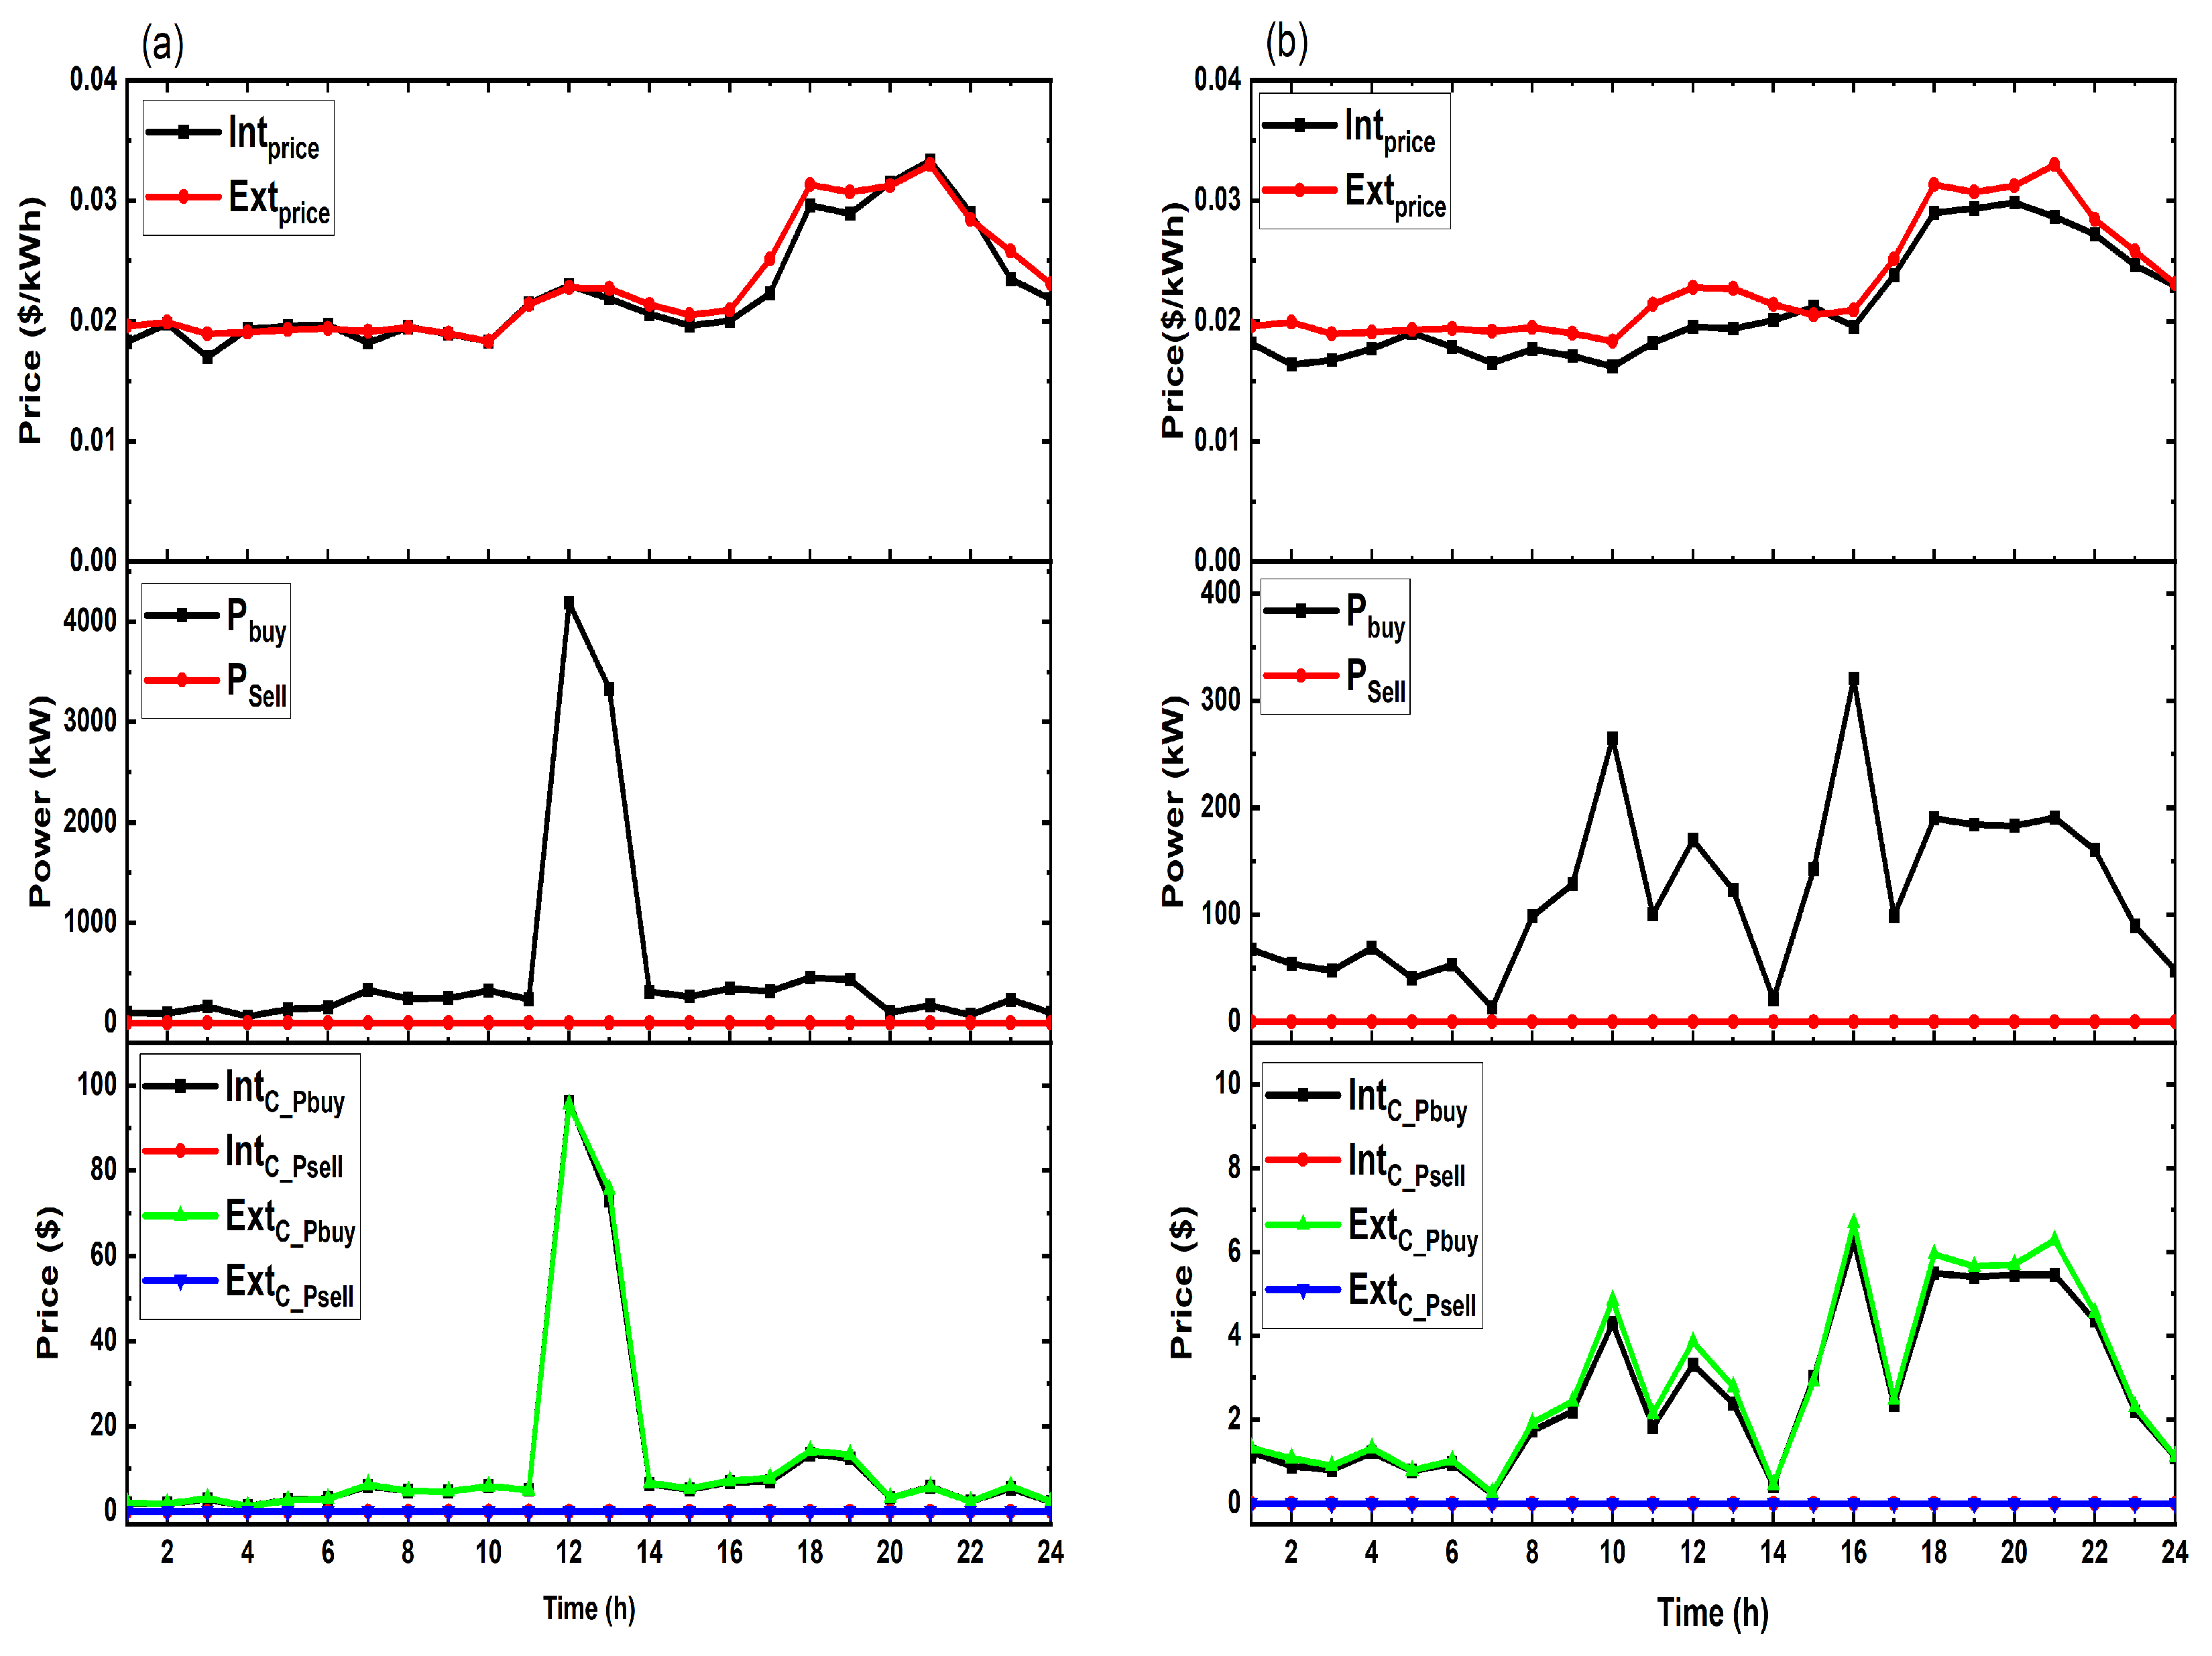
Figure 15a illustrates the 2.25% cost savings achieved through VPP mediation, proving the model’s ability to generate value even for MG5 with lower marginal gains. The internal pricing method reduces energy costs by 7.90% for MG6, as shown in
Figure 15b, demonstrating the VPP’s reliable performance under a range of operational conditions. Similarly,
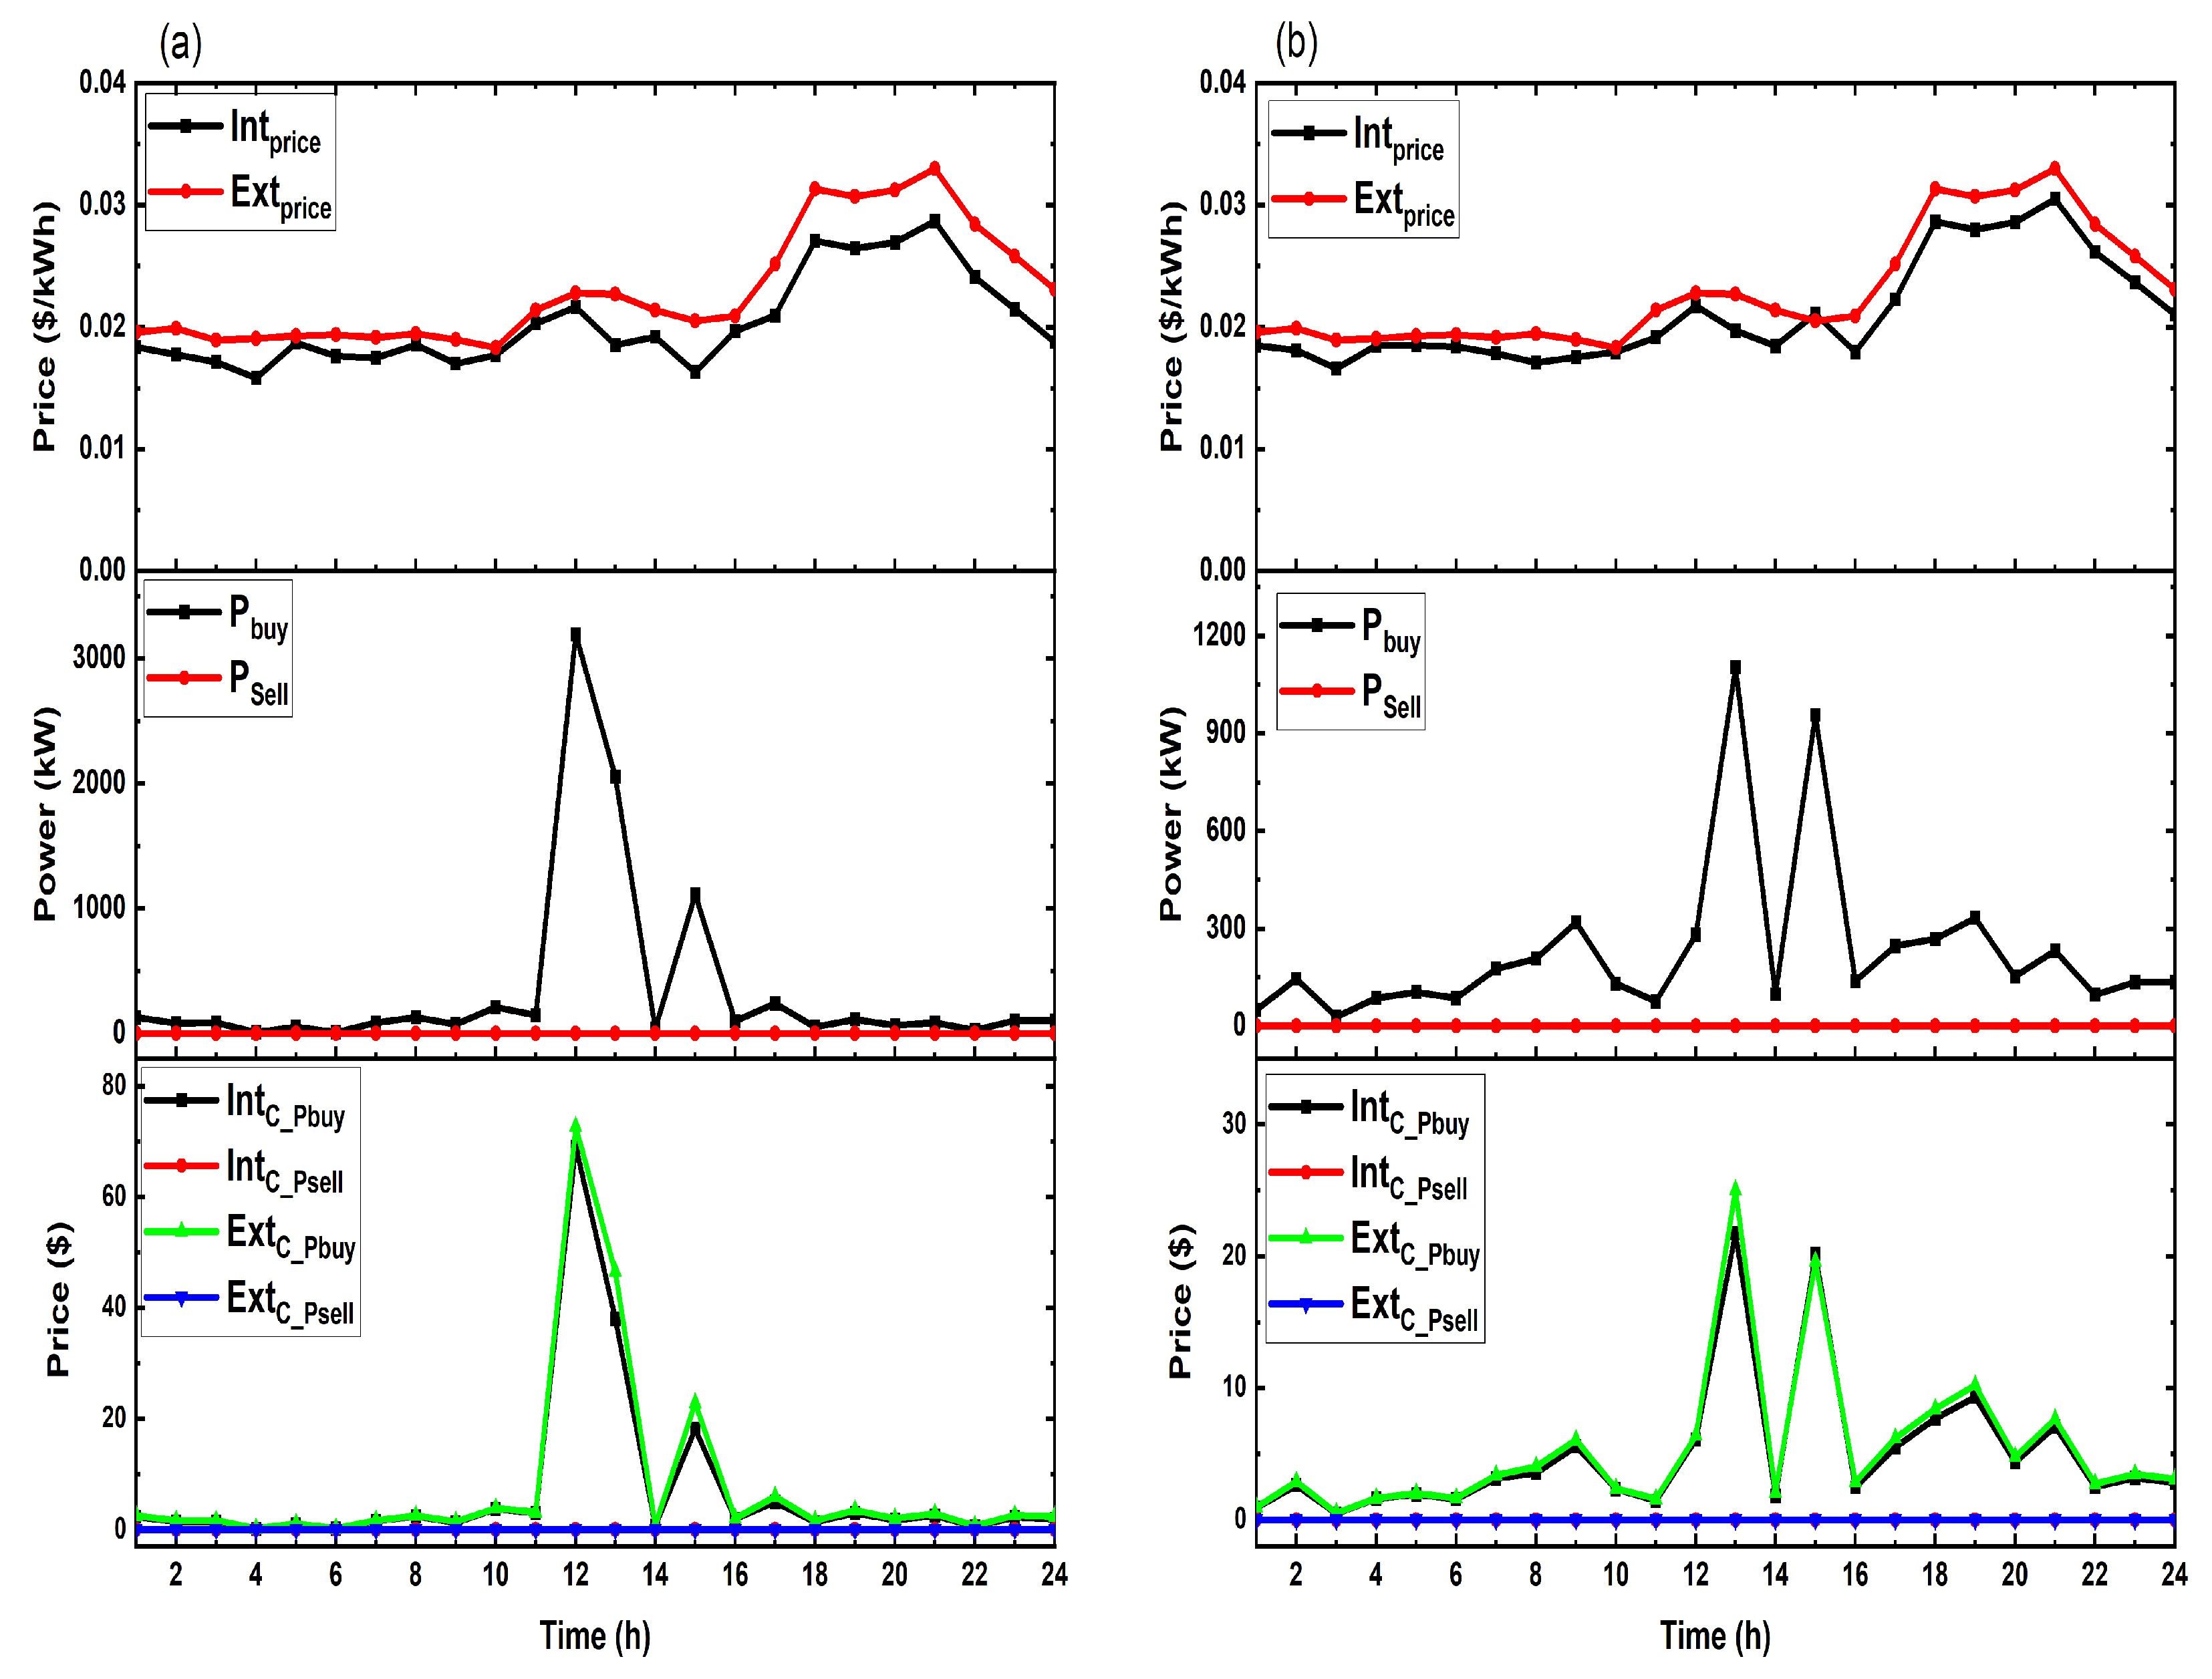
Figure 16 shows that energy costs are decreased by 11.6% for MG7 and 7.54% for MG8, respectively, showing the scalability and great economic advantage of the VPP aggregation approach for this configuration. The outcomes of energy trading prices through the wholesale market and VPP are shown in
Table 3.
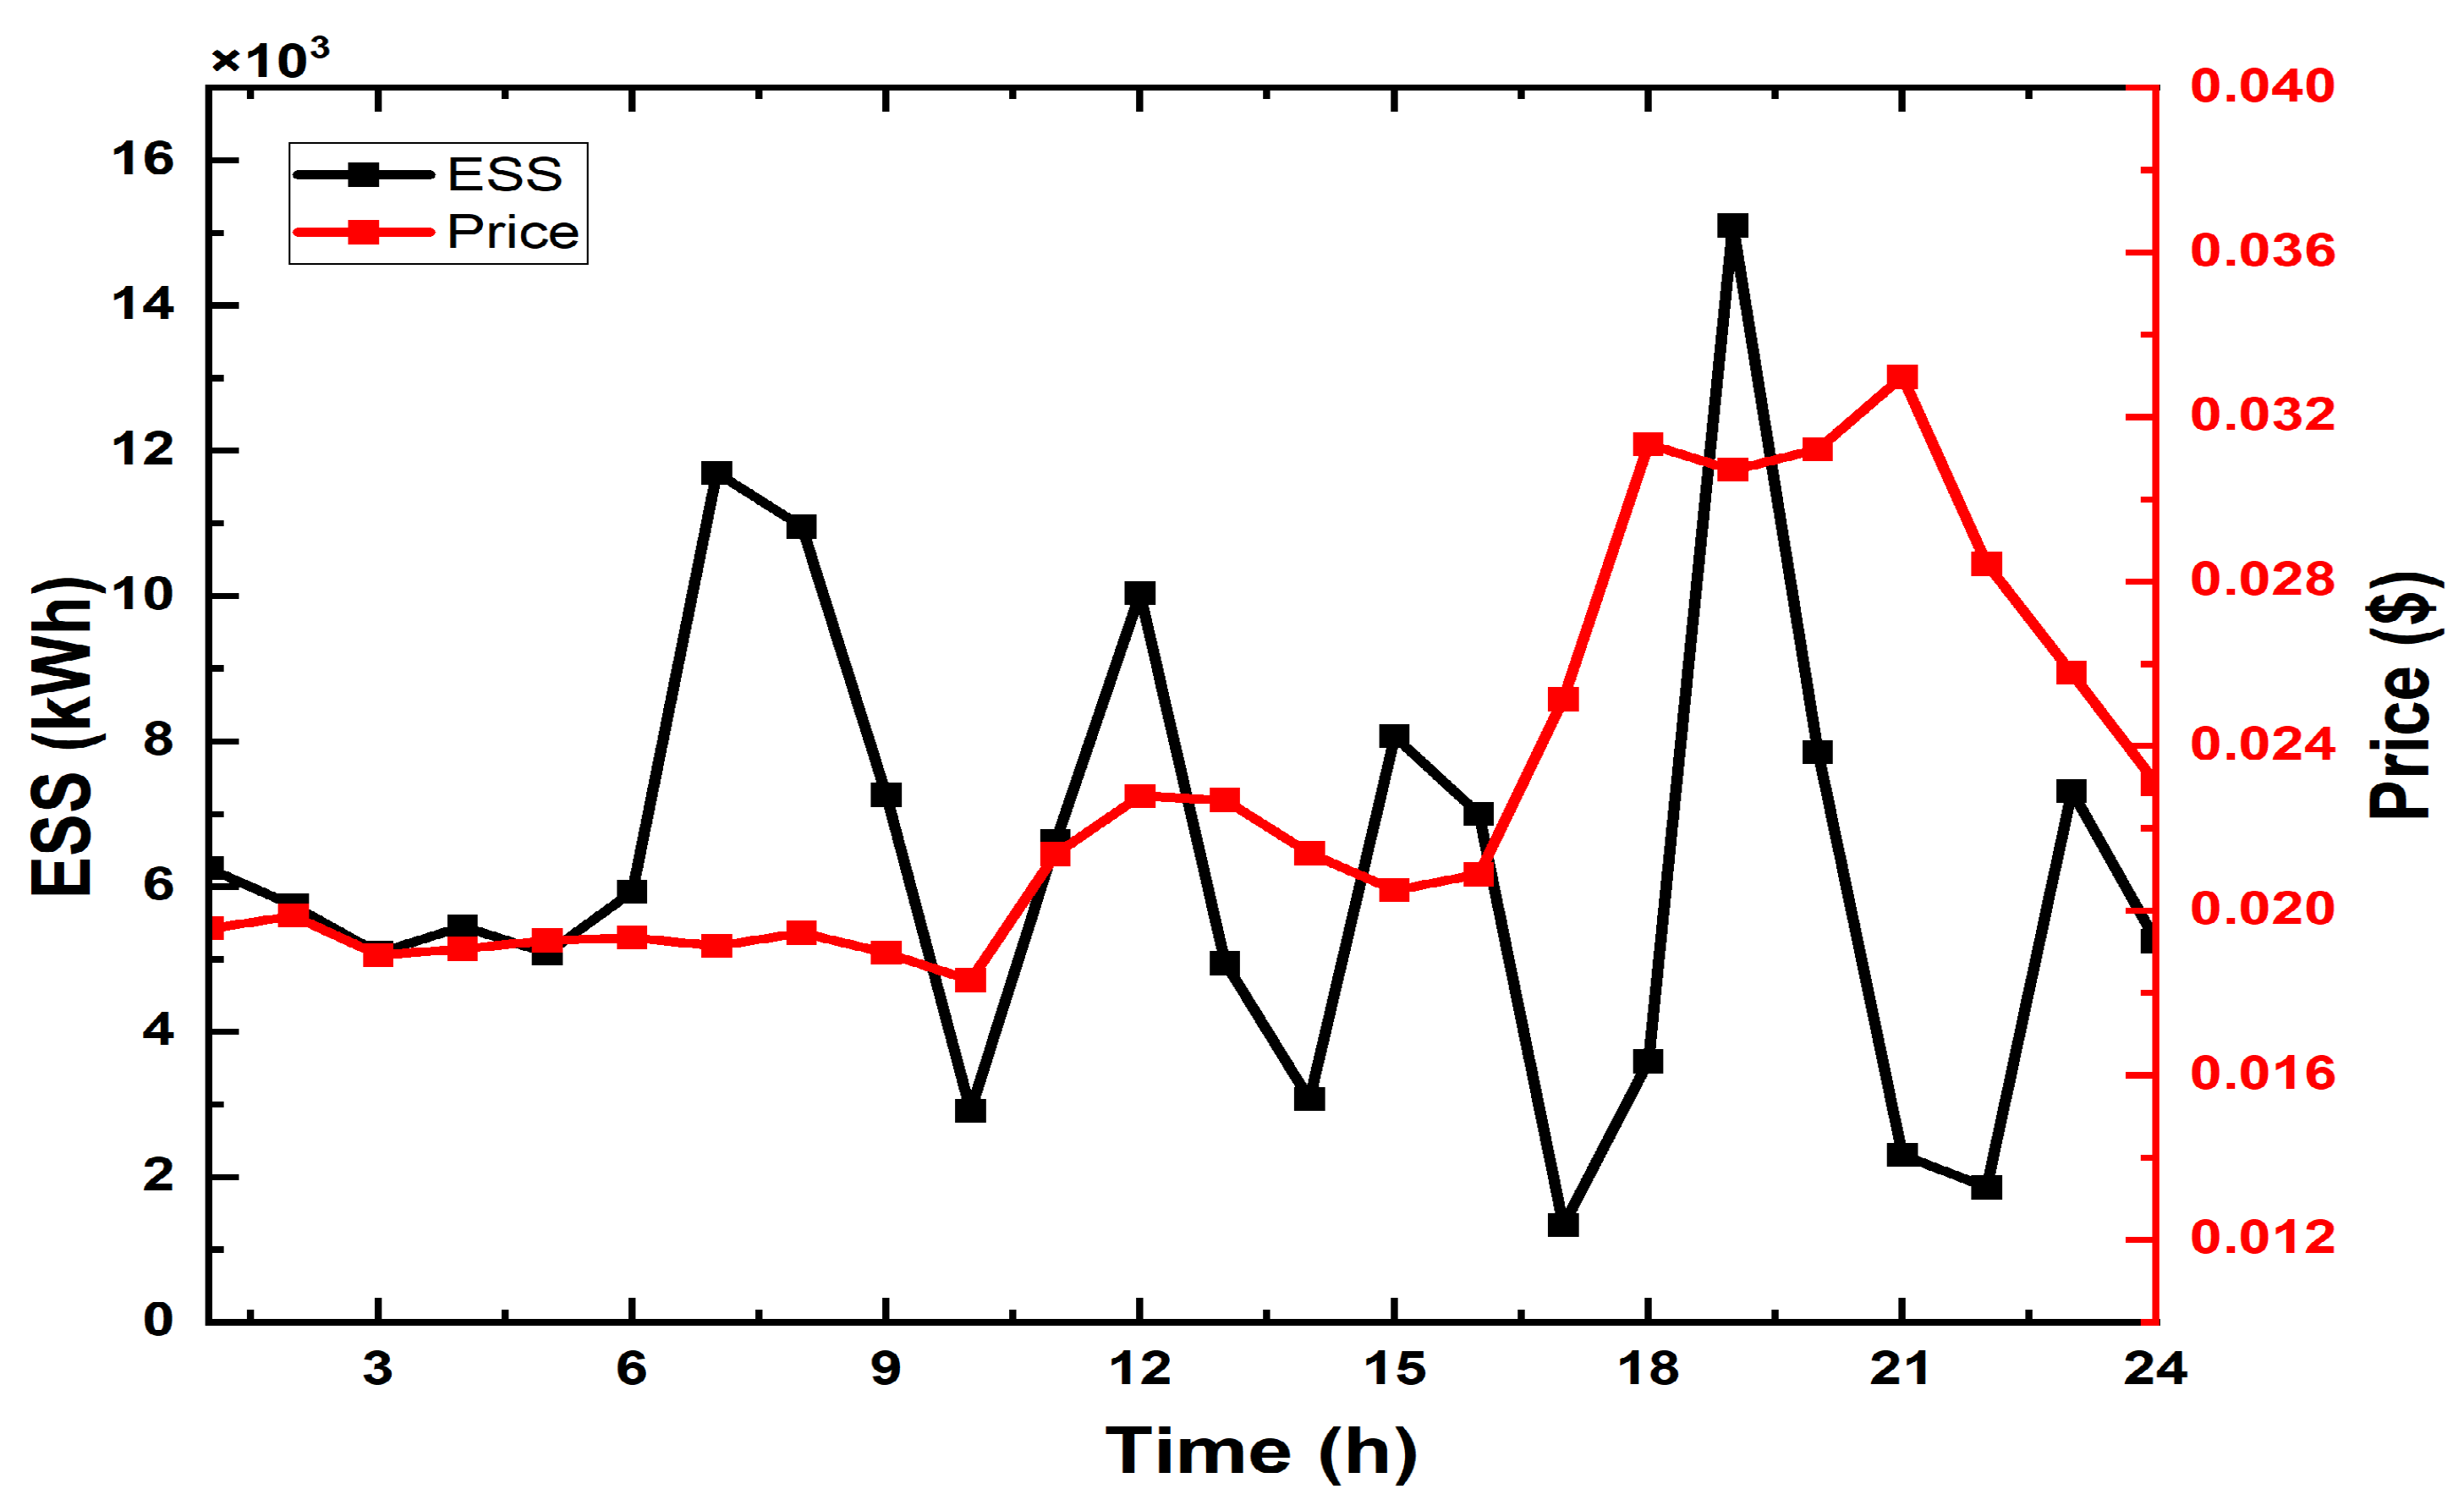
The VPP centralized energy storage system’s real-time, 24 h response to electricity market pricing is depicted in
Figure 17. The graph clearly illustrates a conventional price-driven arbitrage strategy. A growing state of charge indicates that ESS charging mainly occurs during periods of low electricity costs, storing cheap energy. However, by discharging (as shown by a decreasing state of charge) when prices are high to supply the combined MGs, the ESS eliminates the need to purchase expensive power from the wholesale market. This planned cycle of charging and discharging lowers the net load on the main grid and gives the VPP significant financial rewards by utilizing pricing differences. The inverse relationship between the market price and the ESS energy level validates the effectiveness of the proposed DRL agent in managing the storage asset optimally to lower operational expenses.
4.4. Performance Comparison of Internal Pricing Models for VPPs
Three cutting-edge deep reinforcement learning algorithms: proximal policy optimization (PPO), advantage actor–critic (A2C), and soft actor-critic (SAC) were used in a comparative study to assess the effectiveness of the suggested methodology. A thorough performance evaluation utilizing mean absolute error (MAE) and mean absolute percentage error (MAPE) across eight MG systems served as the basis for choosing the best algorithm for internal price setting. They are used to quantify the deviation between the internally set prices and the corresponding external market prices. These metrics therefore serve as indicators of pricing stability and bounded alignment with market signals.
With the lowest MAE in six of the eight test cases and a 75% success rate, PPO was found to be the best algorithm by the evaluation, while SAC outperformed it in the other two systems. PPO performed consistently across a variety of MG configurations and showed very good accuracy in MG3 (MAE: 0.7856). The acquired MAPE values for the eight MGs are 8.46%, 13.3%, 8.28%, 11.8%, 9.22%, 13.4%, 11.2%, and 9.85%, which further validate this dominant performance. The overall framework’s outstanding accuracy is confirmed by these low error rates. PPO was the most dependable option for the hierarchical deep reinforcement learning framework because of its superior and consistent error measures as well as its built-in stability mechanisms, which are essential for managing market price volatility.
4.5. Techno-Economic Performance
The techno-economic analyses presented in this section are derived from the operational results of the DRL-based coordination framework. By analyzing component sizing, cost, and reliability, the techno-economic optimization approach determined the best system configuration for every location. Based on site-specific factors such as local demand, solar irradiation, and wind speed, four different configurations were chosen to minimize the levelized cost of electricity (LCOE) and net present cost (NPC) while guaranteeing a small capacity shortfall. The chosen architectures show how capital investment and operational performance are traded off in various geographic settings. The primary input parameters for modeling and optimizing the MMG system are listed in
Table 4 [
45].
Table 5 summarizes the economic analysis results with excess energy and renewable fraction of the selected sites.
4.5.1. PV, WT, and DG with ESS
The techno-economic analysis shows that both MG1 and MG2 achieve the same levelized cost of energy (LCOE) of about $0.144/kWh, indicating high efficiency and economic viability. This suggests similar operational effectiveness in providing reasonably priced power. But a significant distinction is the initial outlay of funds: With a capital expenditure (CAPEX) of about $15.8 million and a net present cost (NPC) of $25.9 million, MG1 is more costly than MG2, which has an NPC of $22 million and CAPEX of $13.4 million. This disparity suggests that MG1 is more extensive or has more advanced technology. Despite its greater initial capital cost, MG1’s competitive LCOE confirms its long-term economic sustainability. By finding the perfect balance between capital expenditure and operational effectiveness, both configurations’ exceptional performance demonstrates their potential to provide reliable, renewable energy solutions while preserving a solid value offer.
4.5.2. WT and DG with ESS
Techno-economic analysis indicates that a WT-DG-ESS is the optimal configuration for MG3. This hybrid system’s levelized cost of energy is $0.146/kWh, which is a little higher than prior setups and reflects the cost structure of mixing conventional and renewable energy sources. The system requires a large initial investment because it is larger in size and requires more technical expertise to balance wind power, storage, and diesel backup, as it is manifested by its larger net present cost of $44.8 million and capital expenditure (CAPEX) of $24.7 million. Although the capital cost of the arrangement is high, it provides a good alternative in areas with intermittent wind resources, which guarantee reliability in energy supply and minimize reliance on fuels in the long run. The economic feasibility of the system can be reflected in the fact that it utilizes renewable energy to create a steady power supply, which accounts for the increased initial costs in terms of the operating stability and long-term economic viability.
4.5.3. PV and WT with ESS
The levelized cost of energy of MG4, which is a PV-WT-ESS hybrid system, is about $0.164/kWh. This higher price in comparison with other schemes represents the gigantic capital density of incorporating and harmonizing multiple renewable sources of generation and a massive energy depository. The system is also very large, as the net cost today is approximately $46 million. Although this setup is more expensive at the start, it provides greater energy resilience and high levels of penetration of renewable energy, and it will be especially appropriate in regions where the solar and wind resources are complementary. The system’s architecture guarantees long-term operational sustainability and safeguards against changes in fuel prices by decreasing reliance on conventional fuel-based power generation, which helps to justify the initial capital investment.
4.5.4. PV and DG with ESS
The techno-economic performance of the PV-DG-ESS combinations spanning MG5 to MG8 demonstrates varying cost–efficiency trade-offs. Although MG5 has the largest capital expenditure, with a net present cost of about
$65.5 million, it delivers a competitive levelized cost of energy of about
$0.152/kWh. MG6 and MG7 demonstrate improved capital efficiency with LCOEs of
$0.149/kWh and
$0.150/kWh, respectively, and NPCs of
$39.7 million and
$36.5 million, demonstrating that comparable operating costs can be maintained with fewer initial inputs. MG8 balances initial investment and continuing operating expenses with an NPC of around
$47.2 million and an LCOE of about
$0.153/kWh. The variance in these outcomes emphasizes the adaptability of the PV-DG-ESS architecture, which can be adjusted to satisfy specific operational and financial objectives while consistently enhancing renewable integration and reducing reliance on conventional fuel sources.
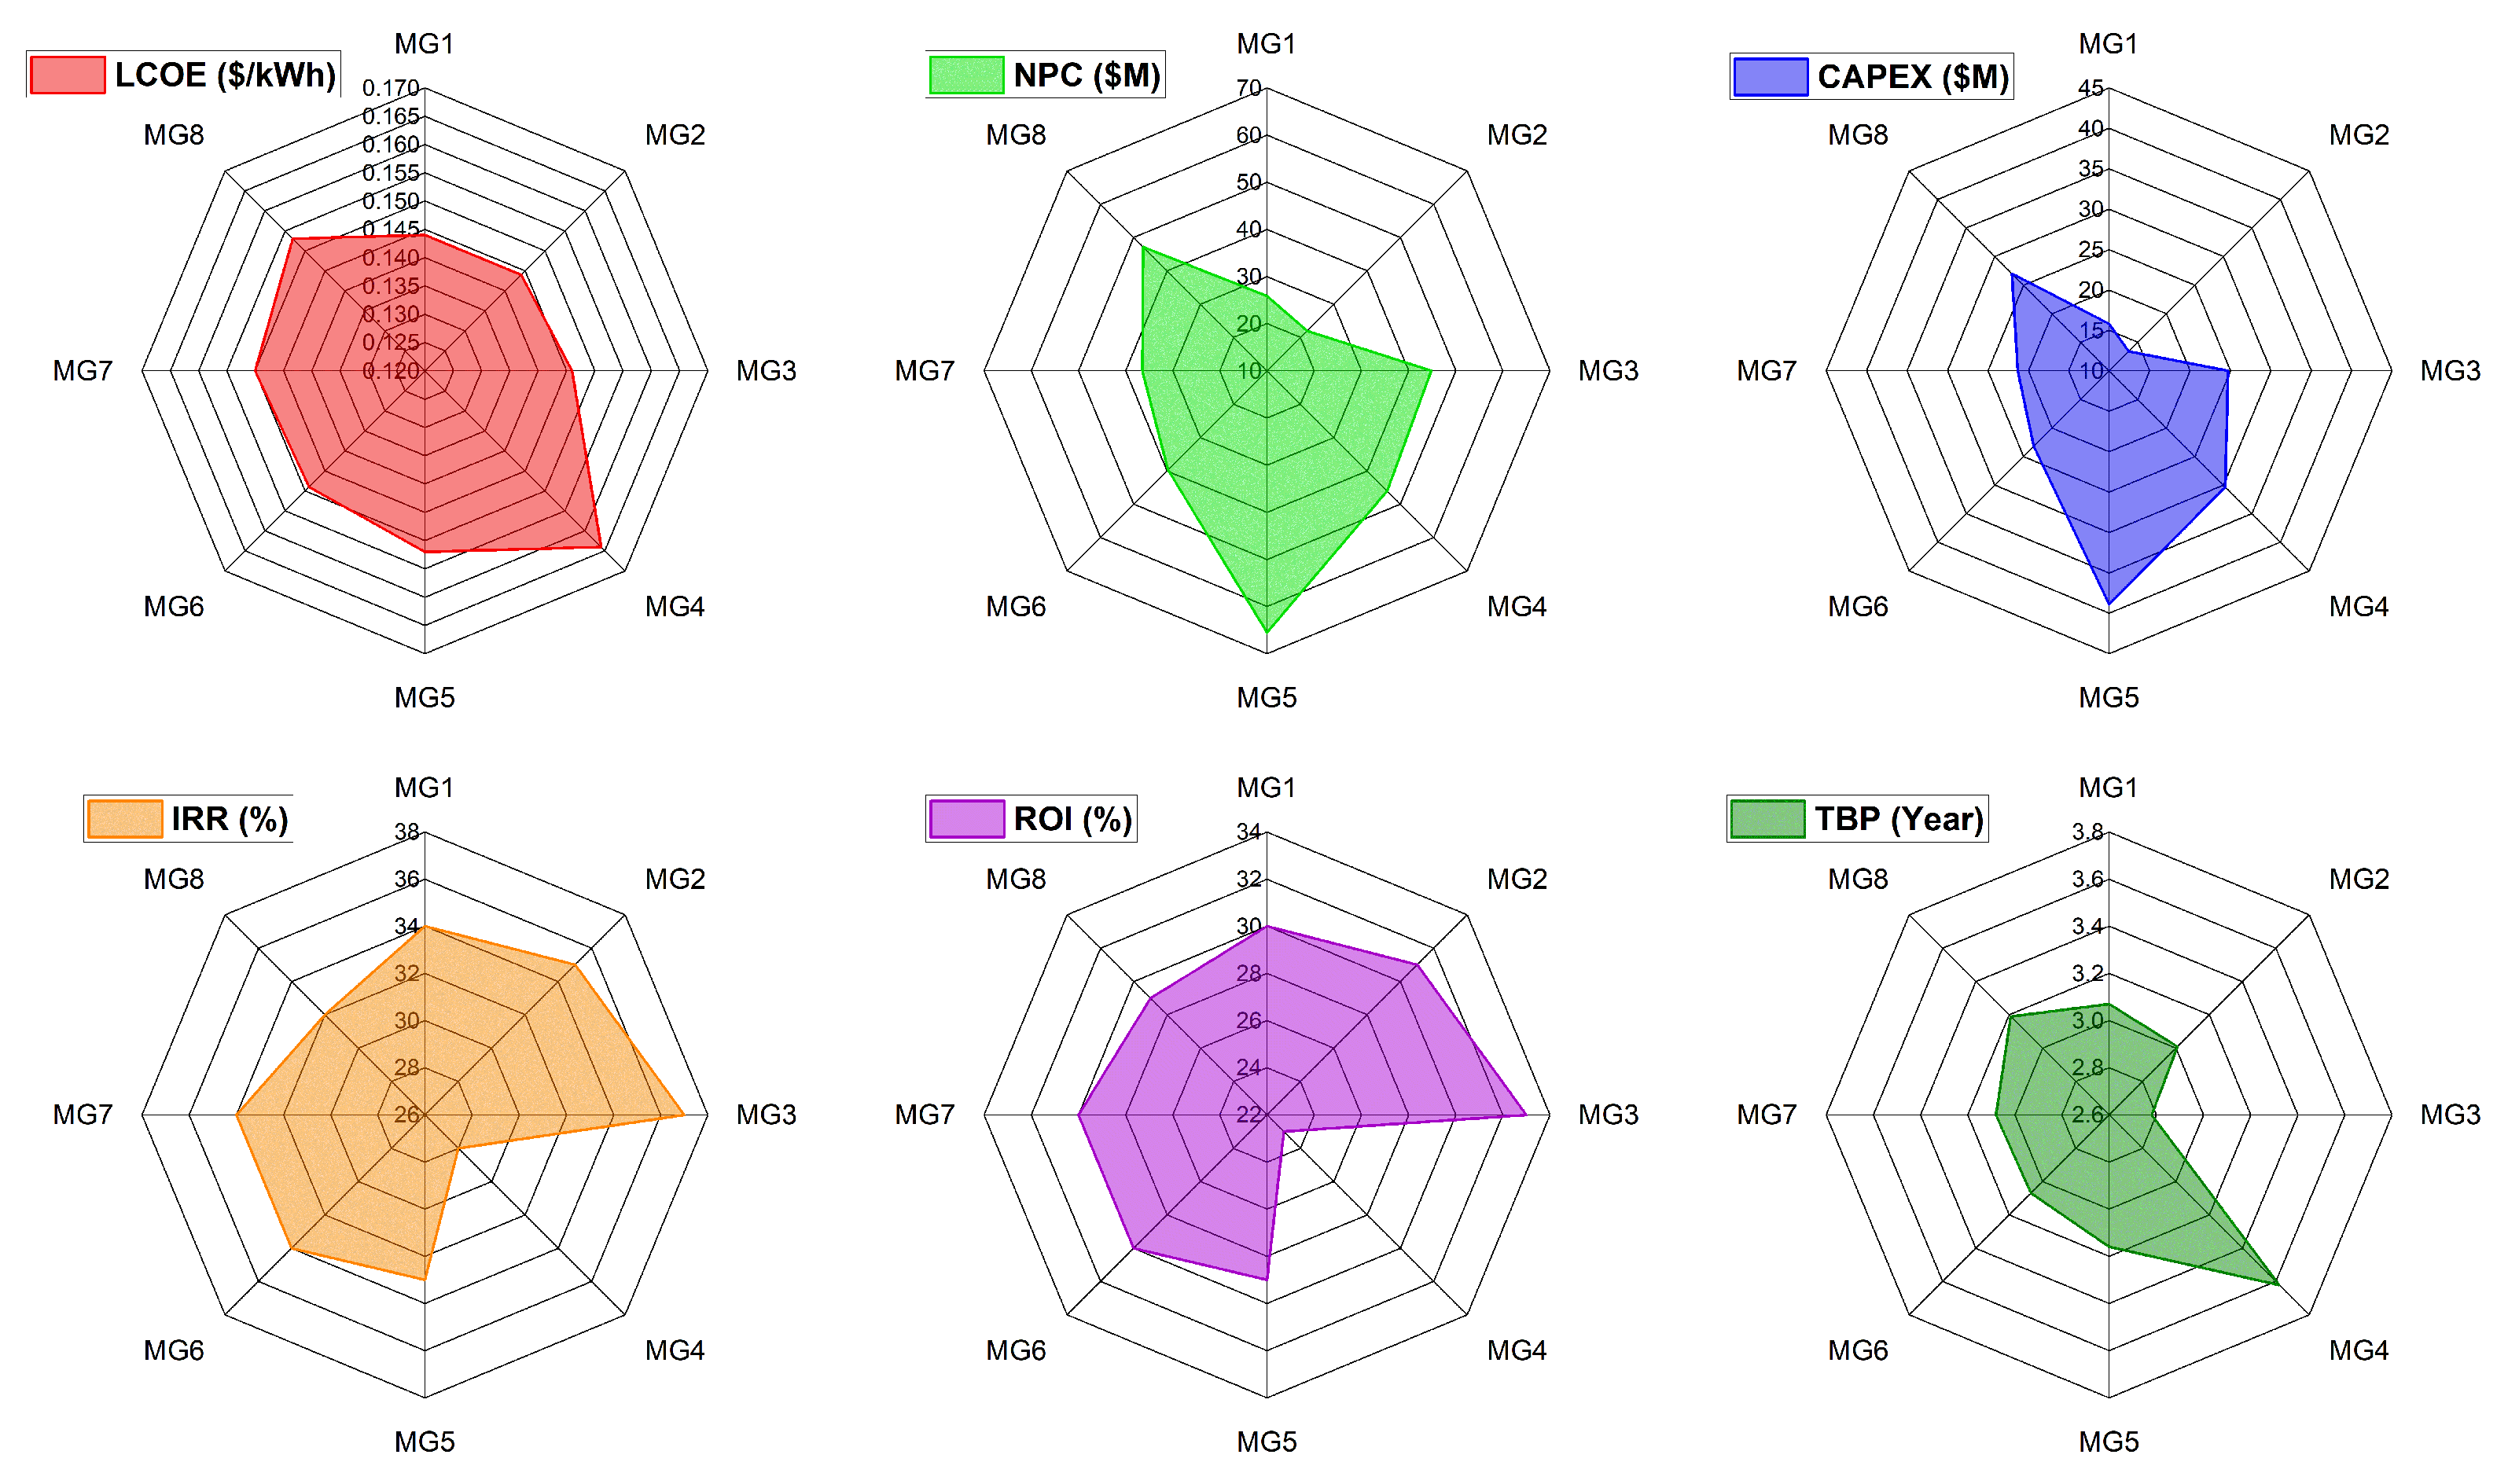
Figure 18 compares the economic performance of PV, WT, DG, and ESS technologies across all MGs.
4.6. Financial Performance
The financial study of the eight MG topologies (MG1–8) in
Figure 18 demonstrates their high economic significance, with the majority of projects showing outstanding investment potential. With an IRR of 34–37% and return on investment (ROI) values of 30–33%, MG1, MG2, and MG3 demonstrate exceptional financial viability, which is bolstered by quick payback durations of 2.78–3.07 years. With constant payback times ranging from 3.08 to 3.19 years and IRRs of 33–34% and ROIs of 29–30%, MG5 through MG8 likewise offer very favorable and reliable returns. With a payback period of 3.62 years and a relatively low IRR of 28% and ROI of 23%, MG4’s performance is nonetheless financially feasible and represents the trade-offs of a larger-scale, high-renewable penetration system. The findings taken together highlight the strong financial returns and strong investment security provided by the suggested MG designs, most of which guarantee capital recovery in a short amount of time. The results can be found in
Table 5.
4.7. Environmental Performance
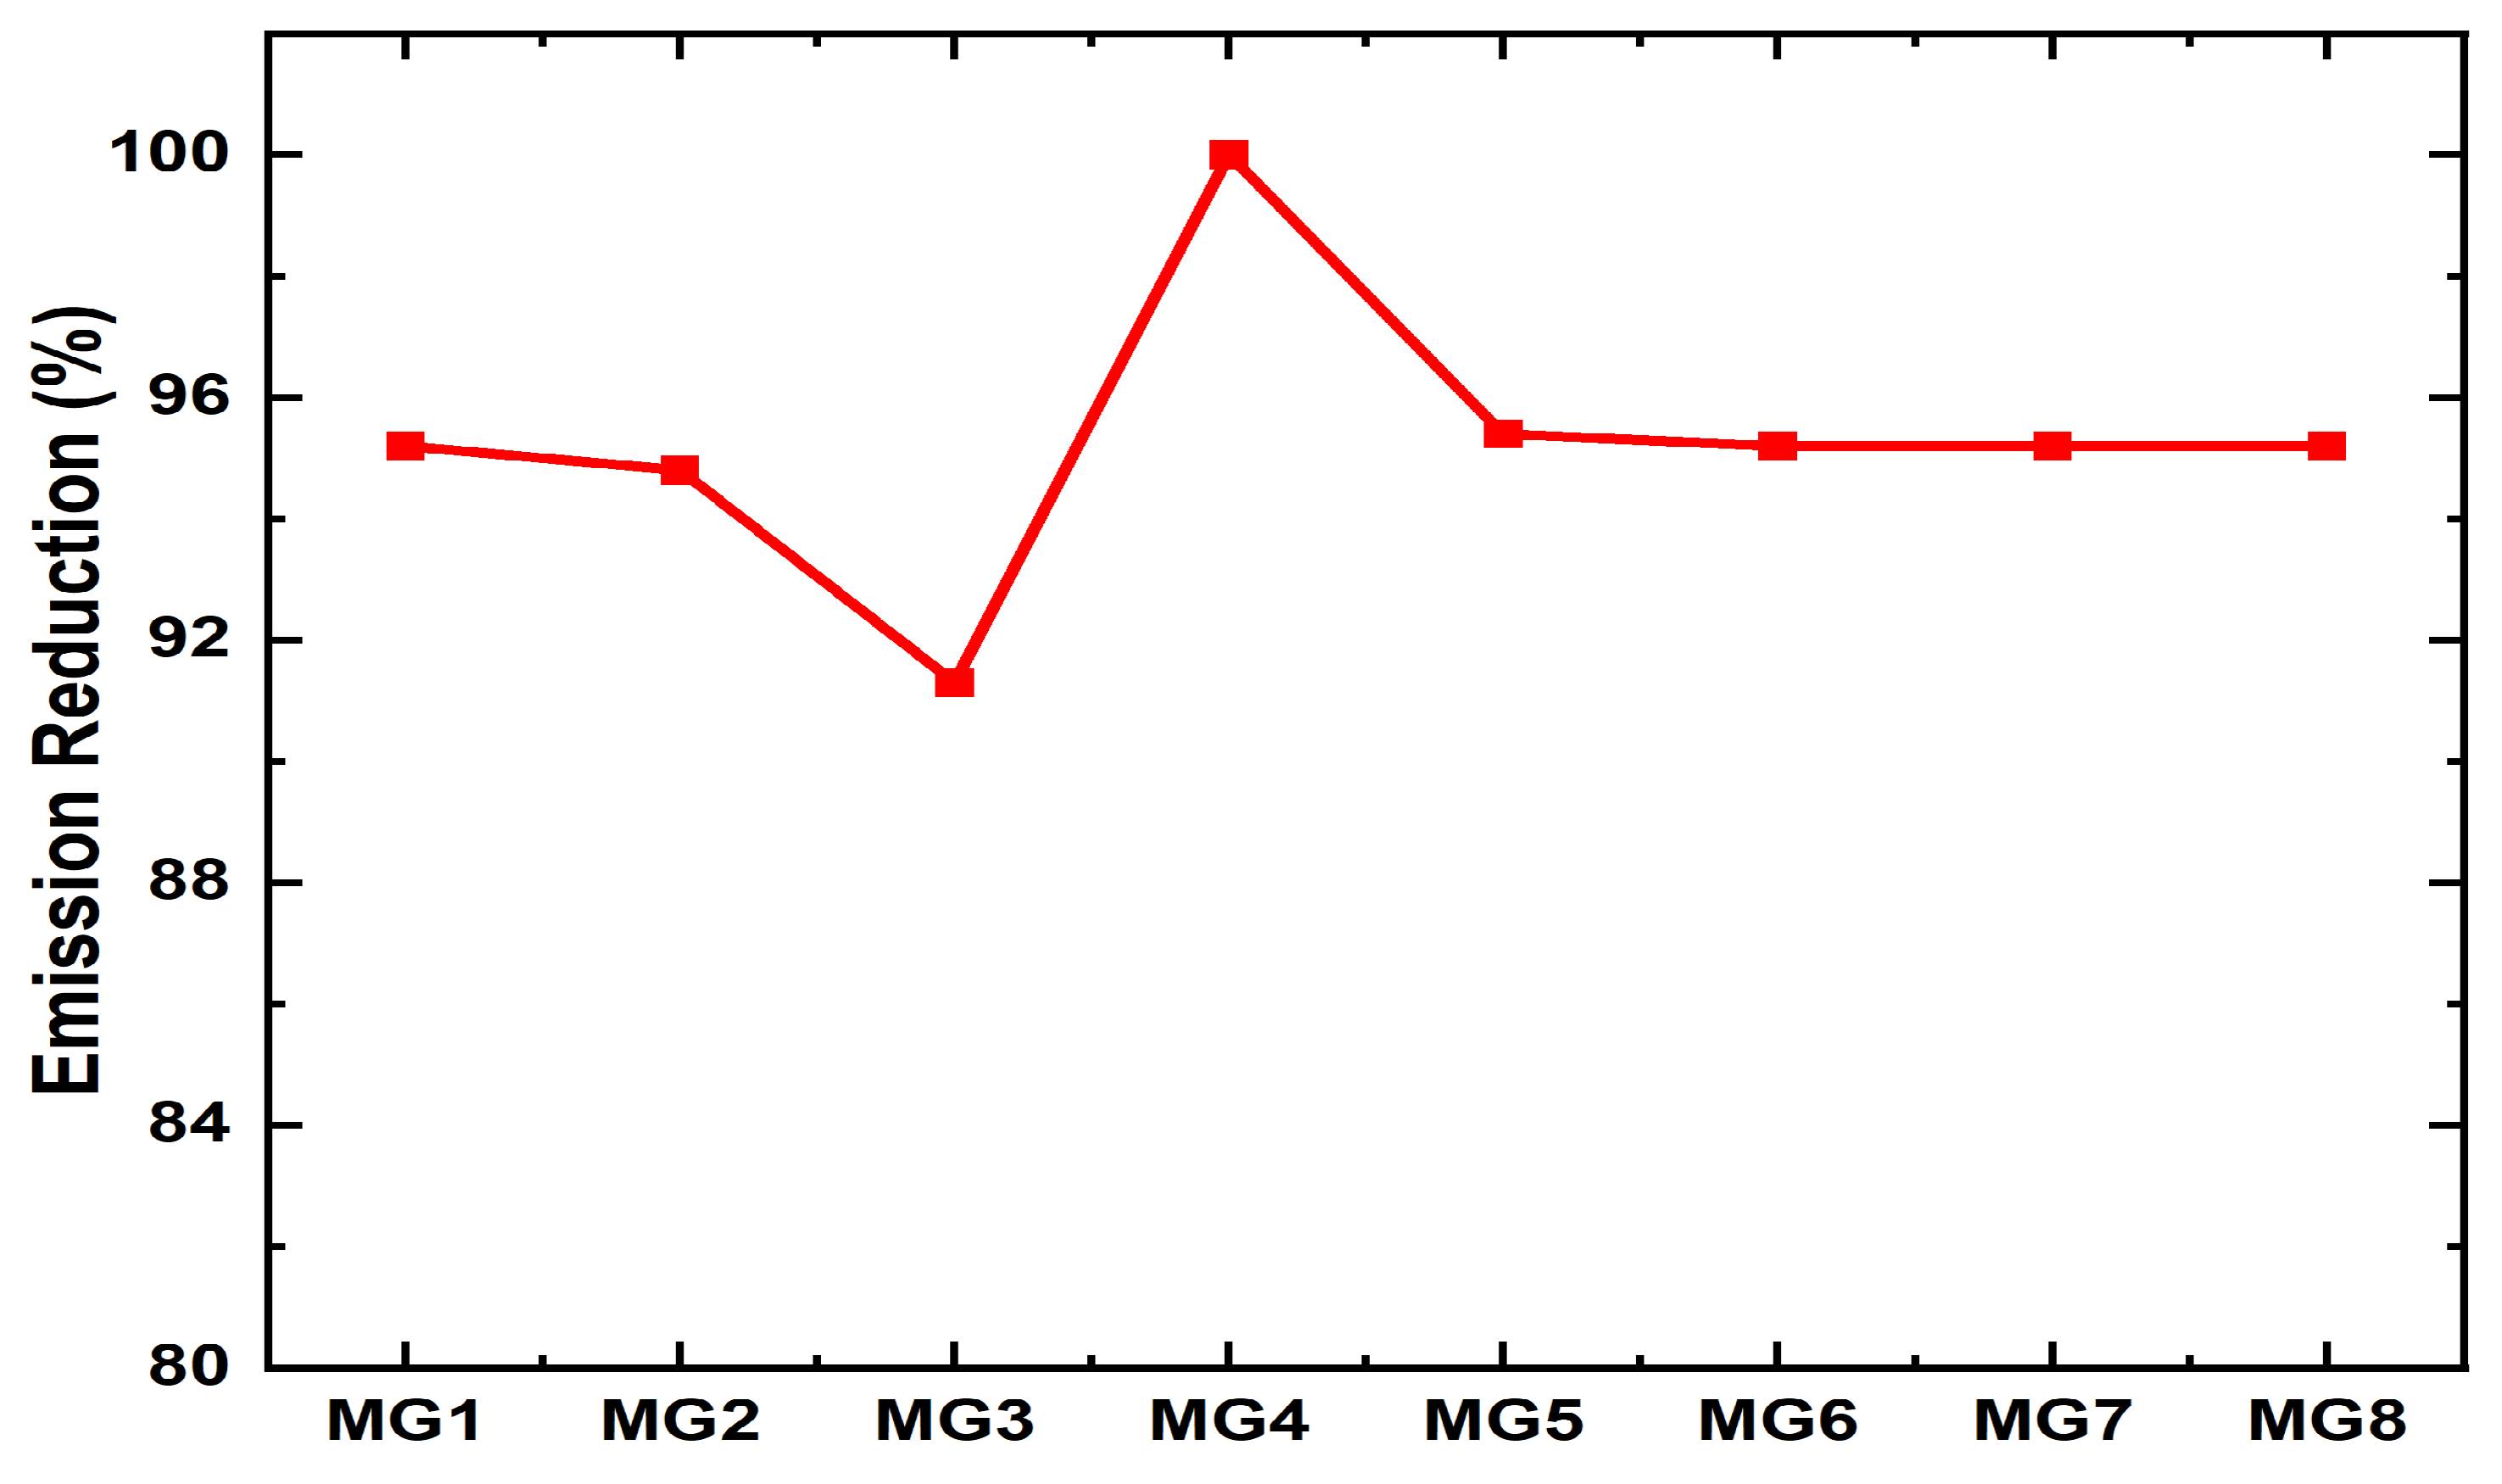
The environmental analyses in this section are based on the operational outcomes of the DRL-based coordination framework. Carbon emissions are evaluated for both the conventional grid-supplied system and each MG configuration operating under its original, non-coordinated dispatch strategy. These reference scenarios serve as the baseline for emission assessment. Using identical emission factors, total emissions are then calculated for both the baseline and the optimized coordinated scenarios to ensure consistency in comparison. The resulting emission reductions reflect the environmental gains achieved through coordinated operation, greater utilization of renewable energy, and reduced reliance on grid electricity and diesel-based generation. Comparing the proposed MG configurations to traditional grid systems, the emission reduction (ER) analysis shows a revolutionary environmental performance. With ER values ranging from 91.47% (MG3) to a full 100% (MG4), these systems show that the local energy supply is almost entirely decarbonized. All other combinations (MG1, MG2, MG5, MG6, MG7, and MG8) continuously show ER percentages above 94%, demonstrating the optimized hybrid designs’ strong capacity to reduce emissions. This demonstration emphasizes how vital advanced MGs are to deep decarbonization ambitions as it sharply contrasts with present grid practice, which relies heavily on carbon-intensive generation. The findings illustrate the gains of MG systems as a basic strategy to provide sustainable, low-carbon energy infrastructure. The percentage % emission reductions at each site are shown in
Figure 19.



 ,
,