Abstract
The Kubuqi Desert represents a key ecologically fragile region in northern China, primarily functioning as a windbreak and sand-fixation barrier while also contributing to regional ecological balance. However, the area’s ecological vulnerability is pronounced, and investigating the spatiotemporal dynamics of vegetation carbon storage and associated driving mechanisms is essential for the scientific formulation of ecological restoration strategies. This research incorporates multi-source remote-sensing datasets (including Landsat 8 OLI/TIRS Level 2, Sentinel-1 Synthetic Aperture Radar (SAR), ERA5 daily meteorological data, GEDI Level 4B, SRTM GL1 v003, and ESA WorldCover v100) based on the Google Earth Engine (GEE) platform, and employs multiple machine-learning algorithms (validation metrics of the machine learning model: = 0.917, RMSE = 0.251) to develop a dynamic monitoring model of vegetation carbon storage in the Kubuqi Desert during the period 2019–2023. The analysis systematically evaluates the influence of climatic variables and anthropogenic activities on the spatiotemporal differentiation of carbon storage. The results indicate a slight upward trend in overall carbon storage across the study area (average annual increase of 0.4%), with high values predominantly concentrated in vegetated regions (up to 5.22 Mg/Ha) and low values distributed in bare lands and desert zones (0.5–0.7 Mg/Ha). Altitude, temperature, and slope serve as the primary driving factors governing carbon-storage variability. The findings suggest that scientifically guided vegetation restoration and optimized water-resource management can enhance the carbon-sink capacity of the Kubuqi Desert, offering a robust scientific basis for ecological governance and carbon budget assessment in arid and semi-arid desert ecosystems.
1. Introduction
Situated in the northern Ordos Plateau within the Inner Mongolia Autonomous Region of China, the Kubuqi Desert covers approximately 18,600 km2, ranking as the nation’s seventh largest desert. Characterized by an arid climate and a highly sensitive ecosystem, its ecosystem is highly sensitive and vulnerable to human disturbances [1]. In recent years, large-scale sand control projects have significantly altered the surface cover patterns of the desert; however, their impacts on carbon storage have yet to be systematically quantified [2]. This study aims to reveal the spatiotemporal evolution of carbon storage in the Kubuqi Desert by utilizing multi-source remote-sensing data and machine-learning algorithms, evaluating the driving mechanisms of climatic and anthropogenic factors, and providing a scientific foundation for carbon management in desert ecosystems [3].
As one of the major deserts in northern China, ecological and carbon storage changes in the Kubuqi Desert are not only closely linked to global climate change but are also jointly influenced by regional anthropogenic activities and natural processes [4]. As a critical area of global desertification, the ecological transformation and carbon dynamics of the Kubuqi Desert are of considerable significance for understanding ecological security in China and across Asia [5]. In recent years, amid global climate-change intensification and human-activity escalation, the stability of desert ecosystems has come under increasing threat, and the Kubuqi Desert is no exception [6]. Investigating carbon-storage changes, their spatiotemporal distribution and influencing factors in this region can offer vital theoretical and practical guidance for addressing ecological challenges associated with desertification and climate change [7]. Variations in carbon storage in desert areas are strongly associated with vegetation cover, soil properties, climate variability, and water-resource availability [8]. Ongoing climate warming, altered precipitation patterns, and intensifying human activity have led to pronounced fluctuations in carbon storage across desert regions [9]. Although vegetation coverage and soil organic-carbon reserves are relatively limited in the Kubuqi Desert, ecological greening initiatives have gradually enhanced carbon-sink functions in certain areas [10]. Carbon sequestration is significantly supported by forest and grassland ecosystems, by contrast, in desertified regions, this function is constrained by harsh climatic conditions and poor soil fertility [11]. Furthermore, extreme weather events induced by climate change—such as droughts, heatwaves, and strong winds—further exacerbate ecological fragility, impeding vegetation growth and carbon accumulation [12].
Prior studies investigating carbon storage in the Kubuqi Desert have predominantly centered on short-term dynamic changes or relied on single-source remote-sensing data (e.g., Landsat imagery alone) [13,14]. These works lack integration of multi-source data and long-term (5-year) continuous-monitoring capabilities. Furthermore, existing literature rarely quantifies the relative contribution of topographic factors (e.g., slope, altitude) to carbon-storage variations, which imposes limitations on the in-depth understanding of terrain-induced spatial heterogeneity in carbon-storage distribution. To more effectively monitor and evaluate the carbon storage’s spatiotemporal variations in the Kubuqi Desert, this research employs remote-sensing datasets of multiple sources in conjunction with machine-learning techniques for in-depth analysis [15]. Remote-sensing technologies provide efficient and comprehensive surface information, which is particularly advantageous in inaccessible desert regions [16]. Leveraging the capabilities of the Google Earth Engine (GEE) platform, which integrates powerful data-processing and cloud-computing tools, data from diverse remote-sensing platforms—including Landsat (Land Remote-Sensing Satellite), Sentinel (Copernicus Sentinel-1 Satellite), MODIS (Moderate Resolution Imaging Spectroradiometer), and SRTM (Shuttle Radar Topography Mission)—can be effectively processed to extract surface features associated with carbon-storage variation [17]. These datasets include vegetation indices, soil moisture, temperature fluctuations, and precipitation metrics, all of which are critical to monitoring carbon storage in arid environments. During the data processing and analysis stages, machine-learning algorithms were applied to integrate multi-source remote-sensing information, extract key ecological and environmental parameters within the Kubuqi Desert, and construct a model of carbon-storage spatiotemporal change [18]. Machine-learning techniques are particularly advantageous for handling complex nonlinear relationships and multidimensional datasets, significantly improving model prediction accuracy and adaptability—especially in the context of complex geographical environments [19]. Through model development and validation, this study further explores how climate change, human activity, and other factors drive carbon-storage changes in the Kubuqi Desert and assesses their implications for the regional carbon cycle [20].
This research also incorporates spatiotemporal analysis to identify key drivers of carbon-storage variation in the Kubuqi Desert, with particular attention to factors such as altitude, temperature, precipitation, wind speed, and land-use types [21]. Multivariate analysis is conducted to evaluate the relative contributions of these variables to carbon-storage dynamics in desert regions, offering scientific support for regional carbon-sink management strategies [22]. To analyze the enhancement of carbon storage and carbon-sink capacity in desert ecosystems, the study follows three key steps: (1) Quantify the spatiotemporal dynamics of carbon storage in the Kubuqi Desert from 2019 to 2023 using multi-source remote-sensing data and machine-learning models; (2) Identify the dominant driving factors (climatic, topographic, and anthropogenic) affecting carbon storage through variable importance analysis; (3) Evaluate the effectiveness of ecological restoration measures (e.g., afforestation, sand fixation) in improving carbon sequestration, thereby providing scientific support for reducing greenhouse gas emissions and strengthening desert carbon sinks [23]. The analysis is conducted at a spatial resolution of 500 m, drawing from key satellite datasets including Landsat, Sentinel, MODIS, ERA5 (ECMWF Reanalysis v5), and SRTM. Through spatial and temporal analysis of these datasets, carbon-storage trends in the Kubuqi Desert from 2019 to 2023 were systematically assessed. These results were then analyzed in conjunction with environmental and policy variables to identify underlying driving mechanisms [24]. The findings supply a reliable scientific foundation for designing policies on ecological protection and carbon management in the Kubuqi Desert and aid in attaining regional carbon-neutrality objectives [25].
2. Study Area
Lying at the western part of the Inner Mongolia Autonomous Region in China, with geographical coordinates of 39°55′∼41°30′ N and 105°15′∼107°50′ E, the Kubuqi Desert (Figure 1) spans multiple administrative regions such as Urat Front Banner and Ordos City, with an area of approximately 48,000 square kilometers, being one of the four major deserts in China. The average altitude of the study area is about 1000 m, with an altitude of 1000∼1400 m, and the altitude of local areas can reach more than 1500 m. The terrain has large undulations, and the landform is composed of alternating sand dunes, gobi, and grassland, forming a typical desert ecological environment [26]. The natural environment and climatic conditions of the Kubuqi Desert are affected by a representative continental climate, distinguished by drought, strong wind, sand, and large temperature differences [27].
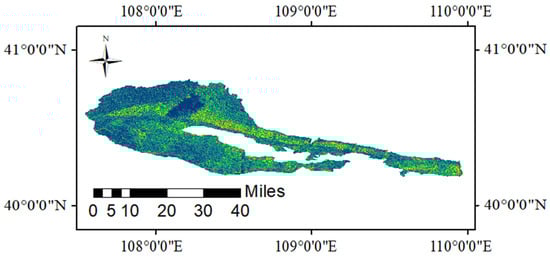
Figure 1.
Geographical location of the study area.
The mean annual temperature in the study area is 8 °C, and the coldest month (January) can be as low as about −20 °C. The annual precipitation is low, with a mean precipitation of 150~300 mm, and the precipitation is mainly concentrated in summer, with the precipitation from June to September constituting more than 70% of the yearly precipitation. The precipitation distribution is uneven, with low precipitation in local areas, and even zero in some years. Due to its inland location, the Kubuqi Desert has a dry climate and frequent strong-wind weather, especially in spring and autumn, sandstorm phenomena are common [28]. The climate is extremely arid and lacks water resources, with the evaporation capacity far exceeding the precipitation, and the annual evaporation capacity can reach more than 1000 mm.
The ecosystem of the Kubuqi Desert is dominated by desert and semi-desert vegetation, with typical vegetation types including sandy grassland, drought-tolerant shrubs, and occasionally distributed tree communities [29]. The plant species are relatively limited, mainly drought-tolerant and wind-resistant herbaceous plants and shrubs, such as Elaeagnus angustifolia, Haloxylon ammodendron, Ammopiptanthus mongolicus [30]. Affected by human activities and the advancement of certain ecological restoration initiatives, the local vegetation condition has witnessed a gradual improvement. The carbon-storage capacity of desert ecosystems primarily derives from the carbon sequestration of soil and vegetation, while the increment in soil organic-carbon storage constitutes one of the key research priorities in the current academic context [31]. The combined effects of climatic characteristics, vegetation distribution patterns, and human-activity dynamics in the Kubuqi Desert region collectively drive changes in its carbon storage. Key factors including climate variability, land-use transformation, and anthropogenic greening initiatives exert significant influences on the carbon-storage capacity and carbon-cycling processes of the Kubuqi Desert [32]. Owing to the distinctive specific climatic conditions and geographical location, the study area has formed a typical arid ecosystem, which is suitable for studying climate change and carbon-storage changes [33]. With the advancement of desertification control projects and the increase in greening coverage, the carbon-sequestration capacity of the Kubuqi Desert has been gradually enhanced, and its impact on global climate change has been increasingly concerned [5].
Under the natural conditions of this region, this study will combine remote-sensing data and advanced machine-learning methods to analyze the spatiotemporal dynamics of carbon storage in the Kubuqi Desert and its main influencing factors [34]. By conducting a comprehensive analysis of regional climatic, soil, vegetation, and other environmental elements, the effects of climate variability and anthropogenic activities on carbon-sequestration capacity in the Kubuqi Desert will be explored in depth, thereby providing a scientific reference for ecological restoration initiatives and desert carbon-pool management [35].
3. Materials and Methods
3.1. Data Sources, Preprocessing, and Feature Extraction
To conduct a comprehensive analysis of the spatiotemporal dynamics of carbon storage in the Kubuqi Desert, this research selected multi-source remote-sensing datasets (Table 1), including Landsat images, Sentinel-1 radar data, ERA5 meteorological data, SRTM terrain data, and other relevant data provided by the GEE platform [36]. These data provide a solid foundation for carbon-storage change analysis.

Table 1.
Description of multi-source remote-sensing datasets used in this study, including data version, core content, and spatial resolution.
(1) Landsat 8 Data: This study used Landsat 8 data, which provides multi-spectral surface reflectance information with a spatial resolution of 30 m. The Landsat 8 dataset has undergone radiometric correction, geometric correction, and atmospheric correction to ensure data quality and consistency [37]. The data are sourced from the Landsat 8 satellite imagery, which is jointly administered by the United States Geological Survey (USGS) and the National Aeronautics and Space Administration (NASA) [38], and images from 2019 to 2023 were selected. The dataset includes multiple bands (Band 1 to Band 7), and appropriate images were selected according to the seasons to ensure that the images are cloud-free or have a cloud cover of less than 2%.
(2) Sentinel-1 Data: Sentinel-1 data adopted the GRD (Ground Range Detected) product, which is provided by the European Space Agency (ESA, Paris, France), has a high spatial resolution (40 m × 40 m) and is applicable to monitoring in cloud-covered zones. Sentinel-1 provides synthetic aperture radar (SAR) data, which can penetrate clouds to obtain surface information [39]. In this study, SAR data from 2019 to 2023 were selected for analyzing surface changes, vegetation coverage, surface roughness, and other parameters in desert areas.
(3) ERA5 Meteorological Data: This study used the ERA5 meteorological dataset, which provides monthly average values of meteorological elements such as temperature, precipitation, wind speed, and humidity. The ERA5 dataset is sourced from the European Centre for Medium-Range Weather Forecasts (ECMWF) and can provide climatic factor support for the analysis of spatiotemporal changes in carbon storage [40]. Meteorological data help researchers understand how climatic factors affect vegetation growth and carbon-storage changes in desert areas.
(4) SRTM Terrain Data: The study also adopted the SRTM dataset from NASA (National Aeronautics and Space Administration, Washington, DC, USA), which provides global terrain elevation information with a spatial resolution of 30 m. Through these terrain data, the impact of elevation changes in desert areas on carbon storage can be analyzed, especially the differences in the spatiotemporal distribution of carbon storage under different topographic features [41].
On the GEE platform, multi-source remote-sensing data were first fused and processed. Landsat and Sentinel-1 data provide rich optical and radar information, ERA5 meteorological data provide climatic variables, and SRTM terrain data provide topographic features. These data were synchronously processed and cropped through the GEE platform, and after unifying the coordinate system, feature extraction was carried out [42]. Features such as vegetation indices (such as NDVI, EVI, etc.), water indices, soil moisture, and vegetation coverage were extracted from remote-sensing images, which provided input data for subsequent carbon-storage estimation and spatiotemporal-change analysis [43].
3.2. Machine Learning Algorithms
For the accurate prediction of spatiotemporal variations in carbon storage within the Kubuqi Desert area, this study utilized a range of machine-learning algorithms. These algorithms are widely used in processing and monitoring remote-sensing and environmental data and can effectively capture the nonlinear relationships in remote-sensing data [44].
The dataset was split into a training set (70%) and a validation set (30%). The features extracted from remote-sensing data and meteorological variables were used as input variables, and carbon-storage data were used as target variables [45]. Representative samples were selected from areas with different terrains, climates, and vegetation coverage types through random sampling methods to ensure the diversity and representativeness of the training data. In the training process, the GEE platform was first used for data preprocessing, including image cropping, cloud detection, and removal of invalid pixels [46]. Then, machine-learning algorithms such as random forest, support vector machine, and gradient boosting tree were used to train the model, and the hyperparameters of each model (such as the number of trees, maximum depth, minimum sample splitting.) were optimized [47]. The model performance was assessed via cross-validation to select the optimal one, which was then used to predict the validation set for accuracy and predictive ability evaluation [48]. The accuracy of the model was verified through indicators such as the coefficient of determination (), root mean square error (RMSE), and mean absolute error (MAE).
3.3. Carbon-Storage Estimation
After completing the training and validation of the machine-learning model, the study used the predicted biomass data for carbon-storage estimation. Carbon storage is calculated through the relationship between biomass and carbon content, and a conversion coefficient between biomass and carbon storage is usually used [49]. According to the literature and actual measurements, a common conversion coefficient is 0.5, that is, half of the biomass is assumed to be carbon storage [50]. In this study, the predicted biomass values were first used, and then multiplied by the conversion coefficient (0.5) to obtain the carbon storage of each study area and each time point.
The calculation formula for carbon storage is as follows:
where C represents carbon storage (tons/hectare), and B represents biomass (tons/hectare). This calculation formula was applied to each pixel across the entire study region, yielding the regional carbon-storage distribution.
Due to the existence of certain remote-sensing data gaps in the Kubuqi Desert area, especially in areas with extreme climatic conditions or poor image quality, it may affect the results of carbon-storage estimation [20]. When calculating carbon storage, this study used interpolation technology to fill the missing data for areas with missing or incomplete data. The specific method was to use spatial interpolation (such as Kriging interpolation) or weighted average method based on adjacent pixels to estimate the carbon storage of the missing area [21].
Considering the complexity of the ecological environment in desert areas, this study also conducted key analyses on areas with extreme terrain and special climatic conditions to ensure that the carbon storage estimation results in these special areas can reflect the actual carbon-storage capacity of the area [22]. In these areas, the accuracy of carbon-storage calculation was further improved by adjusting model parameters and algorithm optimization [23]. The carbon-storage estimation results of all areas were displayed in the form of thematic maps, and a complete spatiotemporal distribution map was formed by superimposing data with different time and spatial resolutions [24]. These thematic maps provided a visualization tool for further analyzing the change trend of carbon storage in the Kubuqi Desert area.
3.4. Spatiotemporal Change Analysis
One of the core objectives of this study is to analyze the spatiotemporal-change trend of carbon storage in the Kubuqi Desert area. In order to accurately capture the characteristics of carbon-storage changes over time, a time-series analysis method was used to discuss the dynamic changes of carbon storage in the Kubuqi Desert area through the comparison of carbon-storage data under different years, seasons, and climatic conditions [51]. This study conducted a year-by-year analysis of the carbon-storage data from 2019 to 2023, and combined with the remote-sensing image data of different seasons, analyzed the variations of carbon reserves across distinct seasons. During this process, considering the impact of seasonal climate fluctuations in desert areas on vegetation growth, the precipitation, temperature, wind speed, and other variables provided in the ERA5 meteorological data were used to discuss the impact of climatic factors on carbon storage [52]. It was finally found that in the drought period of some years, the carbon storage decreased significantly, while in the years with sufficient precipitation, the carbon storage increased significantly [14]. The Processing Flow Chart is illustrated in Figure 2.
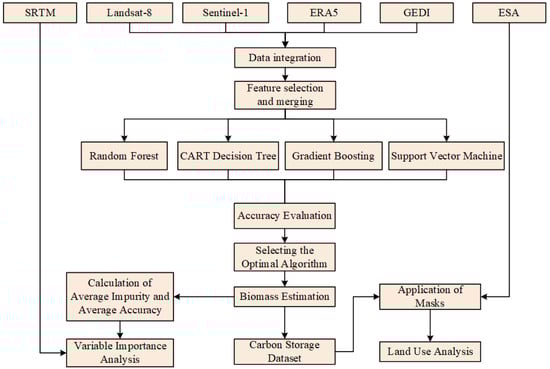
Figure 2.
Processing Flow Chart.
This study combined the spatial distribution characteristics of carbon storage in different land use types for analysis [32]. By comparing the carbon-storage changes of various land use types, the impact of different surface types on carbon storage was analyzed. For example, ecological types such as grassland and shrubbery have higher carbon storage, while carbon storage in desert bare land and desertified areas is relatively low. To further explore the spatiotemporal fluctuations of carbon storage, this study also predicted the changing trend of carbon reserves in future climate-change scenarios by means of a climate model [53]. Using the climate-prediction data on the GEE platform, combined with the prediction results of the machine-learning model, the potential change trend of carbon storage in the Kubuqi Desert region in the next few decades was analyzed to provide a reference for ecological protection and carbon-management policies.
3.5. Result Validation and Accuracy Evaluation
In order to ensure the accuracy and reliability of the carbon-storage estimation results, this study used a variety of verification methods to evaluate the model. The carbon-storage values predicted by the model were verified through field survey data. In some areas of the Kubuqi Desert, plot surveys were carried out, representative biomass data were collected, and compared with the model prediction results. The prediction accuracy of the model was evaluated through this comparison, and necessary adjustments were made to improve the accuracy of carbon-storage estimation [54].
Existing literature data and officially released carbon-storage estimation results were used for verification. For example, the model results were cross-validated by referring to the carbon-storage reports and related academic studies in the region. By comparing these known estimated values with the results of this study, the reliability of the model was further verified. In terms of accuracy evaluation, multiple common accuracy evaluation indicators were used, including the coefficient of determination (), root mean square error (RMSE), mean absolute error (MAE), relative prediction deviation (RPD), and mean absolute percentage error (MAPE). The coefficient of determination () is used to evaluate the fitting degree between the model prediction value and the measured value, RMSE, MAPE and MAE are used to measure the deviation between the model prediction value and the actual observation value, the Ratio of Performance to Deviation (RPD) assesses the model’s overall predictive reliability. By calculating these indicators, the accuracy of the model can be quantitatively analyzed, and the model can be optimized accordingly.
Considering that the different spatial and temporal resolutions of remote-sensing data may cause certain errors in carbon-storage estimation, during model training and validation, data of different resolutions were used for comparison, and the impact of spatial resolution on carbon-storage estimation results was analyzed [55]. By comparing the model-prediction results of different resolution data, the robustness and adaptability of the model were further evaluated.
3.6. Data Visualization and Application
In order to better display the research results of spatiotemporal changes in carbon storage, this study used the GEE platform for data-visualization processing. By drawing thematic maps of carbon-storage data in different years and different time periods, the spatial distribution and change trend of carbon storage in the Kubuqi Desert area were intuitively displayed [56]. These thematic maps not only help reveal the spatiotemporal dynamics of carbon storage but also provide a convenient analysis tool for researchers.
In addition to thematic maps, this study also generated multiple interactive maps to facilitate users to select specific areas for viewing according to their interests. Through these interactive maps, users can deeply understand the carbon storage changes in different areas of the Kubuqi Desert, providing data support for environmental protection, land use planning, and ecological restoration. The study also generated a variety of reports and statistical analyses based on the change trend of carbon storage, further explaining the causes of carbon storage changes and their significance for environmental management policies. These reports cover the total amount estimation of regional carbon storage, change trend analysis, and analysis results of the impact of climatic factors on carbon storage.
Through these detailed analysis reports, more scientific decision-making bases can be provided for policymakers, and the development of regional carbon management and ecological protection work can be promoted [57]. Through in-depth analysis of spatiotemporal changes and data visualization, the results of this study offer a crucial basis for the long-term monitoring of carbon sequestration capacity in the Kubuqi Desert region and provide scientific support for the formulation of ecological protection and climate-change response policies.
4. Results
4.1. Machine Learning Model Results
In the estimation of carbon storage in the Kubuqi Desert, multiple machine-learning algorithms were used for predictive analysis, including Random Forest (RF), Classification and Regression Trees (CART), Gradient Boosting (GB), and Support Vector Machine (SVM). Through repeated trials and adjustments of key model parameters, the optimal parameter settings were ultimately determined, followed by sufficient testing and validation on the training set and validation set. Detailed analyses of results for each algorithm are presented below.
4.1.1. Random Forest Algorithm Model
Classified under the category of ensemble learning methods, the Random Forest algorithm builds multiple decision trees and implements a voting mechanism, which can effectively mitigate the risk of overfitting and exhibits excellent generalization ability. In this study, the Random Forest algorithm was applied to predict the carbon storage in the Kubuqi Desert based on the Google Earth Engine (GEE) platform.
During the model training process, key parameters of the Random Forest model were first optimized. After repeated trials, the optimal parameter settings were confirmed as follows: the number of decision trees was set to 100, the maximum number of nodes per tree to 15, the minimum number of samples per leaf node to 8, and the feature subsample size to 3; meanwhile, a node splitting strategy based on optimal gain was adopted. Using these parameters, an aboveground biomass prediction model was constructed and validated on the training set and validation set.
For the training set results, subfigure (a) in Figure A1 illustrates the association between the forecasted values (y) and measured values (x). The linear regression equation derived is y = 0.6656x + 1.2053, indicating a significant linear correlation between the model’s forecasted values and the measured values. The coefficient of determination () is 0.8175, demonstrating that the model achieves a good fitting effect on the training set data and can explain approximately 81.75% of the data variability. The root mean square error (RMSE) is 0.378, reflecting a small prediction error of the model on the training set and thus high prediction accuracy. The mean absolute error (MAE) is 0.272, indicating that the average prediction error of the model is approximately 0.272 units. The relative prediction deviation (RPD) is 1.980, which further confirms the small relative prediction error of the model and its strong predictive performance. Additionally, the mean absolute percentage error (MAPE) is 9.187, providing further verification of the model’s excellent fitting effect on the training set.
Regarding the validation set outcomes, subfigure (b) in Figure A1 illustrates the association between the measured values (y) and forecasted values (x); the linear regression equation derived is y = 1.2215x − 0.8863, indicating a significant linear correlation between the measured values and the model’s forecasted values. The coefficient of determination () is 0.8666, demonstrating that the model still achieves a good fitting effect on the validation set data and can explain approximately 86.66% of the data variability; the root mean square error (RMSE) is 0.363, reflecting that the model’s prediction error on the validation set is slightly lower than that of the training set while remaining within a reasonable range, thus maintaining high prediction accuracy. The mean absolute error (MAE) is 0.272, indicating that the average prediction error of the model is approximately 0.272 units; the relative prediction deviation (RPD) is 2.256, which further confirms that the model exhibits relatively strong predictive performance on the validation set; additionally, the mean absolute percentage error (MAPE) is 9.372, providing further verification of the model’s reasonable prediction deviation and stable fitting effect on the validation set.
In general, the random forest model shows strong fitting ability and prediction accuracy on both the training set and the validation set, especially on the validation set, the model can better explain the variability of carbon storage.
4.1.2. CART Decision Tree Algorithm Model
The CART decision tree algorithm is a classic classification and regression model, which is widely used in various prediction tasks. In this project, the CART decision tree algorithm was used to predict the carbon storage in the Kubuqi Desert area. In the training process of the CART model, through multiple trials and parameter adjustments, the number of decision trees was finally determined to be 100, the maximum number of nodes per tree was 100, the minimum number of samples per leaf node was 10, the feature subsample size was 3, and the node splitting strategy based on optimal gain was adopted. We obtained the aboveground biomass prediction model for the training set and validation set.
In the model results of the training set, subfigure (a) in Figure A2 shows the association between the predicted value (y) and the observed value (x). Through the linear regression equation, y = 0.7342x + 0.8291, it can be seen that there is a strong linear association between the predicted value and the observed value of the model. The coefficient of determination () is 0.6607, indicating that the model can explain about 66.07% of the variability of the training set data. The root mean square error (RMSE) is 0.441, indicating that the prediction error of the model on the training set is relatively low. The mean absolute error (MAE) is 0.221, indicating that the prediction error of the model is 0.221 units, which is relatively accurate. The relative prediction deviation (RPD) is 1.696, showing that the prediction accuracy of the model is relatively low. The mean absolute percentage error (MAPE) is 7.110, indicating that the error of the model on the training set is relatively large but still within an acceptable range.
In the results of the validation set, subfigure (b) in Figure A2 shows the association between the observed value (y) and the predicted value (x). The linear regression equation is y = 0.9886x + 0.0368, indicating that there is a strong linear association between the observed value and the predicted value. The coefficient of determination () is 0.794, indicating that the model has a good fitting effect on the validation set and can explain about 79.4% of the variability. The root mean square error (RMSE) is 0.371, indicating that the prediction error of the validation set is slightly higher than that of the training set. The mean absolute error (MAE) is 0.198, showing that the error of the model on the validation set is 30.90 units. The relative prediction deviation (RPD) is 2.202, indicating that the model has relatively strong prediction ability on the validation set. The mean absolute percentage error (MAPE) is 6.501, showing that the error of the validation set is small and has a good fitting effect. By comparison, the CART decision tree algorithm shows good prediction performance on both the training set and the validation set. Although its error on the training set is slightly higher than that of the random forest, it can still effectively predict carbon storage.
4.1.3. Gradient Boosting Algorithm Model
The Gradient Boosting algorithm is an ensemble learning method that improves prediction accuracy by gradually optimizing the model. In this project, the gradient boosting algorithm was used to predict the carbon storage in the Kubuqi Desert area, and the key parameters of the model were adjusted. In the training process of the gradient boosting algorithm, after multiple trials, the number of decision trees was finally determined to be 50, the maximum number of nodes per tree was 50, the minimum number of samples per leaf node was 10, the learning rate was 0.1, and the sampling rate was 0.8. Through these settings, we obtained the aboveground biomass prediction model for the training set and validation set.
In the results of the training set, subfigure (a) in Figure A3 shows the association between the predicted value (y) and the observed value (x). Through the linear regression equation, y = 0.8876x + 0.4501, it shows that there is a strong linear association between the predicted value and the observed value. The coefficient of determination () is 0.881, indicating that the model has a very good fitting effect on the training set data and can explain about 88.1% of the variability. The root mean square error (RMSE) is 0.276, indicating that the prediction error of the model on the training set is small. The mean absolute error (MAE) is 0.168, showing that the prediction error of the model is 0.168 units, showing high accuracy. The relative prediction deviation (RPD) is 2.712, further verifying the excellent performance of the model. The mean absolute percentage error (MAPE) is 5.848, indicating that the error of the model on the training set fluctuates to a certain extent but is still within an acceptable range.
In the results of the validation set, subfigure (b) in Figure A3 shows the association between the observed value (y) and the predicted value (x). The linear regression equation is y = 1.0349x − 0.1986, indicating that there is a strong linear association between the observed value and the predicted value. The coefficient of determination () is 0.9177, indicating that the model also has a good fitting effect on the validation set and can explain about 91.77% of the variability. The root mean square error (RMSE) is 0.251, indicating that the prediction error of the model on the validation set is relatively low. The mean absolute error (MAE) is 0.161, showing that the error of the model on the validation set is 0.161 units. The relative prediction deviation (RPD) is 3.259, indicating that the model has strong prediction ability on the validation set. The mean absolute percentage error (MAPE) is 5.668, indicating that the error of the model on the validation set is small and the fitting effect is good.
The training set and validation set of the gradient-boosting algorithm have good fitting effects, and compared with other models, the gradient-boosting algorithm has a more significant advantage in fitting effect.
4.1.4. Support Vector Machine Algorithm Model
The Support Vector Machine (SVM) algorithm is a machine learning method commonly used in regression and classification problems, with strong robustness and generalization ability. In this project, the SVM algorithm was used to predict the carbon storage in the Kubuqi Desert area, and the optimal model performance was obtained by adjusting parameters such as the kernel function type and SVM type. In the training process of the SVM model, the kernel function type was finally determined to be “RBF”, the SVM type was “NU_SVR”, the cost parameter was 50, and the parameter was 0.6, and the aboveground biomass prediction model for the training set and validation set was obtained.
In the results of the training set, subfigure (a) in Figure A4 shows the association between the predicted value (y) and the observed value (x). The linear regression equation is y = 0.5472x + 1.4045, showing a linear association between the predicted value and the observed value. The coefficient of determination () is 0.4429, indicating that the model has a poor fitting effect on the training set and can explain about 44.29% of the variability. The root mean square error (RMSE) is 0.572, indicating that the prediction error of the model on the training set is relatively high. The mean absolute error (MAE) is 0.286, showing that the prediction error of the model is 0.286 units. The relative prediction deviation (RPD) is 1.310, indicating that the model has strong prediction ability on the training set. The mean absolute percentage error (MAPE) is 8.379. Although the error is large, it is still within an acceptable range.
In the results of the validation set, subfigure (b) in Figure A4 shows the association between the observed value (y) and the predicted value (x). The linear regression equation is y = 0.8579x + 0.5033, indicating that there is a certain linear association between the observed value and the predicted value. The coefficient of determination () is 0.4559, indicating that the model has a relatively poor fitting effect on the validation set and can explain about 45.59% of the variability. The root mean square error (RMSE) is 0.614, showing that the prediction error of the model on the validation set is high. The mean absolute error (MAE) is 0.334, indicating that the prediction error of the model is large. The relative prediction deviation (RPD) is 1.333, showing that the prediction accuracy of the model on the validation set is low. The MAPE is 9.710, showing that the validation error of the model is large. Although the SVM algorithm performs well when applied to the training set, its prediction effect on the validation set is slightly inferior, especially in terms of error.
4.1.5. Comparative Analysis of Machine-Learning Models
This research predicted the carbon storage in the Kubuqi Desert area through four machine-learning models, and conducted a detailed analysis of the results of each model. Through the result data in Table 2, the gradient boosting algorithm showed strong fitting ability and prediction ability in terms of and RMSE across the training and validation datasets alike, followed by random forest. The CART decision tree and support vector machine algorithms showed their own advantages and disadvantages on different training and validation sets.
Table 2.
Evaluation indicators of four machine-learning models on training and validation sets, including , RMSE, MAE, RPD, and MAPE.
4.2. Spatiotemporal Characteristics of Biomass and Carbon Storage
4.2.1. Analysis of Spatiotemporal Characteristics of Biomass
Biomass refers to the total mass of all organisms per unit area, which is usually used to measure the ecological productivity of an area and its response to climate change. The biomass change in the Kubuqi Desert area is affected by many variables, including climate fluctuations, soil conditions, and human activities. Especially in the context of vegetation and desert management, the change of biomass has obvious spatiotemporal characteristics.
Based on the analysis of remote-sensing monitoring data from 2019 to 2023 in Figure 3, the biomass change in the Kubuqi Desert showed different spatial distribution characteristics. The biomass growth areas are mainly concentrated in the vegetation areas, while the biomass reduction areas mainly appear in the bare land and desert areas. The biomass in the vegetation areas has increased significantly, especially in the vegetation areas and fixed sand areas, where the vegetation coverage has gradually increased and the biomass has significantly increased.
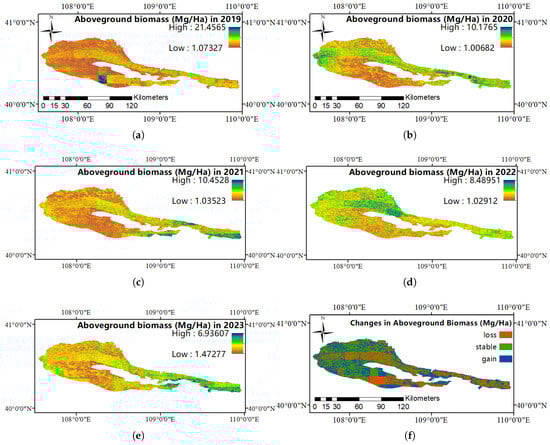
Figure 3.
Thematic map of biomass change spatiotemporal. (a) Aboveground biomass in 2019. (b) Aboveground biomass in 2020. (c) Aboveground biomass in 2021. (d) Aboveground biomass in 2022. (e) Aboveground biomass in 2023. (f) Changes in Aboveground biomass from 2019 to 2023.
(1) Biomass Growth in Vegetation Areas: Vegetation areas can effectively stabilize sand and reduce soil erosion by planting drought-tolerant plants, and absorb carbon dioxide through photosynthesis to accumulate a large amount of biomass. In addition, the expanded areas of fixed sand dunes show strong biomass growth, indicating that desert control measures have achieved remarkable results.
(2) Biomass Reduction in Bare Land and Desert Areas: Due to the lack of effective vegetation coverage in bare land and desert areas, wind erosion is serious, soil moisture conditions are poor, and vegetation growth is difficult, leading to a continuous decline in biomass. Bare land has almost no protective layer, wind and sand erosion are intensified, and biomass accumulation is very limited.
In terms of spatial distribution, the high-value areas of biomass are mainly concentrated in the vegetation and fixed sand areas, which have improved carbon absorption and water and soil conservation functions through desert management and ecological restoration measures. The low-value areas mainly appear in the bare land and desert areas, where biomass accumulation is very limited due to the long-term lack of water supply and vegetation.
In terms of time changes, from 2019 to 2021, the biomass showed an upward trend, especially the increase in precipitation was conducive to vegetation growth and promoted the increase in biomass. However, from 2021 to 2023, the biomass in some areas decreased, mainly affected by the decline in precipitation and the increment in wind speed, which led to the limited growth of vegetation in some areas and the decrease in biomass.
4.2.2. Analysis of Spatiotemporal Characteristics of Carbon Storage
Carbon storage, which is intimately associated with biomass, serves as a crucial indicator for assessing the regional ecological carbon sequestration capacity. The variation of carbon storage in the Kubuqi Desert is jointly influenced by natural factors and human activities. Notably, vegetation and desert management endeavors exert a significant impact on the dynamics of carbon storage.
Based on the carbon storage calculations derived from biomass shown in Figure 4, the carbon storage in the Kubuqi Desert region fluctuated between 2019 and 2023. Despite an overall upward trend, there exist significant disparities in carbon storage across different regions. The carbon storage in vegetated areas (particularly vegetation-dominated zones) exhibited an average annual increase of 1.2%, whereas the carbon storage in bare land and desert areas demonstrated a downward trend, with some areas experiencing an average annual decrease of 0.8%. This phenomenon is well reflected in Figure 5: the blue line representing the high-value of carbon storage initiates at 10.72 in 2019, declines to 5.08 in 2020, then rises slightly to 5.22 in 2021, and subsequently decreases year by year to 4.24 in 2022 and 3.40 in 2023. The orange line representing the low-value starts at 0.53 in 2019, shows minor fluctuations around the range of 0.5–0.51 from 2020 to 2022, and ascends to 0.73 in 2023. The movement of the high-value line reflects the alterations in carbon storage within areas with favorable ecological conditions, such as vegetation zones, while the low-value line mirrors the situation in bare and desert areas.
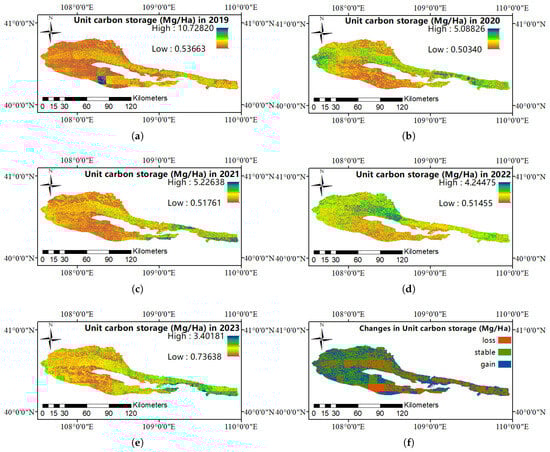
Figure 4.
Thematic map of carbon storage change spatiotemporal. (a) Unit carbon storage in 2019. (b) Unit carbon storage in 2020. (c) Unit carbon storage in 2021. (d) Unit carbon storage in 2022. (e) Unit carbon storage in 2023. (f) Changes in Unit carbon storage from 2019 to 2023.
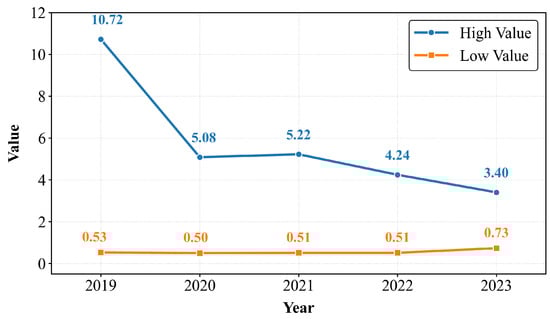
Figure 5.
Line chart showing the changes in high-value and low-value unit carbon storage (unit: Mg/Ha) in the Kubuqi Desert from 2019 to 2023.
In terms of spatial distribution, the high-value areas of carbon storage are primarily concentrated in vegetated areas, especially vegetation zones and fixed sand regions. These areas feature high vegetation coverage and strong carbon fixation capacity. Through measures like sand barrier construction, vegetation restoration, and soil and water conservation, the carbon storage capacity of the soil has been notably enhanced. The low-value areas are mainly distributed in bare land and desert regions, where carbon storage is relatively low. Wind erosion exacerbates the loss of soil carbon, making it difficult to effectively improve carbon storage. Based on grid-scale carbon storage change values, regions with decreased carbon storage are primarily distributed in bare lands and desert areas, where intensified wind erosion and soil erosion contribute to a gradual reduction in carbon storage. Conversely, areas with increased carbon storage are predominantly concentrated in vegetated zones and effectively managed regions, showing significant carbon sequestration growth.
In terms of temporal dynamics, carbon storage displayed an upward trend from 2019 to 2021. Driven by the increase in precipitation and the effects of vegetation, carbon storage increased significantly. This can be observed from the high-value line rising from 5.08 in 2020 to 5.22 in 2021, and the low-value line also showing a slight upward tendency. From 2021 to 2023, carbon storage in some areas decreased. This was mainly attributed to the reduction in precipitation, the increase in wind speed, and the aggravation of certain desertification risks. These factors constrained the accumulation of carbon storage, resulting in a decrease in carbon storage in some areas, as indicated by the high-value line declining from 5.22 in 2021 to 3.40 in 2023.
4.3. Changes in Land-Use Types and Carbon Storage Response
Based on Figure 6, the land-use types in the Kubuqi Desert area have changed significantly, especially in the distribution of vegetation areas, bare land, and desert areas. These changes directly affect the accumulation and release of regional carbon storage. The expansion of vegetation areas, the reduction of bare land area, and the stability of desert areas have all had a profound impact on carbon storage. These changes not only reflect the effect of ecological restoration projects but also indicate that human activities have an important role in the change of regional carbon storage.
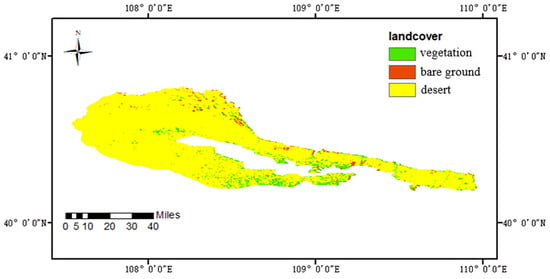
Figure 6.
Distribution map of main land-use types (vegetation, bare ground, desert) in the Kubuqi Desert study area.
4.3.1. Impact Mechanism of Land-Use Type Changes on Carbon Storage
Changes in land-use types directly affect the increase or decrease of carbon storage. Especially in arid and semi-arid areas, changes in carbon storage are usually closely related to vegetation coverage, vegetation types, and their biomass. The changes in carbon storage in the Kubuqi Desert area are mainly affected by the following factors:
- (1)
- Expansion of Vegetation Areas: With the expansion of vegetation areas, the vegetation coverage in the region has significantly increased. The growth of vegetation has improved soil quality, reduced wind erosion, and absorbed a large amount of carbon dioxide through photosynthesis, enhancing the carbon sequestration capacity. Especially the expansion of vegetation areas provides more carbon absorption sources, significantly improving carbon storage.
- (2)
- Increase in Soil Carbon Storage: With the vegetation and the reduction of bare land area, the soil organic-carbon storage has been significantly increased. Vegetation coverage helps to reduce the erosion of wind erosion and sandstorms on the soil, and at the same time increases the accumulation of soil organic matter, improving the carbon sequestration capacity.
- (3)
- Weakening of Wind Erosion: The reduction of bare land and the stabilization of desert areas have effectively reduced the negative impact of wind erosion on carbon storage. Wind erosion will not only lead to the loss of organic carbon materials but also take away the carbon on the earth’s surface, reducing carbon storage. The stability of vegetation and desert areas has improved the retention capacity of carbon storage.
4.3.2. Contribution Rate of Each Land-Use Type to Carbon Storage
According to the remote-sensing data and carbon-storage estimation results, the contribution of land-use type changes to the carbon-storage increment mainly comes from the expansion of vegetation areas and the reduction of bare land area, among which the expansion of vegetation areas has the greatest role in improving carbon storage. The contribution of different land-use types to carbon storage varies significantly, as follows:
- (1)
- Carbon-Storage Changes in Vegetation Areas
The vegetation area is a key component in desert management, and vegetation has significantly improved the regional carbon storage. With the increase in the area of vegetation areas, the carbon storage in the region has increased significantly. Studies have shown that the carbon storage in vegetation areas has increased by about 12.4%, which has played a decisive role in improving carbon storage. The restoration of vegetation not only increases carbon absorption but also enhances soil stability.
- (2)
- Carbon-Storage Changes in Bare Land
The reduction of bare land directly affects the change of carbon storage. The change of carbon storage in bare land areas is more complex. Although the area of bare land has decreased, due to the lack of sufficient vegetation, the change of carbon storage in bare land fluctuates greatly. The carbon storage in bare land has decreased mainly because bare land lacks vegetation for fixing carbon sources, and the organic carbon in the soil is easily eroded by wind, thus accelerating the loss of carbon.
- (3)
- Carbon-Storage Changes in Desert Areas
The improvement of the stability of desert areas has a long-term and slow impact on carbon storage. With the mitigation of desertification, wind erosion has been controlled, and the carbon storage in desert areas has remained stable. Although the increase in carbon storage in desert areas is small, it plays an important role in the stable storage of carbon.
Overall, the increase in carbon storage in the Kubuqi Desert area mainly comes from the expansion of vegetation areas and the reduction of bare land area. According to the remote-sensing data and carbon-storage estimation model, the expansion of vegetation areas contributes the most significantly, especially in the early-growth stage, vegetation accelerates the increase in carbon storage through rapid recovery and efficient carbon absorption. The reduction of bare land and desert areas helps to reduce wind erosion, but the recovery of carbon storage is slow, limited by vegetation and ecological environment adaptability.
4.3.3. Impact of Future Land-Use Changes on Carbon Storage
The land-use changes in the Kubuqi Desert area will have a profound impact on carbon storage. With the continuous advancement of ecological restoration work, especially in the vegetation area and the stability of desert areas, carbon storage is expected to continue to grow. However, the aggravation of climate change, the increase of extreme weather events, and the potential risk of desertification are still the key factors affecting the change of carbon storage. Therefore, future carbon-storage management needs to deal with the challenges brought by climate change and adopt flexible ecological restoration measures to ensure the stable growth of carbon storage.
4.4. Analysis of Influencing Factors
The factors affecting the spatiotemporal changes of carbon storage are relatively complex, including natural environmental and human-intervention variables. Based on the variable-importance analysis shown in Figure 7, the main influencing factors are ranked as follows: slope (30%), altitude (27%), temperature (11%), north–south wind speed (9%), east–west wind speed (9%), surface pressure (8%), and precipitation (6%).
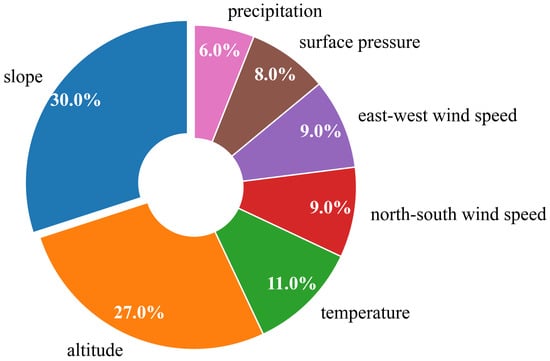
Figure 7.
Analysis diagram of the relative contribution rates of influencing factors to carbon-storage variation in the Kubuqi Desert, including slope, altitude, temperature, wind speed, surface pressure, and precipitation.
Among all influencing factors, slope exerts the most prominent regulatory effect on regional carbon storage, accounting for 30%. Steeper slopes are often not conducive to vegetation growth and carbon fixation, while areas with gentler slopes are more suitable for vegetation, so carbon storage is relatively high. Altitude factors account for 27%, showing a certain topographic control effect. In general, the vegetation-growth conditions in the middle altitude area are relatively optimal, and the carbon storage is relatively high, while the vegetation growth in the high altitude area is limited due to low temperature, and the carbon storage is low.
The impact of meteorological factors on carbon storage is characterized by complexity, among which temperature, wind speed, and precipitation all play different roles in the change of carbon storage. Temperature factors account for 11%. Within a certain range, suitable temperature conditions are conducive to vegetation photosynthesis and carbon fixation, while extreme high or low temperatures may inhibit vegetation growth. The north–south wind speed and east–west wind speed each account for 9%. Areas with high wind speed are often accompanied by strong wind erosion, leading to vegetation damage and carbon loss. Precipitation factors account for 6%. Although relatively low, they are still important meteorological factors affecting the change of carbon storage. An increase in precipitation is conducive to vegetation growth and carbon fixation.
On the whole, the increase in vegetation and precipitation is the main control factor for the increase in carbon storage, while the strong wind erosion is the main reason for the decrease in carbon storage in the western mobile dune area. The change trend of carbon storage in different regions is largely affected by the joint influence of terrain, climate, and ecological restoration measures. In the future, in the work of carbon-storage improvement and ecological restoration, these key influencing factors need to be comprehensively considered to formulate more scientific ecological-restoration strategies.
5. Discussion
5.1. Advantages of Research Technology
This study based on the GEE platform integrates multi-source remote-sensing data and combines machine-learning methods to realize the analysis of spatiotemporal changes in carbon storage in the Kubuqi Desert. The efficient computing capability of GEE enables the study to quickly process and analyze remote-sensing images on a large scale, providing strong support for the dynamic monitoring of carbon storage. The application of machine-learning algorithms such as random forest and support vector machine has improved the accuracy of land-cover classification and carbon-storage estimation, making the evaluation of carbon-sink capacity of different ecological types more accurate.
Due to the region’s complex geographical environment and pronounced climatic variability, the distribution and accumulation of soil organic carbon in the Kubuqi Desert are influenced by multiple interacting factors. The Google Earth Engine platform facilitates the integration of diverse remote-sensing datasets—including optical, microwave, and hyperspectral imagery—and provides a suite of spatial analytical tools such as trend analysis and spatial autocorrelation [58]. These capabilities enable a more comprehensive exploration of the spatial heterogeneity of carbon storage and its driving mechanisms. However, remote-sensing monitoring in desert regions continues to face significant challenges. High surface reflectance in arid environments often introduces atmospheric distortions in imagery, while sparse vegetation cover hampers the accuracy of carbon-storage retrieval [59]. Future research should incorporate field-sampling data to refine model parameters and enhance the reliability of carbon-storage estimations.
5.2. Impact of Ecological Protection Policies on Carbon Storage
In recent years, the state has implemented large-scale ecological restoration projects in the Kubuqi Desert area, encompassing vegetation restoration, returning farmland to forest and grassland, and other measures, which have played a positive role in improving carbon storage [60]. This study found that with the advancement of sand control projects, the area of fixed sand and vegetation in the region has significantly increased, and the carbon storage has shown an increasing trend, indicating that ecological restoration measures have an important contribution to the improvement of carbon-sink capacity. The analysis of land-cover changes shows that the increase in carbon storage in some areas mainly comes from the expansion of grassland and artificial forests, indicating that in desert ecosystems, a reasonable vegetation-configuration strategy is crucial to improving carbon-sequestration capacity. However, affected by climate change, the precipitation variability in the Kubuqi Desert area is large, and extreme drought events occur frequently, which may lead to the unsustainability of ecological restoration in some areas, thereby affecting the stability of carbon storage. In the future, it is necessary to further optimize the vegetation model and enhance the adaptability of the ecosystem to climate change.
5.3. Research Limitations and Challenges
Although this study has made certain progress in carbon-storage monitoring, there are still some limitations and challenges. Remote-sensing data are affected by factors such as cloud cover and atmospheric scattering, especially in the season when sandstorms are frequent, the data quality may be damaged, affecting the accuracy of spatiotemporal change monitoring of carbon storage [61]. Although the GEE platform provides certain atmospheric correction and cloud-masking processing methods, the remote-sensing image-preprocessing technology still needs to be further optimized in desert areas to improve the reliability of data; the accuracy of the carbon-storage estimation model is affected by many factors, including soil type, vegetation density, climate conditions, etc. Existing studies mostly rely on remote-sensing images and machine-learning algorithms for inversion but lack sufficient field-observation data for verification. The heterogeneity of desert ecosystems is high, and a single remote-sensing method is difficult to fully reflect the dynamic changes of carbon storage [62]. In the future, the research should be combined with ground-observation data and adopt a multi-scale and multi-source data-fusion method to improve the accuracy of carbon-storage estimation; the performance of machine-learning algorithms is greatly affected by training data. In the case of unbalanced data or insufficient samples, the model may have certain errors, affecting the accurate estimation of carbon storage. In future research, remote sensing information extraction methods based on deep learning can be explored, and combined with long-term sequence data, a more stable and accurate carbon storage prediction model can be constructed.
5.4. Future Research Directions
Aiming at the above challenges, future research can be expanded from the following aspects: improving the spatiotemporal continuity and accuracy of remote-sensing data, using multi-temporal remote-sensing images for data fusion, and combining time-series analysis methods to enhance the ability to identify the change trend of carbon storage. In terms of data fusion, multi-source remote-sensing data such as hyperspectral and lidar can be introduced to make up for the limitations of optical remote sensing and improve the monitoring accuracy of surface vegetation and soil carbon storage [63]. In the future, the comprehensive analysis of the influencing factors of carbon storage can be strengthened, and combined with long-term climate data and ecological survey data, a carbon-storage prediction model based on multi-variable drivers can be established, so as to improve the ability to predict future change trends. In terms of ecological restoration management, remote sensing and GIS technology can be used to optimize vegetation strategies, provide a scientific basis for ecological governance in desert areas, and achieve long-term stable growth of carbon storage.
6. Conclusions
This study based on the GEE platform integrates multi-source remote-sensing data and combines machine-learning algorithms to systematically analyze the spatiotemporal changes of carbon storage in the Kubuqi Desert area and discuss the carbon-sink effect of ecological restoration measures. The study shows that the implementation of ecological-protection projects in recent years has effectively improved the regional carbon storage, but the uncertainty brought by climate change is still an important factor affecting the dynamics of carbon storage. Remote-sensing monitoring technology provides an efficient means for large-scale carbon-storage assessment, but it still needs to be combined with ground observation data and advanced algorithm optimization to improve the estimation accuracy.
6.1. Novelties of This Study Compared with Existing Research
Compared with existing studies on the Kubuqi Desert, this work offers three distinct novelties: (1) Establishing a 5-year (2019–2023) continuous-monitoring framework integrated with multi-source datasets (Landsat 8, Sentinel-1, ERA5), enabling the precise capture of interannual fluctuations in carbon storage; (2) Quantitatively identifying topographic factors (slope: 30%, altitude: 27%) as the dominant drivers of carbon-storage variation, thereby addressing the research gap in terrain-related carbon-storage analysis within the region; (3) Employing the Gradient Boosting model, which achieves a high validation R2 of 0.917, outperforming the prediction accuracy of single-algorithm-based studies in previous literature.
6.2. Key Findings on Carbon-Storage Dynamics and Ecological Restoration Effects
The carbon storage in the Kubuqi Desert shows the characteristics of “local improvement and overall fluctuation”, and the artificial sand control project has played a key role in carbon-sink growth. The increase in vegetation coverage and the reduction of sand and bare land are conducive to the accumulation of carbon storage. Studies have shown that reasonable ecological restoration measures not only improve carbon storage but also enhance the stability of desert ecosystems, providing scientific support for desertification control and climate-change adaptation.
Based on the results of this study, it is recommended to optimize the ecological governance strategy, promote adaptive vegetation technology, and carry out refined monitoring in combination with remote-sensing data and ground observations to improve the accuracy of carbon-storage estimation. Strengthening long-term monitoring of wind-erosion prevention and control and ecological restoration will help consolidate the carbon-sink function and promote the sustainable development of the Kubuqi Desert ecosystem. This study provides data support and theoretical basis for carbon management in arid areas and provides a reference for follow-up research and policy formulation.
Author Contributions
Conceptualization, W.W. and G.F.; Methodology, G.F.; Software, H.Z.; Investigation, G.F.; Resources, W.W., K.S. and G.F.; Writing—original draft, H.Z.; Writing—review & editing, H.Z.; Visualization, H.Z.; Supervision, C.Q., Z.L., K.S., X.Y., Y.L. and Z.W.; Project administration, W.W., C.Q., Z.L., K.S., X.Y., Y.L. and Z.W.; Funding acquisition, W.W., C.Q., Z.L., K.S., X.Y., Y.L., Z.W. and G.F. All authors have read and agreed to the published version of the manuscript.
Funding
This research was funded by [Investigating the Spatiotemporal Variations and Influencing Factors of Vegetation Carbon-Sequestration Capacity in the Three North Shelterbelt of Kubuqi Desert] grant number [KF2024MS03]; [An Integrated Intelligent-Monitoring Platform for Forest-Fire Prevention Based on Multi-Source Data Fusion from Space–Air–Ground] grant number [25-1-5-cspz-19-nsh]; [Supported by the Science and Technology Plan of Hinggan League Science and Technology Bureau] grant numbers [MBHZ2025010, MBJH2024019]; [Mangrove species identification, growth monitoring and early warning based on the combination of UAV hyperspectral image and LiDAR point clouds] grant number [2024GXLK08]; [Study on the Spatiotemporal Evolution Characteristics and Driving Mechanisms of Forest Carbon Storage in Southwest China] grant number [TDSYS202403].
Institutional Review Board Statement
Not applicable.
Informed Consent Statement
Not applicable.
Data Availability Statement
The original contributions presented in this study are included in the article. Further inquiries can be directed to the corresponding author.
Conflicts of Interest
Author Chunfeng Qi was employed by Qingdao Marine Remote Sensing Information Technology Company. The remaining authors declare that the research was conducted in the absence of any commercial or financial relationships that could be construed as a potential conflict of interest. The authors declare that this study received funding from Qingdao Marine Remote Sensing Information Technology Company. The funder was not involved in the study design, data collection, analysis, interpretation of results, the writing of the manuscript, or the decision to submit the article for publication.
Appendix A. Appendix Figure

Figure A1.
Scatter plot of the random-forest training set and validation set. (a) training set. (b) validation set.
Figure A1.
Scatter plot of the random-forest training set and validation set. (a) training set. (b) validation set.


Figure A2.
Scatter plot of the CART decision training set and validation set. (a) training set. (b) validation set.
Figure A2.
Scatter plot of the CART decision training set and validation set. (a) training set. (b) validation set.


Figure A3.
Scatter plot of the gradient-boosting training set and validation set. (a) training set. (b) validation set.
Figure A3.
Scatter plot of the gradient-boosting training set and validation set. (a) training set. (b) validation set.


Figure A4.
Scatter plot of the support-vector-machine training set and validation set. (a) training set. (b) validation set.
Figure A4.
Scatter plot of the support-vector-machine training set and validation set. (a) training set. (b) validation set.

References
- Adams, J.M.; Faure, H. A new estimate of changing carbon storage on land since the last glacial maximum, based on global land ecosystem reconstruction. Glob. Planet. Change 1998, 16–17, 3–24. [Google Scholar] [CrossRef]
- Wang, L.; Wang, X.; Wang, D.; Qi, B.; Zheng, S.; Liu, H.; Luo, C.; Li, H.; Meng, L.; Meng, X.; et al. Spatiotemporal Changes and Driving Factors of Cultivated Soil Organic Carbon in Northern China’s Typical Agro-Pastoral Ecotone in the Last 30 Years. Remote Sens. 2021, 13, 3607. [Google Scholar] [CrossRef]
- Cai, Y.; Zhang, F.; Duan, P.; Yung Jim, C.; Weng Chan, N.; Shi, J.; Liu, C.; Wang, J.; Bahtebay, J.; Ma, X. Vegetation cover changes in China induced by ecological restoration-protection projects and land-use changes from 2000 to 2020. CATENA 2022, 217, 106530. [Google Scholar] [CrossRef]
- Fu, C.; Chen, Z.; Wang, G.; Yu, X.; Yu, G. A comprehensive framework for evaluating the impact of land use change and management on soil organic carbon stocks in global drylands. Curr. Opin. Environ. Sustain. 2021, 48, 103–109. [Google Scholar] [CrossRef]
- Adelisardou, F.; Zhao, W.; Chow, R.; Mederly, P.; Minkina, T.; Schou, J.S. Spatiotemporal change detection of carbon storage and sequestration in an arid ecosystem by integrating Google Earth Engine and InVEST (the Jiroft plain, Iran). Int. J. Environ. Sci. Technol. 2022, 19, 5929–5944. [Google Scholar] [CrossRef]
- Bai, X.; Zhao, W.; Luo, W.; An, N. Effect of climate change on the seasonal variation in photosynthetic and non-photosynthetic vegetation coverage in desert areas, Northwest China. CATENA 2024, 239, 107954. [Google Scholar] [CrossRef]
- Zheng, H.; Zheng, H. Assessment and prediction of carbon storage based on land use/land cover dynamics in the coastal area of Shandong Province. Ecol. Indic. 2023, 153, 110474. [Google Scholar] [CrossRef]
- Issa, S.; Dahy, B.; Ksiksi, T.; Saleous, N. A Review of Terrestrial Carbon Assessment Methods Using Geo-Spatial Technologies with Emphasis on Arid Lands. Remote Sens. 2020, 12, 2008. [Google Scholar] [CrossRef]
- Szatmári, G.; Pásztor, L.; Heuvelink, G.B.M. Estimating soil organic carbon stock change at multiple scales using machine learning and multivariate geostatistics. Geoderma 2021, 403, 115356. [Google Scholar] [CrossRef]
- Khachoo, Y.H.; Cutugno, M.; Robustelli, U.; Pugliano, G. Impact of Land Use and Land Cover (LULC) Changes on Carbon Stocks and Economic Implications in Calabria Using Google Earth Engine (GEE). Sensors 2024, 24, 5836. [Google Scholar] [CrossRef]
- Li, C.; Zhang, C.; Luo, G.; Chen, X. Modeling the carbon dynamics of the dryland ecosystems in Xinjiang, China from 1981 to 2007—The spatiotemporal patterns and climate controls. Ecol. Model. 2013, 267, 148–157. [Google Scholar] [CrossRef]
- Zhang, K.; Zhu, C.; Ma, X.; Zhang, X.; Yang, D.; Shao, Y. Spatiotemporal Variation Characteristics and Dynamic Persistence Analysis of Carbon Sources/Sinks in the Yellow River Basin. Remote Sens. 2023, 15, 323. [Google Scholar] [CrossRef]
- Wang, B.; Li, Y.; Bao, Y. Grazing alters sandy soil greenhouse gas emissions in a sand-binding area of the Hobq Desert, China. J. Arid Land 2022, 14, 576–588. [Google Scholar] [CrossRef]
- Dong, X.; Chen, Z.; Wu, M.; Hu, C. Long time series of remote sensing to monitor the transformation research of Kubuqi Desert in China. Earth Sci. Inform. 2020, 13, 795–809. [Google Scholar] [CrossRef]
- Su, Y.Z.; Wang, X.F.; Yang, R.; Lee, J. Effects of sandy desertified land rehabilitation on soil carbon sequestration and aggregation in an arid region in China. J. Environ. Manag. 2010, 91, 2109–2116. [Google Scholar] [CrossRef]
- Yang, X.; Bai, X.; Yao, W.; Li, P.; Hu, J.; Kang, L. Spatioemporal dynamics and driving forces of soil organic carbon changes in an arid coal mining area of China investigated based on remote sensing techniques. Ecol. Indic. 2024, 158, 111453. [Google Scholar] [CrossRef]
- Chuai, X.; Xia, M.; Xiang, A.; Miao, L.; Zhao, R.; Zuo, T. Vegetation coverage and carbon sequestration changes in China’s forest projects area. Glob. Ecol. Conserv. 2022, 38, e02257. [Google Scholar] [CrossRef]
- Liu, Q.; Zhang, J.; Zhang, H.; Yao, F.; Bai, Y.; Zhang, S.; Meng, X.; Liu, Q. Evaluating the performance of eight drought indices for capturing soil moisture dynamics in various vegetation regions over China. Sci. Total Environ. 2021, 789, 147803. [Google Scholar] [CrossRef]
- Chen, S.; Arrouays, D.; Angers, D.A.; Chenu, C.; Barré, P.; Martin, M.P.; Saby, N.P.A.; Walter, C. National estimation of soil organic carbon storage potential for arable soils: A data-driven approach coupled with carbon-landscape zones. Sci. Total Environ. 2019, 666, 355–367. [Google Scholar] [CrossRef]
- Pechanec, V.; Purkyt, J.; Benc, A.; Nwaogu, C.; Štěrbová, L.; Cudlín, P. Modelling of the carbon sequestration and its prediction under climate change. Ecol. Inform. 2018, 47, 50–54. [Google Scholar] [CrossRef]
- Were, K.; Bui, D.T.; Dick, ⌀.B.; Singh, B.R. A comparative assessment of support vector regression, artificial neural networks, and random forests for predicting and mapping soil organic carbon stocks across an Afromontane landscape. Ecol. Indic. 2015, 52, 394–403. [Google Scholar] [CrossRef]
- Zhang, X.; Sun, Y.; Jia, W.; Wang, F.; Guo, H.; Ao, Z. Research on the Temporal and Spatial Distributions of Standing Wood Carbon Storage Based on Remote Sensing Images and Local Models. Forests 2022, 13, 346. [Google Scholar] [CrossRef]
- Hugelius, G.; Virtanen, T.; Kaverin, D.; Pastukhov, A.; Rivkin, F.; Marchenko, S.; Romanovsky, V.; Kuhry, P. High-resolution mapping of ecosystem carbon storage and potential effects of permafrost thaw in periglacial terrain, European Russian Arctic. J. Geophys. Res. Biogeosci. 2011, 116. [Google Scholar] [CrossRef]
- Xiao, R.; Tan, G.; Huang, B.; Li, J.; Luo, Y. Pathways to sustainable development: Regional integration and carbon emissions in China. Energy Rep. 2022, 8, 5137–5145. [Google Scholar] [CrossRef]
- Gorelick, N.; Hancher, M.; Dixon, M.; Ilyushchenko, S.; Thau, D.; Moore, R. Google Earth Engine: Planetary-scale geospatial analysis for everyone. Remote Sens. Environ. 2017, 202, 18–27. [Google Scholar] [CrossRef]
- Tian, L.; Wu, X.; Tao, Y.; Li, M.; Qian, C.; Liao, L.; Fu, W. Review of Remote Sensing-Based Methods for Forest Aboveground Biomass Estimation: Progress, Challenges, and Prospects. Forests 2023, 14, 1086. [Google Scholar] [CrossRef]
- Gu, Q.; Wei, J.; Luo, S.; Ma, M.; Tang, X. Potential and environmental control of carbon sequestration in major ecosystems across arid and semi-arid regions in China. Sci. Total Environ. 2018, 645, 796–805. [Google Scholar] [CrossRef] [PubMed]
- Rajaud, A.; Noblet-Ducoudré, N.d. Tropical semi-arid regions expanding over temperate latitudes under climate change. Clim. Change 2017, 144, 703–719. [Google Scholar] [CrossRef]
- Yang, X.; Forman, S.; Hu, F.; Zhang, D.; Liu, Z.; Li, H. Initial insights into the age and origin of the Kubuqi sand sea of northern China. Geomorphology 2016, 259, 30–39. [Google Scholar] [CrossRef]
- Thomey, M.L.; Ford, P.L.; Reeves, M.C.; Finch, D.M.; Litvak, M.E.; Collins, S.L. Climate Change Impacts on Future Carbon Stores and Management of Warm Deserts of the United States. Rangelands 2014, 36, 16–24. [Google Scholar] [CrossRef]
- Zhu, G.; Qiu, D.; Zhang, Z.; Sang, L.; Liu, Y.; Wang, L.; Zhao, K.; Ma, H.; Xu, Y.; Wan, Q. Land-use changes lead to a decrease in carbon storage in arid region, China. Ecol. Indic. 2021, 127, 107770. [Google Scholar] [CrossRef]
- Li, Y.; Liu, W.; Feng, Q.; Zhu, M.; Yang, L.; Zhang, J. Effects of land use and land cover change on soil organic carbon storage in the Hexi regions, Northwest China. J. Environ. Manag. 2022, 312, 114911. [Google Scholar] [CrossRef]
- Xiaoyan, B.; Suocheng, D.; Wenbao, M.; Fujia, L. Spatial-temporal change of carbon storage and sink of wetland ecosystem in arid regions, Ningxia Plain. Atmos. Environ. 2019, 204, 89–101. [Google Scholar] [CrossRef]
- Khalifa, M.; Elagib, N.A.; Ribbe, L.; Schneider, K. Spatio-temporal variations in climate, primary productivity and efficiency of water and carbon use of the land cover types in Sudan and Ethiopia. Sci. Total Environ. 2018, 624, 790–806. [Google Scholar] [CrossRef] [PubMed]
- Zhang, C.; Lu, D.; Chen, X.; Zhang, Y.; Maisupova, B.; Tao, Y. The spatiotemporal patterns of vegetation coverage and biomass of the temperate deserts in Central Asia and their relationships with climate controls. Remote Sens. Environ. 2016, 175, 271–281. [Google Scholar] [CrossRef]
- Chang, X.; Xing, Y.; Wang, J.; Yang, H.; Gong, W. Effects of land use and cover change (LUCC) on terrestrial carbon stocks in China between 2000 and 2018. Resour. Conserv. Recycl. 2022, 182, 106333. [Google Scholar] [CrossRef]
- Liu, J.; Yan, Q.; Zhang, M. Ecosystem carbon storage considering combined environmental and land-use changes in the future and pathways to carbon neutrality in developed regions. Sci. Total Environ. 2023, 903, 166204. [Google Scholar] [CrossRef]
- Hou, H.; Zhang, S.; Ding, Z.; Huang, A.; Tian, Y. Spatiotemporal dynamics of carbon storage in terrestrial ecosystem vegetation in the Xuzhou coal mining area, China. Environ. Earth Sci. 2015, 74, 1657–1669. [Google Scholar] [CrossRef]
- Omar, H.; Misman, M.A. Time-series analysis of carbon density over Malaysia’s forests using open-access Landsat imagery on Google Earth Engine platform. In IOP Conference Series: Earth and Environmental Science; IOP Publishing: Bristol, UK, 2024; Volume 1412, p. 012038. [Google Scholar] [CrossRef]
- Yao, P.; Yu, Z.; Zhang, Y.; Xu, T. Application of machine learning in carbon capture and storage: An in-depth insight from the perspective of geoscience. Fuel 2023, 333, 126296. [Google Scholar] [CrossRef]
- Lioubimtseva, E.; Cole, R.; Adams, J.M.; Kapustin, G. Impacts of climate and land-cover changes in arid lands of Central Asia. J. Arid Environ. 2005, 62, 285–308. [Google Scholar] [CrossRef]
- Zhao, M.; He, Z.; Du, J.; Chen, L.; Lin, P.; Fang, S. Assessing the effects of ecological engineering on carbon storage by linking the CA-Markov and InVEST models. Ecol. Indic. 2019, 98, 29–38. [Google Scholar] [CrossRef]
- Wang, S.; Zhuang, Q.; Zhou, M.; Jin, X.; Yu, N.; Yuan, T. Temporal and spatial changes in soil organic carbon and soil inorganic carbon stocks in the semi-arid area of northeast China. Ecol. Indic. 2023, 146, 109776. [Google Scholar] [CrossRef]
- Mamtimin, A.; Zhang, K.; Sayit, H.; Wang, Y.; Gao, J.; Aihaiti, A.; Song, M.; Liu, J.; Yang, F.; Zhou, C.; et al. The construction of shelterbelts along the desert highway has increased the carbon sequestration capacity of the Taklimakan Desert, China. Ecol. Inform. 2025, 86, 103027. [Google Scholar] [CrossRef]
- Zhuang, Q.; Shao, Z.; Li, D.; Huang, X.; Li, Y.; Altan, O.; Wu, S. Impact of global urban expansion on the terrestrial vegetation carbon sequestration capacity. Sci. Total Environ. 2023, 879, 163074. [Google Scholar] [CrossRef]
- Xiang, S.; Wang, Y.; Deng, H.; Yang, C.; Wang, Z.; Gao, M. Response and multi-scenario prediction of carbon storage to land use/cover change in the main urban area of Chongqing, China. Ecol. Indic. 2022, 142, 109205. [Google Scholar] [CrossRef]
- Shi, W.Y.; Chen, Y.Z.; Feng, X.M. Identifying the terrestrial carbon benefits from ecosystem restoration in ecologically fragile regions. Agric. Ecosyst. Environ. 2020, 296, 106889. [Google Scholar] [CrossRef]
- de Almeida Pereira, G.H.; Fusioka, A.M.; Nassu, B.T.; Minetto, R. Active fire detection in Landsat-8 imagery: A large-scale dataset and a deep-learning study. ISPRS J. Photogramm. Remote Sens. 2021, 178, 171–186. [Google Scholar] [CrossRef]
- Tamiminia, H.; Salehi, B.; Mahdianpari, M.; Quackenbush, L.; Adeli, S.; Brisco, B. Google Earth Engine for geo-big data applications: A meta-analysis and systematic review. ISPRS J. Photogramm. Remote Sens. 2020, 164, 152–170. [Google Scholar] [CrossRef]
- Kotowska, M.M.; Leuschner, C.; Triadiati, T.; Meriem, S.; Hertel, D. Quantifying above- and belowground biomass carbon loss with forest conversion in tropical lowlands of Sumatra (Indonesia). Glob. Change Biol. 2015, 21, 3620–3634. [Google Scholar] [CrossRef]
- Wang, N.; Chen, X.; Zhang, Z.; Pang, J. Spatiotemporal dynamics and driving factors of county-level carbon storage in the Loess Plateau: A case study in Qingcheng County, China. Ecol. Indic. 2022, 144, 109460. [Google Scholar] [CrossRef]
- Fahey, T.J.; Woodbury, P.B.; Battles, J.J.; Goodale, C.L.; Hamburg, S.P.; Ollinger, S.V.; Woodall, C.W. Forest carbon storage: Ecology, management, and policy. Front. Ecol. Environ. 2010, 8, 245–252. [Google Scholar] [CrossRef]
- Hussain, S.; Hussain, S.; Guo, R.; Sarwar, M.; Ren, X.; Krstic, D.; Aslam, Z.; Zulifqar, U.; Rauf, A.; Hano, C.; et al. Carbon sequestration to avoid soil degradation: A review on the role of conservation tillage. Plants 2021, 10, 2001. [Google Scholar] [CrossRef] [PubMed]
- Potouroglou, M.; Whitlock, D.; Milatovic, L.; MacKinnon, G.; Kennedy, H.; Diele, K.; Huxham, M. The sediment carbon stocks of intertidal seagrass meadows in Scotland. Estuarine Coast. Shelf Sci. 2021, 258, 107442. [Google Scholar] [CrossRef]
- Li, Y.; Brando, P.M.; Morton, D.C.; Lawrence, D.M.; Yang, H.; Randerson, J.T. Deforestation-induced climate change reduces carbon storage in remaining tropical forests. Nat. Commun. 2022, 13, 1964. [Google Scholar] [CrossRef]
- Mo, L.; Zohner, C.M.; Reich, P.B.; Liang, J.; De Miguel, S.; Nabuurs, G.J.; Renner, S.S.; Van Den Hoogen, J.; Araza, A.; Herold, M.; et al. Integrated global assessment of the natural forest carbon potential. Nature 2023, 624, 92–101. [Google Scholar] [CrossRef]
- Ju, L.; Yin, Z.; Lu, X.; Yang, S.; Li, P.; Rao, R.; Tan, Z. A Tri-dimensional Equilibrium-based stochastic optimal dispatching model for a novel virtual power plant incorporating carbon Capture, Power-to-Gas and electric vehicle aggregator. Appl. Energy 2022, 324, 119776. [Google Scholar] [CrossRef]
- Liang, Y.; Hashimoto, S.; Liu, L. Integrated assessment of land-use/land-cover dynamics on carbon storage services in the Loess Plateau of China from 1995 to 2050. Ecol. Indic. 2021, 120, 106939. [Google Scholar] [CrossRef]
- Assmuth, A.; Rämö, J.; Tahvonen, O. Optimal carbon storage in mixed-species size-structured forests. Environ. Resour. Econ. 2021, 79, 249–275. [Google Scholar] [CrossRef]
- Lu, X.; Hou, E.; Guo, J.; Gilliam, F.S.; Li, J.; Tang, S.; Kuang, Y. Nitrogen addition stimulates soil aggregation and enhances carbon storage in terrestrial ecosystems of China: A meta-analysis. Glob. Change Biol. 2021, 27, 2780–2792. [Google Scholar] [CrossRef]
- Li, L.; Huang, X.; Yang, H. Optimizing land use patterns to improve the contribution of land use planning to carbon neutrality target. Land Use Policy 2023, 135, 106959. [Google Scholar] [CrossRef]
- Schweizer, S.A.; Mueller, C.W.; Höschen, C.; Ivanov, P.; Kögel-Knabner, I. The role of clay content and mineral surface area for soil organic carbon storage in an arable toposequence. Biogeochemistry 2021, 156, 401–420. [Google Scholar] [CrossRef]
- Wang, Z.; Li, X.; Mao, Y.; Li, L.; Wang, X.; Lin, Q. Dynamic simulation of land use change and assessment of carbon storage based on climate change scenarios at the city level: A case study of Bortala, China. Ecol. Indic. 2022, 134, 108499. [Google Scholar] [CrossRef]


Disclaimer/Publisher’s Note: The statements, opinions and data contained in all publications are solely those of the individual author(s) and contributor(s) and not of MDPI and/or the editor(s). MDPI and/or the editor(s) disclaim responsibility for any injury to people or property resulting from any ideas, methods, instructions or products referred to in the content. |
© 2025 by the authors. Licensee MDPI, Basel, Switzerland. This article is an open access article distributed under the terms and conditions of the Creative Commons Attribution (CC BY) license.