Article

Measurement and Influencing Factors of Rural Livelihood Resilience of Different Types of Farmers: Taking “Agri-Tourism–Commerce–Culture Integration” Areas in China


1
Rural Development Institute, Sichuan Academy of Social Sciences, Chengdu 610031, China
2
College of Economics, Sichuan Agricultural University, Chengdu 611100, China
*
Author to whom correspondence should be addressed.
These authors contributed equally to this work and should be considered co-first authors.
Sustainability 2026, 18(1), 208; https://doi.org/10.3390/su18010208
Submission received: 4 November 2025 / Revised: 16 December 2025 / Accepted: 18 December 2025 / Published: 24 December 2025

Abstract

In the rapid development of rural tourism, multiple disturbances, such as capital reorganization, uneven resource distribution, and the marginalization of farmers as the main body, have emerged. This has led to the dual challenges of increased vulnerability and insufficient resilience of farmers’ livelihood systems in the face of risk shocks. Based on survey data of the “Agri-Tourism–Commerce–Culture Integration” demonstration zone in China, this study integrates the Pressure–State–Response model into the analysis of livelihood resilience and constructs a “vulnerability–adaptability–recuperability” tri-dimensional framework. Through methods such as the entropy weight method, the synthetical index method, grey relational degree analysis, and the obstacle degree model, this study measures the levels of different livelihood types of farmers in each dimension of livelihood resilience and their influencing factors. The research findings indicate that the overall livelihood resilience of farmers in the study area was at a medium level, with vulnerability making the most significant contribution, reflecting that the current livelihood system is dominated by risk resistance. Different types of farmers exhibit heterogeneity in resilience, with tourism-oriented farmers showing the highest resilience and agriculture-oriented farmers the lowest. However, tourism-oriented farmers also display the most prominent vulnerability, revealing the tension between short-term efficiency enhancement and long-term risk diversification in single livelihood strategies. Key factor analysis reveals that vulnerability correlates most strongly with livelihood resilience. The most correlated indicators are the price increase rate, proportion of migrant workers, and neighborhood trust in the vulnerability, adaptability, and recuperability dimensions. Diagnosis of obstacle factors reveal that loan accessibility, land resource dependency, and agricultural risk perception rank as the top three common obstacles, with tourism-driven farmers exhibiting higher obstacle degrees than other farmer categories. These findings not only validate the empowering effect of rural tourism on farmers’ livelihoods but also reveal the different livelihood strategies chosen by various farmers. Based on the results, this study proposes policy recommendations of “common optimization + individual adaptation” to enhance farmers’ livelihood resilience. This is conducive to transforming external support into farmers’ endogenous resilience capabilities and provides a useful reference for achieving the deep integration of rural tourism and farmers’ livelihood systems.

1. Introduction

Under the strategic backdrop of China’s all-round promotion of rural revitalization and the pursuit of common prosperity, rural tourism has been positioned as an engine that integrates the activation of the rural economy, the promotion of ecological protection, and the increase in farmers’ income. The 2025 Central Document No. 1 of China explicitly states that “we should promote the deep integration of rural culture and tourism, carry out pilot projects of cultural industries empowering rural revitalization, and enhance the specialization, refinement, and standardization of rural tourism.” This regards rural tourism as a golden opportunity for new quality productivity empowerment, cultural value addition and industrial system upgrading [1]. According to data from the Ministry of Culture and Tourism, the number of tourists received by rural tourism across the country exceeded 1.5 billion in the first half of 2025, with operating income surpassing 1.2 trillion yuan [2], marking its transformation from a “supplementary” industry for rural revitalization to a “pillar” industry.
However, the rapid development of rural tourism is accompanied by disturbances such as uneven resource distribution, marginalization of farmers as the main body, lagging systems and ecological overloading. This leads to farmers facing the dual challenges of increased vulnerability and insufficient resilience under the impact of risks. Although farmers have a certain degree of risk tolerance, that is, they are “brittle but not broken, weak but not slack”, their livelihood systems still show persistent fragility under structural pressure [3]. Therefore, systematically enhancing the resilience of farmers’ livelihoods in the context of rural tourism has become a core issue in responding to external risks and breaking through the endogenous development predicament.
Farmers’ livelihood resilience, as an emerging research domain, differs from the traditional livelihood analysis that mainly focuses on poverty prediction and policy support. It emphasizes the integrated ability of farmers to withstand shocks, adapt to changes, and achieve system recovery and upgrading when facing risks. This theoretical shift responds to two major practical demands: First, the normalization of climate change and public emergencies has exposed the high sensitivity and low redundancy of the single agricultural livelihood model, requiring farmers to shift from risk avoidance to capacity building. Second, land transfer, new productive forces, and the integration of the tertiary industry have driven the transformation of the rural production field into a “ecological-cultural-economic” complex system, and farmers’ livelihoods have also presented multi-dimensional characteristics such as agriculture as the foundation, tourism value-added, and ecological services.
At present, research on the resilience of farmers’ livelihoods has developed into multi-level explorations ranging from macro to micro, and from descriptive to mechanistic analysis. At the macro level, studies have gradually shifted from a single economic indicator to a comprehensive assessment of “economy–ecology–institution”. For instance, the resilience assessment framework of the Food and Agriculture Organization of the United Nations (FAO) and the Pressure–State–Response model have been employed to analyze the impact of ecological policies on regional resilience [4]. Non-agricultural employment, public services, and ecological investment are regarded as key predictive variables. However, such studies often overlook the agency and behavioral heterogeneity of farmers [5]. At the micro level, mainstream research is based on the vulnerability–recuperability analytical framework, constructing a capability structure system centered on buffering capacity, self-organization, and earning capacity [6,7], and using structural equation models to verify the configurational effects among social networks, policy perception, and digital skills [8]. Methodologically, quantitative methods such as regression analysis, coupling coordination models, and machine learning are combined with qualitative methods like in-depth interviews and participatory rural appraisal [4,5,9], effectively identifying influencing factors, simulating policy scenarios, and revealing adaptability strategies in informal land transfer [10]. In terms of research scale, scholars have deconstructed the formation mechanism of resilience from both geographical space and social network dimensions, finding that farmers in plain areas enhance resilience by developing characteristic industries through spatial agglomeration [11]. Additionally, some studies have shown that moderate natural risks can activate farmers’ adaptation strategies, presenting an inverted U-shaped relationship [12].
Although existing research has laid the foundation for understanding the livelihood resilience of farmers, especially making significant progress in the intersection of rural tourism and livelihoods, there are still obvious limitations. First, the research perspective is overly static and single, mostly focusing on the linear impact of tourism development on livelihoods [13,14,15], neglecting the internal differentiation and strategic diversity of farmers, which leads to policy recommendations lacking specificity. Second, the current assessment system overly emphasizes economic capital [16,17], paying insufficient attention to soft dimensions such as institutional adaptability and cultural inheritance, making it difficult to comprehensively capture the essence of resilience. Finally, research on the internal drivers of resilience and their interaction mechanisms with the external environment is still relatively weak [8,18,19], and mostly relies on cross-sectional data, making it difficult to dynamically reveal the path dependence and feedback mechanisms of resilience evolution at different stages of tourism development.
To address the aforementioned research gap, this study takes 305 farmers in China’s Agri-Tourism–Commerce–Culture Integration Areas as the research subjects and aims to achieve the following objectives: (1) Integrate the Pressure–State–Response (PSR) model with livelihood resilience theory to construct a systematic theoretical framework comprising the “vulnerability–adaptability–recuperability” triad, highlighting the dynamic response characteristics of farmers’ livelihood systems within the context of rural tourism; (2) Measure the resilience levels of farmers with different livelihood typologies and analyze inter-group disparities across dimensions and criterion layers; (3) Identify the key driving factors and barrier factors influencing the formation and evolution of farmers’ livelihood resilience; (4) Propose resilience enhancement pathways that integrate holistic and typological considerations.
The marginal contribution of this research lies in the construction of a “vulnerability–adaptability–recuperability” tri-dimensional theoretical framework. It breaks through the previous single-dimensional perspective centered on capital and particularly highlights the pivotal role of the “adaptability” dimension in connecting risk exposure and system recovery. Methodologically, a comprehensive evaluation system integrating subjective and objective indicators and covering capital, strategy, learning, and social dimensions is established to enhance the systematic nature and context adaptability of the measurement. At the empirical level, it reveals the mechanism by which the heterogeneity of farmers affects the differentiation of resilience and proposes a path to enhance livelihood resilience based on the principle of “common optimization + individual adaptation”. This provides theoretical basis and practical reference for the risk governance and policy design of farmers in the context of high-quality development of rural tourism.

2. Research Analysis and Methods

2.1. A Tri-Dimensional Framework of Farmers’ Livelihood Resilience

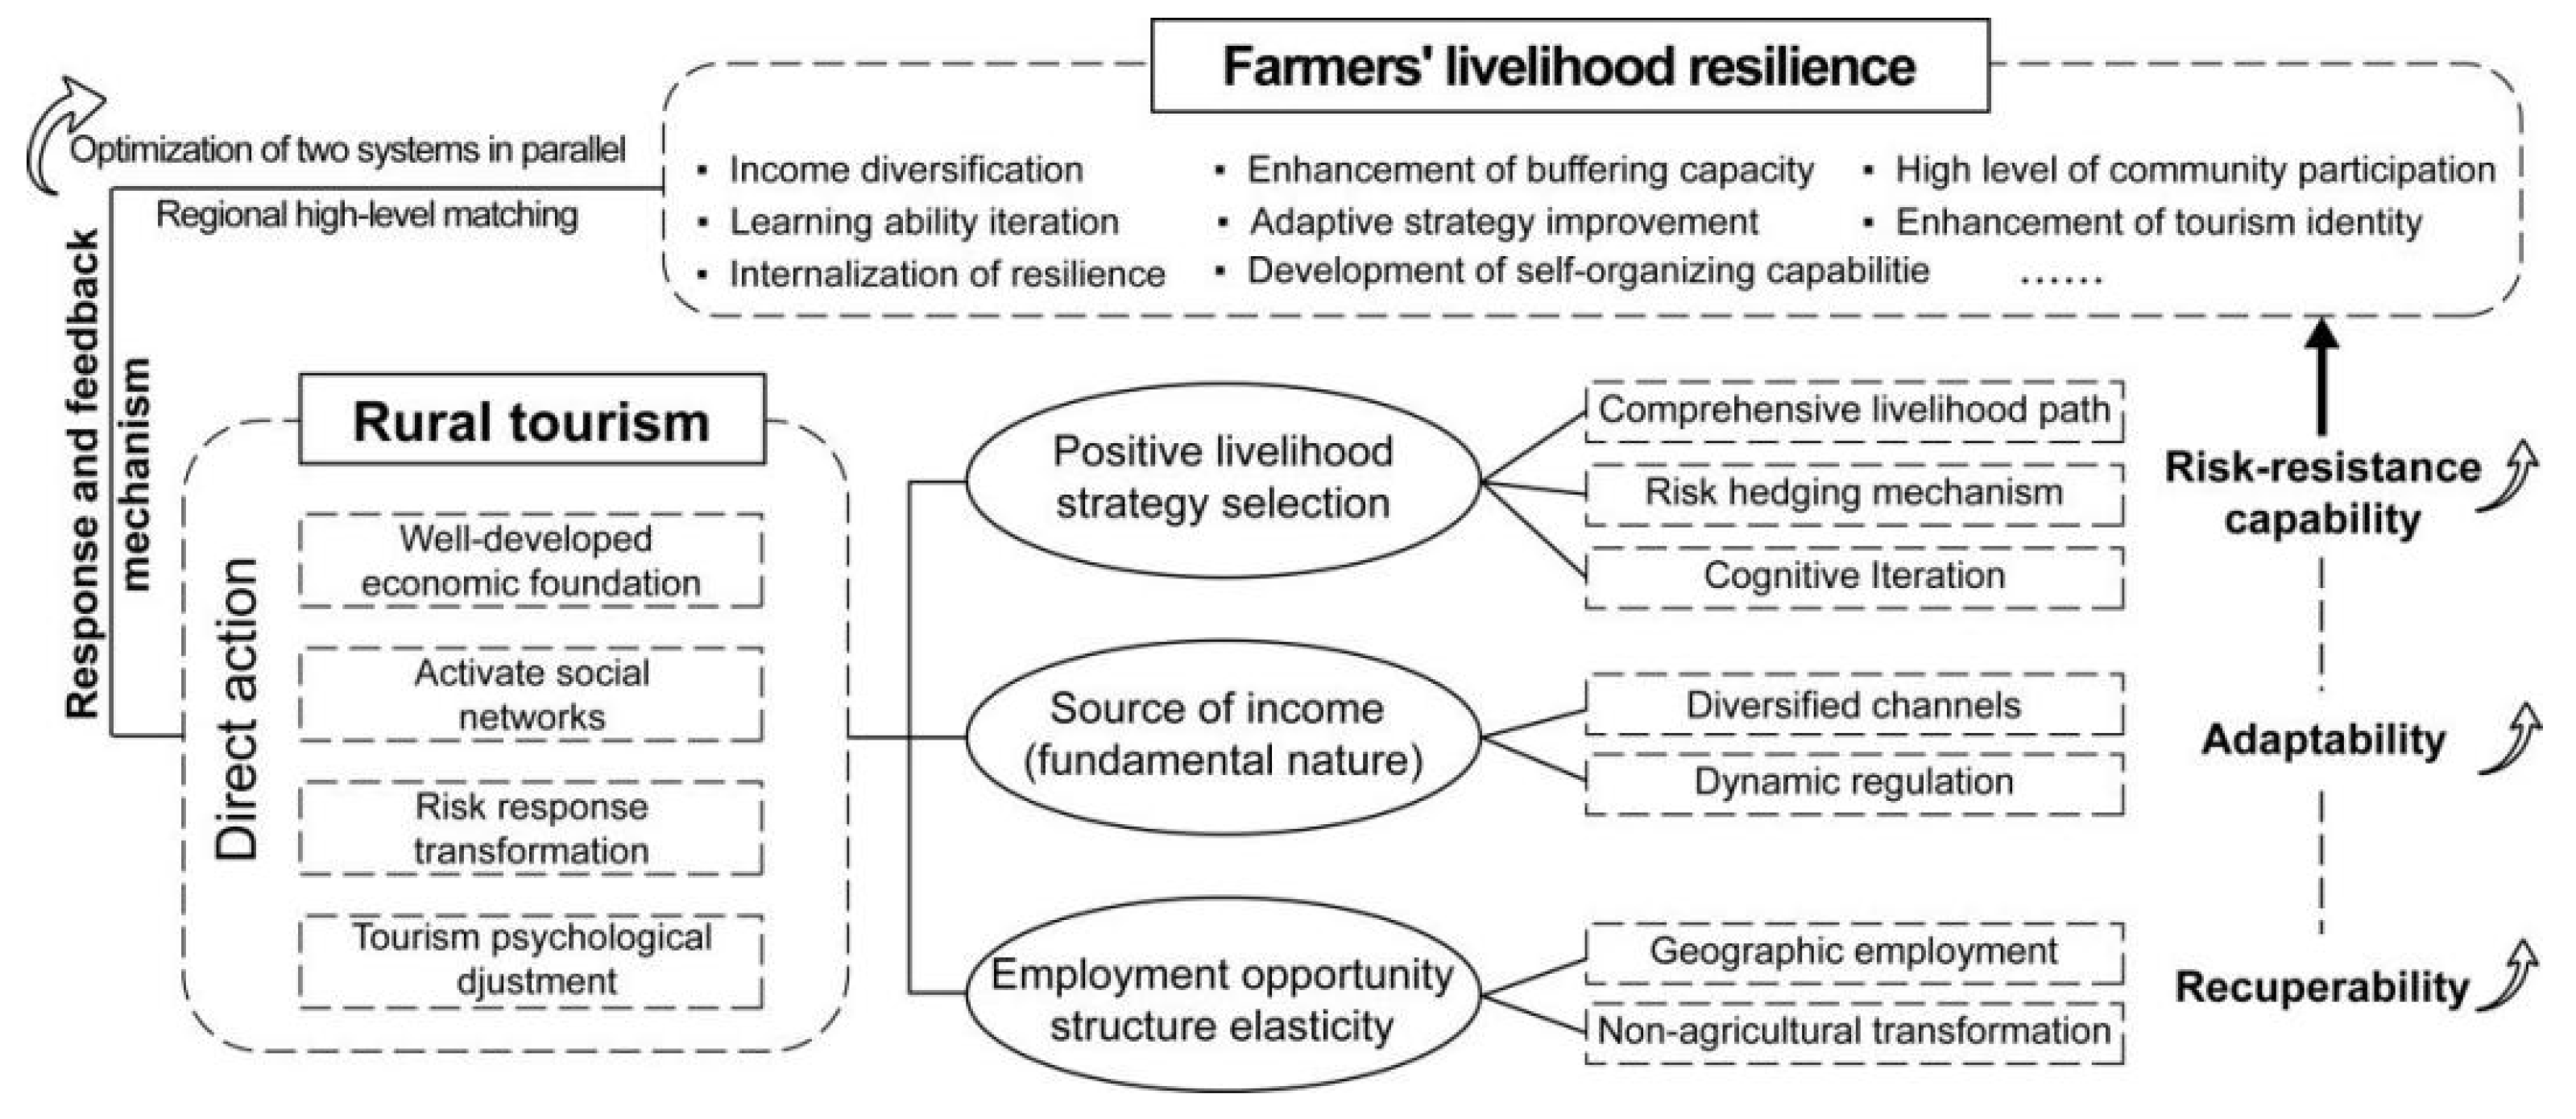
Inspired by various sources [20,21,22,23], rural tourism, as an important carrier for the transformation of rural economies, promotes the multi-dimensional enhancement of farmers’ livelihood resilience through multiple pathways. This process can be deconstructed into the interactive logic of economic, social, cognitive, psychological, and system feedback (Figure 1).
The Pressure–State–Response model, a framework for ecosystem health assessment within environmental quality evaluation, was proposed by Canadian statisticians David J. Rapport and Tony Friend in 1979. The thinking logic of this model answers the three fundamental questions of sustainable development: “What happened, why it happened, and what will be done about it” [24].
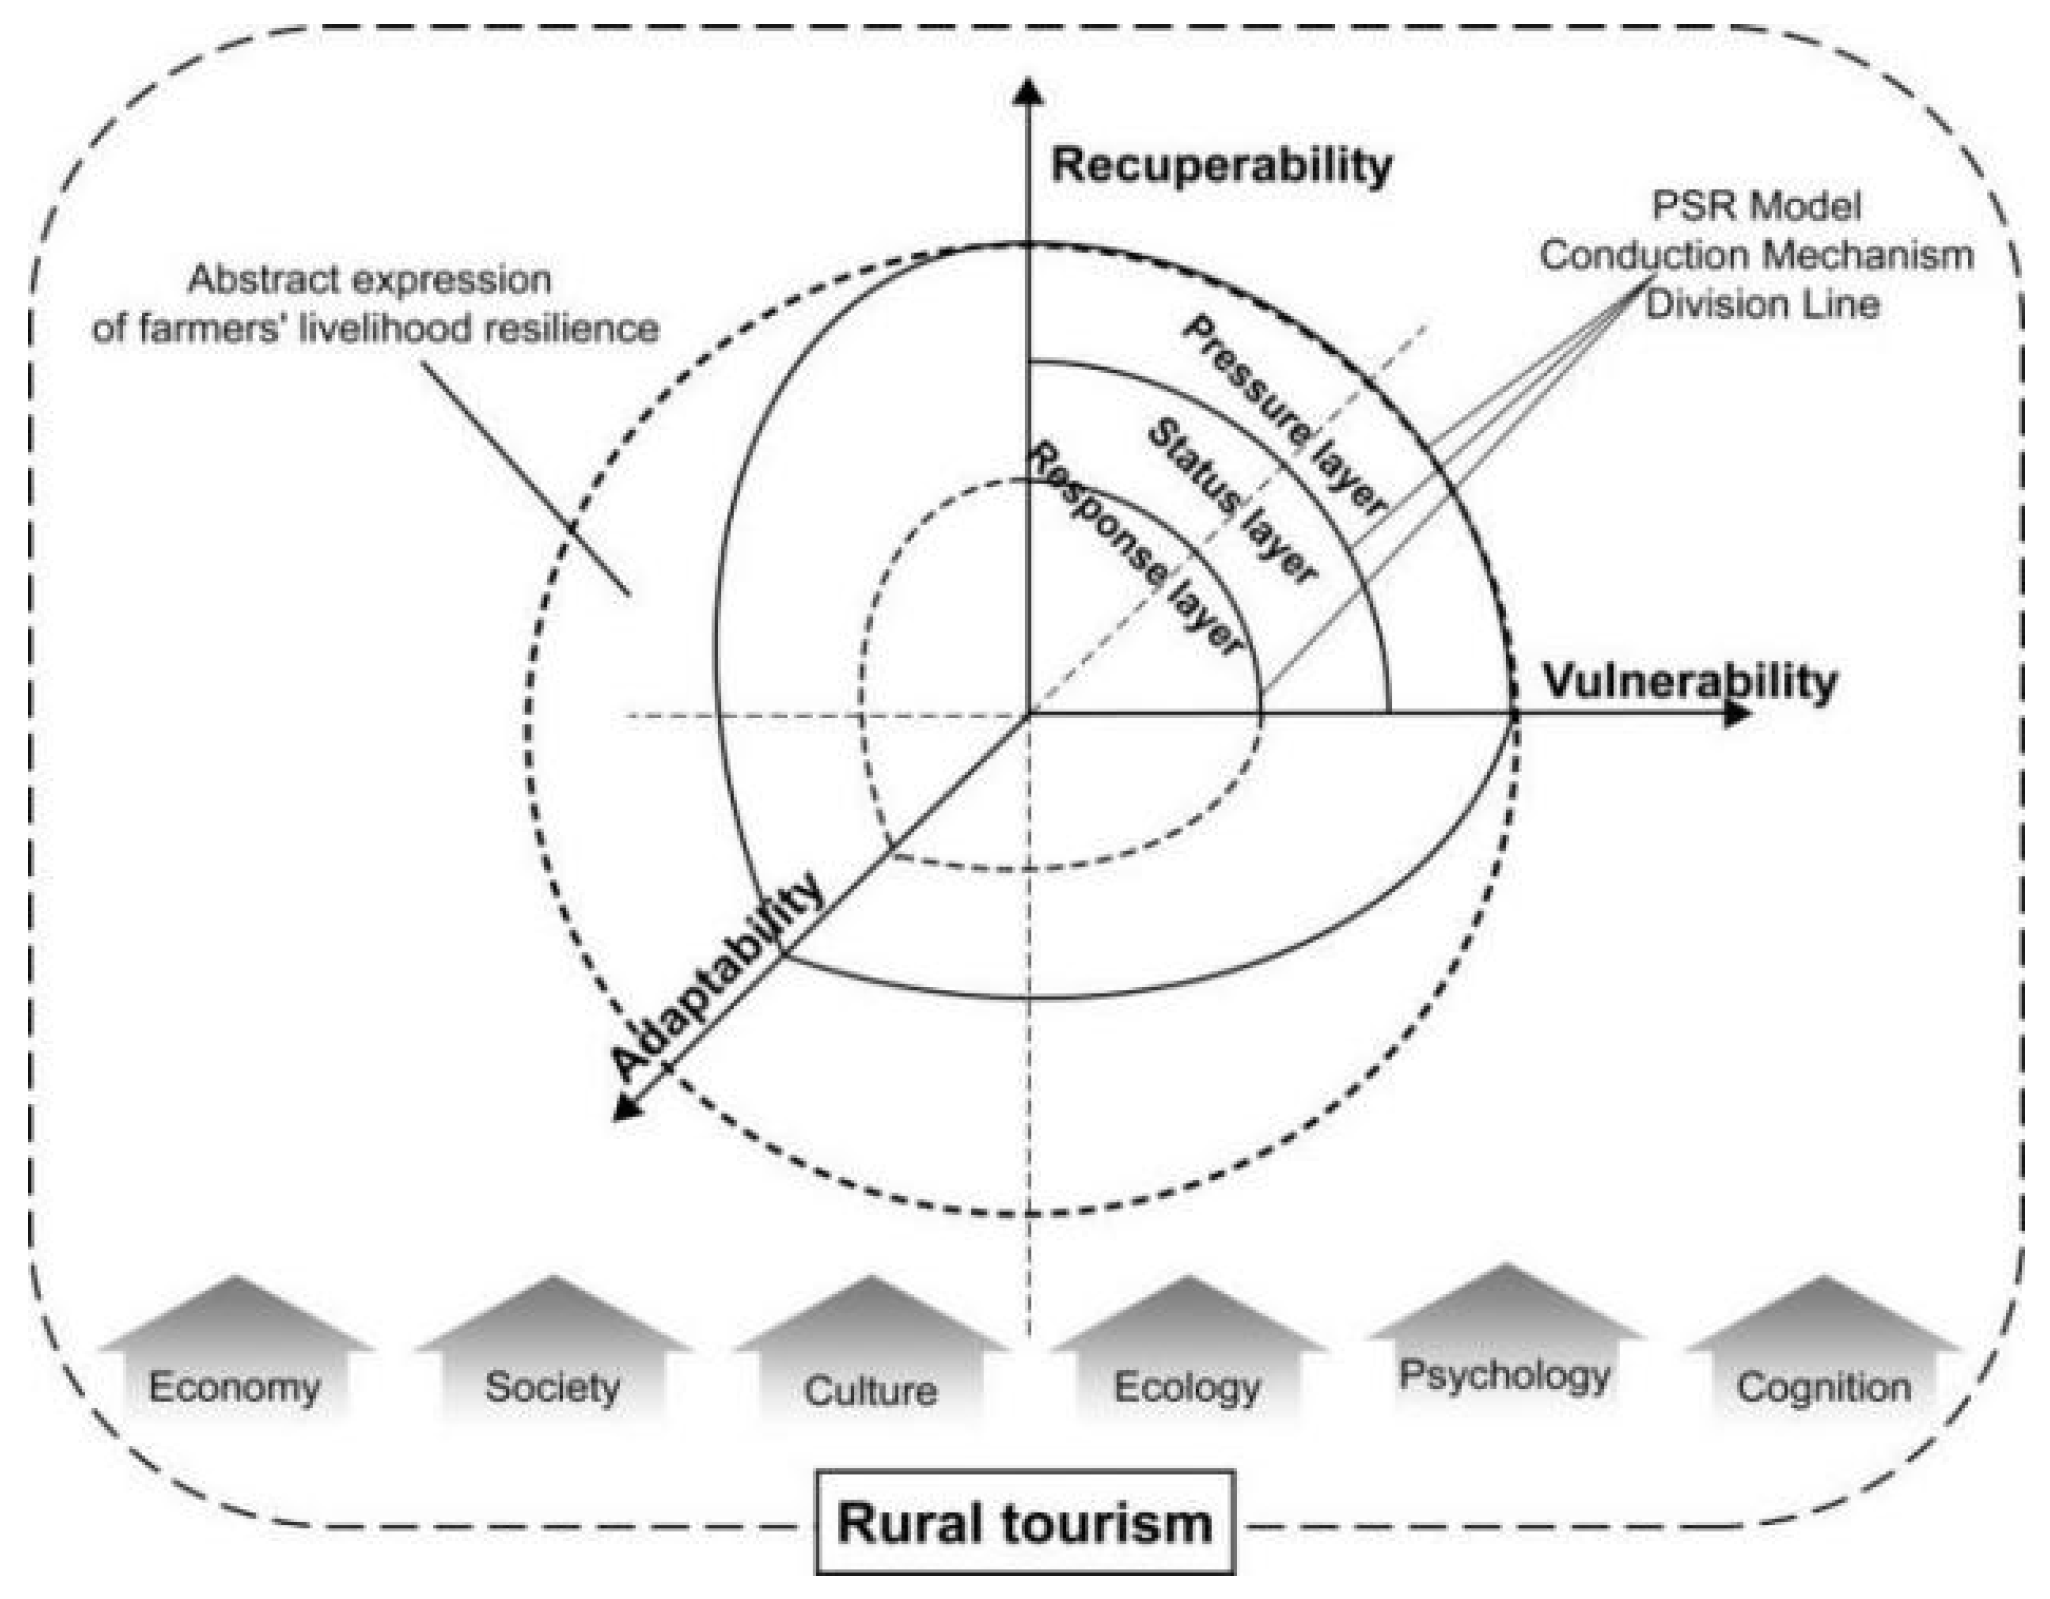
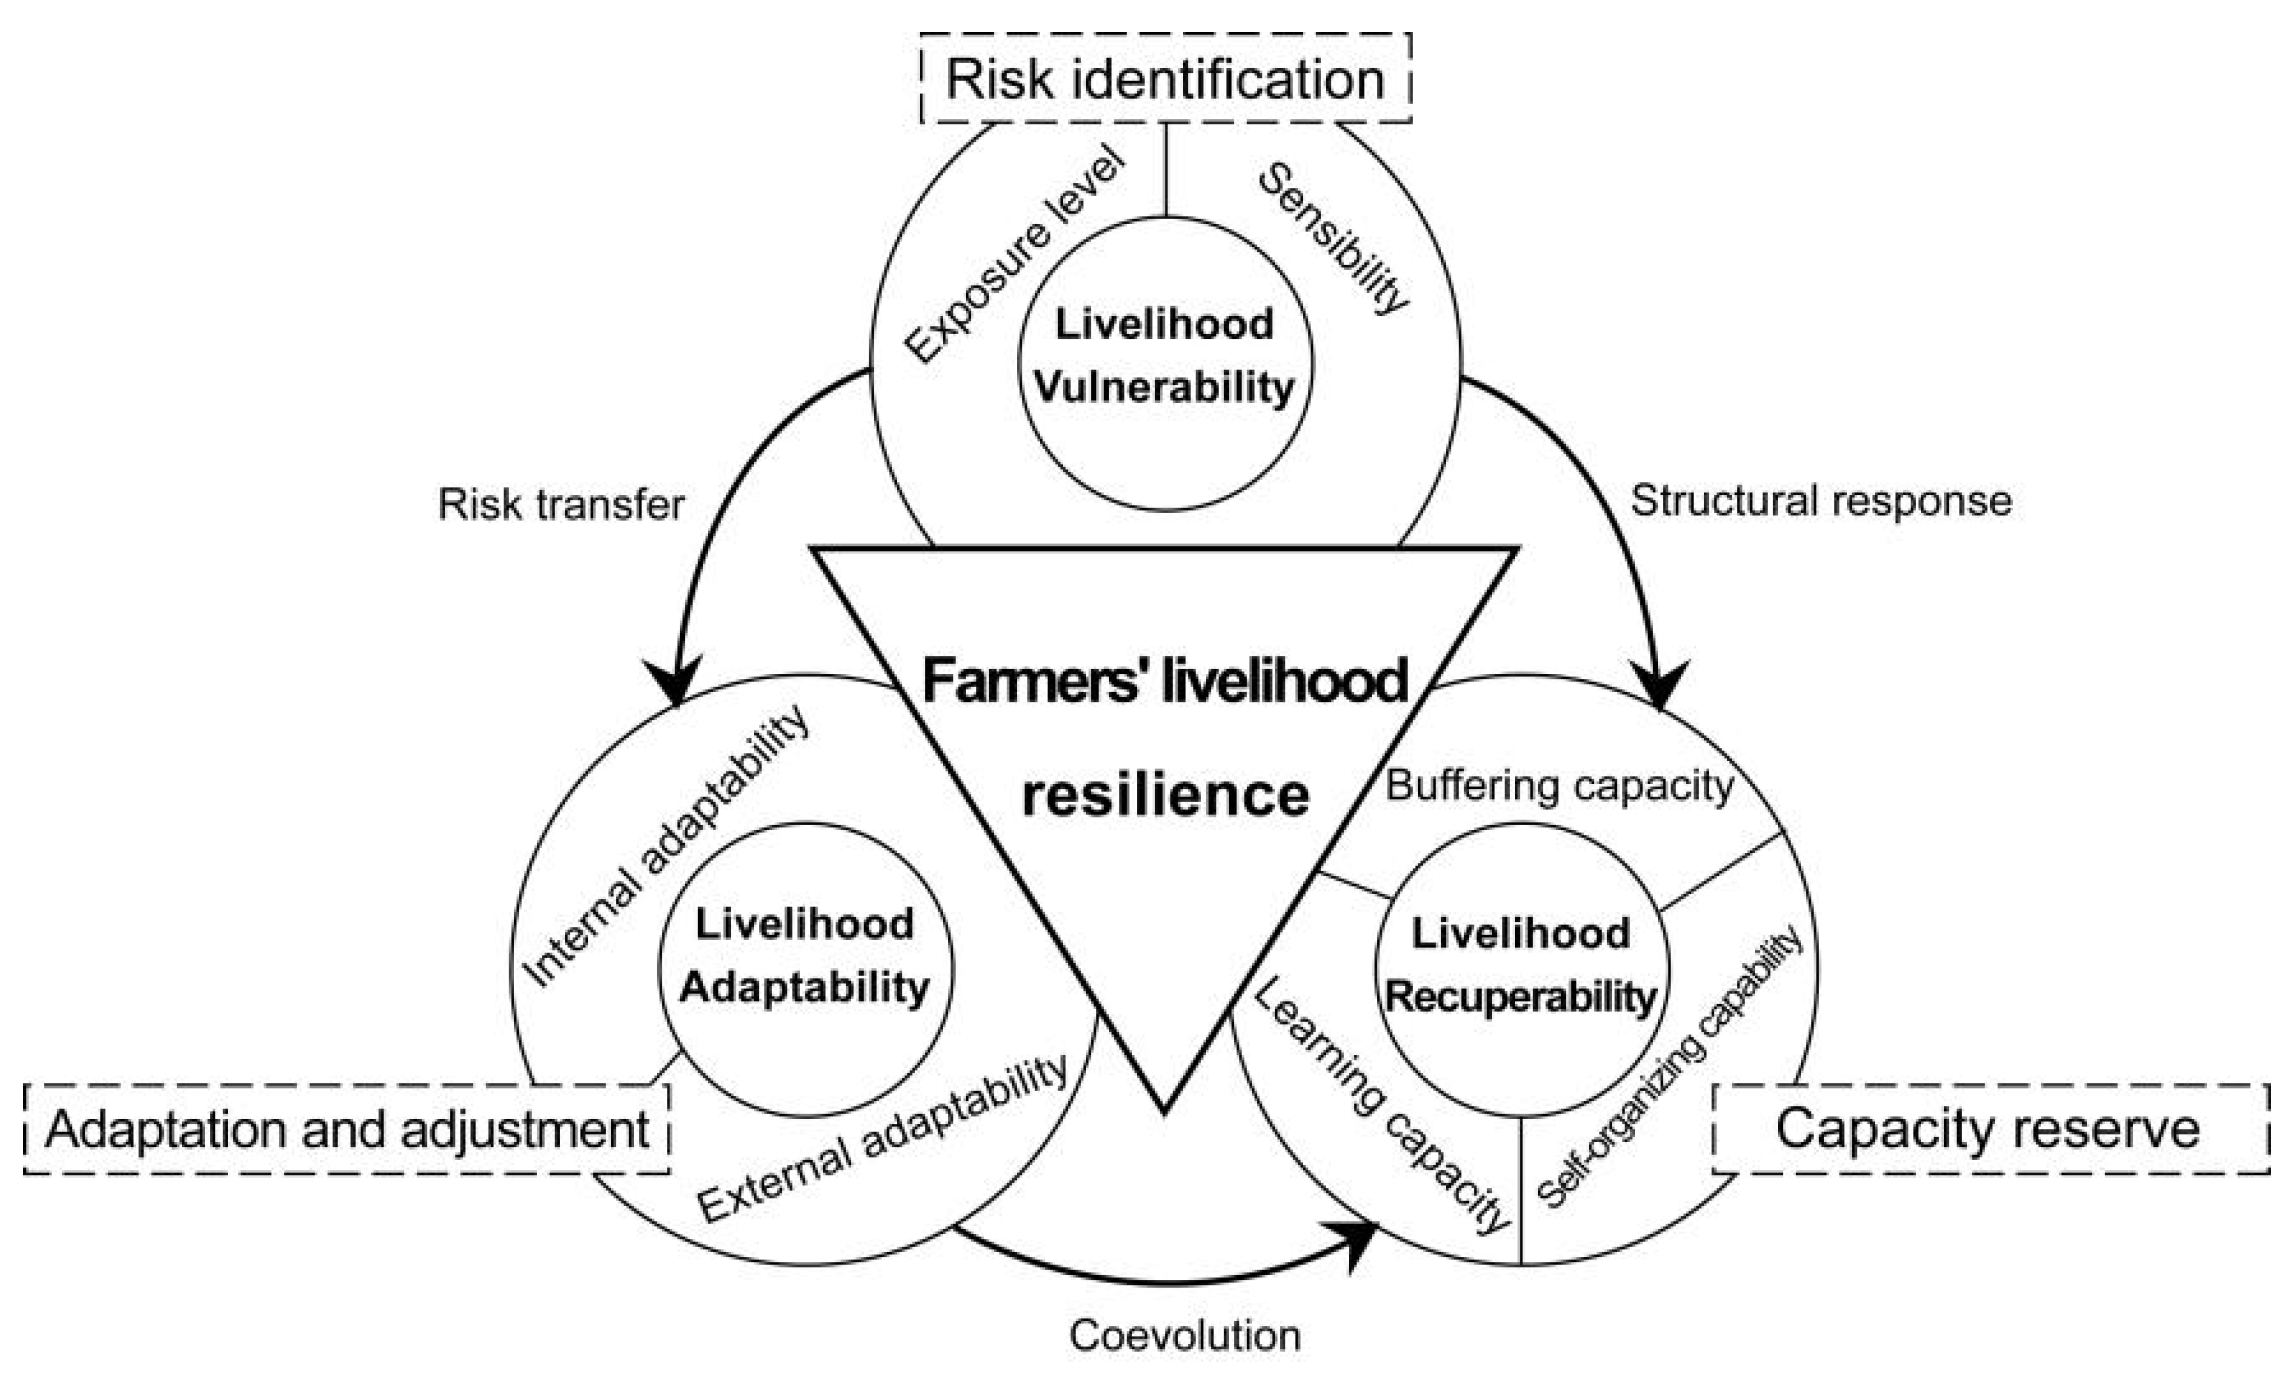
Integrating the PSR model into the theory of livelihood resilience (Figure 2), rural tourism vertically permeates the three hierarchical levels of rural livelihood resilience: pressure, state, and response. Within the pressure layer, rural tourism acts as an external disturbance factor, intensifying the vulnerability foundation of rural livelihood systems through economic dependence reinforcement, social relationship alienation and ecological load exacerbation [18]. In the state layer, rural farmers adapt and adjust to the pressures induced by tourism integration, transforming these pressures into driving forces for livelihood system upgrading [16]. At the response layer, rural livelihood systems enhance their recuperability through institutional innovation, technological absorption, and organizational transformation [15]. Ultimately, this process facilitates the transmission of rural livelihood resilience across the pressure, state, and response levels under risk impacts, achieving coordinated resilience development across the three dimensions of vulnerability, adaptability, and recuperability.
According to existing research [5,25,26,27], farmers’ livelihood resilience is the result of the coupling effect of “risk-resistance” in livelihoods. The proposed “vulnerability–recuperability” framework can deconstruct the connotation of livelihood resilience. However, considering that the data collected in the study area of this research cannot reflect the temporal changes in farmers’ livelihoods. Therefore, this study highlights the transitional concept of adaptability, that is, to construct a “vulnerability–adaptability–recuperability” tri-dimensional theoretical framework and index system that is systematic and dynamic. In the vulnerability dimension, exposure level refers to the intensity of contact between the farmers’ livelihood system and external risks, while sensitivity reflects the response threshold of the internal system structure to shocks. These two factors form a dynamic coupling of risk transmission and structural response, with high exposure environments forcing farmers to adjust their production structures, and sensitivity differences leading to divergent livelihood strategies [28]. In the adaptability dimension, internal adaptability is manifested in the diversity and stability of livelihood improvements after farmers’ autonomous adjustments [29], while external adaptability focuses on institutional safeguards such as policy dependence, market access, and risk perception. In the recuperability dimension, buffer capacity acts as a “shock absorber” for risk impacts [30], self-organization capacity represents the community’s endogenous order repair function [8], and learning capacity serves as the endogenous driving force of livelihood resilience [31]. These three elements synergistically exhibit a spiral upward characteristic, forming a resilience accumulation cycle of trauma repair, capacity sedimentation, and capacity preparation (Figure 3).

2.2. Materials and Methods

2.2.1. Study Area

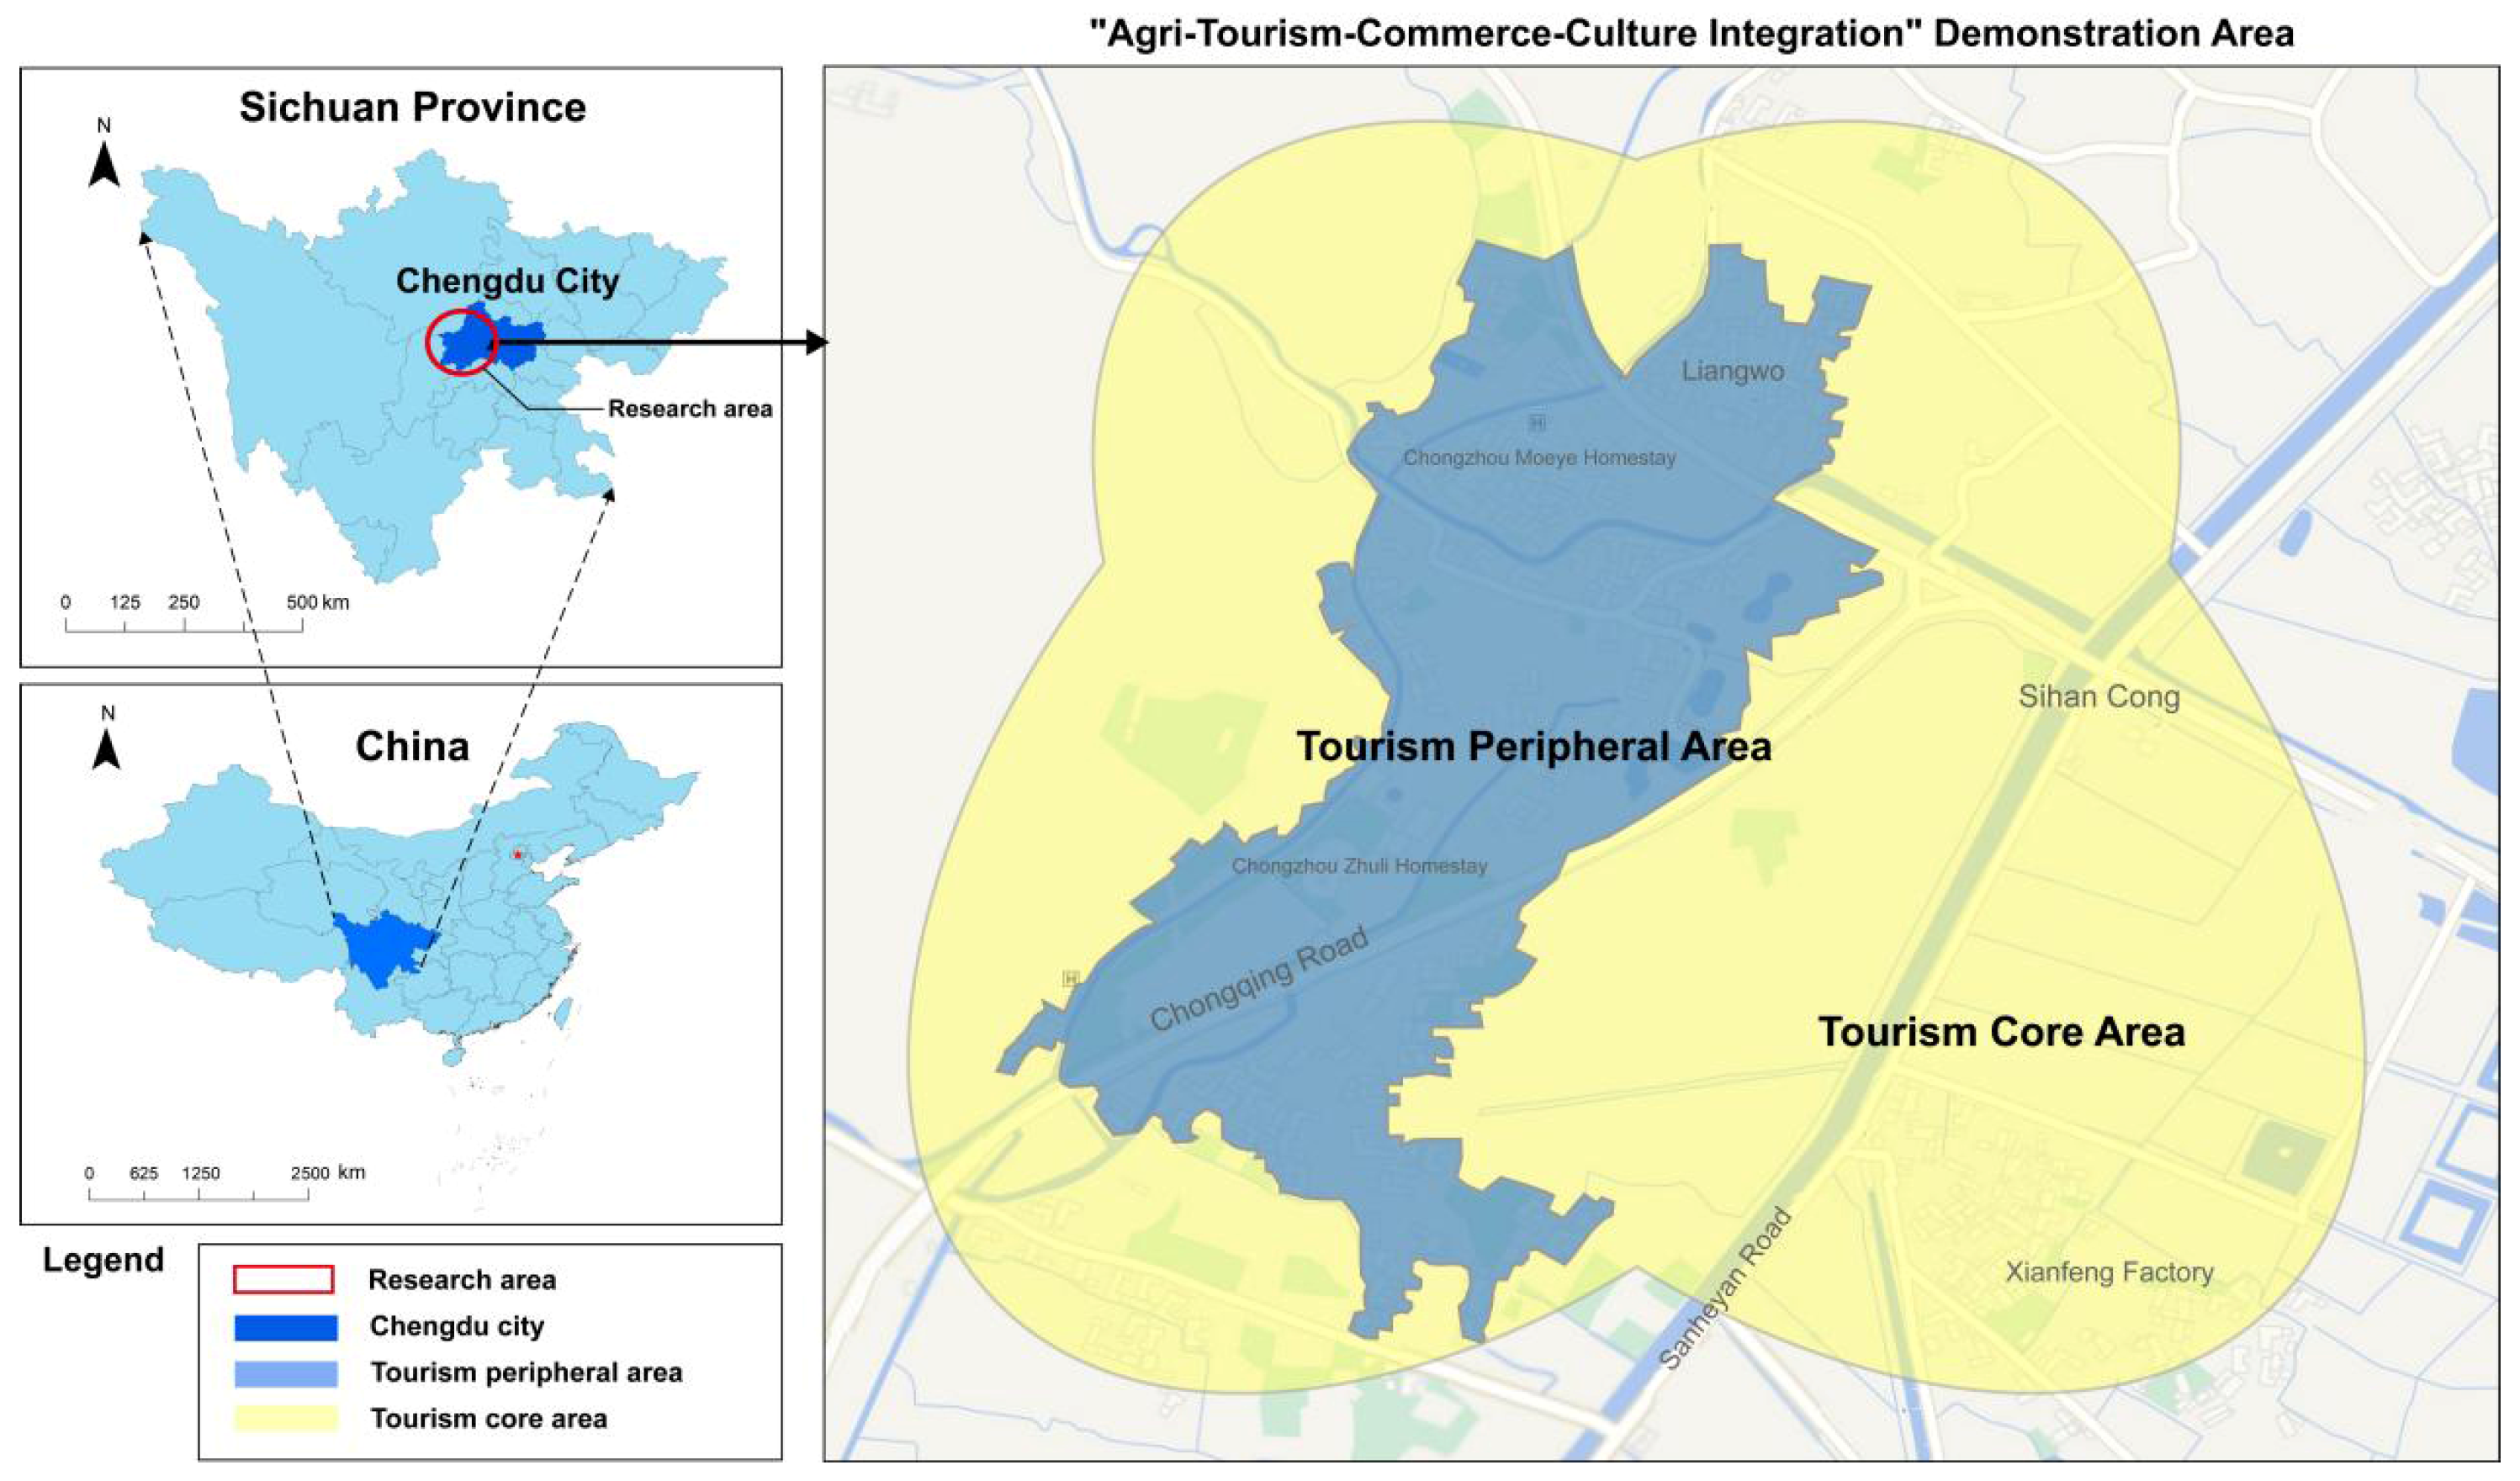
Bamboo Craft Village, a natural settlement formed by the aggregation of multiple administrative villages under the impetus of rural tourism, serves as a demonstration zone for the “Agri-Tourism–Commerce–Culture Integration” development model. Situated in the ecological transition zone between the Chengdu Plain and the Longmen Mountains in the outskirts of Chengdu, Sichuan Province, China, it borders a national grain production base and the renowned “Most Beautiful Country Road”—Chongqing Road, exhibiting dual geographical characteristics of both urban fringe and rural hinterland [32].
As the core heritage site of the national intangible cultural heritage “Daoming Bamboo Weaving,” Bamboo Craft Village adheres to the integrated development strategy of “Agriculture-Commerce-Culture-Tourism-Sports” to enhance local industrial quality. In 2024, it achieved remarkable economic revitalization with a bamboo industry output value of 75.11 million yuan, tourism revenue of 69.687 million yuan, and a per capita disposable income of rural residents reaching 38,500 yuan.
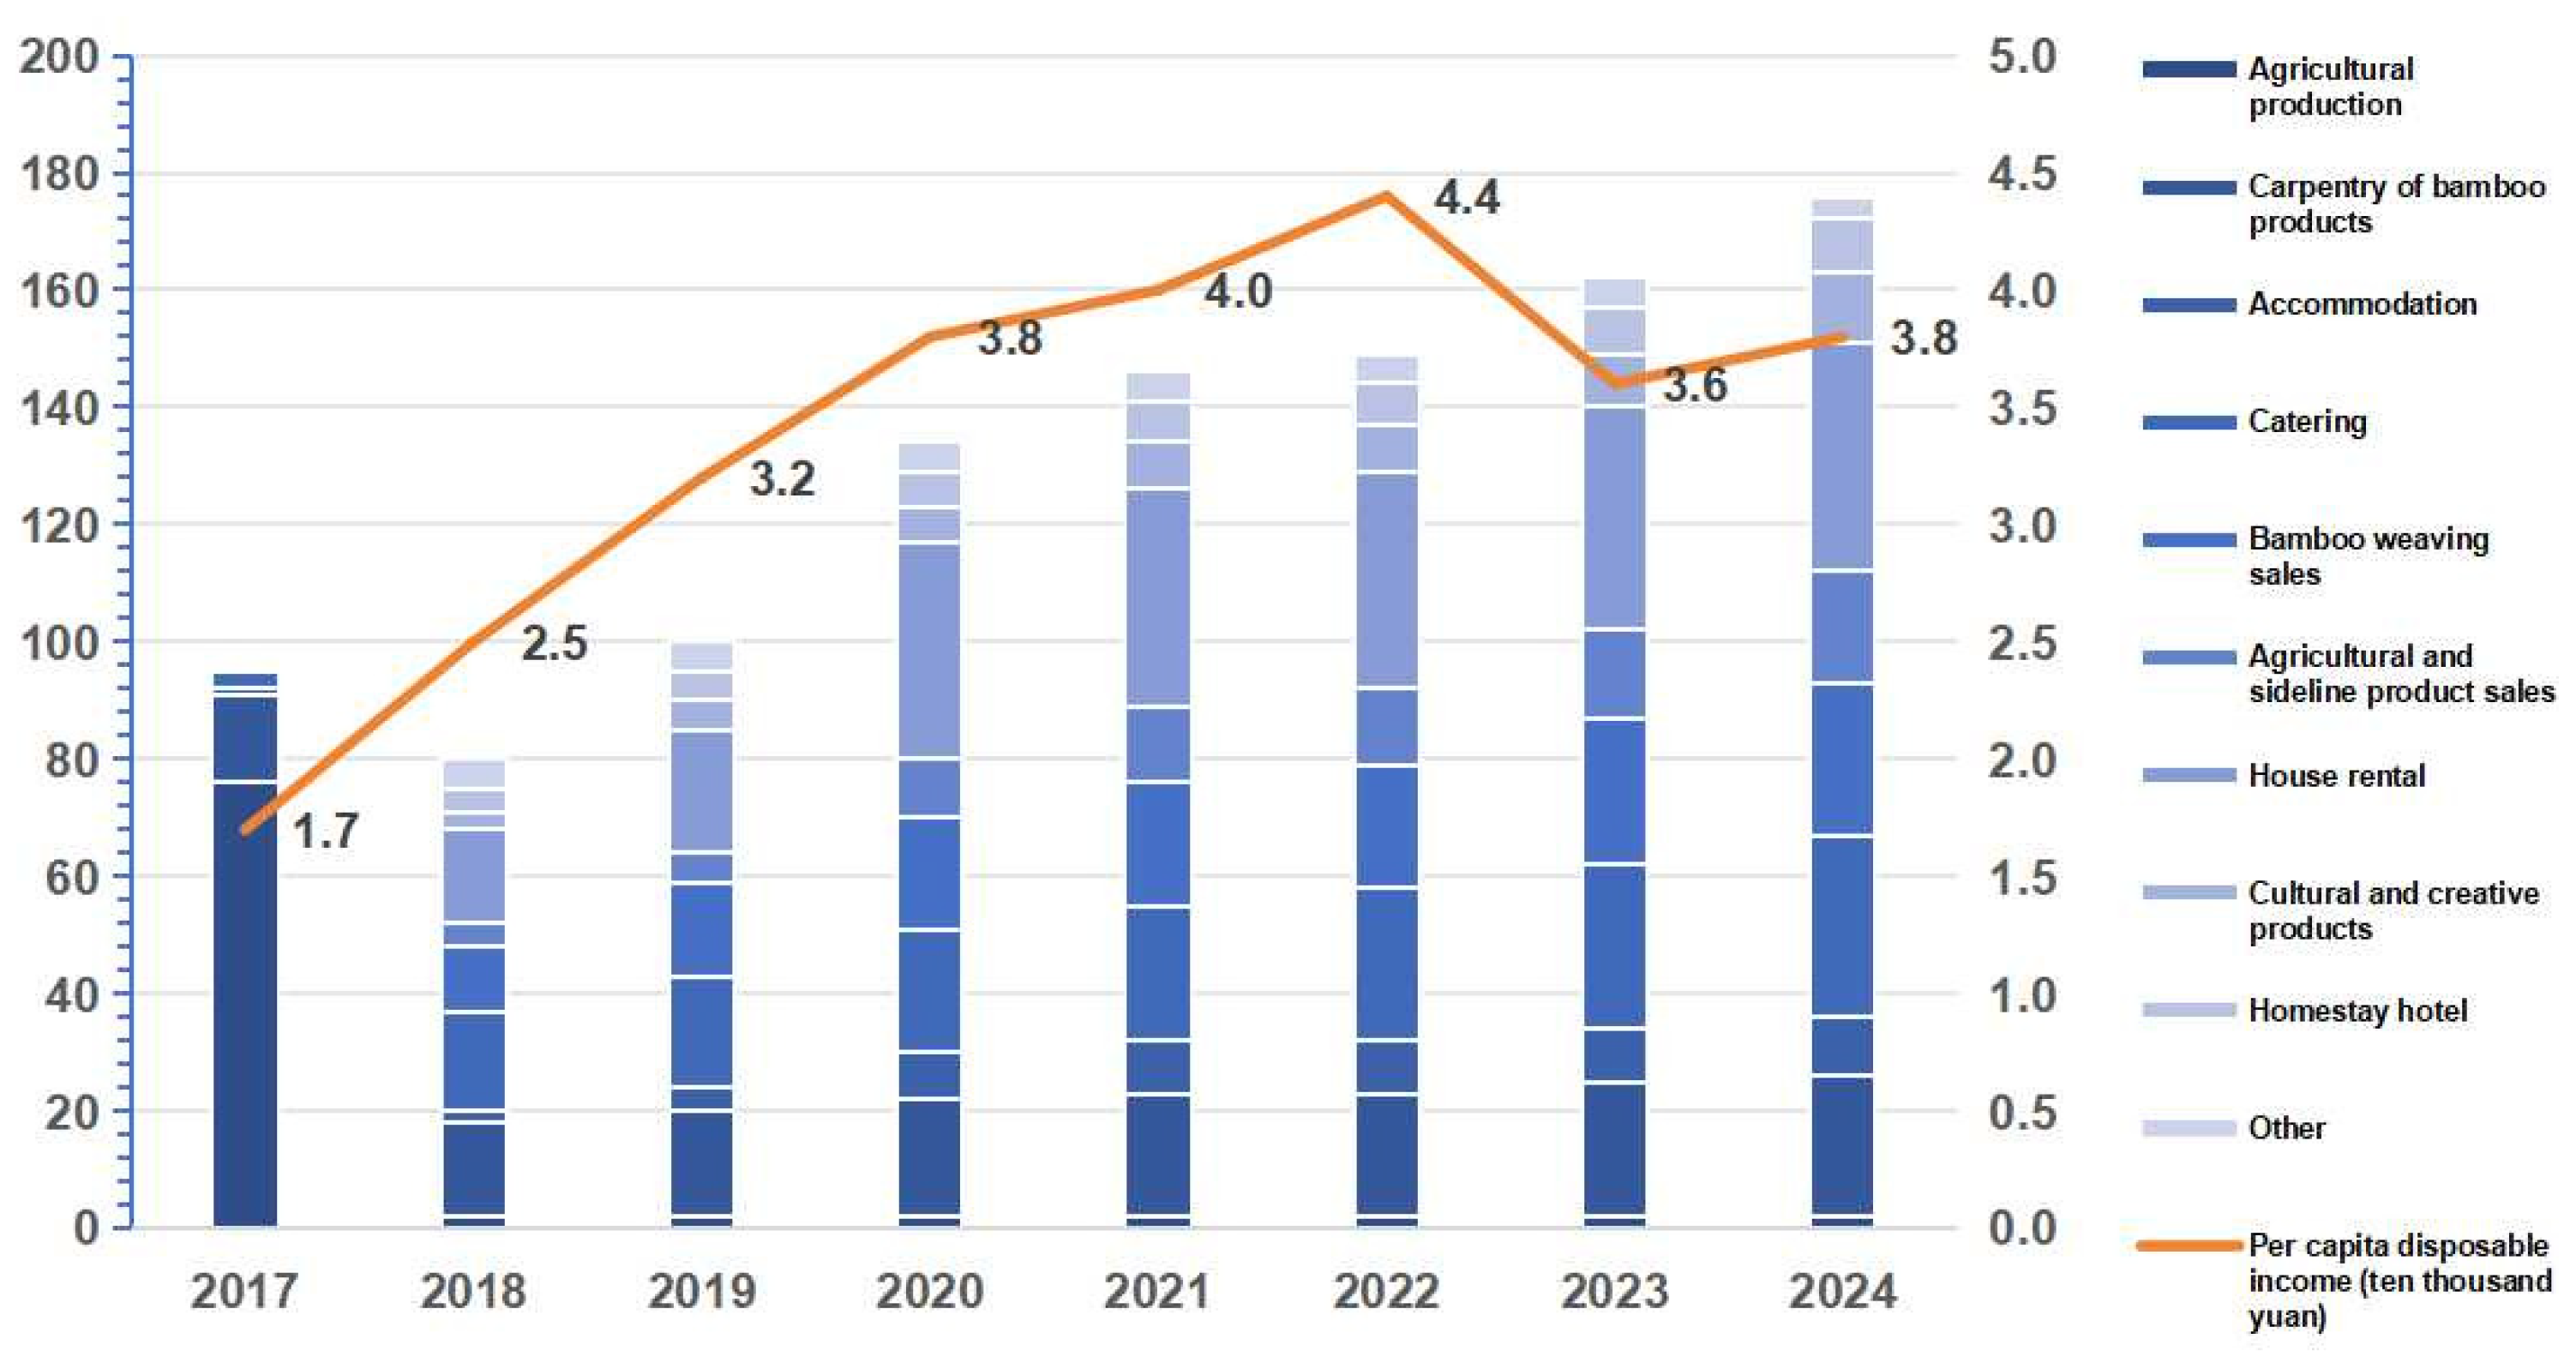
From the perspective of tourism development, the spatial pattern of this region exhibits a “core–periphery” gradient characteristic. The core area, adjacent to the tourism service center, has achieved income diversification and welfare effects through the “cooperative shareholding + tourism dividend” model. Meanwhile, the peripheral area, bordering the ecological conservation zone, has developed a distinctive path of “understory economy + ecotourism,” demonstrating the shaping effect of spatial heterogeneity on livelihood strategies (Figure 4). Based on the firsthand data collected during our field research, regarding farmers’ livelihood conditions, from 2017 to 2024, the number of agricultural production farmers in this region has decreased annually, while the number of farmers engaged in bamboo product processing, accommodation, and catering has increased year by year, driving 80% of farmers to start businesses or find employment. This reflects the upgrading of the rural economic structure and the diversification of operational income. Similarly, the per capita disposable income of rural residents increased from 17,000 yuan in 2017 to a peak of 44,000 yuan in 2022, experienced a slight decline during the COVID-19 pandemic and global economic fluctuations in 2023, and subsequently rebounded in 2024. These phenomena indicate that diversified business development can create more income channels for farmers, promote the enhancement of livelihood resilience, and drive the continuous development of the rural economy through “capacity building” (Figure 5).

2.2.2. Data Source

The data presented in this paper were derived from a household survey conducted in the study area between July and August 2024. During the preliminary research phase, the questionnaire underwent five rounds of revisions based on interviews with village officials and feedback from farmers, eliminating items with ambiguous semantics or those detached from practical contexts to ensure localized adaptability of the indicators. The final questionnaire comprised two main sections: basic household information and livelihood resilience, encompassing seven dimensions and 46 questions, with 39 indicators from the livelihood resilience system. In the formal survey phase, a stratified random sampling method was employed, taking into account spatial distribution and livelihood strategy differences, resulting in the collection of 305 valid questionnaires.

2.2.3. Reliability Tests

The sample size verification was conducted using the Finite Population Correction (FPC) model. At a 95% confidence level with a 5% margin of error, the theoretical minimum sample size was calculated to be 255. The actual sample size significantly exceeded this threshold, with a reverse-calculated actual error of only 4.1%, confirming the strong representativeness of the sample for the population.
Reliability testing was performed using Cronbach’s Alpha coefficient and Corrected Item-Total Correlation (CITC) analysis. The results indicated that the Cronbach’s Alpha coefficients for all dimensions were above 0.7, and the CITC values for all indicators ranged between 0.635 and 0.878. Furthermore, the deletion of any item did not significantly increase the α coefficient, demonstrating good internal consistency of the scale. Validity testing was verified through Exploratory Factor Analysis (EFA) and Confirmatory Factor Analysis (CFA). The results showed that the KMO value in EFA was 0.892, and Bartlett’s test of sphericity was significant (p < 0.001). After in-depth analysis using SPSS 26.0 software, the extracted factors from the questionnaire exhibited good explanatory power. In CFA, all standardized factor loadings were greater than 0.6, and the Composite Reliability (CR) and Average Variance Extracted (AVE) for each dimension met the required standards, indicating good composite reliability and construct validity.
Finally, a comparison was made between the square root of the AVE at the dimension level and the correlation coefficients between dimensions. As shown in Table 1, the internal correlations within dimensions were greater than the correlations between dimensions, demonstrating good discriminant validity of the data.
In summary, the questionnaire demonstrates rigorous structural logic and appropriate indicator selection through theoretical framework anchoring, field context calibration, and multiple rounds of data validation. The high reliability and validity test results ensure that the raw data possess both statistical robustness and theoretical explanatory power, thereby establishing an empirical foundation for subsequent measurements of farmers’ livelihood resilience and analysis of influencing factors.

2.2.4. Indicator System

Based on the livelihood resilience and livelihood sustainability analysis framework proposed by scholars, combined with the research topic and field investigation, Table 2 presents a farmers’ livelihood resilience indicator system consisting of 39 indicators across three dimensions, which is in line with the perspective of rural tourism. The framework meticulously specifies the proxy indicators, scoring methodologies, standardized weights, and directional orientations of each indicator [6,9,26,33,34].
  • Livelihood vulnerability encompasses both exposure and sensitivity [35]. By quantifying farmers’ vulnerability to external risks, the resilience deficiencies within livelihood systems can be identified. Exposure can be measured through indicators such as natural disaster resilience, medical expenditure shocks, price inflation rates, tourism operation difficulties, and the number of information reception channels [36]. Sensitivity can be assessed using indicators like willingness to adjust production methods, guaranteed income from land transfer, willingness to engage in tourism, dependence on tourism income, impact of relevant policies, and ecological environment conditions [37,38].
  • Livelihood adaptability includes both internal and external adaptability [39,40,41]. Farmers can respond to environmental changes through existing resources and external conditions, with this response capability or adaptability serving as the foundational energy within the active regulatory mechanisms of the resilience system. Internal adaptability can be measured using indicators such as livelihood diversity, durable consumer goods, proportion of migrant workers, and stability of migrant income. External adaptability can be assessed through indicators like agricultural livelihood risk perception, tourism livelihood risk perception, difficulty in obtaining loans, land dependence, tourism dependence, and resource conservation awareness.
  • Livelihood recuperability comprises buffering capacity, self-organization capability, and learning ability [6,9,26]. This dimension provides a core observation point for interpreting the resilience development path of rural farmers transitioning from subsistence maintenance to developmental leap in the context of rural tourism, achieved through material capital reorganization, social network activation, and learning capacity evolution. Buffering capacity can be measured using indicators such as planting scale, per capita residential area, per capita arable land area, land resource endowment, labor force quantity, and annual per capita household income. Self-organization can be assessed through indicators like leadership ability, community participation, neighborhood trust, cadre trust, community organization involvement, and market accessibility [42,43]. Learning ability can be evaluated using indicators such as education level, information attention, skill training opportunities, information comprehension ability, technical exchange capability, and policy demand response quantity [11].

2.3. Research Methods

  • Participatory rural appraisal (PRA). To ensure the acquisition of first-hand survey data with local authenticity and to establish a foundation for formulating contextually relevant policies, this study employs the Participatory Rural Appraisal (PRA) method during the data collection phase. PRA is a qualitative research approach centered on community empowerment, emphasizing local knowledge and two-way learning. Its core principle involves engaging farmers in active analysis through visual facilitation tools, enabling researchers and farmers to collaboratively identify challenges and development opportunities in a participatory process that fosters bottom-up community development [44].
  • Entropy weight method. Considering the internal information volume of the data and avoiding subjective human influence, this study standardized the data and then used the entropy method to assign different weights to each indicator [45].
    Calculate the exponential weight W :
    W = d j i = 1 n d j
  • Synthetical index method. To integrate multiple-dimensional indicators into a single index and achieve the overall quantification and horizontal comparability of resilience levels, this paper adopts the comprehensive index evaluation method to calculate the livelihood resilience index of farmers. The specific calculation method is as follows [18]:
① Calculate the index E i , S i , I A i , E A i , C i , O i , L i of each criterion layer for farmers’ livelihood resilience:
E i = j = 1 5 W j   P i j ,   S i = j = 1 6 W j   P i j ,   I A i = j = 1 4 W j   P i j ,   E A i = j = 1 6 W j   P i j , C i = j = 1 6 W j   P i j ,   O i = j = 1 6 W j   P i j ,   L i = j = 1 6 W j   P i j
In this context, E i , S i , I A i , E A i , C i , O i , and L i respectively represent the exposure level, sensitivity, internal adaptability, external adaptability, buffering capability, self-organization capability and earning capability of the farmers in the i-th row sample.
② Calculate the livelihood resilience index of farmers L R i :
L R i = E i + S i + I A i + E A i + C i + O i + L i
In this context, LRi represents the index of farmers’ livelihood resilience for the i-th sample. When conducting a comparative analysis of the livelihood resilience of different types of farmers, the average value of farmers’ livelihood resilience for each type is used [27].
4.
Grey relational degree model. To identify the key factors influencing farmers’ livelihood resilience based on small sample data, this study adopts the grey relational degree method. This method can be used to integrate the factors affecting farmers’ livelihood resilience, provide strategies or plans for sustainable livelihood development, and enhance the scientificity and effectiveness of decision-making [27,28,46]. The relational degree, ranging from 0 to 1, quantifies the intensity of each factor’s impact on rural farmers’ livelihood resilience, with values approaching 1 indicating stronger correlations.
① Calculate the relation coefficient P i ( k ) :
P i ( k ) = min i   min k x 1 x i ( k ) + ρ max i   max k x 1 x i ( k ) x 1 x i ( k ) + ρ max i   max k x 1 x i ( k )
In this context, ρ denotes the distinguishing coefficient, whose value ranges between 0.1 and 0.5. In this study, the conventional value of 0.5 has been adopted as the standard parameter.
② Calculate the grey relational degree R 0 i :
R 0 i = 1 n k = 1 n r 0 i ( k )
In the context, P i ( k ) represents the relation coefficient between the comparative sequence and the reference sequence; R 0 i denotes the degree of relation between the two sequences. According to relevant literature [6,9], a strong relation is defined when the relation degree exceeds 0.7; a moderate relation is defined within the range of 0.35 to 0.7 (inclusive); and a weak relation is defined within the range of 0 to 0.35 (inclusive).
5.
Obstacle degree mode. To quantify the degree of obstacles and precisely identify the key factors restricting the improvement of resilience, this study employs the obstacle degree model to calculate the influence of each indicator on the livelihood resilience level of farmers [46,47,48,49,50]. The calculation formula is as follows:
① Calculate the deviation of the indicators I i j :
I i j = 1 x i j
In this context, I i j denotes the indicator deviation degree, which represents the discrepancy between an individual indicator and the optimal target value, specifically the difference between the standardized value of the individual indicator ‘ x i j ’ and unity.
② Calculate indicator obstacle degree O j :
O j = I i j × a j / j = 1 n I i j × a j     100 %
In this context, O j denotes the obstacle degree, representing the extent to which the j-th indicator impedes livelihood resilience; a j signifies the factor contribution degree, indicating the impact level of the j-th indicator on livelihood resilience, specifically the weight of the j-th indicator in determining rural farmers’ livelihood resilience.

3. Results

3.1. Classification of Farmers Based on Different Livelihood Types

3.1.1. Criteria and Classification

  • Classification of Household Livelihood Types. In economics, livelihood patterns, sources of household income, and income composition are often employed as critical indicators for classifying household livelihood types [51,52]. Based on ten categories of income data provided by local governments in the study area, including agricultural production, bamboo product processing, and tourism accommodation [14], Table 3 categorizes the sample into four livelihood types: labor-driven (40.00%) > tourism-driven (24.92%) > composite livelihood (20.65%) > agriculture-driven (14.43%). The results indicate that wage-earning remains the predominant livelihood strategy among farmers, while the tourism-dominant type accounts for a limited proportion, reflecting that rural tourism in the area is still in its developmental phase and has not yet reached maturity, with insufficient infrastructure and industrial scale constraining its employment absorption capacity. However, the combined proportion of tourism-driven and composite livelihood farmers is relatively high, while that of the farming-oriented type is significantly low. This indicates that under the impetus of the new collective economic system and land transfer policies, farmers’ livelihoods are showing a trend of diversification, and their decision-making behaviors are gradually approaching that of “rational small farmers”. It also further reflects the improvement of the endogenous development capacity of rural areas [13].
  • Based on existing literature [53,54,55], Table 4 categorizes the sample farmers into two groups: participants and Non-participants, according to their involvement in tourism activities. Field research demonstrates that rural tourism not only enhances the economic benefits of participating farmers but also generates comprehensive improvement effects on the local ecological, social, and economic environments. Furthermore, a comparative analysis of livelihood resilience levels between these two groups of farmers facilitates the verification of the specific impacts of rural tourism development on farmers’ livelihood resilience.

3.1.2. Characteristics of Farmers with Different Livelihood Types

Table 5 presents the fundamental characteristics of farmers with different livelihood types, clearly demonstrating that livelihood differentiation not only reflects economic rationality but also mirrors the structural tensions in rural social transformation [56,57,58]. Firstly, annual farmers’ income per capita, as a core variable measuring economic welfare, shows significant differences across livelihood types. Tourism-driven farmers exhibit an income of 86,200 yuan, far exceeding the 53,700 yuan of non-tourism farmers, directly confirming the income-boosting effect of tourism in rural development [8]. However, this income advantage needs to be objectively evaluated in conjunction with other characteristics. Tourism-driven farmers have the smallest planting scale at 0.91 square meters among all livelihood types, suggesting a livelihood strategy that reduces agricultural dependence and instead relies on the value-added creation of tourism services [1]. In contrast, agriculture-driven farmers, with a larger planting scale of 3.22 mu, have an income of only 63,700 yuan, reflecting the marginal profit limitations of traditional agriculture and highlighting the necessity of industrial upgrading [56].
Secondly, the per capita residential area and the figures of labor allocation reflect the social well-being of the livelihood transformation. The per capita residential area of farmers driven by tourism and those participating in tourism is 59.75 m2 and 62.50 m2 respectively, which is higher than that of non-participating farmers in tourism, which is 53.44 m2. This may be due to the high requirements of tourism activities for the living environment. However, in terms of the number of laborers, non-participating in tourism farmers have 2.45 people, which is higher than the 1.73 people of tourism-driven farmers. This indicates that non-tourism farmers may rely more on internal family labor input for agriculture, while tourism farmers may integrate resources through external markets [33]. The proportion of migrant workers is the highest in labor-driven, reaching 2.79. Combined with their relatively high guaranteed income from land transfer of 559.03 yuan per mu, it shows that migrant workers’ farmers achieve income diversification through labor outflow and land assessment, but this may also lead to the hollowing out of rural labor force [26].
Finally, composite livelihood farmers have an income of 80,600 yuan, close to tourism-driven farmers, and a planting scale of 2.84 mu, comparable to labor-driven farmers, reflecting the robustness of diversified livelihood strategies [22]. This type of livelihood strategy balances agricultural and non-agricultural livelihood behaviors to some extent, more likely enhancing farmers’ livelihood resilience to adapt to rural risk environments [59,60].

3.2. Analysis of Resilience Measurement Results for Farmers of Different Livelihood Types

3.2.1. Comparing the Livelihood Resilience of Different Farmer Typologies

Referring to the fuzzy determination of the level of livelihood resilience in relevant literature [13,61,62], most scholars in their research have judged an index value around 0.25 as a low level of resilience, around 0.5 as a medium level, and around 0.75 as a high level. Therefore, this study will adopt this fuzzy determination method and judge the measured livelihood resilience index of 0.5346 for the sample farmers as a medium level of resilience (Table 6). The performance of each dimension is as follows: vulnerability > adaptability > recuperability, with vulnerability making the greatest contribution to the livelihood resilience index. Further analysis reveals that the current livelihood resilience system is dominated by risk resistance, indicating that farmers’ livelihoods are more focused on reducing vulnerability to cope with risks rather than relying on adaptability or recuperability. From the data, the vulnerability index (0.1953) in the total sample is higher than adaptability (0.1791) and recuperability (0.1602), and it accounts for the largest proportion of the total resilience value (about 36.5%), which directly supports the core position of risk resistance in the composition of resilience.
The livelihood resilience of different types of farmers varies significantly, with the ranking being: tourism-driven (0.5560) > composite livelihood (0.5429) > labor-driven (0.5358) > agriculture-driven (0.5035). Firstly, the highest resilience of the tourism-driven type (0.5560) presents a typical paradox of “high recuperability—high vulnerability”. Its recuperability (0.1760) is significantly higher than that of the agriculture-driven type (0.1327), which essentially lies in the fact that the tourism-based livelihood relies on the market, information, and social networks, endowing farmers with stronger buffering capital, self-organization, and earning capacity to cope with external changes [8]. However, its highest vulnerability (0.1979) precisely exposes the extreme sensitivity of this model to macroeconomic fluctuations, public health events, and other external shocks, creating a contradictory state of “high agency” and “high exposure” [7]. Secondly, the moderate resilience of the composite livelihood (0.5429) and labor-driven (0.5358) types reflects a trade-off between risk diversification and capital structure. The composite livelihood has the highest vulnerability (0.2053), but its recuperability (0.1632) is still acceptable because it has diversified its risks through a diversified strategy [6], yet due to resource dispersion and path dependence, it may have weakened its adaptability (0.1744) for active transformation. The labor-driven type achieves the lowest vulnerability (0.1868) by relying on relatively stable wage income, but due to the rigid constraints of the external job market, its adaptability and recuperability have limited room for improvement. Finally, the lowest resilience of the agriculture-driven type (0.5035) is mainly due to its extremely low recuperability (0.1327). This profoundly reflects the deep dependence of traditional agriculture on natural conditions and policies, slow capital accumulation, and homogenized social networks, which makes it difficult for the system to effectively reorganize and recover after being impacted [60].
Overall, the enhancement of livelihood resilience is not a linear process but rather the result of a dynamic interplay among vulnerability, adaptability and recuperability. While a single livelihood model may excel in one dimension, a diversified strategy is more conducive to achieving resilience optimization.

3.2.2. Analysis of the Vulnerability Dimension

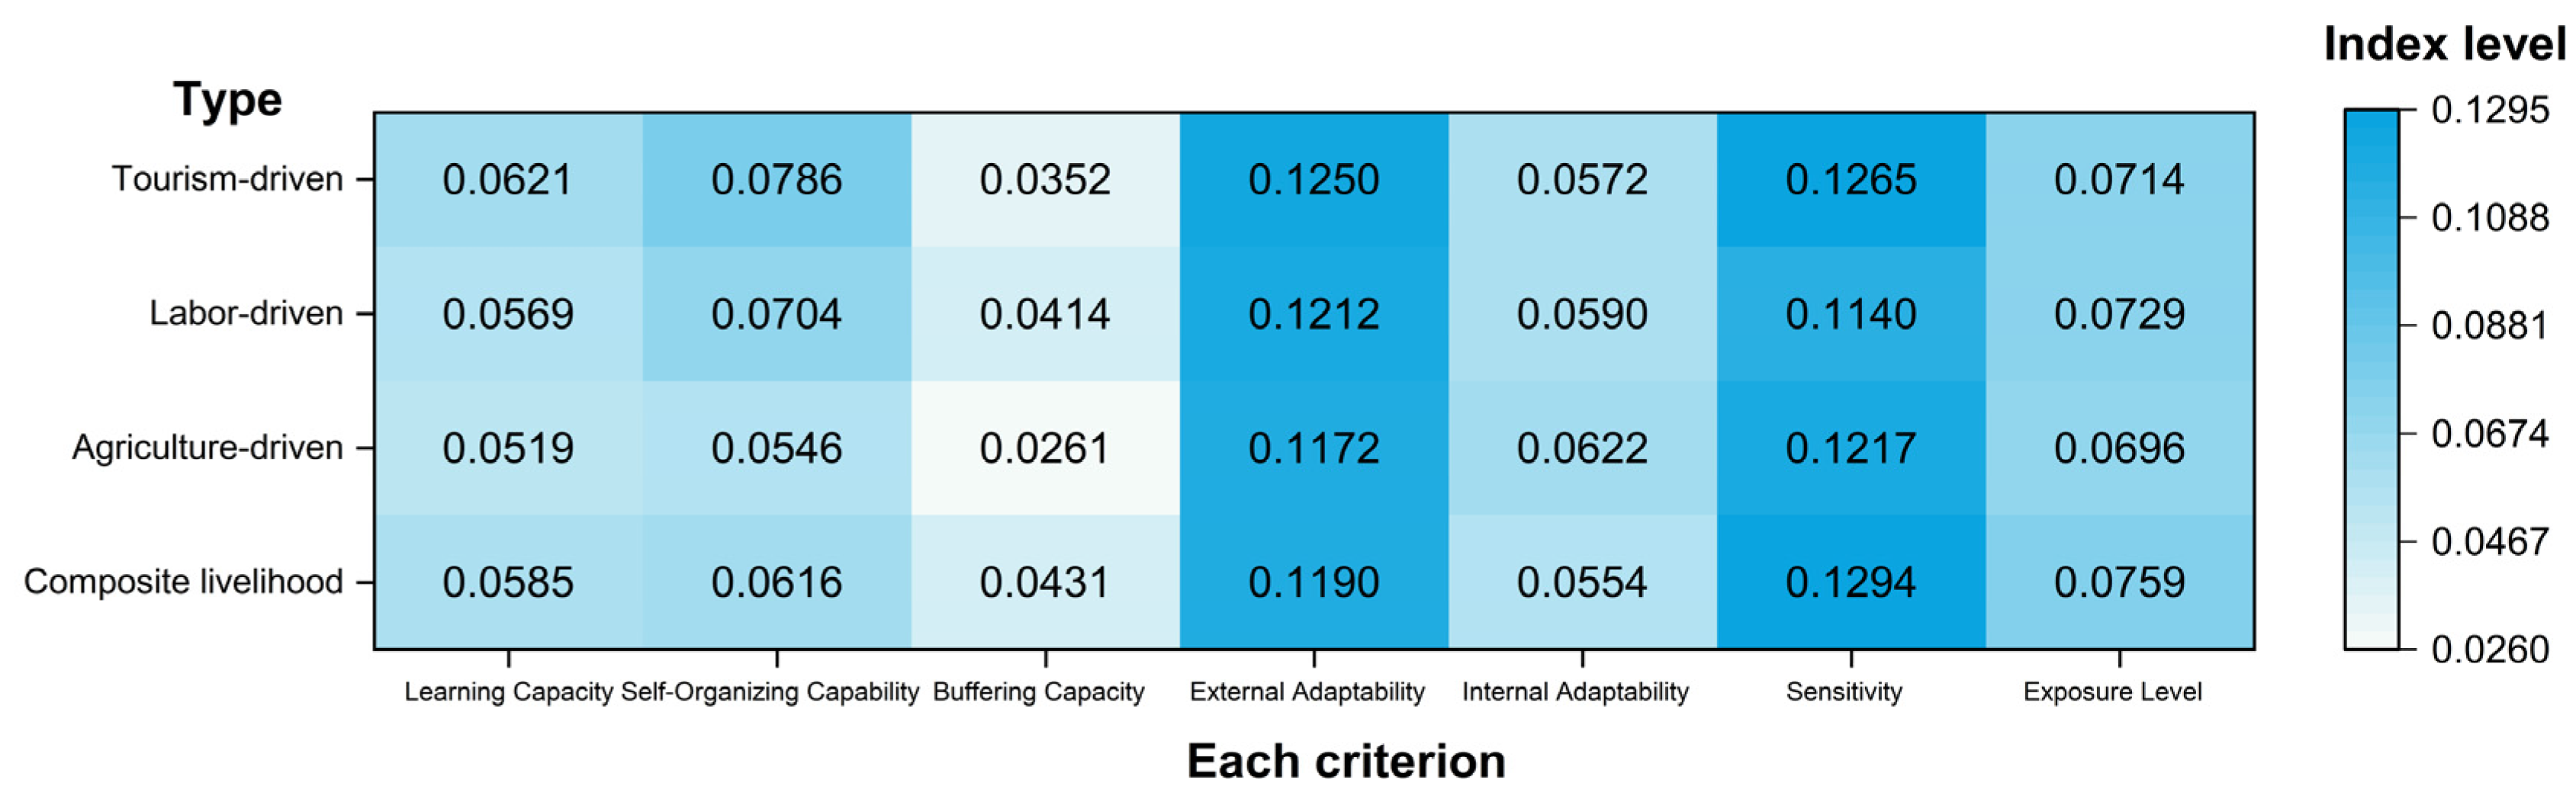
Figure 6 below presents seven aspects within three dimensions. In the vulnerability dimension, the sensitivity index of composite livelihood farmers is as high as 0.1294, and the exposure level index is 0.0759, with a total of 0.2053, significantly higher than other types. This high vulnerability not only stems from the increased risk exposure points due to diversified livelihoods but more crucially, the coupling among various livelihood activities amplifies systemic risks. For instance, the superposition of agriculture and tourism may cause price fluctuations and policy changes to be transmitted through multiple channels, leading to the accumulation of sensitivity [58]. The sensitivity index of labor-driven farmers is the lowest at 0.1140. Although the exposure level is relatively high at 0.0729, stable wage income reduces the response intensity of the livelihood system to a single shock, demonstrating the effectiveness of its risk buffering mechanism. The exposure level of agriculture-driven farmers is the lowest at 0.0696, reflecting their relative isolation. However, the sensitivity is as high as 0.1217, revealing the inherent dependence of traditional agriculture on climate or market fluctuations, making vulnerability prone to outbreak through sensitive links even under low exposure [50]. The essence of vulnerability lies in the inherent risk transmission mechanism of the livelihood structure. The high value of composite livelihood precisely reflects that in the absence of coordinated management; diversified strategies may instead intensify the overall system’s sensitivity [63,64,65].

3.2.3. Analysis of the Adaptability Dimension

In terms of adaptability, the external adaptability index of tourism-driven farmers reached 0.1250, the highest among all types, highlighting their efficient response to external environmental changes. This advantage is rooted in the continuous market interaction of the tourism industry [66], where farmers accelerate strategy iteration through frequent information exchange. However, their internal adaptability is only 0.0572, indicating their reliance on external resource input and a relatively weak internal regulatory foundation. In contrast, agriculture-driven farmers present an opposite pattern, with the highest internal adaptability of 0.0622, reflecting the steady-state regulation based on traditional experience accumulation [43]. However, the external adaptability is relatively low at 0.1172, suggesting that the closed livelihood model limits their ability to integrate new resources and technologies. The total adaptability of composite livelihood farmers is 0.1744, which is relatively low, with neither their external adaptability at 0.1190 nor their internal adaptability at 0.0554 being particularly prominent. This indicates that diversification does not automatically translate into adaptability advantages, possibly due to the increased coordination costs resulting from resource dispersion, which weakens the overall dynamic adjustment efficiency. The deep logic of adaptability lies in the synergy of internal and external capabilities. The leading position of tourism-driven farmers lies in the consistency of converting external learning into internal action, rather than the strength of a single dimension [67,68,69].

3.2.4. Analysis of the Recuperability Dimension

In the dimension of recuperability, the total recuperability of tourism-driven farmers, at 0.1760, ranks first. Among them, earning capability (0.0621) and self-organization capability (0.0786) stand out, thanks to the social networks and technological exchanges driven by tourism, which enhance the ability to reorganize knowledge and take collective actions aftershocks. However, its buffering capability is only 0.0352, indicating that recuperability is more dependent on dynamic capabilities rather than static resource reserves [70]. Composite livelihood farmers have the strongest buffering capability at 0.0431, due to the redundancy provided by diversified assets, but their earning capability (0.0585) and self-organization capability (0.0616) are moderate, suggesting that their recuperability focuses more on passive buffering rather than active innovation [71]. The recuperability of agriculture-driven farmers is the lowest at 0.1327, with a buffering capability of only 0.0261, and both self-organization capability (0.0546) and earning capability (0.0519) are weak, revealing that a single livelihood leads to resource scarcity and a lack of community linkage, which restricts system resilience [40]. Labor-driven farmers have a relatively high buffering capability of 0.0414, but their earning capability is average, reflecting that stable income provides a basic buffer but lacks the impetus for continuous improvement [38]. The core of recuperability lies in the dynamic balance of buffering, learning, and self-organization, and the advantage of tourism-driven lies in integrating these elements into a positive feedback loop that enhances resilience.
Considering the three dimensions, farmers’ livelihood resilience shows deep differentiation, which is essentially the dynamic interaction result of livelihood strategies and resource integration. Livelihood resilience is by no means a simple addition of dimensions, but rather a nonlinear interaction among vulnerability, adaptability and recuperability. To optimize the livelihood portfolio, it is necessary to go beyond superficial diversity, focus on reducing sensitivity to block risk transmission, enhance the synergy of internal and external adaptation to improve response efficiency, and strengthen learning and self-organization to build a sustainable risk-resistance system [72,73].

3.2.5. Analysis and Comparison of the Livelihood Resilience of Farmers Based on Different Levels of Participation

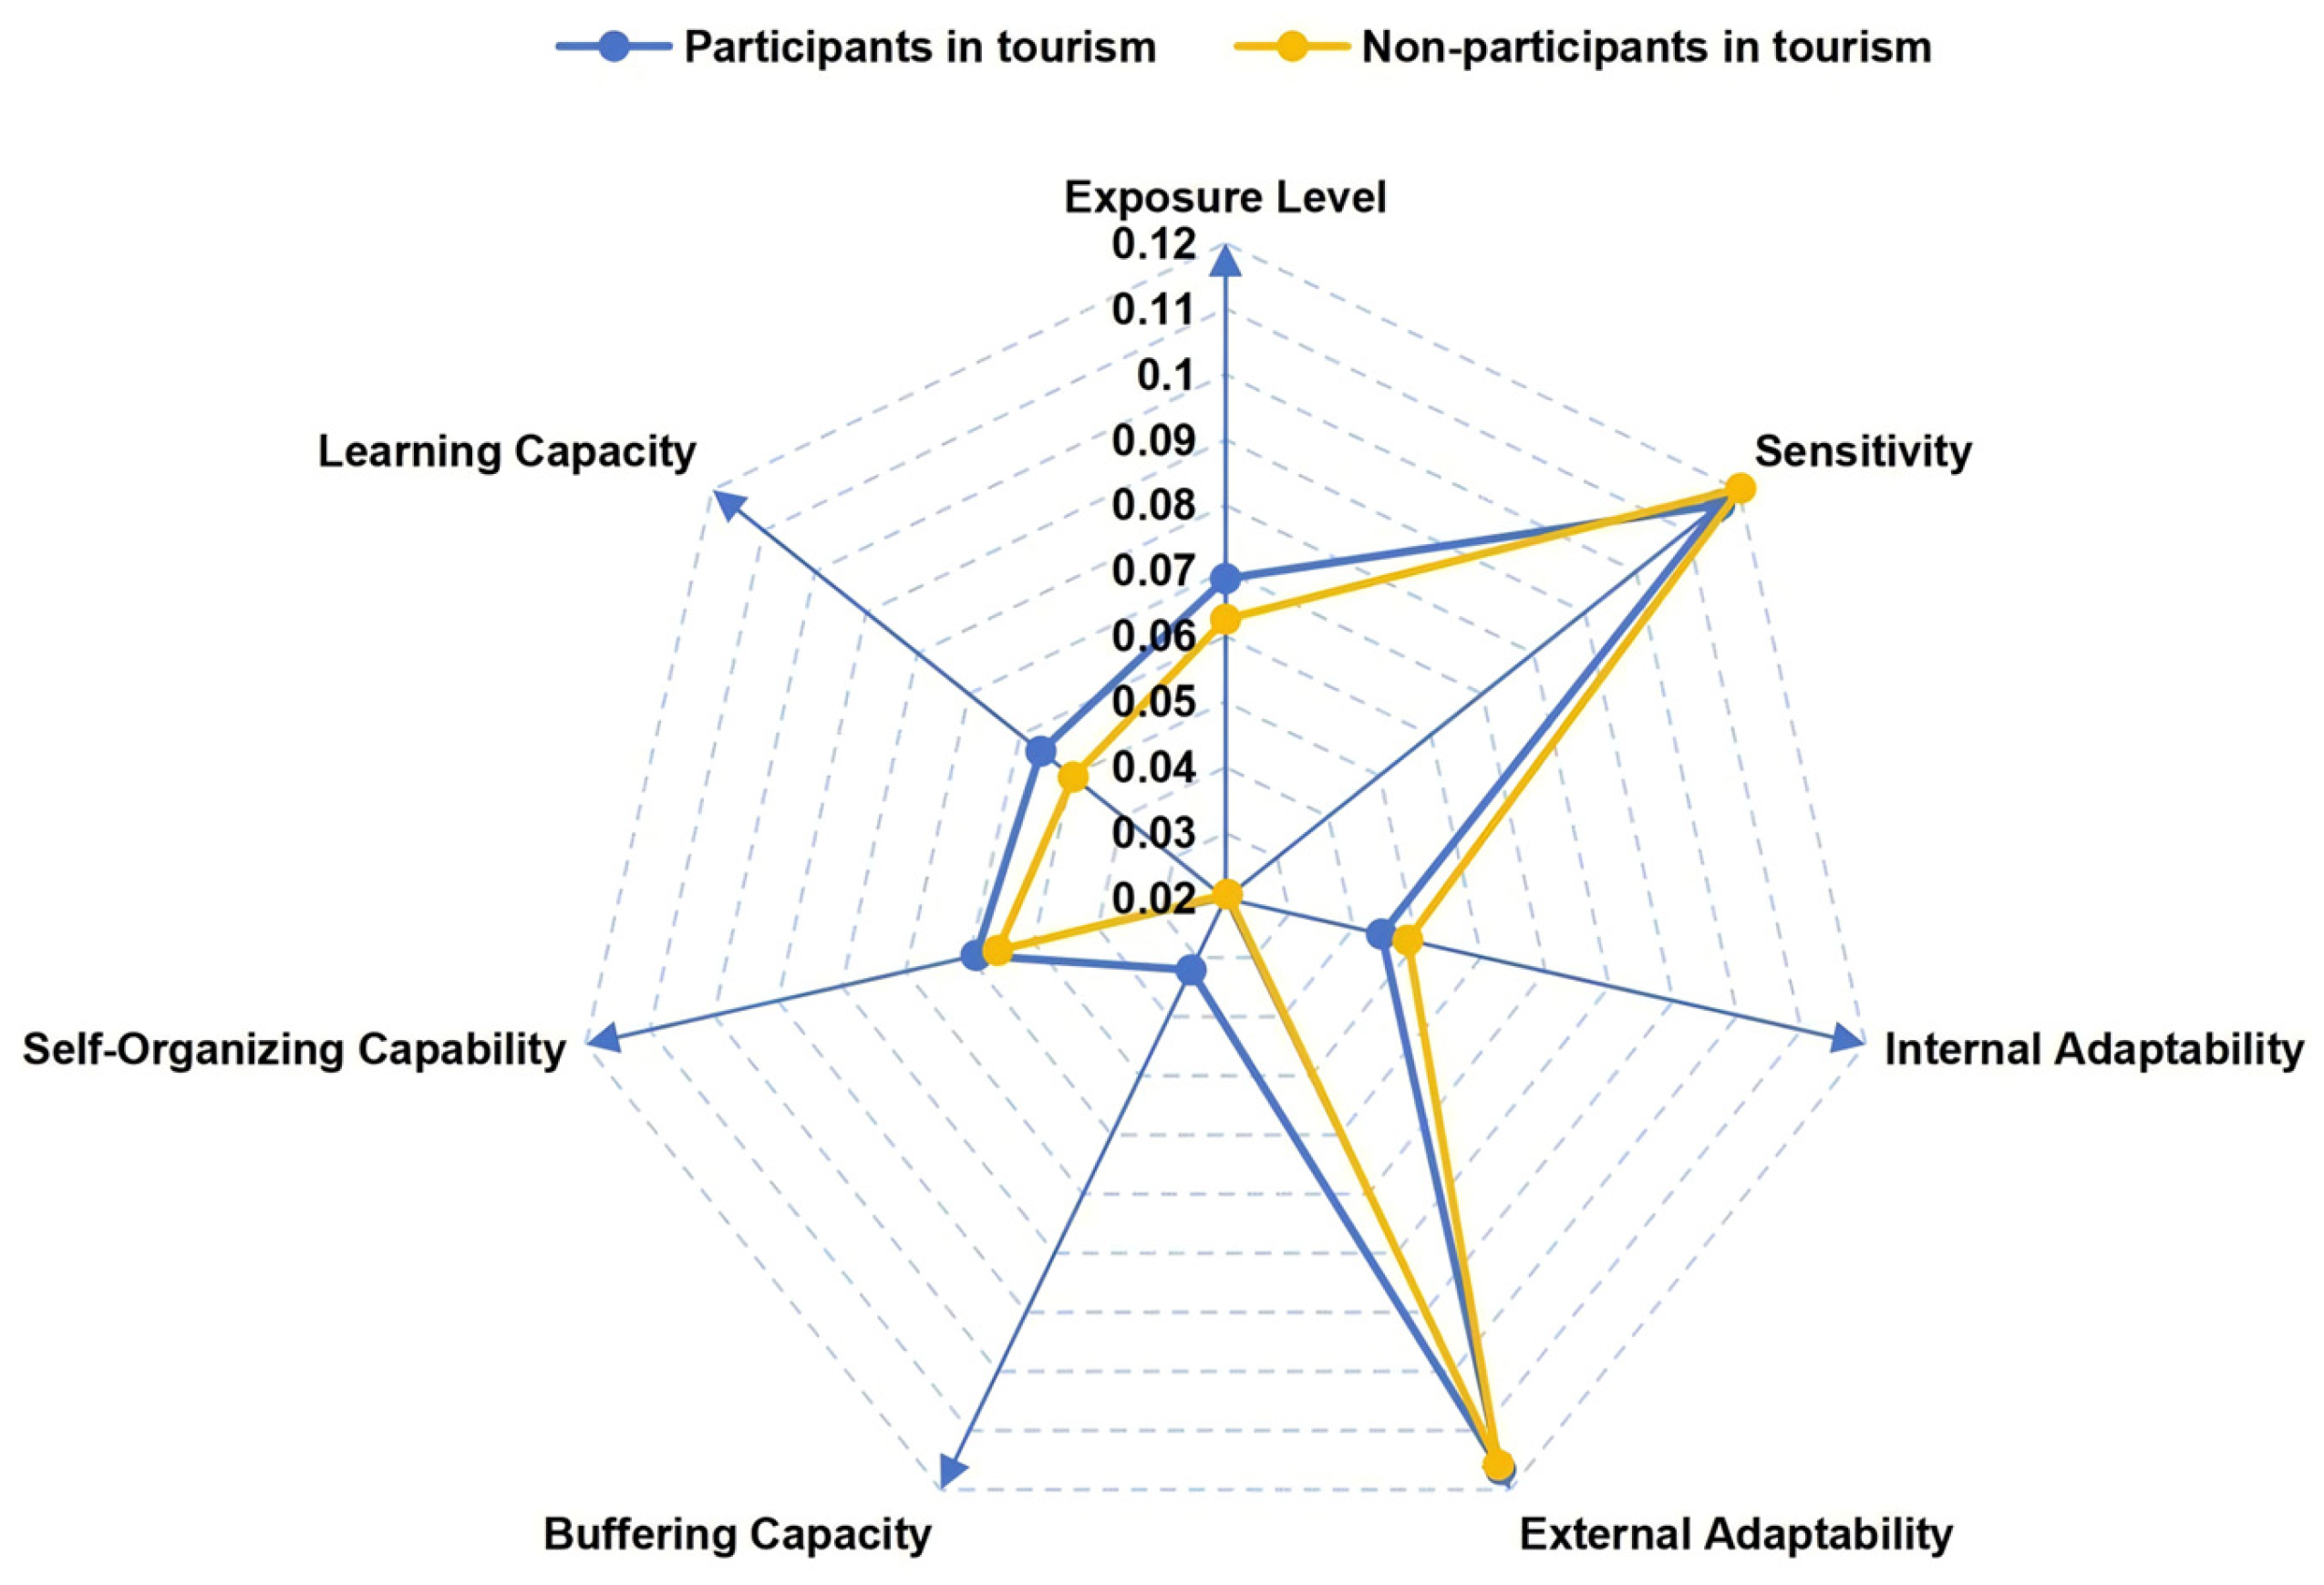
Based on the radar chart in Table 7, it is visually revealed that the polygonal contour of farmers participating in tourism has expanded outward overall, with a larger area, corresponding to a higher resilience index of 0.4932. The polygon of non-participating farmers has shrunk inward, with a resilience index of 0.4719. This 0.0213 gap mainly stems from the recuperability dimension, where the recuperability index of participating farmers at 0.1471 is significantly higher than that of non-participating farmers at 0.1245, which is the key to their overall advantage (Figure 7). Specifically, in terms of sub-dimensions, farmers participating in tourism have shown significant expansion in buffering capability, self-organization capability, and earning capability. This indicates that tourism activities have accumulated material buffers through diversified income, strengthened collective collaboration and knowledge acquisition through social networks, and directly enhanced their proactive ability to cope with shocks [37]. At the same time, the sensitivity dimension has converged inward, reflecting the improvement of their risk identification and management mechanisms, forming a resilient structure that is both offensive and defensive. Non-participating farmers in tourism have a slight advantage in internal adaptability, with an adaptability index of 0.1643 slightly higher than that of participating farmers at 0.1610, which is due to the steady-state inertia of the traditional livelihood model. However, the radar chart shows that they have converged inward in external adaptability and self-organization and other dynamic dimensions, indicating that static stability has not been transformed into dynamic adaptability. Their polygonal shape exposes the innovation bottleneck caused by the path dependence of the livelihood, such as single resources and weak social capital, which limits their flexibility in responding to changes [36].
Fundamentally, participating tourism farmers have promoted a virtuous cycle of learning and self-organization by embedding in a broader economic network, transforming exposure into adaptive power; while non-participating farmers in tourism are trapped in the inherent model, with the lack of dynamic capabilities restricting the improvement of their resilience.

3.3. The Key Factors and Obstacles Affecting Farmers’ Livelihood Resilience

3.3.1. Identification of Multi-Level Key Factors

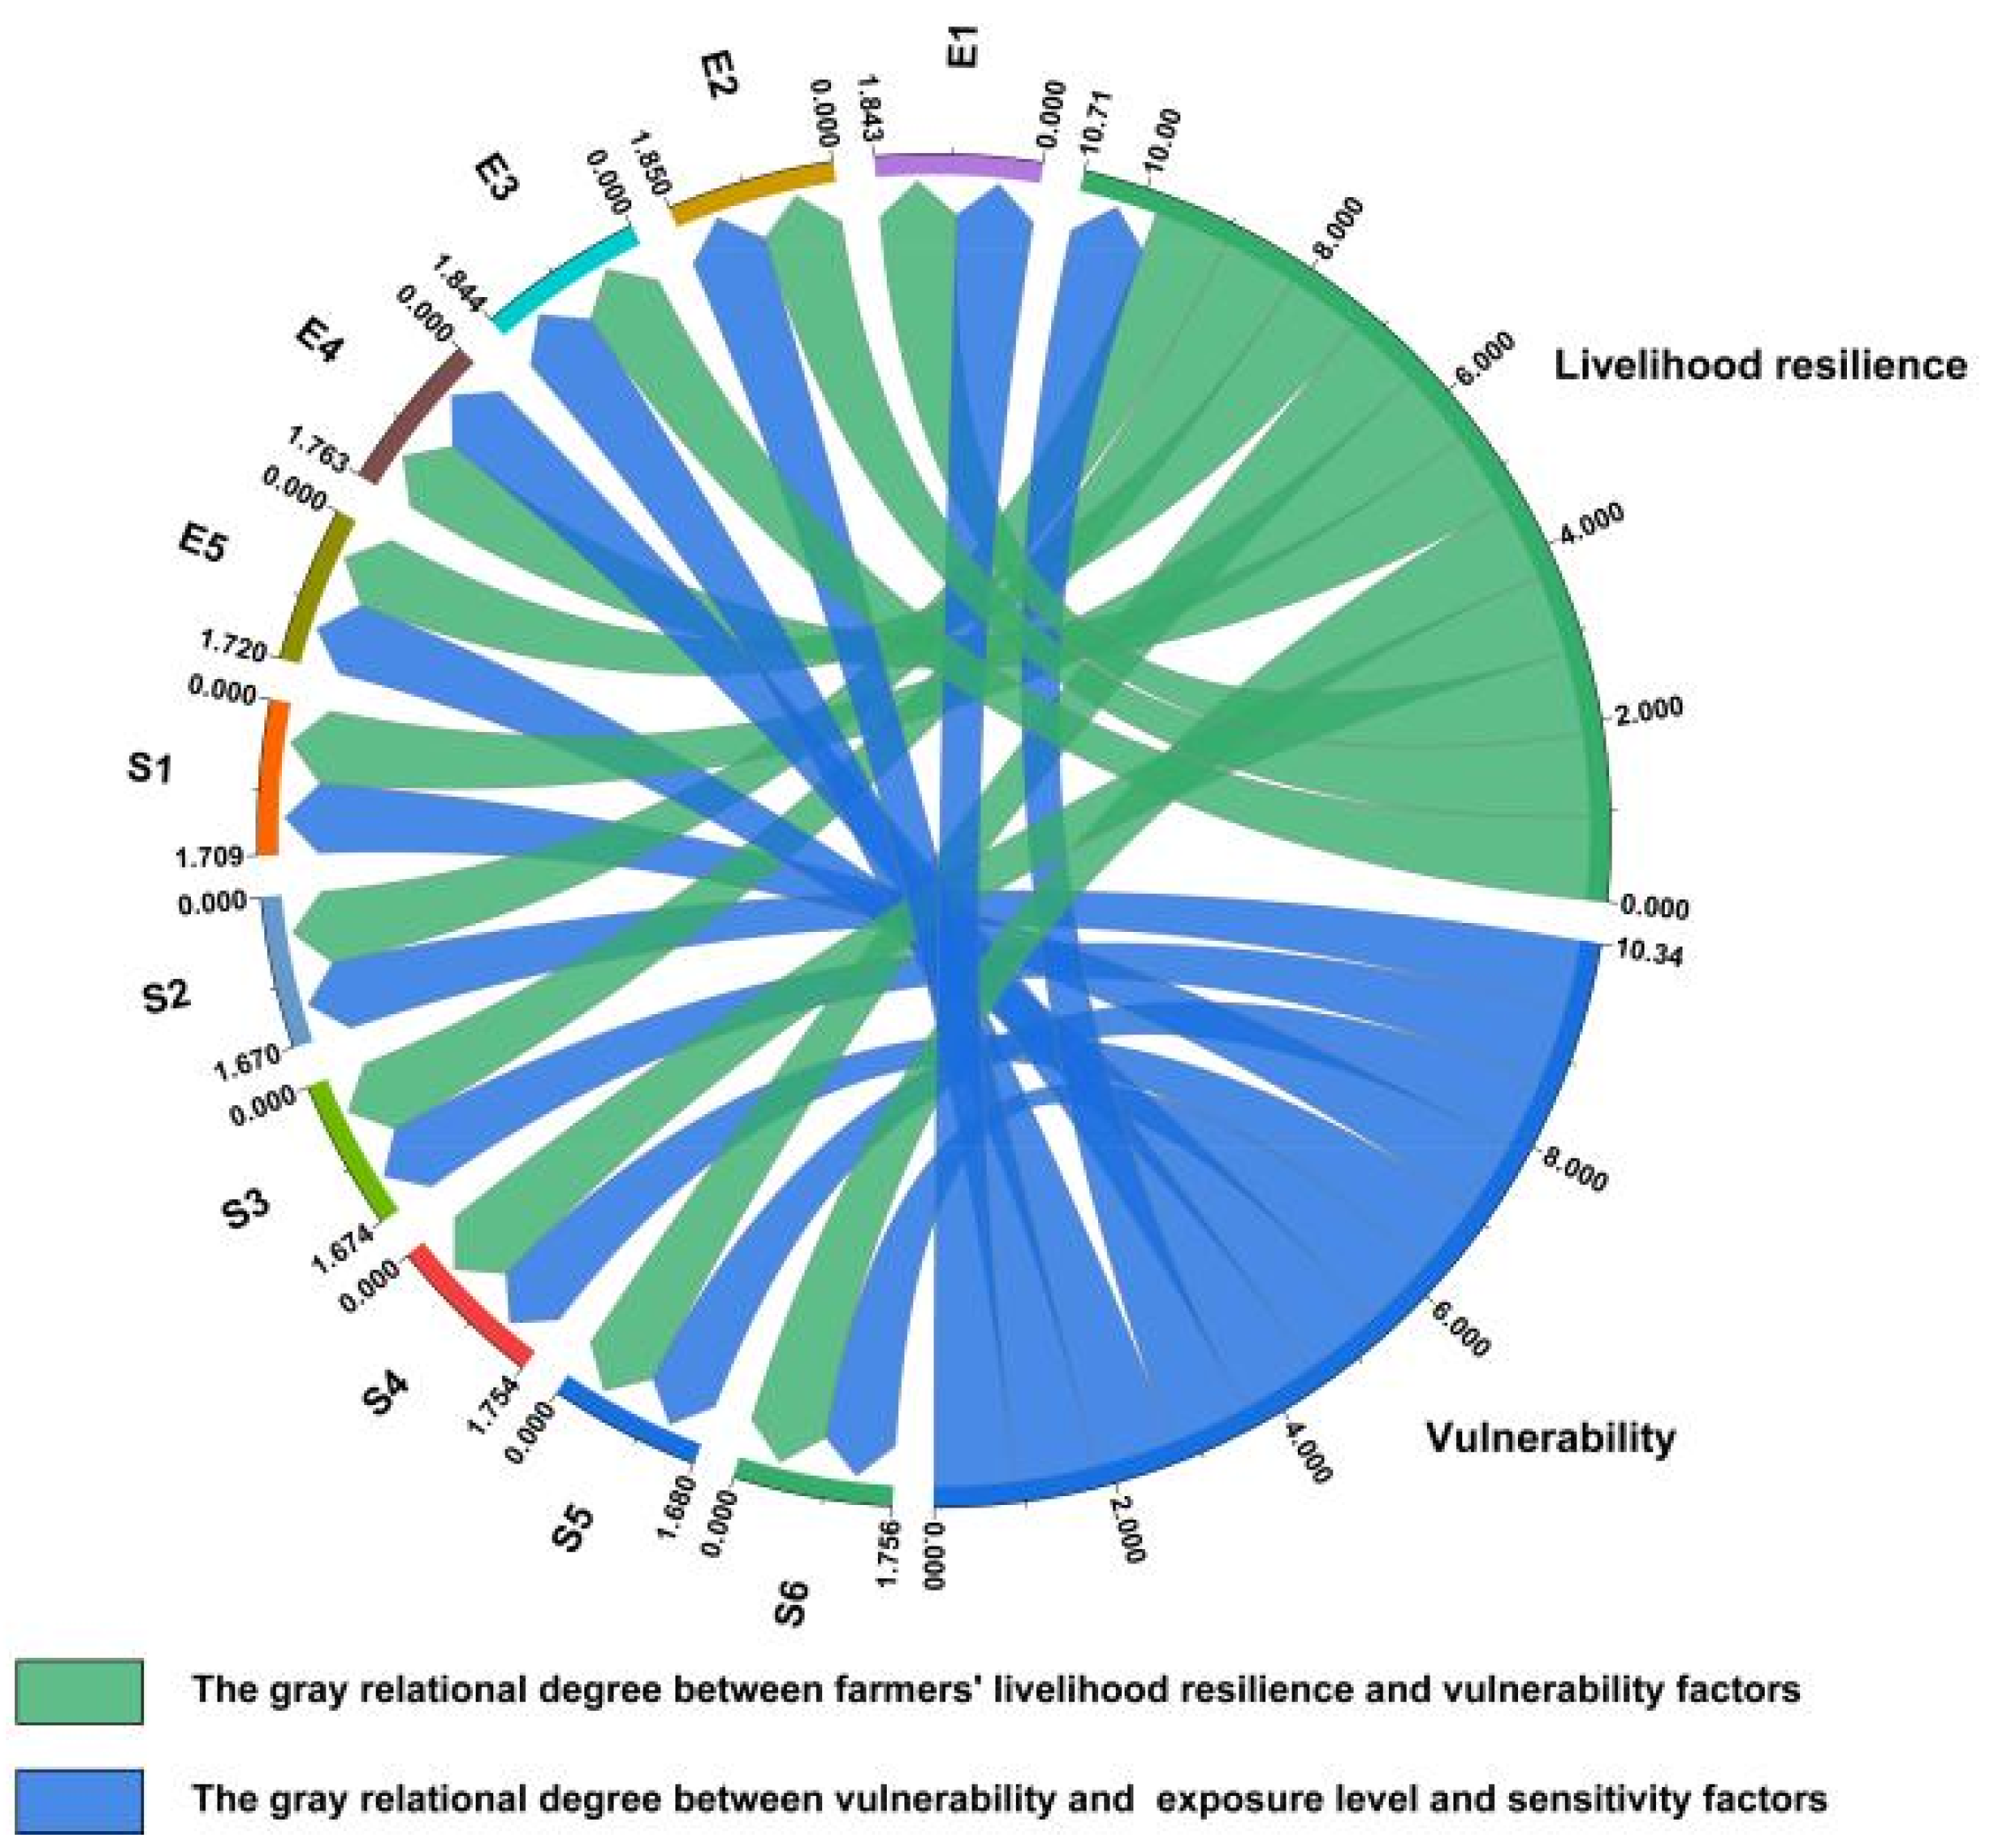
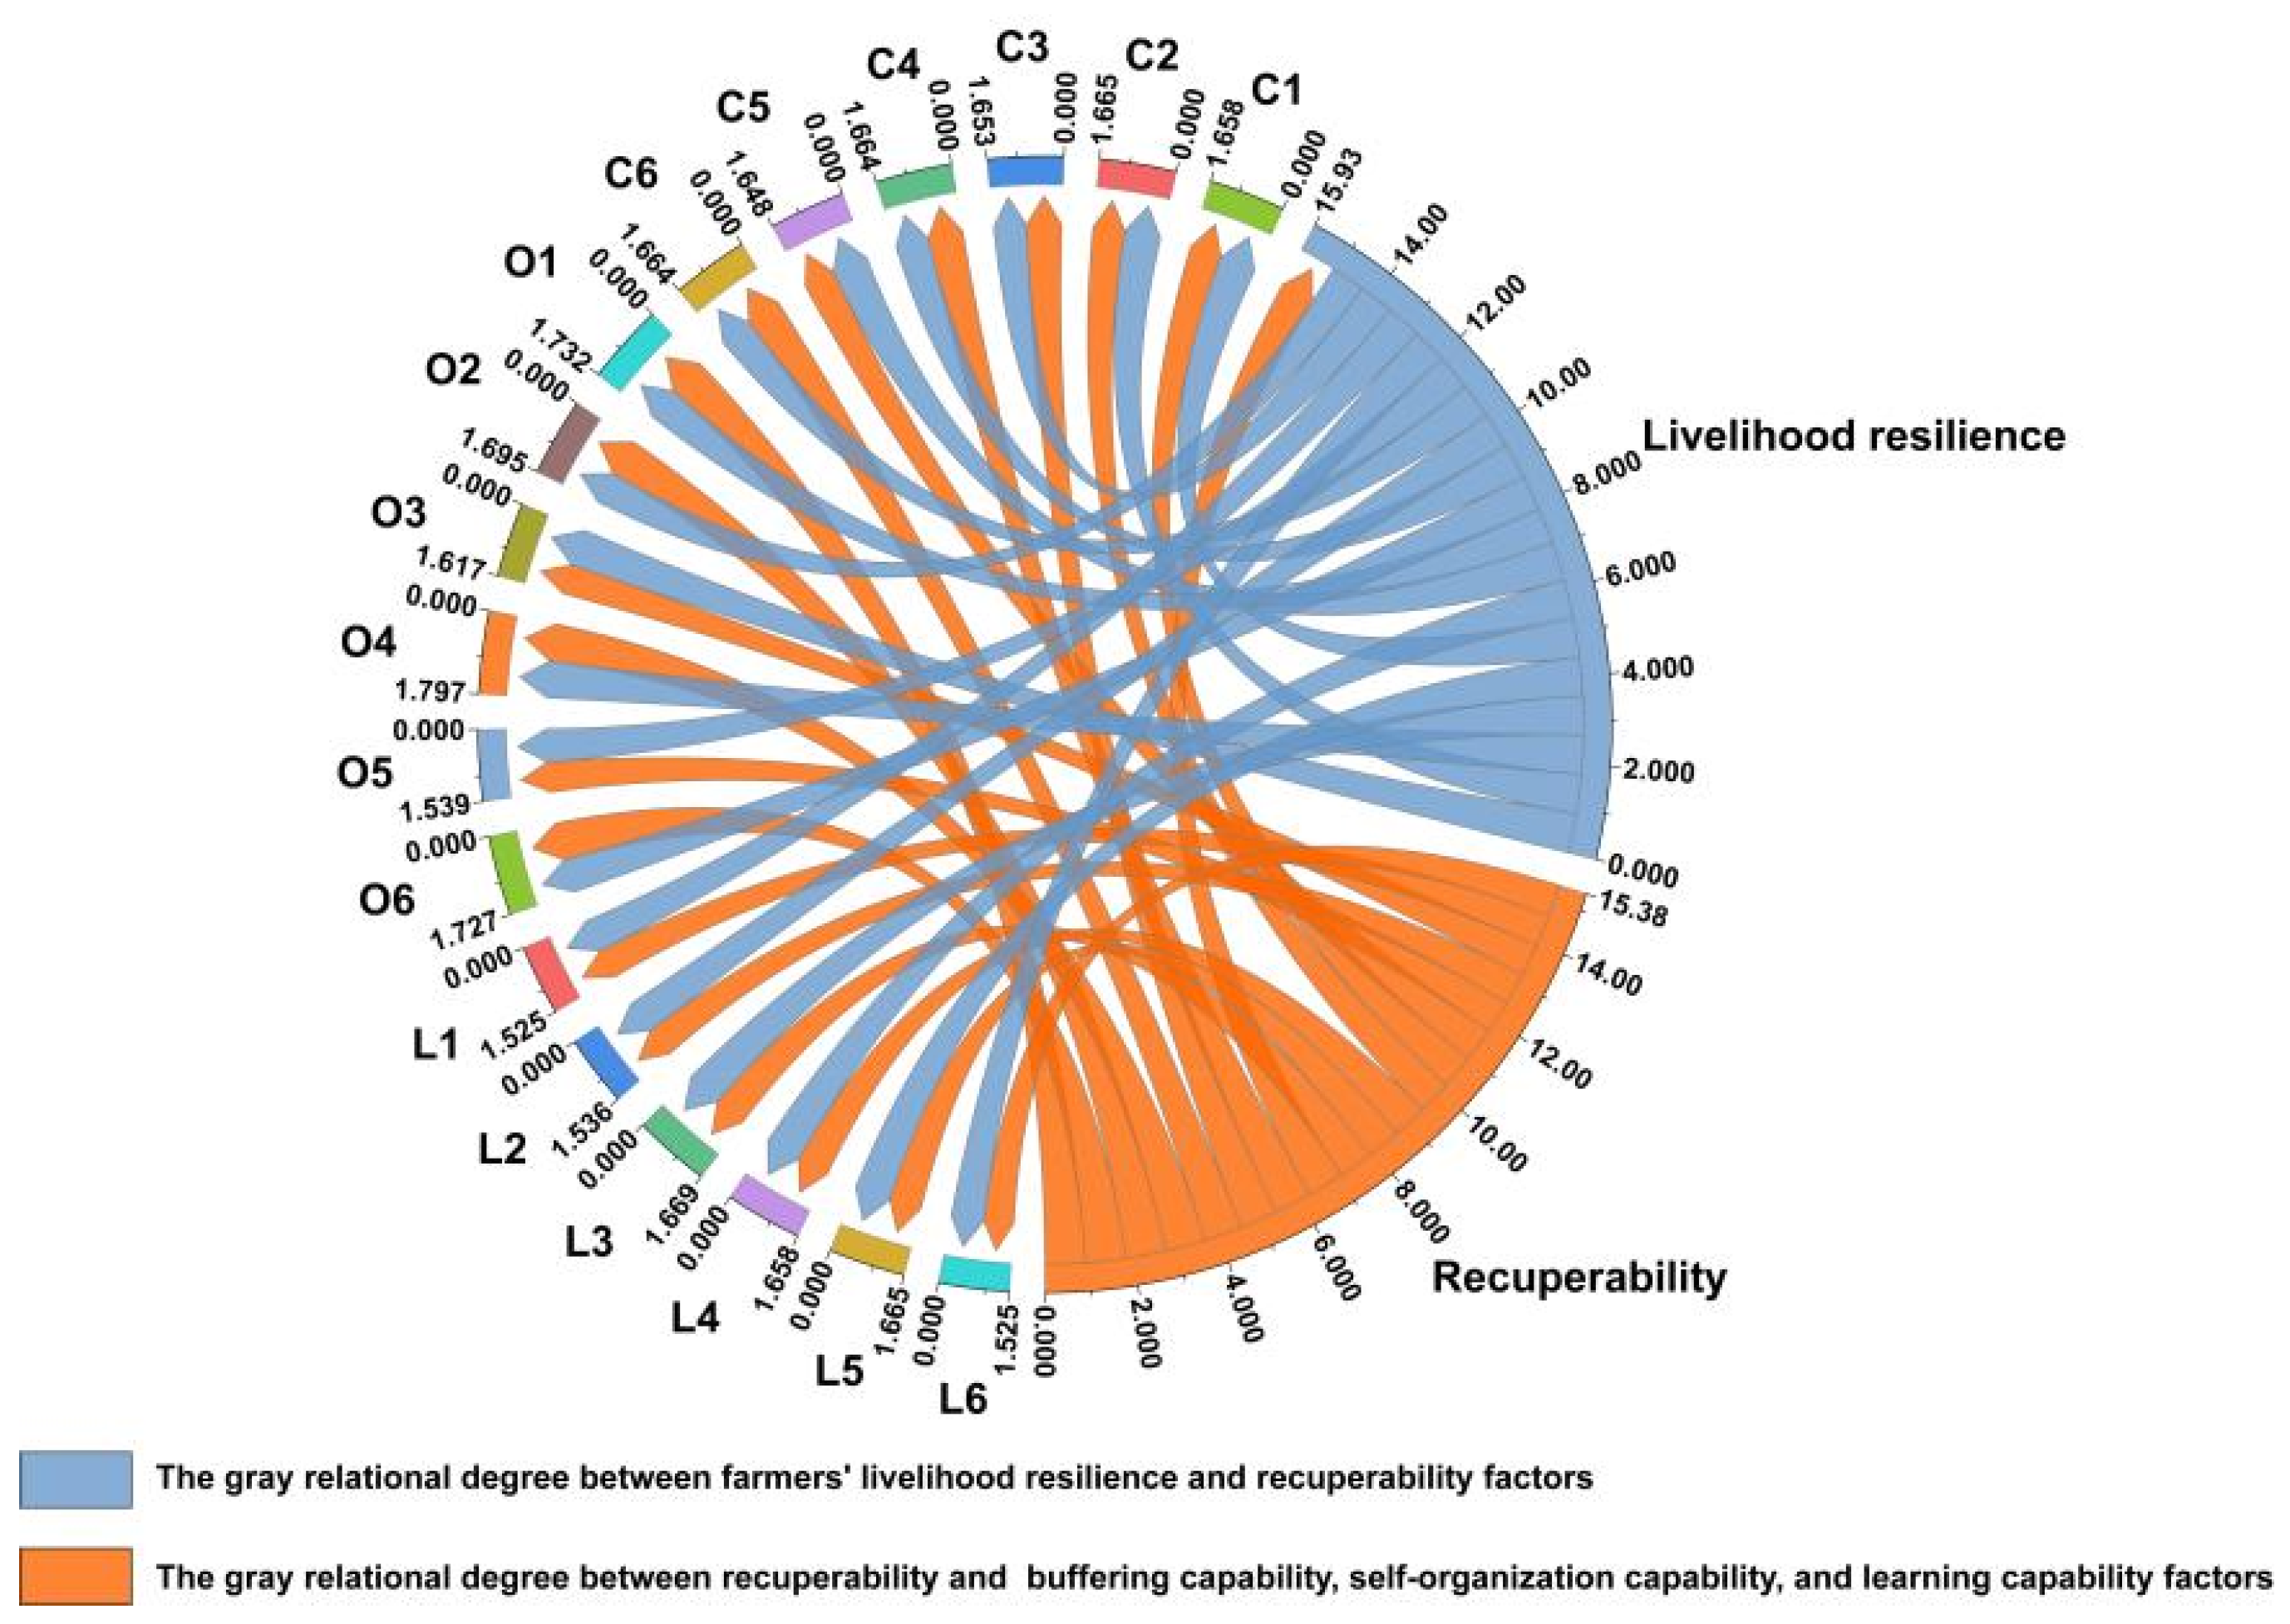
As shown in Table 8, the relational degree of each dimension to farmers’ livelihood resilience is all strongly correlated, and the ranking is: vulnerability (0.8921) > recuperability (0.8386) > adaptability (0.8340). The grey relational analysis further reveals that the essence of livelihood resilience lies in the reorganization capacity of the natural-economic-social system under multiple pressures, with its intensity determined by the dynamic equilibrium between the restoration of the weakest dimension and the diffusion of the strongest dimension [74].
The following analysis is based on the quantitative relational degree, node position, line thickness and crossing structure presented in the chord diagram, revealing the mechanism of the farmers’ livelihood system.
The chord diagram in Figure 8 visually constructs the risk network topology of farmers’ livelihood vulnerability. The relational degree of the price increase amplitude E3 is as high as 0.9371, ranking first among all factors. Its line is not only the thickest but also directly connects to the core area of vulnerability from the node position, confirming the immediate and primary impact of macroeconomic fluctuations on farmers’ livelihoods [35]. Specifically, as the core income source for most farmers, the price fluctuation of agricultural products directly leads to a sudden change in household disposable income. The E3 node is at the hub and has multiple cross-connections with other factors, indicating that price risks can quickly spread to other aspects of livelihood [14]. The relational degree of the ability to withstand natural disasters E1 is 0.9204, with a line thickness second only to E3, supporting the qualitative judgment that natural risks are fundamental threats. That is, droughts and floods directly damage agricultural production materials and weaken the survival foundation of farmers [23]. More importantly, there are dense cross-connections between the E3 and E1 nodes, with a significantly higher number of connections than other factor combinations. This is not accidental but reveals the synergistic amplification effect of economic fluctuations and natural risks. For example, when floods cause crop yield reduction, changes in market supply will exacerbate price drops, resulting in a superimposition of economic losses [21]. This synergistic effect is visualized through the crossing lines, expanding the risk from a single dimension to a composite dimension. In contrast, the relational degree of the information acquisition channel E5 is 0.8603, with a significantly thinner line, indicating that although modern information channels are diverse, their effective conversion into practical risk-resistance actions is limited, and information itself does not significantly buffer the impact. In the comparison between the ecological environment of the village S6 and the dependence on tourism income S4, the relational degree of S6 is 0.8432, and that of S4 is 0.8402, with similar values. However, the S6 node is closer to the center and has a denser connection network, suggesting that the ecological buffering function can continuously reduce system sensitivity through regulating microclimate and providing emergency resources [48], while the high correlation of S4 exposes the inherent vulnerability of a single industrial structure. Once the tourism industry is affected, farmers relying on this industry will face systemic risks. The direct thick line between S4 and the vulnerability area in the figure further confirms that a single industry leads to highly concentrated risk exposure [3,18].
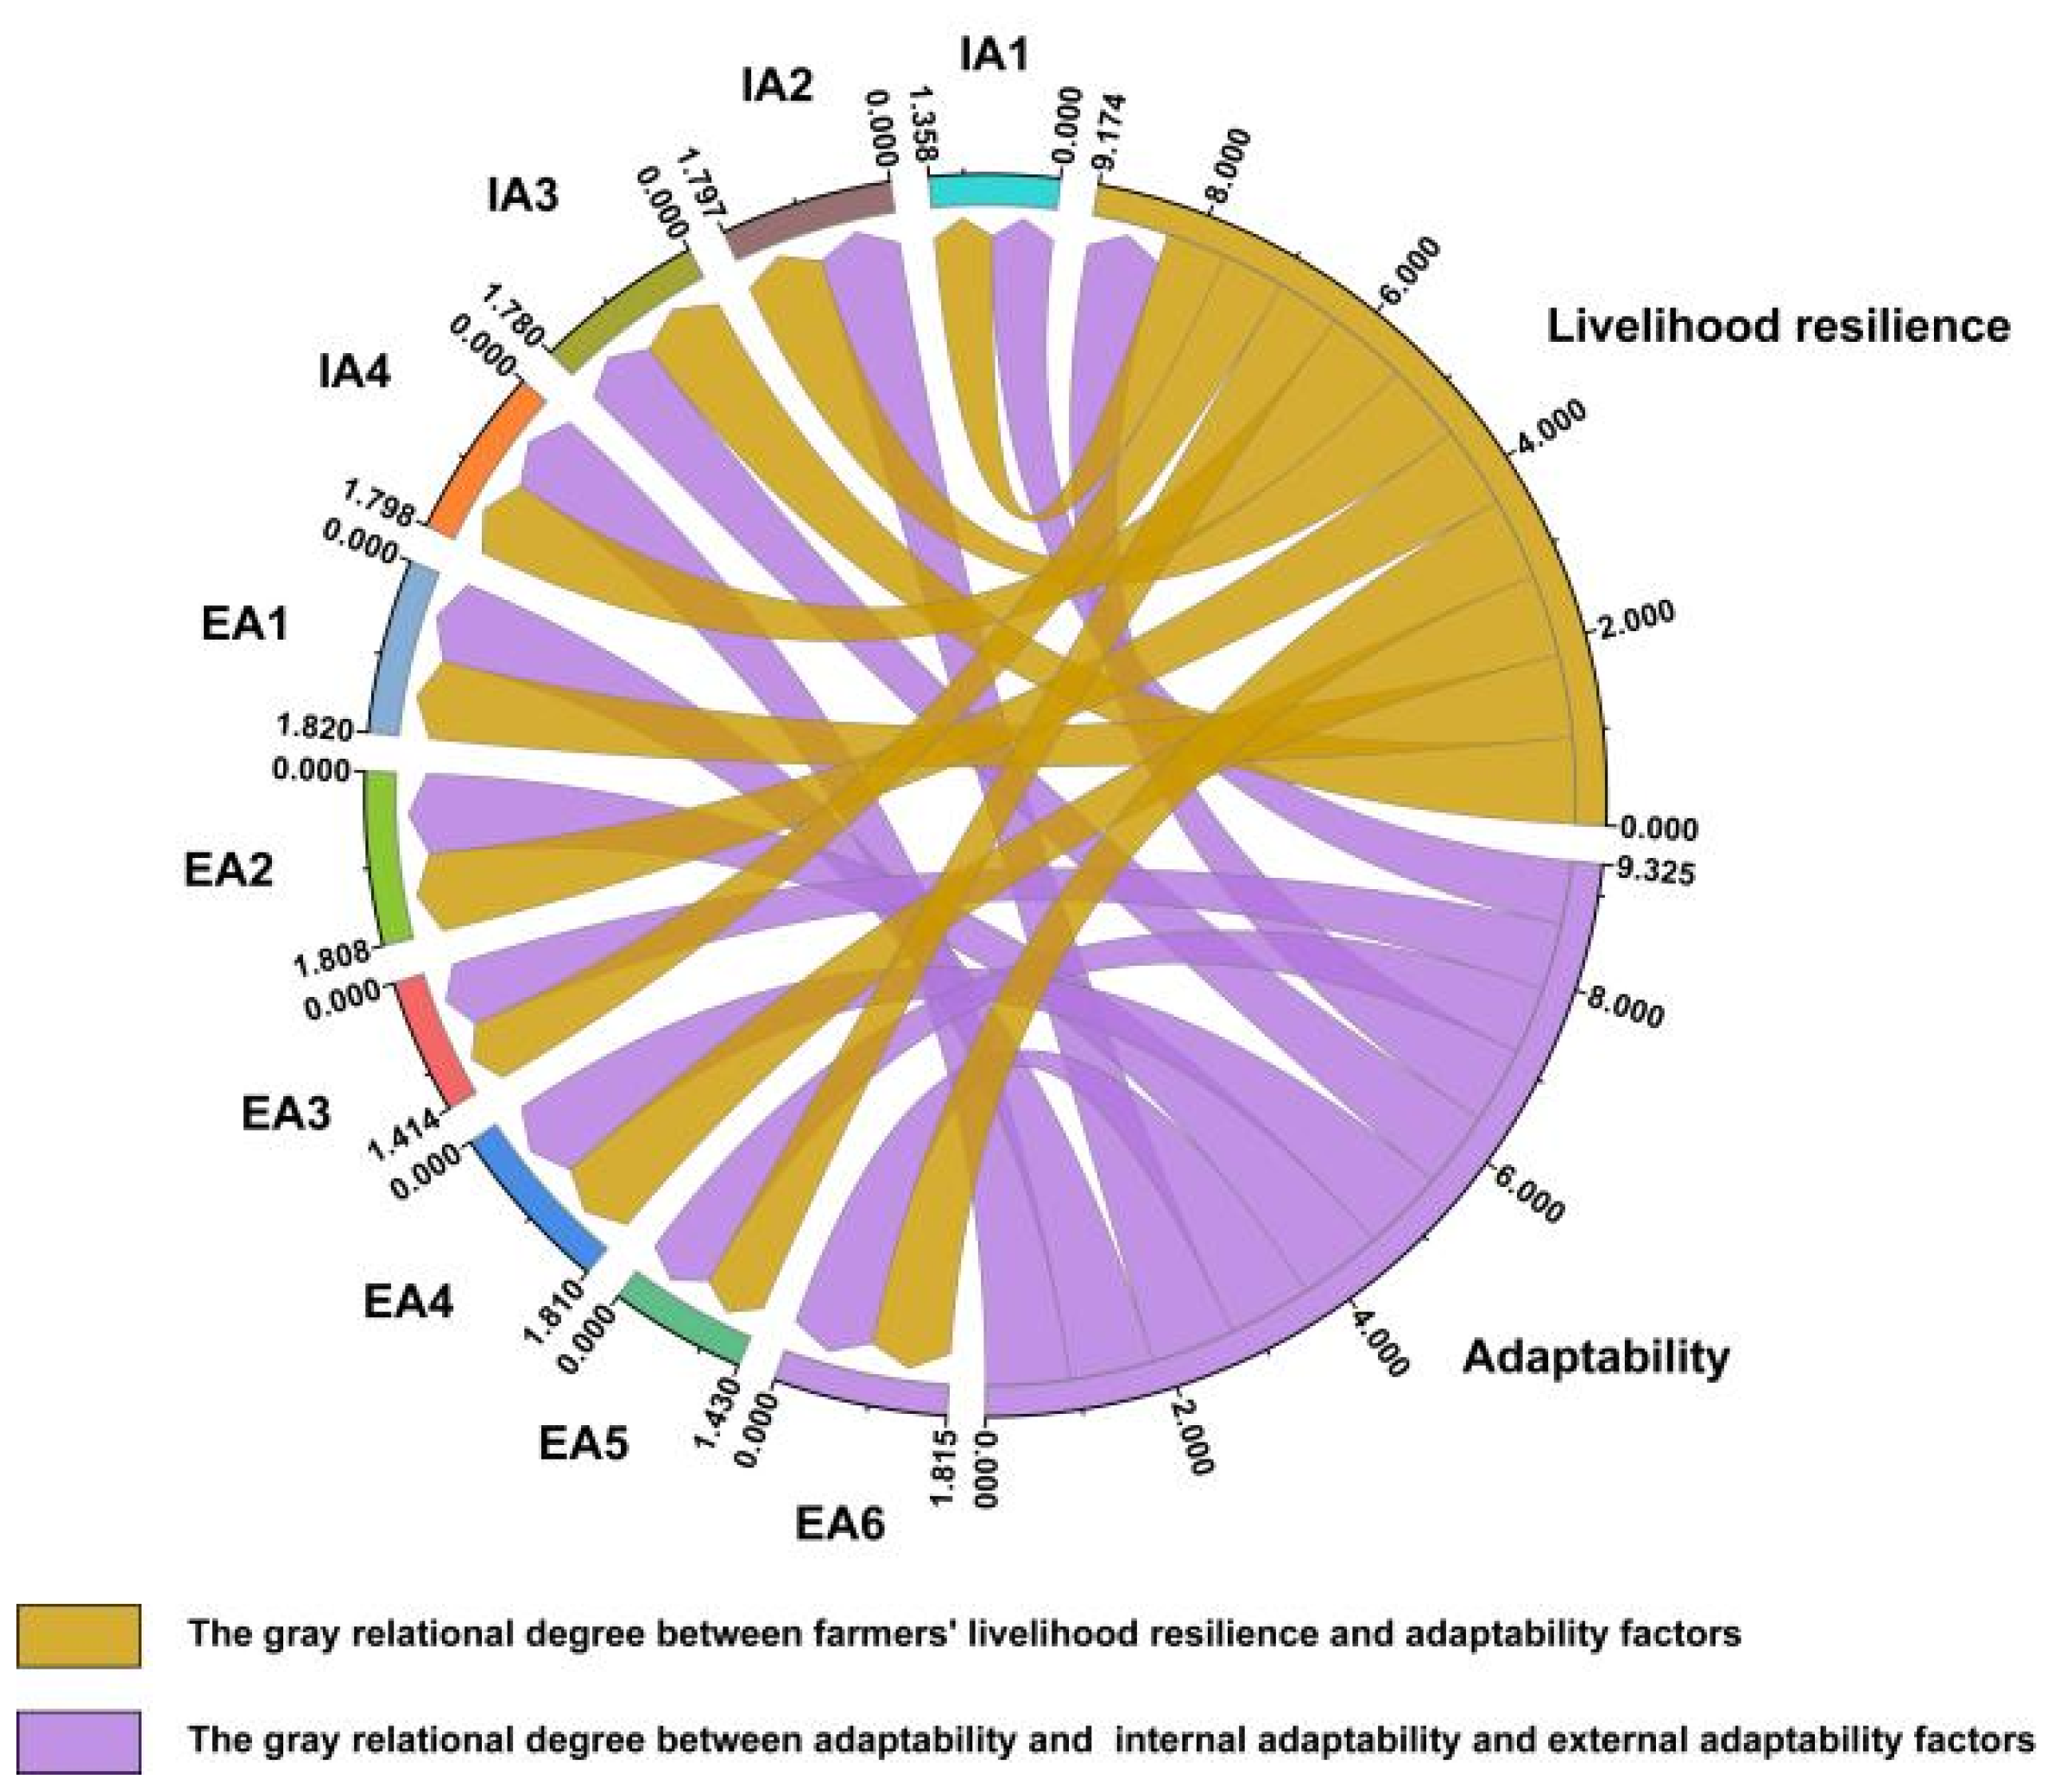
The chord diagram system in Figure 9 reveals the resource-dependent paths and structural fractures for the improvement of farmers’ adaptability. The proportion of migrant workers, IA3, has a relational degree of 0.9411, ranking first among all factors. Its connection line is not only the thickest but also has the highest connection density, occupying a core position. This quantitative advantage directly confirms the leading role of non-agricultural employment in the transformation of livelihoods [17]. The remittances from migrant workers enhance the economic resilience of families, and the IA3 node is connected to both internal and external adaptability factors through multiple paths, forming a radiating influence, indicating that income from migrant work has become a key driver for enhancing adaptability. In sharp contrast, the relational degree of livelihood diversity, IA1, is only 0.6612, with sparse and thin connection lines, revealing that farmers’ current attempts at livelihood diversification have not yet formed effective synergy, possibly due to the low efficiency of diversified strategies caused by resource dispersion [4]. It further demonstrates the interaction structure between internal and external adaptability factors: the relational degree of household durable consumer goods, IA2, is 0.8804, and the availability of external borrowing, EA1, is 0.9190. The two are directly connected by thick lines, forming a clear resource complementarity channel. This relationship indicates that physical assets such as durable consumer goods can be used as collateral to enhance credit access, and external borrowing can further be invested in consumption or production, thus building a virtuous cycle [16]. However, the relational degree of tourism risk perception, EA3, is only 0.6885, with its connection lines being marginal and sparse, reflecting that farmers’ perception of tourism risks has not effectively translated into adaptability behaviors, and there is a significant structural break in the risk transmission mechanism of emerging industries. From the layout, the EA3 node is far from the core area and has weak connections with other factors, a judgment supported by the data, indicating that although the tourism industry may bring income, its risk warning and response strategies have not been integrated into farmers’ adaptability system [15,63].
Figure 10’s chord diagram deeply depicts the core of social capital and the role of knowledge nodes in the construction of farmers’ recuperability. The relational degree of trust in neighbors O3 is 0.8912, and that of trust in village cadres O4 is 0.8866. The connection between the two is the densest and radiates outwards, occupying the central area, which confirms the pivotal role of social networks in crisis response [53]. Trust relationships promote information sharing, mutual assistance, and collective action, thereby accelerating post-disaster recovery. Nodes O3 and O4 are cross-connected with multiple factors, forming high-density clusters, highlighting their function as social adhesives. The relational degree of skill training opportunities L3 is 0.7859, and that of technical exchange ability L5 is 0.7824. Although these values are not the highest, they are radiation-connected with multiple nodes, indicating that knowledge dissemination is an active node in the construction of recuperability [15]. Specifically, training and exchange enhance farmers’ human capital and their ability to cope with new challenges, a dynamic process visualized by the star-shaped connection of L3 and L5. At the buffering capability level, the per capita cultivated land area C3 has a relational degree of 0.8567, and the household income C6 has a relational degree of 0.8581. Although the relational degrees are relatively high, their connections are relatively loose and have fewer connections with core social factors. This supports the key judgment that the accumulation of material capital needs to be effectively transformed into resilience through the medium of social capital. For instance, cultivated land and income need to be optimally allocated or risks shared through community networks; otherwise, their buffering effect may be limited [14]. Additionally, self-organization capabilities such as leadership ability O1 (0.8134) and earning capabilities such as information understanding ability L4 (0.8772) are interwoven with the core of recuperability through cross-level connections, indicating that recuperability is the result of the synergy of multi-level capabilities.
In summary, the resilience of farmers’ livelihoods is not simply the sum of various indicators across different dimensions, but rather a non-symmetric transmission and compensation mechanism formed through strong connections and cross-dimensional links among key nodes. The core of enhancing resilience lies in identifying and intervening in these cross-dimensional connections, transforming nodes with high relational degrees into systematic “shock absorbers” and “converters”. Specifically, in the face of the primary shock of a price risk with a relational degree as high as 0.9371, the response strategy should not be limited to price regulation alone. Instead, efforts should be made to strengthen the transmission link between migrant work and skills training, converting the stable income from non-agricultural employment into an effective buffer against market fluctuations. In the face of natural disaster risk with a relational degree of 0.9204, the prevention and control effect not only depends on the maintenance of ecological conditions but also requires the support of a high-density social trust network to achieve risk sharing and resource mutual assistance. Similarly, for borrowing availability to be effectively transformed into development capital, it needs to be based on tangible assets such as household durable consumer goods as a credit foundation, and its ultimate benefits can only be realized with the guidance of the community’s self-organization capability to avoid resource misallocation [75]. Therefore, effective policy intervention should go beyond a single dimension and precisely target these cross-dimensional key transmission routes. Moreover, it should weave scattered capital, capabilities, and social networks into a resilient structure with internal synergy and redundancy functions, thereby enhancing the ability of farmers’ livelihood systems to cope with external shocks and achieve sustainable development as a whole [35,38,42]. For instance, combining training resources with labor market information to stabilize non-agricultural income, or converting ecological protection into sustainable livelihood assets through community collective action mechanisms.

3.3.2. Diagnosis of Farmers’ Common Obstacles

Under the principle of focusing on the core viewpoints, Table 9 only presents the top ten common obstacle factors ranked by the obstacle degree model, among which the first three obstacle degrees are all factors exceeding 5% in the 39 factors. The primary common obstacle is the ease of borrowing and lending, with an obstacle degree of 5.84%, which reveals that the acquisition of external capital is currently the most prominent constraint. The second common obstacle factor is the dependence on land resources, with an obstacle degree of 5.59%, reflecting the difficulty in transforming traditional core production materials [13]. The third is the awareness of agricultural livelihood risks, with an obstacle degree of 5.20%. The obstacle degree values of these three are close, indicating that they are not independent issues but a set of obstacles that need to be examined as a whole.
These three factors rank at the top because they form a systematic chain of obstruction from external resource acquisition to internal livelihood paths and then to the risk awareness of the subjects. First, the issue with the highest obstacle degree, “the ease of borrowing and lending,” directly corresponds to the weakness of the rural financial service system. This means that farmers have difficulty obtaining credit funds to start new industries or deal with crises [3], and their livelihood strategies lose flexibility due to the lack of financial “blood”, which is the most fundamental external constraint. Secondly, “dependence on land resources” is a direct manifestation and deepening of the above constraint. Due to the difficulty in obtaining capital to shift to other industries, farmers have to rely more tightly on the land to maintain basic survival [2], which reinforces the traditional agricultural production path. This dependence not only limits the development space but also makes farmers’ livelihood structures single and fragile. Finally, the first two obstacles jointly lead to the “awareness of agricultural livelihood risks” problem. Long-term confinement to the land and traditional agriculture naturally narrows farmers’ risk perspectives, making them lack sufficient understanding and vigilance towards complex risks beyond traditional farming experience, such as market fluctuations and climate anomalies, thus putting them in a passive and lagging position in risk response decisions [76]. Therefore, this is a “insufficient capital → dependence on land → cognitive limitation” transmission reaction, which collectively and systematically raises the threshold for enhancing resilience.

3.3.3. Diagnosis of Obstacles for Different Farmers’ Livelihood Types

Based on the data in Table 10, the statistics of the top three obstacle factors for various types of farmers clearly show that despite the different livelihood strategies chosen by farmers, there are three fundamental and systemic obstacles to enhancing their livelihood resilience. The ease of borrowing and lending, the degree of dependence on land resources, and the degree of dependence on traditional livelihood activities are the top three obstacle factors across all types of farmers.
Against the backdrop of these three common obstacles, different groups of farmers with various livelihood strategies exhibit significantly differentiated obstacle structures, which profoundly reflect the inherent vulnerability roots of their respective livelihood models. The obstacle factors and obstacle degrees of tourism-driven farmers are the most prominent, with the values of their top three obstacle factors (EA3: 5.85%, EA4: 5.81%, EA1: 5.48%) generally higher than those of other types. These high values are not isolated; they collectively depict the “high investment, high dependence, and high uncertainty” predicament faced by this group in the process of industrial upgrading. The dual highs of EA3 and EA4 specifically manifest as the contradiction between “financing hunger” and “land binding”: the development of tourism, such as homestays and landscape agriculture, usually requires substantial capital investment in the early stage and long-term land use conversion, but rural credit is mostly short-term and small-scale, and there are still many institutional obstacles to the mortgage and transfer of land management rights [1]. This makes them urgently need to break away from the single dependence on land for traditional agriculture to innovate business models, but at the same time, they have to rely highly on land as the core collateral and spatial carrier for obtaining credit and project implementation, falling into a “dead loop” of transformation. Meanwhile, their EA2 obstacle degree is as high as 5.00%, significantly higher than the 4.73% of labor-driven farmers, which exposes another key issue: when engaging in the more complex tourism industry, farmers’ ability to identify and prevent new risks such as market fluctuations, public health events, and seasonal slumps has not improved in tandem. The lag in risk perception makes high investment potentially accompanied by high losses [41].
In contrast, the top three obstacle factors for labor-driven farmers have generally decreased, with an average of approximately 5.44%. This directly confirms the positive role of regular cash flow from non-agricultural employment in alleviating systemic livelihood pressure. Stable wage income enhances the resilience of household economies to fluctuations, thereby partially offsetting the immediate pressure from financial and land constraints [42]. However, a more concealed vulnerability emerges in their obstacle factor ranking: the “livelihood diversity” obstacle degree has dropped to 4.24%, the lowest among the four categories. This seemingly indicates increased flexibility, but it may actually suggest a professional trap. When family livelihoods overly rely on a single cash source from off-farm work, their agricultural production skills, local social networks, and knowledge of diversified operations may deteriorate. Once the external employment market experiences a shock, they not only face the risk of unemployment [39], but their ability to “return home” and rely on the land or engage in other livelihoods has also weakened, thus forming a new type of vulnerability that is dependent on distant labor markets and characterized by singularity.
The obstacle structure of agriculture-driven farmers presents another typical feature. Their primary obstacle is EA4 land dependency, reaching as high as 5.33%, while EA1 agricultural risk awareness is relatively low, at 4.59%. This “high dependency—low awareness” combination reveals a profound “risk perception blunting” phenomenon in traditional small-scale farming [44]. Long-term engagement in self-sufficient or fixed-buyer-oriented agricultural production may make farmers insensitive to gradual climate change, soil degradation, and slow downward market price risks. Their production decisions are more based on historical experience and habits rather than forward-looking assessments of systemic risks [32]. This cognitive “adaptability numbness” makes them more inclined to stick to existing land and models, even as their returns decline, thereby further reinforcing their path dependence on land and trapping them in a “dependency–numbness–more dependency” cycle.
The obstacle degree value of composite livelihood farmers is the lowest overall and most evenly distributed. The mean values of EA3, EA4, and EA1 are approximately 4.99%, which strongly confirms that the diversification of income sources is an effective strategy for risk dispersion and system stability enhancement [49]. By engaging in agriculture, local part-time work, or small-scale operations simultaneously, they do not overly rely on any single income stream, thus having a stronger buffering capability when facing specific shocks. However, a crucial finding is that even so, EA3 remains their greatest obstacle [22]. This strongly indicates that the individual diversification of livelihood strategies cannot fundamentally bypass structural institutional barriers [77]. This suggests that financial constraints are a rigid and systemic constraint, and there is a limit to the adjustment of individual strategies. Systemic improvement requires breakthroughs at the institutional level.
From the perspective of whether they participate in tourism, the data shows that the top three obstacle factors for both “participating in tourism” and “non-participating in tourism” farmers are exactly the same, namely, EA3, EA4, and EA1. This phenomenon of “translation” in structure itself is highly significant, indicating that the act of participating in the tourism industry has not altered the fundamental constraints faced by farmers. However, the slight numerical changes reveal a transformation in the pressure patterns brought about by participation. The EA3 obstacle degree for participating tourism farmers is 5.68%, slightly higher than the 5.60% of non-participating ones, and their EA4 obstacle degree is 5.65%, also slightly higher than the 5.52% of non-participating ones. This set of comparisons overturns the simplistic notion that participating in tourism reduces land dependence. The actual situation might be that participation in tourism does not reduce the demand for land but rather changes the way land is used and its capital attributes [61]—land shifts from being a carrier for producing grains and oils to an asset for tourism development, with its value assessment and financing needs not decreasing but increasing instead, thus manifesting in the data as a slight increase in dependence (EA4) and the resulting financing difficulty (EA3). Additionally, the obstacle degree for “tourism resource dependence” among participating tourism farmers is 3.65%, higher than the 3.52% of non-participating ones. This suggests that while some farmers are attempting to break away from the traditional agricultural dependence, they might be forming a new single-industry dependence on tourism. Their vulnerability source has shifted from the agricultural risk of “relying on the weather” to the tourism market risk of “relying on tourist flow”, with the form of risk changing but the essence of concentrated risk remaining unchanged [20].
In conclusion, the diagnosis of the barrier factors reveals that enhancing the resilience of farmers’ livelihoods is a game against the deep-seated socio-economic structure. The three major barriers of finance, land, and cognition are mutually locked, forming a systematic “constraint triangle”. Any single-dimensional policy, whether it is providing loans, promoting land transfer, or conducting training, if it does not work in synergy with the other two dimensions, its effect will be diluted by this triangular constraint. Future intervention strategies must shift from “point breakthroughs” to “system decoupling”. For example, to address the financing difficulties of farmers engaged in tourism, long-term credit products that match their investment return cycles should be designed and linked with innovative mortgage methods for their land management rights [62]. For the dulled risk perception of farmers engaged in agriculture, the promotion of agricultural insurance should be deeply integrated with climate change early warning and market information service systems, transforming abstract risks into perceptible and manageable specific costs. The ultimate goal is to break the vicious cycle of “capital shortage → intensified land dependence → inhibition of risk perception update” and build a resilient institutional environment that supports farmers in making dynamic adjustments in finance, assets, and knowledge simultaneously, internalizing resilience as their sustainable ability to cope with an uncertain future.

3.4. Robustness Test

To verify the robustness of the empirical findings in this study, a series of tests were conducted sequentially on the synthetical index method, grey relational analysis, and obstacle degree model. The results of these three tests mutually corroborated, demonstrating the sound robustness of the empirical research outcomes, thereby endowing the policy recommendations proposed in the subsequent sections with practical guidance value based on scientific validation [34,35].
First, regarding the synthetic index method, verification was performed by adjusting the indicators. Specifically, after excluding the less sensitive secondary indicators E5 and O5, the resilience measurement was recalculated. The test results revealed that the ranking of livelihood resilience among different types of farmers remained consistent, with tourism-driven farmers consistently ranking the highest and agriculture-driven farmers the lowest. The order of contribution across dimensions also remained unchanged: vulnerability > adaptability > recuperability. This indicates that the resilience measurement results of this study exhibit strong robustness to parameter selection, thereby confirming the scientific and representative nature of the resilience evaluation system.
In the grey relational analysis test, the robustness was assessed by varying the resolution coefficient ρ. The ρ value was adjusted from the commonly used 0.5 to multiple critical points within the range of 0.1 to 0.5, and the relational degree was recalculated [62]. The results showed that while there were minor fluctuations in the relational degree values between dimensions and livelihood resilience as ρ varied, the relational degree of the vulnerability dimension consistently remained above 0.89 and stably ranked first. The relational degrees of recuperability and adaptability dimensions also remained within the strong relation threshold. The relational degree of the key factor E3 consistently stayed above 0.93, and the ranking of E1 and IA3 remained unchanged. This low sensitivity to parameter changes confirms that grey relational analysis can robustly identify key influencing factors in the livelihood system, further reinforcing the reliability of the identification results.
Based on the aforementioned tests, the robustness of the obstacle degree model was evaluated [61]. During the actual testing process, the obstacle degree was recalculated using the adjusted indicators and resolution coefficient ρ. It was found that the ranking of the main obstacle factors exhibited a high degree of consistency, with EA3 consistently ranking first within the range of 5.6% to 5.9%, followed by EA4 and EA1, whose positions remained unchanged. The dual high obstacle degree characteristics of tourism-driven farmers on EA3 and EA4, as well as the relatively lower obstacle values of labor-driven farmers, were replicated. These results indicate that the diagnosis of bottlenecks in enhancing farmers’ livelihood resilience in this study is not method-dependent but rather reflects the genuine presence of obstacle factors such as insufficient financial accessibility, land path dependence, and lagged risk perception.

4. Discussion

4.1. Research Findings

This study utilized the PSR model to construct a three-dimensional theoretical framework of “vulnerability—adaptability—recuperability” and measured the resilience of different livelihood types of farmers in the study area in each dimension and analyzed the influencing factors, revealing the response patterns and resilience differentiation paths of farmers’ livelihood systems under tourism disturbance. The research indicates that the enhancement of farmers’ livelihood resilience is not a linear optimization process in a single dimension, but rather the result of the multi-faceted effects of rural tourism on the economy, society, cognition, and ecology, as well as the multi-level penetration and renewal of vulnerability, adaptability, and recuperability in the livelihood system. The essence lies in the co-evolution of external risk shocks, internal strategy adjustments, and system recovery potential. This study not only verifies the enabling effect of tourism participation on livelihood resilience but also deepens the core role of farmers’ heterogeneity in resilience construction, providing targeted and specific theoretical basis and policy implications for the sustainable development of livelihoods under the rural revitalization strategy. The main research findings are as follows:
Firstly, the overall resilience of the livelihoods of the sampled farmers is at a medium level, but the contribution of each dimension is significantly unbalanced. The research results show that the vulnerability dimension contributes most prominently to livelihood resilience, while the adaptability and recuperability dimensions are relatively weak. This structural characteristic indicates that the current farmers’ livelihood system is still dominated by a risk-resistance model, and farmers tend to maintain system stability by reducing the sensitivity to external shocks rather than through active adaptation or rapid recovery to achieve system upgrading. This phenomenon profoundly reflects that in the context of the rapid development of rural tourism, farmers are facing increased external environmental uncertainty, leading them to invest more resources in risk prevention rather than capacity building [60]. The vulnerability-dominated resilience structure also implies that the current farmers’ livelihood system may be in a “defensive adaptation” state, that is, the system is more adept at resisting known risks but lacks the transformational capacity to deal with new challenges [59].
Secondly, there are systematic differences in the resilience levels among farmers of different livelihood types, which reflect the complex trade-offs between livelihood strategies and risk management. Although tourism-driven farmers exhibit the highest overall resilience level, they also have the most prominent vulnerability, forming a special pattern of “high capacity—high risk”. This phenomenon reveals the double-edged sword effect of tourism development: on the one hand, the tourism industry brings farmers more opportunities for capital accumulation and social network expansion, significantly enhancing their adaptability and recuperability [58]; on the other hand, the sensitivity of the tourism industry to market fluctuations and external environments also exposes farmers to more uncontrollable risks [57]. In contrast, agriculture-driven farmers have the lowest overall resilience, but their stability characteristics indicate that traditional livelihood models still have unique advantages in some respects. This heterogeneous pattern suggests that the improvement of farmers’ livelihood resilience cannot simply pursue the optimization of a single indicator, but requires targeted interventions based on the specific risk exposure characteristics of different types of farmers.
Furthermore, from the perspective of key factor analysis, the vulnerability dimension is most closely related to livelihood resilience, with economic fluctuations and natural risk factors showing strong explanatory power. This finding challenges the traditional view that capital accumulation or skill improvement is the core of resilience building, instead emphasizing the fundamental role of a stable external environment for farmers’ livelihoods. Notably, the price factor has the highest relational degree among all influencing factors, indicating that in the context of deep market economy penetration, the linkage between farmers’ livelihood systems and the macroeconomy has significantly increased, and local risks are rapidly transmitted to the farmers’ level through the price mechanism. At the same time, social capital factors stand out in the recuperability dimension, suggesting that in the absence of sufficient formal institutional support, informal social networks become an important support for farmers to cope with shocks [56]. This factor correlation pattern reveals that the construction of farmers’ livelihood resilience requires a dual approach of focusing on both macro-environmental stability and the cultivation of micro-social capital.
In addition, the diagnostic results of the obstacle factors show that insufficient financial accessibility, strong land dependence, and lagging risk perception are the three core obstacles restricting the improvement of farmers’ livelihood resilience. These three types of obstacles form a mutually reinforcing constraint system: financial constraints limit farmers’ ability to make alternative investments to land, thereby strengthening their reliance on traditional land resources; while long-term dependence on land solidifies farmers’ production methods and risk perception patterns. It is worth in-depth exploration that tourism-driven farmers perform particularly prominently in these three types of obstacles, indicating that while tourism can significantly improve farmers’ income, it may also exacerbate their systemic vulnerability. Especially the high score of tourism-driven farmers in the risk perception obstacle reflects a significant deficiency in their ability to identify and respond to industry-specific risks. This obstacle structure indicates that relying solely on industrial development or income improvement cannot automatically achieve resilience building, and targeted institutional intervention and capacity building are needed.
In conclusion, this study suggests that the construction of farmers’ livelihood resilience needs to shift from “single-dimensional optimization” to “systematic collaborative improvement”. Although tourism participation can significantly improve farmers’ economic conditions and social capital, it also brings new risk exposure points and systemic vulnerability factors. Therefore, policy design needs to go beyond the traditional industrial support thinking and pay more attention to the differences in risk structure, resource endowment, and adaptive capacity among different types of farmers. For tourism-driven farmers, the focus should be on risk diversification and response capacity building; for agriculture-driven farmers, institutional innovation is needed to break through the dual constraints of resources and cognition. Ultimately, the improvement of farmers’ livelihood resilience requires a multi-dimensional policy system that can simultaneously improve the stability of the external environment, enhance internal adaptive capacity, and strengthen social support networks.

4.2. Theoretical Implications

This study deconstructed the heterogeneity of farmers’ livelihood resilience in the context of rural tourism by embedding the PSR model into the “vulnerability—adaptability—recuperability” three-dimensional analysis framework, promoting the cross-integration of sustainable livelihood theory and resilience theory at the theoretical level. The findings not only addressed the key controversies in existing literature [52,53,54,55], but also demonstrated three innovations in theoretical framework construction, mechanism analysis, and methodological application, providing a new analytical perspective for understanding the dynamics of farmers’ livelihoods during the rural transformation period.
Previous studies on the relationship between rural tourism and farmers’ livelihoods have shown a clear theoretical divide. Some studies emphasize the positive empowerment effect of tourism on farmers’ livelihoods, arguing that tourism participation significantly enhances farmers’ buffering and earning capabilities through income diversification and social capital expansion [49,51]. In contrast, other studies warn that tourism development may exacerbate farmers’ livelihood vulnerability, such as the loss of control over tourism resources exposing farmers to the inherent cyclical fluctuations of the tourism industry [46,47,48]. The results of this study partially support the positive view, finding that tourism participation indeed enhances farmers’ adaptability by promoting the flow of livelihood elements and strategy diversification. However, more importantly, this study reveals the paradoxical phenomenon of “high resilience—high vulnerability” among tourism-driven farmers. This finding indicates that the impact of tourism on farmers’ livelihoods is not a simple linear promotion or inhibition relationship but rather reshapes the internal resilience pattern of the livelihood system by altering farmers’ risk exposure structure and response capabilities [45]. This effectively bridges the theoretical gap between the “tourism empowerment theory” and the “tourism coercion theory” in existing literature [42,44], suggesting that the livelihood effects of tourism development are highly dependent on the interaction between farmers’ original livelihood capital allocation and external risk disturbances.
In terms of theoretical framework, existing studies mostly adopt a single dimension to assess farmers’ livelihood resilience [40,41], or focus on vulnerability analysis [34,39], or concentrate on recuperability measurement [33]. Although some scholars have attempted to integrate the “vulnerability–recuperability” two-dimensional framework, they have failed to fully incorporate the “adaptability” process dimension, thus making it difficult to capture the continuous response mechanism of farmers from passive coping to active transformation [13,78]. This study innovatively couples the PSR model with the “vulnerability–adaptability–recuperability” three-dimensional framework, constructing a dynamic analysis tool that can simultaneously reflect external pressure, system state, and subject response. The original value of this framework lies in: first, it breaks through the limitations of the static assessment of traditional livelihood capital, revealing the dynamic process of farmers’ livelihood resilience formation through the “Pressure–State–Response” chain. For instance, this study found that under tourism disturbance, farmers do not unidirectionally enhance recuperability but adjust their vulnerability management and adaptability behaviors differently according to the type of risk. Second, this framework regards adaptability as the key bridge connecting vulnerability and recuperability, thereby explaining why some farmers with high vulnerability in tourism participation can still maintain a high resilience level—the core lies in the offset effect of adaptability capacity on vulnerability. This theoretical advancement compensates for the deficiency of existing frameworks in insufficient attention to the “adaptation process”, providing a more complete theoretical lens for understanding how livelihood systems respond to chronic and acute shocks.
The empirical findings of this study further deepen the understanding of farmers’ heterogeneity and the mechanism of livelihood resilience construction [32]. Existing studies mostly explore the impact of heterogeneity from a single dimension such as group characteristics (e.g., low-income households and non-low-income households) [31] or geographical location (east, central, and western regions) [30]. This study, however, reveals the underlying mechanism of heterogeneity by identifying the differentiation paths of farmers with different livelihood strategies (tourism-driven, agriculture-driven, etc.) in the three dimensions of resilience. For example, tourism-driven farmers, despite facing higher market risk exposure, have significantly higher self-organization and earning capability than other groups by deeply engaging in local social networks and knowledge exchange channels. In contrast, agriculture-driven farmers, due to their excessive reliance on land resources, can maintain short-term stability in response to sudden shocks but are limited in their system transformation ability due to the rigidity of their livelihood strategies. This finding not only confirms that heterogeneity is the core variable shaping the differentiation of livelihood resilience paths [29], but more importantly, it points out that resilience building needs to shift from a “universal” policy to a “precise matching” model—for tourism-participating farmers with high risk exposure, the focus should be on the construction of risk diversification mechanisms; for traditional farmers with low adaptability, it is necessary to break through resource and cognitive constraints. This conclusion constitutes an important supplement to the existing theories. The enhancement of farmers’ livelihood resilience does not simply involve maximizing the capacity of a single dimension, but rather requires the coordinated optimization of vulnerability, adaptability and recuperability based on the heterogeneous characteristics of the subjects [26,27,28].
In terms of research methods, this study overcomes several limitations of existing literature [20,22,25] by combining subjective and objective indicators and diagnosing obstacle factors. First, most existing studies rely on objective economic indicators to assess resilience [8,9], making it difficult to capture the cognitive and behavioral responses of farmers. This study incorporates subjective indicators such as risk perception and information acquisition ability into the analytical framework, thereby more accurately revealing internal obstacles such as “lagging risk perception among tourism-driven farmers”. This methodological innovation not only enriches the indicator system for resilience measurement but also highlights the fundamental role of subjective cognition in building resilience—even under similar objective resource endowments, cognitive differences may lead to divergent resilience paths. Second, this study identifies financial accessibility, land dependence, and risk perception as the three core obstacles through the obstacle degree model and discovers that there is a progressive reinforcing effect among these obstacles—financial constraints intensify land dependence, which, in turn, solidifies risk perception. This diagnostic result critically examines the existing practice of analyzing resilience influencing factors in isolation from a methodological perspective, proving that only by identifying the coupling mechanisms among obstacle factors can the leverage points for enhancing resilience be found.

4.3. Generalization of Findings

Although this research is based on the specific context of rural tourism development in China, the mechanism it reveals for the construction of farmers’ livelihood resilience has broader applicability. The research findings can be extended to other developing countries and transitional economies with similar structural characteristics, especially those rural areas that are undergoing rapid digitalization and facing challenges in the transformation of traditional livelihoods. Areas suitable for applying the research results usually meet several key conditions. Firstly, there is a clear urban-rural dual structure contradiction, specifically manifested as rural areas facing development bottlenecks such as population outflow, single industrial structure, and relatively backward infrastructure, but at the same time, these areas have underdeveloped natural or cultural resource potential. Secondly, these areas are usually in the early or middle stage of digital transformation, with the popularization of mobile Internet providing basic conditions for information access and market access, but the deep integration of digital technology and traditional livelihoods is still insufficient. Moreover, the livelihood systems of farmers in these areas are undergoing a transformation from relying on traditional agriculture to diversified methods, with frequent external disturbances and generally weak risk resistance capabilities of farmers.
Specifically, the “vulnerability–adaptability–recuperability” three-dimensional analysis framework proposed in this research is particularly suitable for addressing the livelihood issues of farmers in two typical regions. One is mountainous rural areas rich in ecological and cultural resources but lagging in economic development. These areas often have low market accessibility due to terrain restrictions, single livelihood strategies, and high dependence on natural resources, thus showing prominent vulnerability. The other is rural areas on the urban fringe, which are strongly impacted by the urbanization process, with reduced arable land resources and facing drastic livelihood transformation. The construction of farmers’ adaptive capabilities becomes a core challenge. In these two types of regions, rural tourism, as a triggering factor, the disturbances brought about by its development are highly consistent with the resilience evolution logic revealed in this research.
The effective promotion of research results depends on the comprehensive consideration of several key indicators. In terms of infrastructure, the regional Internet penetration rate and logistics accessibility are the basic thresholds for digital technology to empower the diversification of livelihood strategies [7]. In terms of industrial foundation, the local area must have potential resources that can be transformed into tourism attractions, such as unique agricultural landscapes, handicrafts, or ethnic cultures, and there must be a certain internal or external tourism market demand [6]. In terms of community structure, there must be a certain amount of local social capital, such as traditional mutual aid organizations or emerging cooperatives, which is crucial for the formation of self-organization capabilities [78]. In terms of policy environment, local governments must have the ability to provide initial institutional incentives and support, such as in financial microloans, land transfer policies, or skills training [13].
It is particularly important to note that the regional heterogeneity effect discovered in this research requires that policy interventions be precise. For example, in plain areas where industrial integration conditions are better, the policy focus can be placed on the vertical extension of the industrial chain and market connection [5]. In hilly or mountainous areas where ecological vulnerability is higher, more emphasis should be placed on small-scale, decentralized community tourism models to reduce ecological risks and maintain cultural authenticity. For low-income or subsidy-dependent farmers, simple industrial intervention may be insufficient, and it is necessary to have accompanying financial inclusiveness and capacity-building measures to break through the multiple vulnerability constraints they face [4].

4.4. Policy Recommendations

The policy recommendations of this study are closely designed around the resilience differentiation paths and obstacle mechanisms revealed in the research findings, proposing a “common optimization + individual adaptation” approach to enhance resilience, in order to address the complexity and heterogeneity of farmers’ livelihood systems under multiple risk shocks, and achieve a systematic coverage from external environment optimization to endogenous capacity cultivation.
  • Build a differentiated resilience intervention system to respond to the heterogeneous needs of farmers. For tourism-driven farmers, who exhibit the coexistence of high resilience and high vulnerability, policies should focus on risk diversification and adaptive capacity improvement. This can be achieved by innovating tourism income insurance products and establishing a seasonal tourist flow early warning mechanism to buffer market fluctuations, while providing business transformation training to reduce over-reliance on a single source of tourism income. For agriculture-driven farmers, whose low resilience but high stability characteristics require policy breakthroughs in resource and cognitive constraints, policies should support their participation in agritourism projects through land transfer and convert ecological compensation funds into sustainable livelihood capital. Composite livelihood farmers need policies to provide flexible institutional space to optimize their resource allocation strategies and avoid risk accumulation from multi-business operations. This classified intervention model can fundamentally overcome the limitations of a one-size-fits-all policy and achieve precise matching between resilience building and the characteristics of the subjects.
  • Break the coupling effect of obstacle factors and strengthen systematic support. The interaction among the three obstacle factors of insufficient financial accessibility, strong land dependence, and lagging risk perception indicates that policy design needs to break the traditional departmental governance model. It is recommended to establish a cross-departmental resilience coordination platform to integrate the industrial policies of agricultural and rural departments, the credit tools of financial institutions, and the land management functions of natural resource departments. For instance, the land management rights of farmers can be linked to credit ratings, and financial products based on expected land management can be developed. Meanwhile, risk education can be integrated into the entire process of rural financial services. This approach not only addresses the coordination issue among capital acquisition, resource flow, and cognitive improvement but also breaks the reinforcing cycle among the obstructive factors.
  • Promote policy tool innovation and shift from subsidy-based input to mechanism-based empowerment. To address financial constraints, rural asset capitalization reforms can be promoted, allowing farmers to use intangible assets such as tourism operation rights and future income rights as collateral for financing. To address land dependence, the point-based land supply policy should be improved to support farmers in flexibly allocating tourism facility land while maintaining the function of cultivated land. For enhancing risk perception, digital technology can be utilized to establish a community risk simulation platform, and scenario exercises can be conducted to enhance farmers’ ability to predict and respond to uncertainties such as climate and market. These mechanism innovations can significantly reduce policy implementation costs and stimulate farmers’ endogenous motivation to build resilience.
  • Cultivate community self-organization capabilities and activate social capital networks. It is recommended to regularly track the changing trends of different groups in terms of vulnerability, adaptability, and recuperability. This index should be incorporated into the local rural revitalization assessment system to guide policies to shift from simply pursuing economic indicators to focusing on the stability of the livelihood system. At the same time, an adaptability management mechanism should be established to dynamically adjust intervention priorities based on monitoring results, forming a “evaluation–adjustment–re-intervention” circular governance model to ensure that policies can respond to the evolving needs of farmers’ livelihood systems. Therefore, the core policy recommendation of this study lies in transforming external support into farmers’ endogenous resilience capacity through systematic, differentiated and dynamic governance innovation. This requires decision-makers to break away from the conventional mindset of traditional industrial policies. Starting from the essential laws of resilience formation, a system should be established that can simultaneously optimize the stability of the external environment, enhance the internal adaptability, and activate the community’s collaborative network. Ultimately, it aims to achieve a deep integration of sustainable development in rural tourism and farmers’ livelihoods.

4.5. Limitations and Future Research

Due to the constraints of investigation time, budget, the cooperation degree of the subjects under investigation, and the limited academic level of the researcher, this study still has several limitations that deserve in-depth exploration. These limitations stem from both the inherent constraints of the research design and the unresolved methodological challenges in this research field, which require further refinement in future studies.
At the theoretical framework level, although this study innovatively constructed a three-dimensional framework, an important methodological limitation identified is the existence of endogeneity issues. Specifically, farmers’ participation in tourism operations is not a random process but a self-selection behavior based on their initial livelihood capital, risk preferences, and other traits. This self-selection effect may lead to systematic biases in the assessment of resilience. Additionally, there may be a bidirectional causal relationship between the development of rural tourism and farmers’ livelihood resilience: while tourism development enhances resilience, farmers with high resilience may also be more actively involved in tourism operations, forming a positive feedback loop. Due to the use of cross-sectional data, it is difficult to effectively identify this complex interaction. Moreover, the influence of omitted variables such as community infrastructure and institutional environment has not been fully controlled. This study focuses more on revealing the characteristic facts and influencing mechanisms of the resilience structure rather than establishing a strict causal inference chain, which makes endogeneity testing not the core task of the current research.
At the research method level, the first issue is the representativeness of the case. Although using a single demonstration village as the research object can deeply analyze the micro-mechanism, it is difficult to comprehensively reflect the common laws of rural tourism communities at different development stages, resource endowments, and institutional environments. China’s rural areas are diverse, ranging from the commercialized tourism model in the eastern coastal areas to the community tourism model in the ecologically fragile western regions, and the paths to resilience formation may vary significantly. Secondly, the resilience assessment system based on cross-sectional data can capture the structural characteristics at a specific point in time but cannot reflect the dynamic evolution path of resilience during the tourism development process. Farmers’ adjustments in livelihood strategies, risk learning mechanisms, and the effects of policy interventions often have time lags and path dependencies, and these dynamic processes require long-term tracking data to be effectively captured. Finally, although the combination of subjective and objective indicators has enhanced the completeness of the measurement dimensions, the coverage of emerging risk factors such as digital technology and climate change is still insufficient, making it difficult to reflect the new challenges faced by farmers.
At the empirical application level, although this study has revealed the double-edged sword effect of tourism development, its internal mechanism still needs further exploration. In particular, the differentiated impacts of different tourism business models on farmers’ livelihood resilience, as well as the critical points and path dependency characteristics during the transition from traditional livelihoods to tourism livelihoods, require more refined research designs to analyze. Furthermore, this study primarily focuses on the resilience characteristics at the individual farmer level, with insufficient exploration of resilience relationships at other scales such as community collectives and regional systems. This limitation impedes a comprehensive grasp of the systematic mechanisms underlying livelihood resilience construction.
Based on the above limitations, future research can be deepened and expanded in four directions. The first direction is to construct a multi-scale nested analytical framework to conduct a linked analysis of farmers’ micro-behavior, community meso-institutions, and regional macro-environment. This requires exploring the transmission paths and coupling mechanisms among farmers’ resilience, community resilience, and regional resilience. Especially in the context of rapid urbanization and the penetration of digital technology, it is necessary to strengthen the analysis of the shaping effects of emerging factors such as the flow of urban and rural elements and the digital divide on resilience.
Second, future research can combine new data sources such as remote sensing data and mobile phone signaling to establish a warning system that can monitor changes in farmers’ livelihood resilience in real time. Methodologically, system dynamics models and agent-based simulations can be introduced to simulate the evolution trajectories of resilience systems under different policy interventions. In particular, it is necessary to strengthen the identification of key dynamic features such as resilience critical points and transformation paths to provide scientific basis for adaptability governance.
Third, future research should introduce cutting-edge paradigms such as complex system theory and behavioral economics to deepen the understanding of the intrinsic mechanisms of nonlinear evolution of livelihood systems and adaptability learning. Particularly in the construction of resilience, attention should be paid to the role of soft elements such as psychology and cognition to make up for the current research limitation of overemphasizing economic capital. At the same time, comparative studies under different cultural and institutional backgrounds should be strengthened to distill universal laws and context-specific characteristics.
Finally, future research should take into account policy-oriented experiments and evaluations. By designing randomized controlled trials, quasi-experiments, and other methods, the impact of different policy interventions on farmers’ livelihood resilience can be scientifically assessed. Particularly, innovative policy practices should be carried out in cutting-edge fields such as digital technology and ecological compensation, and effective experiences should be distilled to provide more operational solutions for rural revitalization.

5. Conclusions

This study, based on the “vulnerability–adaptability–recuperability” tri-dimensional theoretical framework, evaluated the livelihood resilience levels of different types of farmers and their influencing factors. The results indicated that the overall livelihood resilience of farmers in the study area was at a medium level, and the current livelihood system was dominated by a risk-resistance model. The “high resilience, high vulnerability” characteristics of tourism-driven farmers revealed the “double-edged sword” effect of tourism in enhancing farmers’ adaptability and recuperability while also increasing their exposure to external risks. Additionally, rising prices, off-farm employment, and neighborhood trust emerged as key factors influencing livelihood resilience, while the ease of borrowing, land dependence, and agricultural risk perception constituted the main obstacles to livelihood resilience. These conclusions not only verified the empowering effect of rural tourism on livelihood resilience but also deepened our understanding of the differentiated paths of different farmers in terms of risk structure, resource endowment, and response mechanisms. Theoretically, this study constructs an innovative theoretical analysis framework, highlighting the pivotal role of adaptability in connecting vulnerability and recuperability. This provides a new perspective for understanding the co-evolution of farmers’ livelihood systems during the rural transformation period. Meanwhile, through the combination of subjective and objective indicators and the diagnosis of obstacle degree, this study enhances the systematic nature and contextual adaptability of resilience measurement in methodology. Practically, this study proposes a shift from “universal” intervention to a coexistence of “commonality + individuality” as a means of enhancing livelihood resilience. This provides a theoretical basis and practical reference for farmers’ risk governance and policy design in the context of the high-quality development of rural tourism. Future research can further explore the multi-scale interaction mechanism of resilience, integrate dynamic data to track the evolution path of resilience, and strengthen the analysis of the impact of emerging factors such as digital technology on the livelihood system.

Author Contributions

Conceptualization, Y.C. and Y.S.; methodology, Y.C.; formal analysis, Y.C. and Y.S.; investigation, Y.C. and Y.S.; data curation, Y.C., Y.S. and G.Z.; writing—original draft preparation, Y.C.; writing—review and editing, Y.C., Y.S. and G.Z.; visualization, Y.C.; supervision, Y.S. and G.Z.; project administration, Y.C., Y.S. and G.Z.; funding acquisition, Y.S., G.Z. and R.Z. All authors have read and agreed to the published version of the manuscript.

Funding

This research was funded by the Major Project of Sichuan Provincial Philosophy and Social Science Foundation (Grant No. SCJJ24ZD31), the National Social Science Foundation of China (Grant No. 23XJY010), and the Sichuan Academy of Social Sciences (Grant No. 24YB22).

Institutional Review Board Statement

This study is waived for ethical review as no personal identifiers were collected by Institution Committee. Ethics approval was not required according to institutional policies for low-risk research.

Informed Consent Statement

Written informed consent has been obtained from all subjects involved in the study.

Data Availability Statement

The original contributions presented in this study are included in the article. Further inquiries can be directed to the corresponding author.

Acknowledgments

We sincerely appreciate the constructive feedback provided by the editor and the four anonymous reviewers, which has significantly enhanced the quality of this manuscript.

Conflicts of Interest

The authors declare no conflicts of interest.

References

  1. Wang, S.Q. A Study on the Development Model of Rural Tourism in Inner Mongolia from the Perspective of Agricultural, Cultural, and Tourism Integration. Contemp. Cty. Econ. 2025, 8, 28–30. (In Chinese) [Google Scholar]
  2. Yang, B.; Jin, L.; Fang, W.S. A Brief Discussion on the Development of Shanghai’s Leisure Agriculture and Rural Tourism under the Context of Epidemic Prevention and Control. Shanghai Rural Econ. 2020, 3, 6–8. (In Chinese) [Google Scholar]
  3. Chen, J.Y. The Resilient Smallholder Peasantry: Historical Continuity and Modern Transformation—The Vitality and Autonomous Responsibility Mechanism of Smallholder Households in China. Soc. Sci. China 2019, 12, 82–99+201. (In Chinese) [Google Scholar]
  4. Wang, Y.; Tang, L.Y.; Wang, W.W.; Wang, J.Y.; Zheng, L. Driving Mechanism of Farmers’ Livelihood Resilience and Its Environmental Effects. Resour. Environ. Yangtze Basin 2023, 32, 665–677. (In Chinese) [Google Scholar]
  5. Wang, H.; Feng, Y.F.; Ding, Z.F.; Huang, L.; Xiang, W.N. Thoughts on Slow Variables of Social-Ecological Resilience Based on Ecological Wisdom: A Case Study of the New Jersey Coast. Chin. Landsc. Archit. 2024, 40, 37–42. (In Chinese) [Google Scholar]
  6. Speranza, C.I.; Wiesmann, U.; Rist, S. An indicator framework for assessing livelihood resilience in the context of social–ecological dynamics. Glob. Environ. Change 2014, 28, 109–119. [Google Scholar] [CrossRef]
  7. Quandt, A. Measuring livelihood resilience: The Household Livelihood Resilience Approach (HLRA). World Dev. 2018, 107, 253–263. [Google Scholar] [CrossRef]
  8. Tang, L.Y.; Liu, C.C.; Wang, Y. Unveiling the role of social networks: Enhancing rural household livelihood resilience in China’s Dabie Mountains. J. Geogr. Sci. 2025, 35, 335–358. [Google Scholar] [CrossRef]
  9. Chang, J.; Xie, P.; Bie, X.J. Research on the Changes and Enhancement Strategies of Livelihood Resilience of Rural Households Driven by Tourism: A Comparative Study Considering Different Community Participation Models. Sci. Technol. Manag. Land Resour. 2022, 39, 27–39. (In Chinese) [Google Scholar]
  10. Zhao, X.Y. Research on Sustainable Livelihoods from a Geographical Perspective: Current Status, Problems and Fields. Geogr. Res. 2017, 36, 1859–1872. (In Chinese) [Google Scholar]
  11. Li, C.; Wang, L.; Kang, B.W.; Gao, M. Measurement and Analysis of the Livelihood Resilience of Households Relocated by Resettlement Programs. J. Xi’an Jiaotong Univ. (Soc. Sci. Ed.) 2019, 39, 38–47. (In Chinese) [Google Scholar]
  12. Gao, S.; Cheng, W.; Tang, J.J. Research on the Livelihood Resilience of Households in Revolutionary Old Areas from the Perspective of Risk Shocks: A Case Study of Taihang Revolutionary Old Area. Chin. Rural Econ. 2024, 3, 107–125. (In Chinese) [Google Scholar]
  13. Zhou, Y.X.; Niu, J.L. The Impact Path of Rural Tourism Development on Farmers’ Livelihood Resilience: Based on the Comprehensive Survey Data of China’s Rural Revitalization. Dongyue Forum 2025, 8, 100–110. (In Chinese) [Google Scholar]
  14. Liu, J.; Zhao, Q.H. The Impact Effects of Rural Tourism Development on Rural Revitalization: An Empirical Test Based on the New Endogenous Development Theory. J. Agrotech. Econ. 2025, 3, 126–144. (In Chinese) [Google Scholar]
  15. Zhao, S.H.; Li, Q.; Kong, Y.Y.; Yang, Y.T.; Yang, Y.Q.; Li, X.G.; Li, J.Y. The Impact of Rural Tourism Development in Ethnic Areas on Women’s Livelihood Capital from the Perspective of Subjective and Objective Comparisons: A Case Study of Bapo Village, Jinghong City, Yunnan Province. Resour. Sci. 2025, 4, 771–785. (In Chinese) [Google Scholar]
  16. Li, F.C.; Zhang, W.B.; Fang, K.Y. The Dynamic Evolution and Driving Factors of China’s Economic Resilience from the Perspective of Livelihood Capital. Commer. Econ. 2025, 9, 1–6+127. (In Chinese) [Google Scholar]
  17. Li, F.C. Regional Differences in China’s Economic Resilience from the Perspective of Livelihood Capital. Ind. Innov. Res. 2025, 5, 5–9. (In Chinese) [Google Scholar]
  18. Wang, X.; Qiao, H.Q.; Zhang, C. Research on the Impact Mechanism of Rural Tourism-Integrated Land Consolidation on Farmers’ Livelihood Resilience Based on Factor Analysis. China For. Econ. 2025, 4, 1–8. (In Chinese) [Google Scholar]
  19. Huang, C.K.; Xu, H.; Chu, D.P. Assessment of Livelihood Resilience of Farmers in Tourist Destinations under Disaster Shocks and Diagnosis of Obstacle Factors: A Case Study of Farmers in Yuanjia Village, Lixian County, Shaanxi Province. Reg. Res. Dev. 2024, 5, 117–123. (In Chinese) [Google Scholar]
  20. Pan, Y.L. Research on the Impact of Rural Tourism on Farmers’ Livelihood Resilience: A Case Study of Ziyun County, Guizhou Province. Xinjiang Agric. Univ. 2024. [Google Scholar] [CrossRef]
  21. Yin, N.L.; Yang, M.H.; Yang, Y.M.; Zuo, J.Y.; Wu, J.L. Evaluation of Tourism Village Resilience and Analysis of Obstacle Degree from the Perspectives of Community and Households: A Case Study of Dehang, Longbizui and Laochehe Villages in Xiangxi Prefecture. J. Jiangxi Agric. Sci. 2023, 10, 238–246. (In Chinese) [Google Scholar]
  22. Wu, J.; Yang, Y.; Zuo, J.; Cao, Q.Q.; Guo, D.R.; Liu, S.L. Evaluation and influencing factors of ecological resilience in tourism villages from farmers’ perspectives: A case study of Chinese minority settlement areas. Front. Environ. Sci. 2024, 12, 1400546. [Google Scholar] [CrossRef]
  23. Deng, M.; Shang, Q.L.; Shi, P.F.; Fan, Y.S.; Li, M.X. Analysis of the Configuration Path of Influencing Factors of Subjective Well-being of Tourist Destination Residents from the Perspective of Livelihood Capital. China Ecotourism 2023, 4, 706–720. (In Chinese) [Google Scholar]
  24. Yang, Y.J.; Li, C.X.; Lina, R. Ecosystem health assessment of Ruxi River Basin in Zhongxian County of Three Gorges Reservoir Area based on PSR framework model. Resour. Environ. Yangtze Basin 2013, S1, 66–74. (In Chinese) [Google Scholar]
  25. Wang, Y.H.; Ma, D.P. Measurement of Livelihood Resilience of Households in Deeply Poor Areas and Diagnosis of Obstacle Factors: An Empirical Investigation in a Deeply Poor Township in Henan Province. J. Agro-Sci. Technol. 2020, 19, 476–484. (In Chinese) [Google Scholar]
  26. Polsky, C.; Neff, R.; Yarnal, B. Building comparable global change vulnerability assessments: The vulnerability scoping diagram. Glob. Environ. Change 2007, 17, 472–485. [Google Scholar] [CrossRef]
  27. Li, T.Y.; Tan, S.H. Livelihood Vulnerability of Herders under Institutional Changes: Based on the “Vulnerability-Resilience” Analytical Framework. Chin. Rural Obs. 2018, 3, 19–34. (In Chinese) [Google Scholar]
  28. Zhao, X.Y.; Liu, C.F.; Wang, X.L.; Xue, B. Evaluation of the Vulnerability of Farmers’ Livelihoods to Ecological Degradation in Inland River Basins of Arid Regions: A Case Study of the Middle and Lower Reaches of the Shiyang River. Acta Ecol. Sin. 2016, 36, 4141–4151. (In Chinese) [Google Scholar]
  29. Li, Y. Research on the Livelihood Resilience of Households in Demonstration Villages of Rural Tourism. Lanzhou Univ. 2023. Available online: https://link.cnki.net/doi/10.27204/d.cnki.glzhu.2023.002595 (accessed on 17 December 2025).
  30. Wu, K.S.; Yang, Q.Q.; Ye, W.L.; Yang, X.J.; He, Y.B. Livelihood Resilience of Households and Its Construction Path in the Loess Plateau: A Case Study of Jia County in Northern Shaanxi. J. Arid Land Resour. Environ. 2021, 35, 24–30. (In Chinese) [Google Scholar]
  31. Zhai, B.; Wang, Y.G.; Zhu, F.F.; Ji, T.R.; Xin, K.X. Differences in Livelihood Resilience of Households in the Yellow River Basin under Different Livelihood Strategies and Their Influencing Factors: A Case Study of Henan Province. Econ. Geogr. 2024, 44, 156–165. (In Chinese) [Google Scholar]
  32. Zhang, S.; Tan, J.; Liu, J.; Wang, J.; Tara, A. Suitability Prediction and Enhancement of Future Water Supply Systems in Barwon Region in Victoria, Australia. Land 2022, 11, 621. [Google Scholar] [CrossRef]
  33. Urruty, N.; Tailliez-Lefebvre, D.; Huyghe, C. Stability, robustness, vulnerability and resilience of agricultural systems. A review. Agron. Sustain. Dev. 2016, 36, 15. [Google Scholar] [CrossRef]
  34. Xie, S.Y.; Tian, W.L.; Nie, L.S.; Qiao, H.F. Comparative Study on Livelihood Resilience of Households with Different Livelihood Strategies in Mountainous Tourist Areas: A Case Study of Enshi Prefecture. Res. Soil Water Conserv. 2023, 30, 435–442. (In Chinese) [Google Scholar]
  35. Li, Y.H.; Zuo, W.J.; Cheng, W.J.; Stanny, M.; Du, G.M. Vulnerability of Farm Household Livelihoods to Drought Stress in the Agro-pastoral Ecotone of Northern China and Its Determinants: A Case Study of Yuyang District, Shaanxi Province. J. Agric. Resour. Environ. 2025, 4, 1115–1124. (In Chinese) [Google Scholar]
  36. Zhang, J.; Zhao, Y.F. Characteristics and Contributing Factors of Pastoral Household Livelihood Vulnerability: An Empirical Study Based on Field Surveys of 548 Herder Households in Inner Mongolia. Rural Econ. Sci.-Technol. 2024, 13, 231–234, 245. (In Chinese) [Google Scholar]
  37. Zhang, L.Y.; Zou, J.; Chen, S.H. Characteristics of Rural Household Livelihood Vulnerability in Peri-urban Traditional Villages. Yunnan Geogr. Environ. Res. 2025, 4, 29–38. (In Chinese) [Google Scholar]
  38. Jia, R.X.; Shi, X.M.; Fan, Y. Impacts of ecosystem services and disservices on residents’ well-being in mining-agricultural compound areas: The mediating role of livelihood vulnerability. Acta Ecol. Sin. 2025, 13, 6481–6491. (In Chinese) [Google Scholar]
  39. Wu, K.S.; Rui, Y.; Chen, J.; Zhang, L.Q.; Yang, X.J.; Zhang, B.G. Micro-scale Research on Rural Transformation Driven by Tourism: A Case Study of Shangwang Village in Xi’an City. Prog. Geogr. 2020, 39, 1047–1059. (In Chinese) [Google Scholar] [CrossRef]
  40. Yang, B.; Ma, X.H.; Song, X.Q.; Yang, S.F. The Impact of Different Models of Village Renovation in Coal Resource-Exhausted Areas on the Adaptive Livelihood Choices of Households: A Case Study of Typical Villages in Northern Jiangsu and Southern Shandong. J. Nat. Resour. 2025, 2, 534–549. (In Chinese) [Google Scholar]
  41. Luo, W.B.; Chu, X.L.; Liu, Y.J. Research on the Impact of Complex Perspectives on the Sustainable Livelihood Configuration of Households in Rural Tourism Destinations: A Case Study of Xingfu Village, Chengdu City. Tour. Trib. 2024, 39, 112–126. (In Chinese) [Google Scholar]
  42. Wang, Y.; Tang, L.Y.; Zheng, L.; Yang, B.; Wang, W.W. Coupling Coordination Relationship between Farmers’ Perceived Ecosystem Services and Livelihood Resilience and Its Influencing Factors: A Case Study of the Dabie Mountain Area in Hubei Province. J. Agro-Resour. Environ. 2025, 42, 1366–1380. (In Chinese) [Google Scholar]
  43. Wang, F.; Shi, X.M.; Qin, Y.H. Configurational Patterns and Influencing Factors of Farmers’ Livelihood Resilience and Well-being: A Case Study of the Desert-Loess Transition Zone. Reg. Res. Dev. 2025, 2, 162–166, 172. (In Chinese) [Google Scholar]
  44. Lei, M.; Yuan, X.Y.; Yao, X.Y. Synthesize dual goals: A study on China’s ecological poverty alleviation system. J. Integr. Agric. 2021, 20, 1042–1059. [Google Scholar] [CrossRef]
  45. Xu, J. Construction and Application of the Index System for Common Prosperity. J. Southwest Minzu Univ. (Humanit. Soc. Sci. Ed.) 2022, 43, 129–138. (In Chinese) [Google Scholar]
  46. Liu, X.C. Application of Grey Hierarchical Comprehensive Evaluation Method in Risk Investment Project Evaluation. Mod. Econ. Inf. 2012, 2, 29–30. (In Chinese) [Google Scholar]
  47. He, Y.B.; Huang, X.J.; Yang, X.J. Research on the Adaptability of Landless Farmers in Urban Fringe Areas under Rapid Urbanization: A Case Study of Xi’an City. Geogr. Res. 2017, 36, 226–240. (In Chinese) [Google Scholar]
  48. Ma, S.S.; Li, C.W.; Zhang, H.B. Evaluation and Optimization Path of Livelihood Resilience of Farmers around the Yellow Sea Wetland Heritage Area. J. Ecol. Rural Environ. 2023, 39, 1421–1429. (In Chinese) [Google Scholar]
  49. Guo, Y.W. Research on the Construction and Application of Water Environment Performance Audit Evaluation Index System Based on the PSR Conceptual Framework. Yunnan Univ. Financ. Econ. 2016. Available online: https://kns.cnki.net/kcms2/article/abstract?v=A8ynNhXZdPlavVhR57I7FYortw0nRI-PvA5F3exrvL_FA7qZSU1Fn38uYUh6CDOQX_ni1K_K75cIiUjcLIS-iuyAUUc4O8FImFuN57l3Kz2MTGN20yeOp2hGEqVLGZeHRH-FNutyEmBDWYSU8-QCdbUY8AlSRsrhCeqOKyw_gKL50dRR_MqAbyuAbyrQKJ3a&uniplatform=NZKPT&language=CHS (accessed on 17 December 2025).
  50. Ma, C.Q.; Zhang, S.M.; Yuan, X.F.; Zhang, S.Y.; Wang, X.F. Evaluation of Livelihood Resilience of Poverty Alleviation Households in the Qinling Mountains and Its Obstacle Factors: A Case Study of Lantian County, Shaanxi Province. J. Earth Sci. Environ. 2024, 6, 790–803. (In Chinese) [Google Scholar]
  51. Yan, J.Z.; Zhuo, R.G.; Xie, D.T.; Zhang, Y.L. Land Use of Households with Different Livelihood Types: An Empirical Study in Typical Villages of the Three Gorges Reservoir Area. Acta Geogr. Sin. 2010, 65, 1401–1410. (In Chinese) [Google Scholar]
  52. Mo, X.H. Research on the Measurement and Influencing Factors of Livelihood Resilience of Farmers in Rural Tourist Areas on the Urban Fringe of Hangzhou. Zhejiang Gongshang Univ. 2020. [Google Scholar] [CrossRef]
  53. Liu, Q.; Jiang, J.X.; Yang, X.; Zhang, J.Y.; Yang, X.J. Measurement and Influencing Factors of Poverty Vulnerability of Households: An Empirical Analysis Based on the Qinba Mountain Area. Geogr. Res. 2022, 41, 307–324. (In Chinese) [Google Scholar]
  54. Yang, J.; Ding, S.J. Analysis of Income Structure Differences of Households from the Perspective of Rural Industrial Integration and Its Policy Implications: Evidence from Micro-survey in Hubei Province. West. Forum 2019, 29, 97–108. (In Chinese) [Google Scholar]
  55. Meng, M.; Li, J.N. Research on the Impact of Livelihood Capital on the Income of Relocated and Settled Pastoral Households under Different Livelihood Strategies. Comput. Digit. Eng. 2022, 50, 930–935. (In Chinese) [Google Scholar]
  56. Dantas, G.S.; Nagy, I.R.B.; Nogueira, P.B. Implementation of Green Infrastructure in Existing Urban Structures: Tracking Changes in Ferencváros, Budapest. Land 2022, 11, 644. [Google Scholar] [CrossRef]
  57. Wang, D.; Chen, C.; Findlay, C. A review of rural transformation studies: Definition, measurement, and indicators. J. Integr. Agric. 2023, 22, 3568–3581. [Google Scholar] [CrossRef]
  58. Gašparović, S.; Sopina, A.; Zeneral, A. Impacts of Zagreb’s Urban Development on Dynamic Changes in Stream Landscapes from Mid-Twentieth Century. Land 2022, 11, 692. [Google Scholar] [CrossRef]
  59. Guillermo, Z.; Lina, M.T.; Moritz, E.; Karen, R.; Adriana, S.; Byron, M.; Michael, C.; Ha-Mim, M.; Hossain, Z.; Rahaman, K.; et al. Exploring vulnerability–resilience–livelihood nexus in the face of climate change: A multi-criteria analysis for Mongla, Bangladesh. Sustainability 2020, 12, 7054. [Google Scholar] [CrossRef]
  60. Han, X.; Lyu, K.; Nie, F.Y.; Chen, Y.Q. Resilience effects for household food expenditure and dietary diversity in rural western China. J. Integr. Agric. 2024, 23, 384–396. [Google Scholar] [CrossRef]
  61. Cai, J.J.; Wu, X. The Impact of Rural Tourism on the Livelihoods of Poor Households from the Perspective of Social-Ecological System Vulnerability: A Case Study of Beixi Village, Yongchun County, Fujian Province. Taiwan Agric. Explor. 2018, 9–17. (In Chinese) [Google Scholar]
  62. An, C.Y.; Zhai, Z.Y.; Li, T.S. Characteristics of Foreign Research on Rural Tourism in the Past Decade and Its Implications for China: An Analysis Based on the Literature Indexed in Elsevier Science Direct. Resour. Sci. 2020, 42, 956–968. (In Chinese) [Google Scholar]
  63. Li, E.; Deng, Q.Q.; Yang, Z. Livelihood resilience and the generative mechanism of rural households out of poverty: An empirical analysis from Lankao County, Henan Province, China. J. Rural Stud. 2019, 93, 210–222. [Google Scholar] [CrossRef]
  64. Li, L. On the Development of Cultural Tourism Industry and the Protection and Utilization of Cultural Relics in the PostEpidemic Period. Acad. J. Humanit. Soc. Sci. 2021, 4, 72–75. [Google Scholar] [CrossRef]
  65. Liu, M.Y.; Feng, X.L.; Wang, S.G.; Zhong, Y. Does poverty-alleviation-based industry development improve farmers’ livelihood capital? J. Integr. Agric. 2021, 20, 915–926. [Google Scholar] [CrossRef]
  66. Jiang, G.H.; Zhu, T.Y. Construction and Empirical Research of Evaluation Index System for Rural Resilience in China. Stat. Decis. 2024, 7, 75–80. (In Chinese) [Google Scholar]
  67. Liu, W.; Li, J.; Ren, L.J.; Xu, J.; Li, C.; Li, S.Z. Exploring livelihood resilience and its impact on livelihood strategy in rural China. Soc. Indic. Res. 2020, 150, 977–998. [Google Scholar] [CrossRef]
  68. Mu, X.; Fang, C.; Yang, Z.; Guo, X. Impact of the COVID-19 Epidemic on Population Mobility Networks in the Beijing–Tianjin–Hebei Urban Agglomeration from a Resilience Perspective. Land 2022, 11, 675. [Google Scholar] [CrossRef]
  69. Osman, K.A.; Farahat, B.I. The conservation of the water front of Saida: A model for tourism-and culture-led revitalization in valuable areas. Hous. Build. Natl. Res. J. 2018, 14, 321–333. [Google Scholar] [CrossRef]
  70. Setiawan, B.; Hurdawaty, R. Optimization of Tourism Promotion through Tourism Object Location Map: A Case Study of Serang City, Banten Province, Indonesia. South Asian J. Soc. Stud. Econ. 2022, 16, 1–11. [Google Scholar] [CrossRef]
  71. Sina, D.; Chang-Richards, A.Y.; Wilkinson, S.; Potangaroa, R. A conceptual framework for measuring livelihood resilience: Relocation experience from Aceh, Indonesia. World Dev. 2019, 117, 253–265. [Google Scholar] [CrossRef]
  72. Sun, Z.C.; Li, G.T.; Zhang, C.L.; Wang, Z.M.; Lin, Q.M.; Zhao, X.R. Contrasting resilience of soil microbial biomass, microbial diversity and ammonification enzymes under three applied soil fumigants. J. Integr. Agric. 2020, 19, 2561–2570. [Google Scholar] [CrossRef]
  73. Thulstrup, A.W. Livelihood resilience and adaptive capacity: Tracing changes in household access to capital in central Vietnam. World Dev. 2015, 74, 352–362. [Google Scholar] [CrossRef]
  74. Wu, S.; Qin, L.; Shen, C.; Zhou, X.; Wu, J. Food Retail Network Spatial Matching and Urban Planning Policy Implications: The Case of Beijing, China. Land 2022, 11, 694. [Google Scholar] [CrossRef]
  75. Xiao, Y.C.; Liu, S.L. Farmer Households Livelihood Resilience in Ethnic Tourism Villages: A Case Study of the Wuling Mountain Area, China. Sustainability 2023, 15, 662. [Google Scholar] [CrossRef]
  76. Xie, S.Y.; Nie, L.S.; Tian, W.L.; Huang, M.Z.; Qiao, H.F. Construction and Empirical Research of Evaluation Index System for Livelihood Resilience of Households in Mountainous Tourist Areas in China: A Case Study of Enshi Prefecture, Hubei Province. J. Southwest Univ. (Nat. Sci. Ed.) 2024, 46, 131–143. (In Chinese) [Google Scholar]
  77. Yu, R.Y.; Su, X.Y.; Cheng, J.L.; Du, W.X.; Liang, Z.Z. An assessment of the livelihood resilience of tourism smallholders in the upper reaches of Yihe River, China. Local Environ. 2023, 28, 1371–1387. [Google Scholar] [CrossRef]
  78. Pan, Y.L.; Li, X.D.; Wang, Z. Research on the Impact of Rural Tourism on Farmers’ Livelihood Resilience: A Case Study of Ziyun County, Guizhou Province. J. Anshun Univ. 2024, 26, 44–48. (In Chinese) [Google Scholar]
Figure 1. The interactive logic between rural tourism and farmers’ livelihood resilience.
Sustainability 18 00208 g001
Figure 2. The penetrating effect of rural tourism on farmers’ livelihood resilience.
Sustainability 18 00208 g002
Figure 3. Theoretical analysis framework of farmers’ livelihood resilience “tri-dimensions”.
Sustainability 18 00208 g003
Figure 4. The “core–periphery” spatial pattern of Bamboo Craft Village rural tourism.
Sustainability 18 00208 g004
Figure 5. The structure of income sources and per capita disposable income (in ten thousand yuan) of multi-industry farmers in Bamboo Craft Village from 2017 to 2024.
Sustainability 18 00208 g005
Figure 6. Heatmap of livelihood resilience indices for farmers with different livelihood types.
Sustainability 18 00208 g006
Figure 7. Radar chart of vulnerability, adaptability, and recuperability dimension indices in the livelihood resilience of tourism-participating farmers.
Sustainability 18 00208 g007
Figure 8. Chord diagram of gray relational degree among influencing factors of farmers’ “livelihood resilience-vulnerability-exposure level and sensitivity”.
Sustainability 18 00208 g008
Figure 9. Chord diagram of gray relational degree among influencing factors of farmers’ “livelihood resilience–adaptability–internal adaptability and external adaptability”.
Sustainability 18 00208 g009
Figure 10. Chord diagram of gray relational degree among influencing factors of farmers’ “livelihood resilience–recuperability–buffering capability, self-organization capability, and learning capability”.
Sustainability 18 00208 g010
Table 1. Discriminant validity table.
Livelihood VulnerabilityLivelihood AdaptabilityLivelihood Recuperability
Livelihood vulnerability0.793
Livelihood adaptability0.6750.809
Livelihood recuperability0.6630.7700.767
Note: The diagonal values represent the square root of AVE, while the lower triangle indicates Pearson correlations between dimensions.
Table 2. Measurement indicator system for farmers’ livelihood resilience.
Dimension LayerCriterion LayerIndicator LayerProxy Indicators and Assignment MethodsWeightOrientation
Livelihood vulnerabilityExposure levelE1Resilience to natural disasters and adverse ecological environmentsCompletely unbearable, E1 = 5; Unbearable, E1 = 4; Moderate, E1 = 3; Bearable, E1 = 2; Completely bearable, E1 = 10.029
E2Impact of major medical expenses on household financesSignificant impact, E2 = 5; Major impact, E2 = 4; Moderate impact, E2 = 3; Minor impact, E2 = 2; No impact, E2 = 10.040
E3Rate of price inflationExtreme increase, E3 = 5; Substantial increase, E3 = 4; Moderate increase, E3 = 3; Slight increase, E3 = 2; No change, E3 = 10.032
E4Degree of operational challenges in the tourism industryExtremely difficult, E4 = 5; Quite difficult, E4 = 4; Difficult, E4 = 3; Slightly difficult, E4 = 2; Not difficult, E4 = 10.025
E5Number of channels for accessing external informationInternet, television, newspapers, interpersonal communication, government announcements, others (individual)0.031+
SensibilityS1Timeliness of adjusting production methods based on available informationStrongly agree, S1 = 5; Agree, S1 = 4; Uncertain, S1 = 3; Disagree, S1 = 2; Strongly disagree, S1 = 10.029+
S2Guaranteed income for farmers transferring cultivated land and forest landMinimum guaranteed income obtained from circulation (yuan/acre)0.025+
S3Willingness to initiate or sustain tourism-related business operationsIf willing, what is the reason, S3 = 1; If not willing, what is the reason, S3 = 00.027+
S4Dependence on tourism industry incomeMore than 75%, S4 = 5; 50% to 75%, S4 = 4; 25% to 50%, S4 = 3; 0 to 25%, S4 = 2; 0, S4 = 10.042
S5Impact of tourism-related policies on household livelihoodsVery significant impact, S5 = 5; Significant impact, S5 = 4; Moderate impact, S5 = 3; Minor impact, S5 = 2; No impact, S5 = 10.026
S6Ecological status of Linpan settlementsVery good, S6 = 5; Good, S6 = 4; Average, S6 = 3; Poor, S6 = 2; Very poor, S6 = 10.028+
Livelihood adaptabilityInternal adaptabilityIA1Livelihood diversityThe number of types of activities engaged in by the household, such as planting, breeding, handicraft production, local employment, local business, employment in other places, and business in other places.0.028+
IA2Household durable consumer goodsThe total number of durable consumer goods such as rice cookers, washing machines, refrigerators, solar energy equipment, air conditioners, bicycles, motorcycles, cars, and trucks.0.034+
IA3Proportion of family members engaged in external employmentThe proportion of the number of family members working outside to the total number of permanent residents in the household.0.037+
IA4Stability of wage income for migrant workersVery stable, IA4 = 5; relatively stable, IA4 = 4; average, IA4 = 3; unstable, IA4 = 2; very unstable, IA4 = 1.0.028+
External adaptabilityEA1Perception of agricultural livelihood risksOperational Tenure: ≥40 years, EA1 = 5; 30~39 years, EA1 = 4; 20~29 years, EA1 = 3; 10~19 years, EA1 = 2; <10 years, EA1 = 10.035+
EA2Perception of tourism livelihood risksOperational Tenure: ≥40 years, EA2 = 5; 30~39 years, EA2 = 4; 20~29 years, EA2 = 3; 10~19 years, EA2 = 2; <10 years, A5 = 10.031+
EA3Ease of obtaining loans and creditExtremely Easy, EA3 = 5; Relatively Easy, EA3 = 4; Moderate, EA3 = 3; Relatively Difficult, EA3 = 2; Extremely Difficult, EA3 = 10.037
EA4Dependence on land resourcesHighly Dependent, EA4 = 5; Moderately Dependent, EA4 = 4; Neutral, EA4 = 3; Slightly Independent, EA4 = 2; Completely Independent, EA4 = 10.038
EA5Dependence on tourism resourcesHighly Dependent, EA5 = 5; Moderately Dependent, EA5 = 4; Neutral, EA5 = 3; Slightly Independent, EA5 = 2; Completely Independent, EA5 = 10.033
EA6Awareness and protection of material and non-material resourcesVery Strong, EA6 = 5; Strong, EA6 = 4; Moderate, EA6 = 3; Weak, EA6 = 2; Very Weak, EA6 = 10.034+
Livelihood recuperabilityBuffer capabilityC1Scale of cultivationScale of Cultivating farmers (square meter)0.019+
C2Per capita residential areaTotal Residential Area per Household Member (m2)0.016+
C3Per capita cultivated land areaTotal Cultivated Land Area per Household Member (square meter)0.019+
C4Condition of land resourcesArea of Land Resources for Self-use and Lease, Including Paddy Fields, Drylands, Woodlands, Orchards, and Ponds (square meter)0.018+
C5Labor force sizeNumber of Labor-capable Individuals Aged 16 to 60, Excluding Students (Note: Labor Force = Healthy Labor × 1 + Weak Labor × 0.5 + Non-labor × 0)0.021+
C6Annual per capita household incomeAnnual Household Income per Household Member (RMB)0.016+
Self-organizing capabilityO1Leadership capabilitiesTotal number of government, institutional, and corporate personnel in the household0.018+
O2Frequency of participation in community activitiesAlways participate, O2 = 5; Frequently participate, O2 = 4; Occasionally, O2 = 3; Rarely participate, O2 = 2; Do not participate, O2 = 10.020+
O3Level of trust in neighborsHighly trust, O3 = 5; Moderately trust, O3 = 4; Neutral, O3 = 3; Distrust, O3 = 2; Strongly distrust, O3 = 10.019+
O4Level of trust in village officialsHighly trust, O4 = 5; Moderately trust, O4 = 4; Neutral, O4 = 3; Distrust, O4 = 2; Strongly distrust, O4 = 10.019+
O5Number of community-related organizations participated inNumber of professional cooperatives (land equity, bamboo craft and cultural innovation, tourism cooperatives, etc.), family farms, associations, industrial complexes, enterprises, platforms, etc., participated in (units)0.016+
O6Recent market accessibility and transportation convenienceVery convenient, O6 = 5; Moderately convenient, O6 = 4; Neutral, O6 = 3; Inconvenient, O6 = 2; Very inconvenient, O6 = 10.018+
Learning capacityL1Educational attainmentEducation Level: University and above, L1 = 5; High School and Technical Secondary School, L1 = 4; Junior High School, L1 = 3; Primary School, L1 = 2; No Formal Education, L1 = 1.0.019+
L2Attention to information on agriculture, tourism, culture, and commerceAwareness Level: Very Clear, L2 = 5; Relatively Familiar, L2 = 4; Somewhat Aware, L2 = 3; Occasionally Consulted, L2 = 2; Never Concerned, L2 = 1.0.020+
L3Opportunities for family skill trainingAnnual Frequency of Participation in Agri-Tourism, Cultural Tourism, and Other Employment Technical Training and Vocational Skill Enhancement Activities.0.018+
L4Information comprehension abilityAbility to Fully Understand and Distinguish the Authenticity of Various Information: Almost Always, L4 = 5; Mostly, L4 = 4; Half the Time, L4 = 3; Mostly Not, L4 = 2; Almost Never, L4 = 1.0.018+
L5Technical communication skillsFrequency of Technical Experience Exchange with Others: Frequent, L5 = 5; Relatively Frequent, L5 = 4; Moderate, L5 = 3; Infrequent, L5 = 2; None, L5 = 1.0.020+
L6Livelihood needs that the government must considerNeeds: Assistance in Land Transfer, Environmental Improvement, Technical Training and Support, Expansion of Sales Channels, Increase in Product Sales Volume, and Access to Basic Insurance.0.017+
Table 3. Classification of farmers’ livelihood types.
Livelihood TypeClassification CriteriaQuantityProportion (%)
tourism-drivenTourism revenue ≥ 70%, other income < 30%7624.92
labor-drivenNon-tourism business income ≥ 70%, other income < 30%12240.00
agriculture-drivenNon-tourism agricultural income ≥ 70%, other income < 30%4414.43
composite livelihoodHousehold income sources are two or more, and the proportion of each type of income is < 70%6320.65
Total305100
Table 4. Classification of farmer types based on participation levels.
TypeParticipating FarmersNon-Participating Farmers
Classification basisIncome sources include income from economic activities such as tourism services, tourism development, and employment in the tourism industry chain.Income sources do not include income directly or indirectly obtained from the tourism industry.
Quantity 167138
Proportion54.75%45.25%
Table 5. Fundamental characteristics of farmers with diverse livelihood strategies.
Farmers TypeTourism
-Driven
Labor
-Driven
Agriculture
-Driven
Composite LivelihoodParticipants in TourismNon-Participants in Tourism
Cultivation scale (square meter)0.912.643.222.840.912.64
Per capita residential area (m2)59.7562.5046.5351.5062.5053.44
Number of labor force (persons)1.732.161.322.022.162.45
Percentage of migrant workers0.632.791.352.040.610.60
Guaranteed income from land transfer (yuan/mu)434.29559.03522.41538.12532.40560.42
Annual per capita farmers’ income (10,000 yuan)8.627.456.378.067.835.37
Table 6. Livelihood resilience index of farmers by livelihood typology.
TypeLivelihood VulnerabilityLivelihood AdaptabilityLivelihood RecuperabilityLivelihood Resilience
tourism-driven0.19790.18210.17600.5560
labor-driven0.18680.18020.16870.5358
agriculture-driven0.19130.17940.13270.5035
composite livelihood0.20530.17440.16320.5429
Total sample0.19530.17910.16020.5346
Table 7. Livelihood resilience index of farmers participating in tourism.
TypeLivelihood VulnerabilityLivelihood Adaptability Livelihood RecuperabilityLivelihood Resilience
Participants in tourism0.18510.16100.14710.4932
Non-participants in tourism0.18300.16430.12450.4719
Table 8. Grey relational analysis of farmers’ livelihood resilience with vulnerability, adaptability, and recuperability.
IndicatorsRelational DegreeRank
Livelihood vulnerability0.89211
Livelihood adaptability0.83403
Livelihood recuperability0.83862
Table 9. The top 10 common obstacle factors and obstacle degree of farmers’ livelihood resilience.
IndicatorsObstacle DegreeRank
Ease of access to loans and borrowings (EA3)5.84%1
Dependence on land resources (EA4)5.59%2
Perception of agricultural livelihood risks (EA1)5.20%3
Perception of tourism livelihood risks (EA2)4.76%4
Dependence on operational income from tourism industry (S4)4.49%5
Livelihood diversity (IA1)4.22%6
Ecological status of Linpan settlements (S6)4.18%7
Willingness to initiate or sustain tourism-related business operations (S3)3.78%8
Dependence on tourism resources (EA5)3.58%9
Guaranteed income for farmers from transferring cultivated and forest land (S2)3.47%10
Table 10. Top 10 obstacle factors and their degrees of impedance for livelihood resilience among different types of rural farmers.
RankTourism-DrivenLabor-DrivenAgriculture
-Driven
Composite LivelihoodParticipants Non-Participants
1EA35.85%EA35.65%EA45.33%EA35.50%EA35.68%EA45.60%
2EA45.81%EA45.51%EA35.03%EA45.49%EA45.65%EA35.52%
3EA15.48%EA15.16%S44.95%EA15.07%EA15.29%EA15.10%
4EA25.00%EA24.73%EA14.59%EA24.61%EA24.84%EA24.67%
5S44.66%S44.42%EA24.24%IA14.16%S44.60%S44.38%
6S64.34%IA14.24%IA14.12%S44.12%S64.23%IA14.23%
7IA4.27%S64.15%S34.04%S64.06%IA14.22%S64.14%
8S33.87%S33.70%S64.00%S33.67%S33.80%S33.76%
9EA53.71%EA53.58%S23.87%EA53.57%EA53.65%EA53.52%
10S23.52%EA63.43%E53.47%E53.53%S23.53%E53.42%
Disclaimer/Publisher’s Note: The statements, opinions and data contained in all publications are solely those of the individual author(s) and contributor(s) and not of MDPI and/or the editor(s). MDPI and/or the editor(s) disclaim responsibility for any injury to people or property resulting from any ideas, methods, instructions or products referred to in the content.