Abstract
Energy-induced carbon emissions make up more than 70% of China’s total carbon emissions. In this study, carbon emissions categorized by energy source and industry type in Beijing from 2013 to 2020 were analyzed. The Tapio model was used to reveal the decoupling effect between economic development levels and carbon emissions, and the log-mean score Difference index (LMDI) decomposition method was used to identify impact factors. From 2013 to 2020, Beijing’s energy-related carbon emissions decreased by 21.1%, while GDP increased by 70.8%, and Beijing achieved absolute decoupling of economic development level and carbon emissions, especially after implementing strict environmental protection policies and expediting the transition of energy consumption structure. Although economic growth had a driving effect on carbon emissions, this driving effect gradually weakened, and Beijing achieved carbon emission reduction mainly through the energy consumption intensity effect (−302.1%) and carbon emission factor effect (104.1%). This study reveals the decoupling effect of economic development level and carbon emissions, emphasizes the key role of policy, technology, and structural adjustment in achieving sustainable development, and provides valuable experience and reference for other cities and regions to formulate low-carbon development strategies.
1. Introduction
Energy is the key material foundation for promoting economic and societal evolution, as well as the major source of carbon emissions [1]. It is estimated that China’s secondary energy demand will reach a staggering 6 billion tonnes of standard coal by 2030, increasing annually by 2%. In the context of the “Dual Carbon” goal, China has accelerated its green and low-carbon transition and has achieved remarkable progress. Nevertheless, the path from a fossil fuel-based energy consumption structure to a low-carbon and renewable-oriented structure remains lengthy and challenging [2,3]. Ensuring a secure energy supply while simultaneously reducing carbon emissions has become a globally shared objective. In 2020, China announced that it would further increase its intended nationally determined contributions, aiming to achieve a carbon peak by 2030 and carbon neutrality by 2060. However, Beijing’s current energy consumption mix is still heavily reliant on carbon-containing fossil fuels such as oil and natural gas. To successfully meet the dual carbon goal, increasing the share of renewable energy is essential [4,5]. Hence, how to optimize Beijing’s energy mix, replace carbon-heavy fossil fuels with zero-carbon renewable energy, and thereby reduce carbon emissions to achieve the dual carbon target earlier and more smoothly constitutes an urgent research issue.
In recent years, considerable research has examined the various influencing factors of carbon emission intensity in energy consumption, yielding an extensive body of literature on how these factors affect carbon emissions. Population factors and urbanization [6], energy structure [7], energy efficiency [8], and economic development [9,10] are frequently regarded as primary contributors to rising carbon emissions. Moreover, these impact factors may vary with the scope of the research (e.g., different regions, time frames, or sectors) [11].
Methodologically, existing research commonly employs two main approaches—regression analysis and structural decomposition methods—to examine the elements affecting carbon emissions. The regression analysis primarily utilizes frameworks like the STIRPAT model, the Environmental Kuznets Curve (EKC), and spatial regression models to estimate how variables like population, wealth, and energy structure affect carbon emissions. Shahbaz et al. explored how urbanization affected CO2 emissions in Malaysia from 1970 to 2011 using the STIRPAT model [12]. Huang et al. utilized conventional estimation techniques, including the Driscoll and Kraay estimator, fixed effects with instrumental variables, and the difference generalized method of moments, within the STIRPAT model framework to evaluate the influence of energy patents on carbon emissions [13]. Zhou et al. calculated carbon emissions by examining both production and consumption aspects and established a carbon transfer network among the main countries worldwide. Additionally, they investigated how attention to and content of carbon-related news directly and indirectly affect carbon emissions and the transfer of carbon, utilizing an extended version of the STIRPAT model [14]. Structural decomposition approaches, represented by the Logarithmic Mean Divisia Index (LMDI) are used to quantitatively measure the contribution of different factors to carbon emission changes. Liu et al. developed a decomposition and decoupling technique for carbon emissions in the transportation sector using LMDI by integrating the C–D production function. They identified and measured seven distinct effects [15]. He et al. employed the LMDI decomposition method to quantify the contributions of nine factors to the increase in carbon emissions from China’s electricity industry [16]. According to existing research findings, in situations where the number of research subjects is limited, the structural decomposition method represented by the LMDI model has significant advantages over regression analysis due to its absence of residual effects and high explanatory power [17]. However, many studies oversimplified industry and energy-type distinctions during the decomposition process, potentially compromising the accuracy of their empirical findings.
As the capital of China, Beijing is not only a political, economic, and cultural center but also a critical region for energy utilization and carbon outputs. The city’s energy structure heavily relies on fossil fuels—coal and natural gas—resulting in a substantial share of carbon emissions. Analyzing Beijing’s carbon emissions and their influencing factors from 2013 to 2020 is of great importance, as this period includes the execution of several notable policies, such as the “2013–2017 Clean Air Action Plan” and the “Three-Year Action Plan to Win the Blue Sky Defense War”. These measures targeted air quality improvements, energy structure optimization, and carbon emission reductions. Investigating the evolution of carbon emissions and energy restructuring during this period allows for assessment of policy efficacy, identification of key emission drivers, and provision of data-driven references for more effective mitigation strategies. Such analysis is highly relevant for Beijing’s endeavors toward carbon neutrality and offers valuable insights for other cities that aim to adopt similar low-carbon pathways.
Against this backdrop, the main focus of this paper is on dissecting the drivers of carbon emissions and evaluating the decoupling effects of energy consumption in Beijing between 2013 and 2020 under the dual carbon framework. Specifically, this paper addresses three key questions. First, what are the primary drivers of Beijing’s carbon emissions? By calculating carbon emissions associated with energy consumption—classified by industry and energy type—we aim to identify which sectors and energy sources contribute most significantly to carbon emissions. Second, how do carbon emissions and economic growth decouple at different stages of Beijing’s development? Employing the Tapio decoupling model, we analyze the changes in the relationship between economic momentum and carbon emissions and assessed whether Beijing’s policies have successfully mitigated emissions intensity while maintaining economic performance. The comprehensive investigation in this paper adds empirical evidence on how urban energy-related policies and interventions influence carbon emissions in a highly industrialized and populous city. By integrating the Tapio decoupling analysis with a detailed factor decomposition of industries and energy types, this study provides nuanced insights that can inform urban policy-making under the dual carbon targets. Ultimately, this study aims to offer guidance both for Beijing’s continued pursuit of carbon neutrality and for other cities striving to enhance their low-carbon transition strategies, thereby contributing to a broader dialogue on global sustainable development.
2. Data and Methods
2.1. Data Acquisition and Processing
We extracted annual fuel consumption (coal, oil, and natural gas) by sector directly from the Beijing Statistical Yearbook, which disaggregates industries according to the official classification used by the National Bureau of Statistics (NBS). We assume that the sectoral distribution of energy consumption follows the categories reported in the Beijing Statistical Yearbook without further re-classification, thus aligning our results with official definitions of industrial and service sub-sectors.
Original energy data are typically reported in physical units (e.g., metric tons of coal and cubic meters of natural gas). To facilitate comparison and aggregation, we converted these physical units into tons of standard coal equivalents (TCE) using the conversion factors published in the China Energy Statistical Yearbook. For calculating carbon emissions, we applied the officially recommended conversion factors for each fuel type (coal, oil, and natural gas), which reflect differences in average calorific values and carbon contents. Where necessary, we supplemented these factors with the IPCC guidelines (2006 IPCC Guidelines for National Greenhouse Gas Inventories) to maintain compatibility with international standards.
GDP data were in current prices as reported yearly. Any inter-year analyses requiring constant prices used the GDP deflator from the Beijing Statistical Yearbook to adjust for inflation.
2.2. Carbon Emissions Assessment
Given that carbon emissions caused by energy consumption in Beijing constitute a significant portion of the province’s total emissions, this paper focuses on analyzing the carbon emissions resulting from Beijing’s energy consumption. The calculation method employed is based on the guidelines provided in the ‘2006 IPCC Guidelines for National Greenhouse Gas Inventories’ to estimate carbon emissions from energy combustion [18]. Specifically, the overall carbon emissions are determined by adding up the emissions produced from different forms of energy consumption, as detailed in the following equation:
In this context, reflects the overall carbon emissions from different forms of energy use, measured in ten thousand tons. denotes the consumption of the energy type of , expressed in terms of standard coal equivalent, also measured in ten thousand tons. is the carbon emission factor for the energy type of . The variable n refers to the types of fossil fuels, specifically coal, oil, and natural gas, thus, equals 3.
The result calculated using the above formula represents the carbon emissions. To convert this result into CO2 emissions, it must be multiplied by the factor 12/44, which represents the mass fraction of carbon in CO2.
The energy consumption data, denoted by , are sourced from the ‘Beijing Energy Statistical Yearbook’ for the years 2013 to 2020. Coal and oil consumption is measured in ten thousand tons and must be converted to standard coal equivalent (SCE) units. The conversion factors are derived from the appendix of the ‘China Energy Statistical Yearbook 2011’, with raw coal having a conversion factor of 0.7143 kgce/kg and crude oil having a factor of 1.4286 kgce/kg. The carbon emission factors for various selected energies are shown in Table 1. GDP and industrial value-added data are obtained from the ‘Beijing Statistical Yearbook’ for the years 2013 to 2020 and have been adjusted to constant 2013 prices.

Table 1.
Carbon emission coefficient of various energy sources.
2.3. Tapio Decoupling Model
This article analyzes the decoupling elasticity between economic growth and carbon emissions using the Tapio decoupling model, with calculations shown in Equation (2):
In the formula, reflects the decoupling flexibility, indicates the total change in carbon emissions, and illustrates the total change in . According to Table 2, in order to more clearly explain the eight decoupling state classifications of the Tapio model, this study compares and summarizes their elastic values.
Table 2.
Comparison of the 8 grades of Tapio and their elasticity values.
2.4. LMDI Model Construction of Carbon Emission Influencing Factors
Carbon emissions are influenced by numerous factors. Drawing on prior studies and the current situation of energy consumption in Beijing, the main factors influencing carbon emissions are economic output, industrial structure, energy intensity, and the composition of the energy consumption mix. Accordingly, this paper applies the modified Logarithmic Mean Divisia Index (LMDI) method by Ang B.W. to decompose Beijing’s carbon emissions using a carbon emission identity model. The model integrates the effects of economic output, industry structure, energy efficiency, energy use composition, and carbon emission factor. The developed model is structured as follows [19]:
In the formula, = 1, 2, 3, represents industrial types, while = 1, 2 indicates types of primary energy consumption, such as coal and oil. denotes the total CO2 emissions from energy consumption, while represents the CO2 emissions from the industry of i consuming the energy type of . stands for total Gross Domestic Product (in hundred million yuan), and is the GDP of the i-th industry. signifies the total energy consumption of the i-th industry, and indicates the energy consumption of the -th industry using the -th type of energy. is the share of the i-th industry’s GDP in the total GDP, representing the industrial structure effect. is the energy consumption intensity effect, indicating the emissions per unit of GDP for the -th industry. denotes the share of j-th energy consumption in the i-th industry, representing the energy structure effect. Lastly, is the CO2 emission factor for the -th type of energy consumed by the i-th industry, reflecting the carbon emission factor effect.
Furthermore, the change in total carbon emissions is considered as a comprehensive effect, denoted by . Based on the decomposition expression, the overall impact on total carbon emissions is divided into five components: the economic output impact, the industrial framework impact, the energy intensity impact, energy consumption composition impact, and carbon emission coefficient impact.
According to the additive decomposition form of the LMDI model, let the base period’s total carbon emissions be , and the total carbon emissions at time T be . The change in carbon emissions from the base period to time T, denoted as , is expressed by the following formula:
The expressions for the contribution values of each decomposition factor are as follows:
Economic Output Effect:
Industrial Structure Effect:
Energy Intensity Effect:
Energy Consumption Structure Effect:
Carbon Emission Factor Effect:
Overall Effect:
Since the carbon emission coefficients for each type of energy are fixed values, they are zero in the decomposition analysis and can be ignored. Characteristics across different urban areas.
3. Results
3.1. Energy-Related Carbon Emissions Assessment
As shown in Figure 1, based on the data provided for Beijing’s energy-related carbon emissions from 2013 to 2020, energy-related carbon emissions were segmented by primary, secondary, and tertiary industries. Overall, a notable downward trend is observed across all three sectors—a strong indication that various policy measures, technological advancements, and structural economic shifts have collectively fostered reduced carbon intensity.
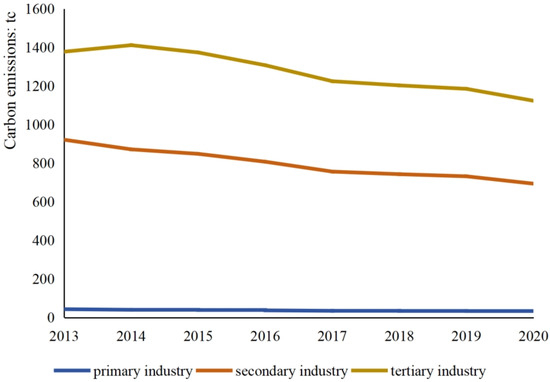
Figure 1.
Carbon emissions related to energy by industry type in Beijing from 2013 to 2020.
The carbon emissions from the primary industry have shown a consistent decline over the years. Starting at 43.09 tc in 2013, emissions decreased to 31.81 tc by 2020. While this sector already represents a relatively small share of Beijing’s GDP, the reduction may be linked to policy-driven improvements in agricultural efficiency, stricter environmental guidelines for rural activities, and scaled-back primary industry operations as Beijing’s economy continues to urbanize and service-oriented industries expand. The secondary industry, which typically includes manufacturing and construction, dropped significantly from 920.74 tc in 2013 to 693.21 tc in 2020. This substantial reduction could be attributed to the Beijing Clean Air Action Plan (initiated in 2013), which included replacing coal-fired industrial boilers with cleaner fuels, setting tighter emissions standards, and encouraging the relocation or upgrading of high-emission manufacturing plants. Additionally, improved industrial energy efficiency—driven by technological innovations and economic incentives—appears to have accelerated the sector’s decarbonization. Emissions from the tertiary industry, encompassing services and other non-industrial sectors, fell from 1376.82 tc in 2013 to 1122.69 tc in 2020. This decrease reflects Beijing’s continuous shift toward a modern service economy that relies more on digitalized operations and energy-efficient buildings. Policy interventions—such as green building codes, widespread adoption of electrified public transport, and incentives to promote low-carbon office environments—likely contributed to this downward trend.
Taken together, the observed inter-industry reductions underscore Beijing’s evolving economic structure and the impact of targeted environmental policies. Although emissions remain largest in the tertiary sector due to the sheer scale of service activities, the overall downward trajectory across all industries highlights the city’s notable progress in mitigating carbon emissions. Continued policy support aimed at efficiency improvements and cleaner energy sources will be essential to maintaining and accelerating these gains.
Figure 2 analyzes Beijing’s energy-related carbon emissions based on coal, oil, and natural gas consumption from 2013 to 2020, revealing distinct patterns tied to specific policy initiatives and market shifts.
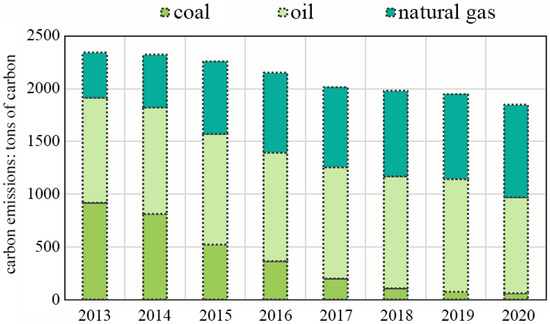
Figure 2.
Carbon emissions related to energy in Beijing from 2013 to 2020 by energy type.
Coal emissions dropped markedly from 921.59 tc in 2013 to just 59.80 tc in 2020. This steep decline aligns with Beijing’s targeted coal abatement policies, including the closure of coal-fired power plants within the municipality, the conversion of residential heating systems to natural gas or electricity, and the enforcement of stringent emissions standards. These measures were part of an aggressive strategy to enhance air quality and public health. Oil emissions showed moderate fluctuation, beginning at 991.94 tc in 2013 and peaking at 1072.92 tc in 2019 before decreasing to 908.97 tc in 2020. This trend reflects the complexity of phasing out oil, which is heavily used in transportation and certain industrial applications. While policy-driven improvements, such as upgraded vehicle emissions standards, expanded electric public transport systems, and subsidies for electric vehicles, have likely tempered oil consumption, ongoing economic activities and travel demands continue to make oil a significant source of emissions. The slight dip in 2020 may partly stem from these cleaner transport policies and a gradual increase in alternative-fuel adoption. Emissions from natural gas climbed consistently from 427.12 tc in 2013 to 878.95 tc in 2020. Although natural gas still produces carbon emissions, its rise in Beijing’s energy mix signifies a broader shift to cleaner-burning fuels. As part of a transitional strategy, natural gas replaced a sizeable portion of coal usage, mitigating both carbon and local air pollutant emissions. This transition was further supported by expanded pipeline networks and government investments in gas-fired heating and power generation.
From a broader perspective, the rapid reduction in coal emissions and the increasing reliance on natural gas underscore a deliberate transition towards lower-carbon fuels. Oil remains a challenging area, indicating opportunities for further policy action—particularly in transport electrification, industrial process innovations, and increased use of biofuels or hydrogen. Overall, Beijing’s energy mix reshaping demonstrates tangible successes in coal reduction strategies and highlights the potential for continued progress through investment in renewable energy, energy efficiency improvements, and sustained technological innovation.
3.2. Analysis of Decoupling Status in Beijing
As illustrated in Figure 3, Beijing experienced a state of absolute decoupling from 2014 to 2020. During this period, the economy continued to grow while carbon emissions underwent a significant reduction. The decoupling elasticity index remained negative throughout, indicating that emissions declined at a faster rate than GDP grew.
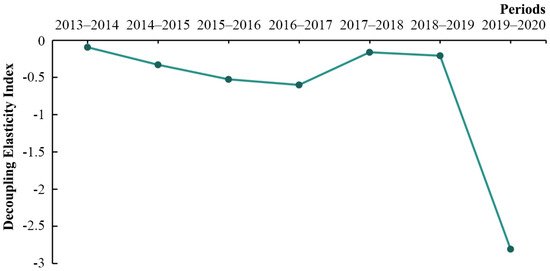
Figure 3.
Changes in the energy-related carbon emission decoupling elasticity index in Beijing from 2013 to 2020.
From 2014 to 2017, the index dropped from −0.10 to approximately −0.60, suggesting a deepening degree of decoupling, likely driven by tighter environmental regulations under Beijing’s Clean Air Action Plans (e.g., restricting coal consumption and enforcing stricter emission standards in industry and transport) and ongoing shifts in the city’s industrial structure. Although the index value increased slightly in 2018 and 2019 (meaning the absolute value became smaller), it still stayed below zero, implying continued absolute decoupling despite a modest slowdown in the momentum of emission reductions.
Notably, the index reached −2.81 in 2020, reflecting that the reduction in carbon emissions that year far outpaced GDP growth. While this jump partly underscores the effectiveness of Beijing’s long-term efforts to curb emissions, it was also likely influenced by the COVID-19 pandemic, which suppressed economic activity but further curbed carbon output. Going forward, maintaining absolute decoupling will depend on how well Beijing sustains its policy mechanisms and technological investments once pandemic-related constraints ease. By analyzing the interplay between ongoing initiatives (e.g., phasing out coal-fired boilers and promoting clean vehicles) and broader economic recovery, policymakers can gauge how robustly this decoupled growth pattern can endure in the post-pandemic era.
3.3. Influencing Factors of Energy-Related Carbon Emissions
As shown in Table 3 and Figure 4, the data provided illustrate the Logarithmic Mean Divisia Index (LMDI) decomposition analysis of carbon emissions in Beijing, broken down into various contributing factors from 2013 to 2020.
Table 3.
LMDI decomposition of carbon emissions from production and energy consumption in Beijing from 2013 to 2020 (unit: million tc).
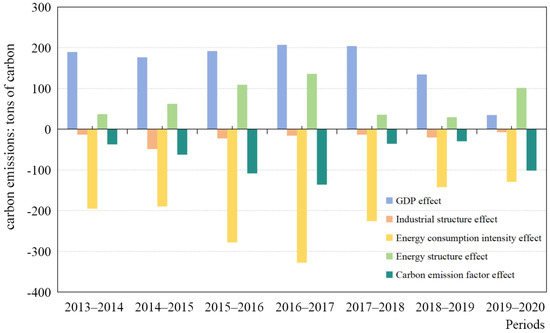
Figure 4.
LMDI decomposition of carbon emissions from production and energy consumption in Beijing from 2013 to 2020.
During the air pollution prevention and control action plan (2013–2017), carbon emissions linked to economic growth (i.e., GDP effect) remained consistently strong (1894.6–2072.6 million tons), illustrating that expansion in industrial output and services continued to generate upward pressure on emissions. This trend underscores the challenge of achieving growth while limiting carbon output, emphasizing the need for more robust measures in energy efficiency and cleaner production. The notable negative values of industrial structure effects (−134.1 to −490.0 million tons) highlight significant restructuring of Beijing’s economy away from high energy-intensive sectors. These negative contributions suggest the effectiveness of policy measures aimed at phasing out polluting industries and promoting higher-value, lower-emission sectors, such as technology and services. Energy consumption intensity effect provided the largest downward pull on emissions, ranging from −1952.0 to −3279.2 million tons. The marked decline in energy consumption per unit of GDP reflected improvements in industrial processes, the adoption of higher-efficiency technologies, and stricter energy auditing and management initiatives. The prominence of this factor suggests that further scaling up efficiency standards can yield even greater emission reductions. The energy structure effect alternated between positive and negative contributions but remained overall negative, with values of 371.3, 622.7, 1087.9, and 1362.0 million tons. This pattern indicates that increasing the share of clean and low-carbon energy (e.g., natural gas and renewables) made notable progress, albeit with occasional variability. The rising negative contribution points toward a growing reliance on cleaner energy options, a direction that, if accelerated, can solidify long-term decarbonization gains. The carbon emission factor effect consistently showed negative contributions that increased over time, recorded at −371.3, −622.7, −1087.9, and −1362.0 million tons, indicating that a reduction in carbon emission factors (such as raising carbon emission standards) significantly lowered carbon emissions.
In the three-year action plan phase for the Blue Sky Defense campaign (2017–2020), carbon emissions continued to decline, with a total reduction of −1665.4 million tons. The GDP effect decreased markedly from 2039.9 to 347.4 million tons. This may reflect both the effects of the Blue Sky campaign’s stringent measures and broader shifts in economic activity, especially in 2020 when COVID-19 dampened economic expansion. The negative contribution from industrial structure effects weakened, with figures ranging from −138.4 to −70.7 million tons. This could be due to diminishing returns from earlier restructuring efforts or new economic pressures, such as attracting certain industries or grappling with slower growth, that hindered further large-scale transformation. The energy consumption intensity effect continued to be negative, recorded at −2257.6, −1426.5, and −1293.2 million tons. Additional technology upgrades and deeper structural changes (e.g., deploying smart grids and green building programs) could reignite larger future gains. The energy structure effect underscored tightened emission standards, upgraded pollution controls, and advanced technology adoption that effectively lowered emission factors, moving from −356.1 and −293.8 to −1015.5 million tons. Notably, the significant negative figure of −1015.5 million tons in the final year underscores how the expansion of renewables and the shift from coal to natural gas contributed to meaningful emissions reductions, especially against the backdrop of the Blue Sky Defense campaign. The carbon emission factor effect continued to show negative contributions, significantly increasing in 2020, with figures from −356.1 to −1015.5 million tons, further underscoring the role of enhanced carbon emission standards and technological advancement in reducing carbon emissions.
4. Discussion
4.1. Driving Factors of Carbon Emissions
After decomposing the model, we find that the energy consumption intensity effect and the carbon emission factor effect are the main contributors to the reduction of carbon emissions in Beijing over the years. This aligns with the findings of Mi et al., who contend that reducing energy intensity need not negatively impact economic growth [20]. In Beijing’s case, on the one hand, rationally adjusting the industrial structure can reduce energy intensity while still supporting economic progress. On the other hand, rapid economic development may, in turn, drive improvements in energy efficiency.
Similar to previous studies, here we observe that GDP development used to be the primary driver of Beijing’s carbon emissions, particularly before 2013, though its relative influence has declined since 2013. This result is consistent with Li et al. [5], who also identify reductions in energy consumption intensity as the most significant factor behind lower emissions in Beijing. However, our findings further highlight that a significant decline in carbon emissions occurred in 2020, which may reflect not only the continued adjustment toward low-carbon industries but also the influence of the COVID-19 pandemic. The economic slowdown and corresponding restrictions in 2020 could have temporarily suppressed energy demand and emissions. Additionally, from 2013 to 2020, Beijing implemented a series of carbon emission control policies such as the Action Plan for Air Pollution Prevention and Control and the Three-year Action Plan for Blue Sky Defense. These policies significantly reduced carbon emissions by enhancing the industrial framework, boosting energy efficiency, and facilitating the transition of the energy system.
From 2013 to 2020, Beijing’s coal consumption experienced a significant decrease, while the use of natural gas as a transitional fuel saw a notable increase. While this study primarily examines the emission reduction effects of transitioning from coal to natural gas, Beijing must still deepen the development and utilization of renewable energy sources such as solar and wind power in the future. On one hand, distributed photovoltaic and wind power projects can be widely deployed across urban buildings and industrial parks, reducing reliance on external power supplies. On the other hand, supporting infrastructure—including smart grids and energy storage systems—will enhance the integration and dispatch efficiency of clean energy. When implemented in tandem with the coal-to-gas transition, these measures will not only advance fuel decarbonization but also diversify the energy mix and strengthen the resilience of the power system. Collectively, they will provide sustained support for Beijing and its surrounding regions in accelerating progress toward a low-carbon energy transition.
4.2. Evaluation of Decoupling Effect Between Economic Development and Carbon Emissions
Our results demonstrate that Beijing achieved a notable decoupling of economic growth from carbon emissions during 2013–2020, especially following stricter environmental policies and adjustments in the energy structure. Strict interventions such as reducing energy-intensive industries, promoting clean energy, and limiting vehicle use (2013–2017), complemented by increasingly efficient energy-saving technologies (post-2018), contributed to this decoupling [21]. Simultaneously, we observe that Shanghai exhibits weaker decoupling characteristics between carbon emissions and economic development, notably due to the substantial proportion of manufacturing and port logistics in its economic structure, resulting in a stronger correlation between its carbon emissions and economic growth. In contrast, Beijing demonstrates relatively stronger decoupling performance in this regard, driven by industrial restructuring and technological innovation [22].
Nevertheless, the year 2020 stands out due to the COVID-19 pandemic, which could have accentuated the reduction in emissions by curtailing certain economic activities. Widespread shutdowns and travel restrictions during the epidemic have “unexpectedly” reduced energy consumption and transportation demand to a certain extent in the short term, thus curbing current carbon emissions. Although these findings confirm earlier conclusions on Beijing’s policy effectiveness [23,24], they also highlight the importance of considering extraordinary events when evaluating long-term trends. Compared with other regions analyzed in prior studies, Beijing’s context features a relatively high proportion of service-industry output, advanced emission control measures, and rapid technological updates, thereby reinforcing or extending those studies’ insights under a distinctly urban and policy-intensive setting [25,26].
Looking ahead, the long-term sustainability of Beijing’s decoupling process may face structural constraints. Continued investment in technology renewal and deeper industrial restructuring will be crucial to avoiding growth bottlenecks [27]. Although efforts toward industrial upgrading persist, traditional energy-intensive industries still occupy a non-negligible share of the economy [28]. Consequently, future decoupling strategies in Beijing should balance ongoing industrial transitions with sustained policy efforts, while also accounting for exogenous shocks like pandemics or macroeconomic fluctuations that may further affect emissions trajectories.
4.3. Future Policy Recommendations
The industry-type energy-based accounting identifies key industries (e.g., agriculture, forestry, manufacturing, construction, commerce, and information technology) where final demand leads to significant upstream CO2 emissions. Building on these insights, the Beijing municipal government should establish robust mechanisms to encourage low-carbon consumption and improve transparency. For instance, carbon footprint labeling and tiered carbon taxes can help foster a culture of low-carbon consumption, especially within service sectors and high-traffic commercial areas. Meanwhile, major companies operating in these key industries should publicly disclose CO2 emissions data across their manufacturing and upstream logistics processes, providing a foundation for more targeted mitigation strategies.
Secondly, the transportation sector’s reliance on fossil fuels, particularly oil, requires more specific interventions. Besides expanding the metro and bus network, Beijing could enhance incentives for purchasing electric and hydrogen fuel cell vehicles, such as offering tax rebates, license plate quotas, or dedicated parking/charging zones. Additionally, building a comprehensive charging and hydrogen refueling infrastructure network would help alleviate concerns about vehicle range and reliability. These measures, coupled with stricter vehicle emissions standards, can significantly reduce transport-related oil consumption.
Thirdly, Beijing needs even stricter ecological and energy-saving regulations to propel additional industrial restructuring and technological innovation [29]. Setting multi-tier carbon standards tailored to specific industries can further encourage cleaner production technologies, particularly in areas like heavy manufacturing [30]. For example, implementing performance-based subsidies or penalties can incentivize enterprises to adopt advanced energy-saving equipment and cleaner production processes.
Furthermore, targeted funds should continue to support high-tech R&D in fields such as digitalization, new energy, and energy-storage technologies, accompanied by discount loans or venture capital programs that spur innovation. “Green Transformation” initiatives can focus on helping traditional high-energy-consuming companies upgrade existing technologies or integrate emerging ones—like AI-based energy management or carbon capture, and thus enable a smoother path toward reducing energy demand and emissions. By closely aligning these recommendations with Beijing’s unique industrial structure and expanding service economy, policymakers can ensure that high-growth sectors transition swiftly to cleaner energy sources, while also reinforcing the city’s leading role in climate innovation [31].
4.4. Restrictions and Limitations
- (1)
- Fixed Emission Factors. This study assumes that the carbon emission factors of various energy types (such as coal and petroleum) are constant and does not consider micro-differences in fuel quality and combustion efficiency across different years or regions. This assumption may lead to a certain bias in the assessment of the maximum emission reduction potential.
- (2)
- No Residual/Interaction Terms. Since the LMDI decomposition used in this study is based on addition, no “residual term” is generated, but some interaction effects (such as the combined impact of industrial structure change and energy efficiency improvement) may also be separated together with the main effect, resulting in a slightly insufficient description of the complex change mechanism.
- (3)
- The absence of Static Interval Comparison. In this study, the overall changes between the base period and the target period are decomposed. Some carbon emission fluctuations caused by temporary policies or short-term economic fluctuations may not be fully reflected in the additive decomposition results, and a more detailed dynamic investigation should be carried out in combination with time series analysis or other models.
5. Conclusions
This paper studies the factors affecting and the decoupling impact of carbon emissions and energy use in Beijing from 2013 to 2020, calculates the carbon emissions related to energy consumption, and uses the Tapio decoupling method to assess the relative correlation between carbon emissions and economic growth at different stages in Beijing. These emissions are then broken down into cumulative contributions influenced by various factors.
- (1)
- Significant optimization of the structure of energy consumption. During the 2013–2020 period, Beijing’s energy structure has changed significantly, with the use of coal significantly reduced and the use of natural gas as a transitional fuel significantly increased. This change effectively reduces the total carbon emissions and reflects the policy-driven optimization of the energy mix. From the perspective of industry, carbon emissions from the primary, secondary, and tertiary industries all showed a downward trend.
- (2)
- Absolute decoupling. Since 2014, Beijing has managed to achieve absolute decoupling of economic growth from carbon emissions, which means that carbon emissions have been effectively controlled while the economy continues to expand. The decoupling elasticity index continued to be negative from 2014 to 2020 and gradually increased (decreasing in absolute value), indicating that the degree of decoupling has gradually strengthened. This shows that Beijing has implemented effective measures to reduce carbon emissions while developing its economy and has achieved a good balance between economic growth and environmental protection.
- (3)
- Balanced economic and environmental development was achieved through industrial optimization and clean energy use. Beijing has effectively curbed the growth of carbon emissions from 2013 to 2020 by optimizing industrial structure and improving energy efficiency. The increased proportion of clean energy and the upgrading of carbon emission standards further drove the reduction of carbon emissions. Although economic growth has a driving effect on carbon emissions, its impact has gradually weakened, showing the trend of synchronized advancement of economic and environmental goals.
Through industrial optimization, energy efficiency, and the adoption of clean energy, Beijing has progressively separated its economic growth from carbon emissions.
Author Contributions
Conceptualization, R.D.; methodology, D.R and T.D; validation, R.D. and Y.W.; formal analysis, R.D.; resources, D.T.; writing—original draft preparation, R.D.; writing—review and editing, R.D. and Y.W. All authors have read and agreed to the published version of the manuscript.
Funding
This research received no external funding.
Institutional Review Board Statement
Not applicable.
Informed Consent Statement
Not applicable.
Data Availability Statement
The original contributions presented in this study are included in this article; further inquiries can be directed to the corresponding author.
Conflicts of Interest
The authors declare no conflicts of interest.
References
- Dincer, I.; Rosen, M.A. Exergy, environment and sustainable development. Energy. 2007, 36–59. [Google Scholar]
- Liu, Q.; Lei, Q.; Xu, H.; Yuan, J. China’s energy revolution strategy into 2030. Resour. Conserv. Recycl. 2018, 128, 78–89. [Google Scholar] [CrossRef]
- Hao, Y.; Zhang, Z.Y.; Liao, H.; Wei, Y.M. China’s farewell to coal: A forecast of coal consumption through 2020. Energy Policy 2015, 86, 444–455. [Google Scholar] [CrossRef]
- Li, A.; Zhang, A.; Zhou, Y. Decomposition analysis of factors affecting carbon dioxide emissions across provinces in China. J. Clean. Prod. 2017, 141, 1428–1444. [Google Scholar] [CrossRef]
- Li, J.S.; Zhou, H.W.; Yang, Q.; Chen, B.; Zhang, Y.Y.; Yan, J. Carbon emissions and their drivers for a typical urban economy from multiple perspectives: A case analysis for Beijing city. Appl. Energy 2018, 226, 1076–1086. [Google Scholar] [CrossRef]
- Liddle, B. Impact of population, age structure, and urbanization on carbon emissions/energy consumption: Evidence from macro-level, cross-country analyses. Popul. Environ. 2014, 35, 286–304. [Google Scholar] [CrossRef]
- Lenzen, M. Structural analyses of energy use and carbon emissions—An overview. Econ. Syst. Res. 2016, 28, 119–132. [Google Scholar] [CrossRef]
- Javid, M.; Khan, M. Energy efficiency and underlying carbon emission trends. Environ. Sci. Pollut. Res. 2020, 27, 3224–3236. [Google Scholar] [CrossRef] [PubMed]
- Zhang, X.-P.; Cheng, X.-M. Energy consumption, carbon emissions, and economic growth in China. Ecol. Econ. 2009, 68, 2706–2712. [Google Scholar] [CrossRef]
- Waheed, R.; Sarwar, S.; Wei, C. The survey of economic growth, energy consumption and carbon emission. Energy Rep. 2019, 5, 1103–1115. [Google Scholar] [CrossRef]
- Xu, S.-C.; He, Z.-X.; Long, R.-Y.J.A.E. Factors that influence carbon emissions due to energy consumption in China: Decomposition analysis using LMDI. Appl. Energy 2014, 127, 182–193. [Google Scholar] [CrossRef]
- Shahbaz, M.; Loganathan, N.; Muzaffar, A.T.; Ahmed, K.; Jabran, M.A. How urbanization affects CO2 emissions in Malaysia? The application of STIRPAT model. Renew. Sustain. Energy Rev. 2016, 57, 83–93. [Google Scholar] [CrossRef]
- Huang, J.; Li, X.; Wang, Y.; Lei, H. The effect of energy patents on China’s carbon emissions: Evidence from the STIRPAT model. Technol. Forecast. Soc. Chang. 2021, 173, 121110. [Google Scholar] [CrossRef]
- Zhou, W.; Cao, X.; Dong, X.; Zhen, X. The effects of carbon-related news on carbon emissions and carbon transfer from a global perspective: Evidence from an extended STIRPAT model. J. Clean. Prod. 2023, 425, 138974. [Google Scholar] [CrossRef]
- Liu, M.; Zhang, X.; Zhang, M.; Feng, Y.; Liu, Y.; Wen, J.; Liu, L. Influencing factors of carbon emissions in transportation industry based on CD function and LMDI decomposition model: China as an example. Environ. Impact Assess. Rev. 2021, 90, 106623. [Google Scholar] [CrossRef]
- He, Y.; Xing, Y.; Zeng, X.; Ji, Y.; Hou, H.; Zhang, Y.; Zhu, Z. Factors influencing carbon emissions from China’s electricity industry: Analysis using the combination of LMDI and K-means clustering. Environ. Impact Assess. Rev. 2022, 93, 106724. [Google Scholar] [CrossRef]
- Li, J.; Chen, Y.; Li, Z.; Liu, Z. Quantitative analysis of the impact factors of conventional energy carbon emissions in Kazakhstan based on LMDI decomposition and STIRPAT model. J. Geogr. Engl. 2018, 28, 19. [Google Scholar] [CrossRef]
- Paustian, K.; Ravindranath, N.H.; Amstel, A.V. 2006 IPCC Guidelines for National Greenhouse Gas Inventories; International Panel on Climate Change: Geneva, Switzerland, 2006. [Google Scholar]
- Ang, B.W.; Su, B. Carbon emission intensity in electricity production: A global analysis. Energy Policy 2016, 94, 56–63. [Google Scholar] [CrossRef]
- Shen, L.; Wu, Y.; Lou, Y.; Zeng, D.; Shuai, C.; Song, X. What drives the carbon emission in the Chinese cities?—A case of pilot low carbon city of Beijing. J. Clean. Prod. 2018, 174, 343–354. [Google Scholar] [CrossRef]
- Shao, Z.; Zheng, X.; Zhao, J.; Liu, Y. Evaluating the health impact of air pollution control strategies and synergies among PM2.5 and O3 pollution in Beijing-Tianjin-Hebei region, China. Environ. Res. 2025, 274, 8. [Google Scholar] [CrossRef]
- Wang, Q.; Zhao, M.; Li, R. Decoupling sectoral economic output from carbon emissions on city level: A comparative study of Beijing and Shanghai, China. J. Clean. Prod. 2019, 209, 126–133. [Google Scholar] [CrossRef]
- Heggelund, G.M. Economics. China’s climate and energy policy: At a turning point? Int. Environ. Agreem. Politics Law 2021, 21, 9–23. [Google Scholar] [CrossRef] [PubMed]
- Bai, S.; Liu, C. Overview of energy harvesting and emission reduction technologies in hybrid electric vehicles. Renew. Sustain. Energy Rev. 2021, 147, 111188. [Google Scholar] [CrossRef]
- Zhang, X.; Li, Z.; Wang, J. Impact of COVID-19 pandemic on energy consumption and carbon dioxide emissions in China’s transportation sector. Case Stud. Therm. Eng. 2021, 26, 101091. [Google Scholar] [CrossRef]
- Zheng, B.; Geng, G.; Ciais, P.; Davis, S.J.; Zhang, Q. Satellite-based estimates of decline and rebound in China’s CO2 emissions during COVID-19 pandemic. Sci. Adv. 2020, 6, eabd4998. [Google Scholar] [CrossRef]
- Cezarino, L.O.; Liboni, L.B.; Stefanelli, N.O.; Oliveira, B.G.; Stocco, L.C. Diving into emerging economies bottleneck: Industry 4.0 and implications for circular economy. Manag. Decis. 2021, 59, 1841–1862. [Google Scholar] [CrossRef]
- Zheng, J.; Feng, G.; Ren, Z.; Qi, N.; Coffman, D.; Zhou, Y.; Wang, S. China’s energy consumption and economic activity at the regional level. Energy 2022, 259, 124948. [Google Scholar] [CrossRef]
- Ouyang, X.; Li, Q.; Du, K. How does environmental regulation promote technological innovations in the industrial sector? Evidence from Chinese provincial panel data. Energy Policy 2020, 139, 111310. [Google Scholar] [CrossRef]
- Du, K.; Cheng, Y.; Yao, X. Environmental regulation, green technology innovation, and industrial structure upgrading: The road to the green transformation of Chinese cities. Energy Econ. 2021, 98, 105247. [Google Scholar] [CrossRef]
- Dong, B.; Ma, X.; Zhang, Z.; Zhang, H.; Chen, R.; Song, Y.; Shen, M.; Xiang, R. Carbon emissions, the industrial structure and economic growth: Evidence from heterogeneous industries in China. Environ. Pollut. 2020, 262, 114322. [Google Scholar] [CrossRef]
Disclaimer/Publisher’s Note: The statements, opinions and data contained in all publications are solely those of the individual author(s) and contributor(s) and not of MDPI and/or the editor(s). MDPI and/or the editor(s) disclaim responsibility for any injury to people or property resulting from any ideas, methods, instructions or products referred to in the content. |
© 2025 by the authors. Licensee MDPI, Basel, Switzerland. This article is an open access article distributed under the terms and conditions of the Creative Commons Attribution (CC BY) license (https://creativecommons.org/licenses/by/4.0/).