
Urban Resilience Framework for Evaluating Jeddah’s Capacity for Sustainability and Adaptation


Abstract
1. Introduction
1.1. Background
1.2. Objectives
- To Develop a Comprehensive Framework: Create a structured framework that integrates criteria and indicators for assessing urban resilience that are adapted to Jeddah’s unique context.
- To Evaluate Jeddah’s Current Resilience Status: Analyze the existing urban resilience measures in Jeddah to identify strengths and weaknesses in its capacity for sustainability and adaptation.
- To Benchmark Against Other Cities: Compare Jeddah’s resilience indicators with those of other cities to highlight areas for improvement and best practices that can be adapted.
- To Provide Policy Recommendations: Generate actionable recommendations for urban planners and policymakers aimed at enhancing Jeddah’s resilience.
1.3. Research Questions
- How can a structured framework be designed to effectively integrate criteria and indicators for assessing urban resilience in Jeddah’s specific context?
- What strengths and weaknesses can be identified in Jeddah’s current capacity for sustainability and adaptation?
- How do Jeddah’s urban resilience indicators compare to other cities facing similar environmental and socioeconomic challenges?
- What policy changes or initiatives can be proposed to improve Jeddah’s urban resilience?
1.4. Significance
2. Literature Review
2.1. What Is Urban Resilience?
2.2. Criteria and Indicators
3. Methodology
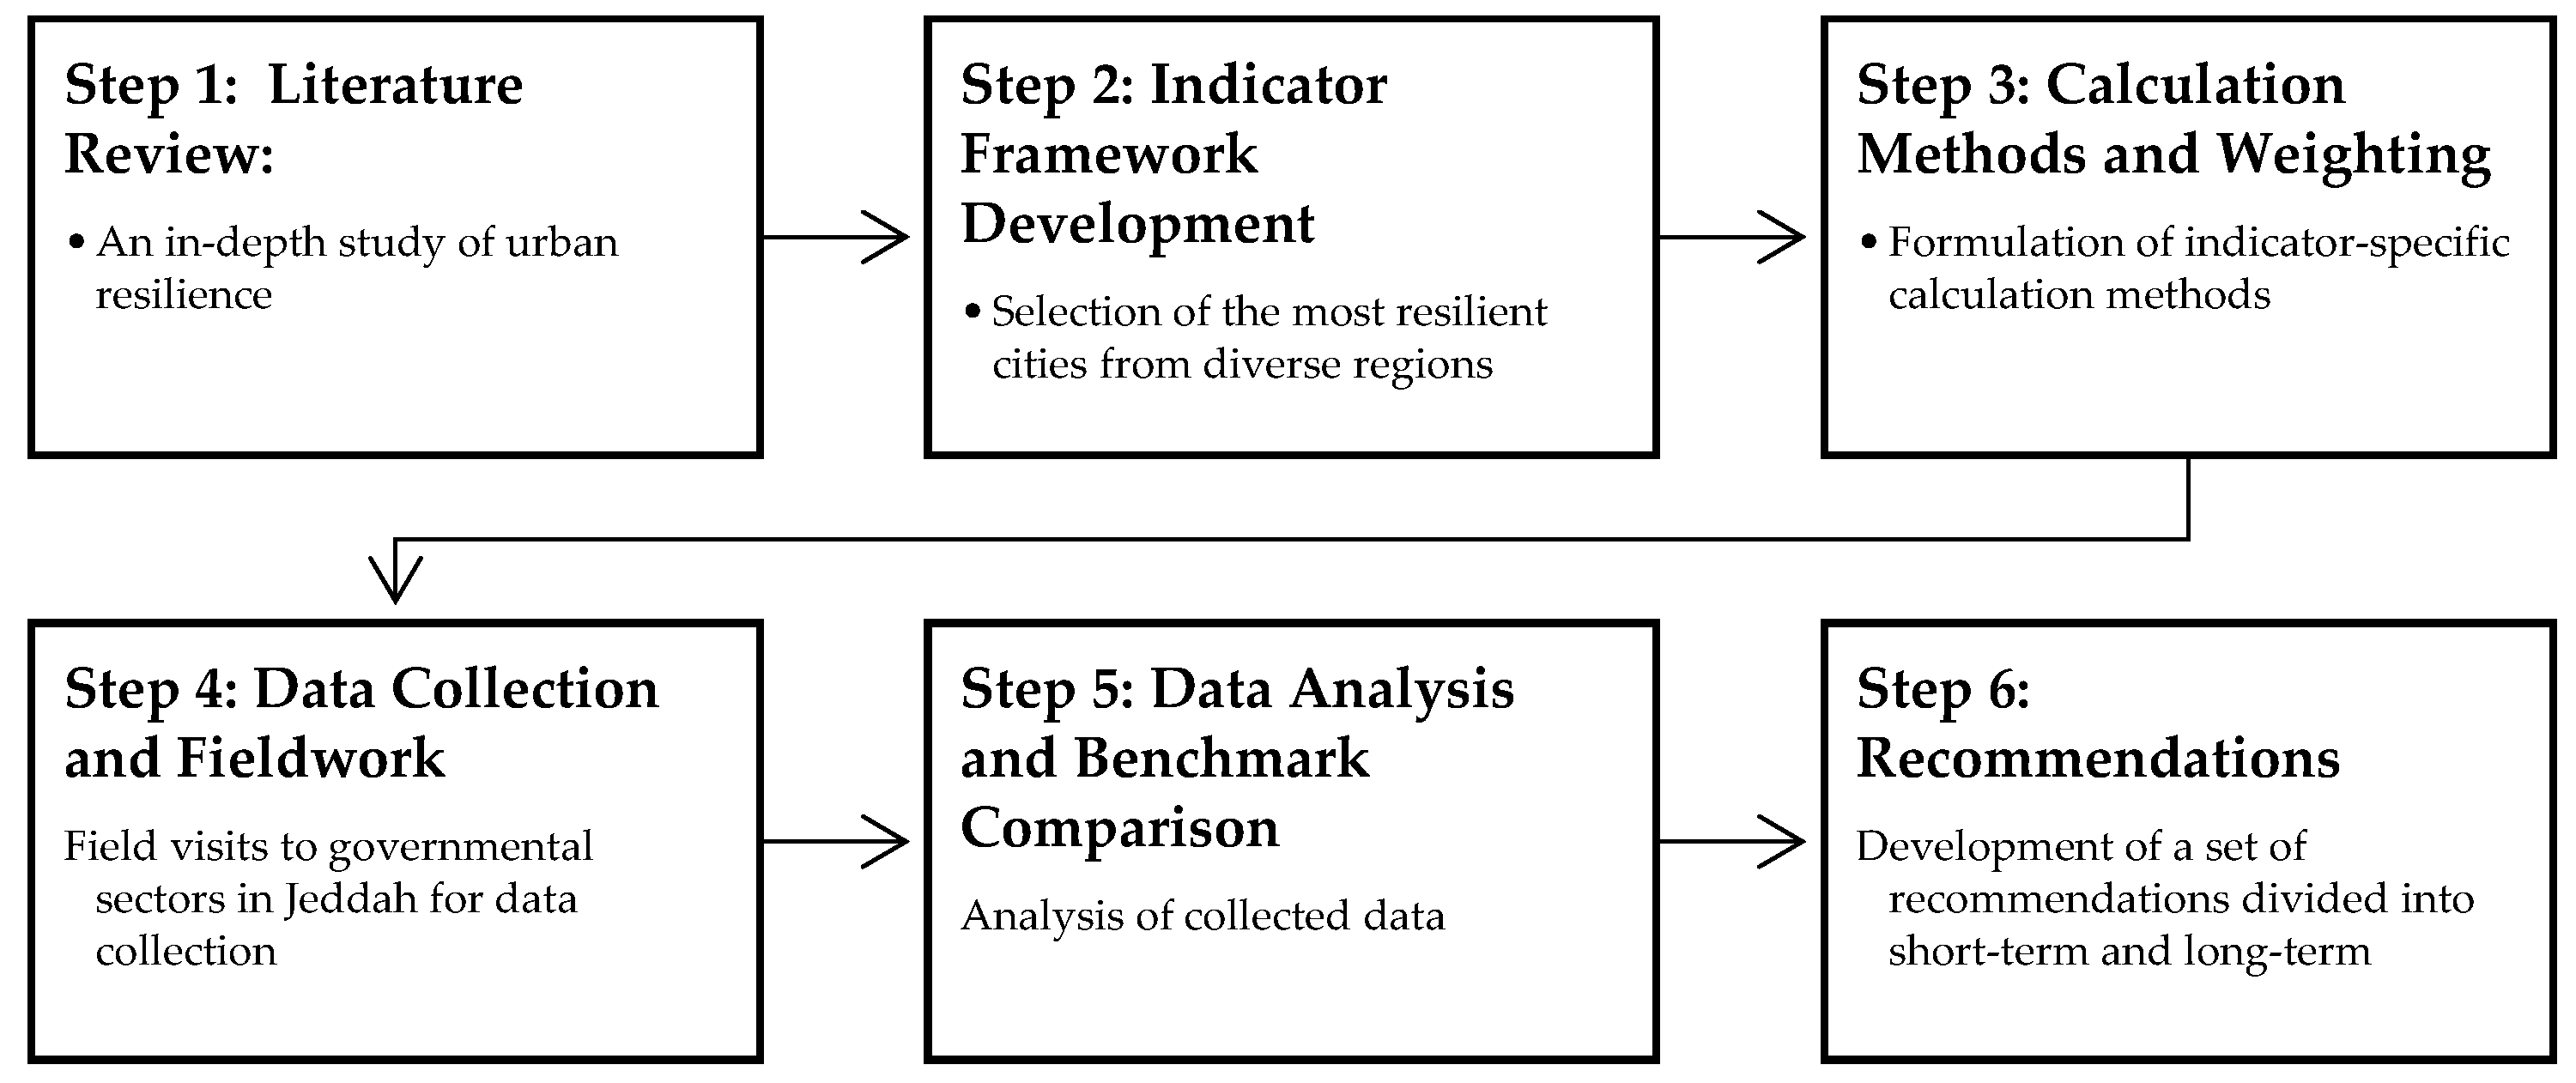
3.1. Literature Review on Urban Resilience
3.2. Indicator Framework Development
3.3. Calculation Methods and Weighting
3.3.1. Formulas and Calculations
3.3.2. Determination of Weight Value for Each Criterion and Indicator Using AHP
3.4. Data Collection and Fieldwork
3.5. Data Analysis and Benchmark Comparison
3.6. Recommendations for Jeddah’s Urban Resilience
4. Study Area
4.1. Jeddah’s Demographics, Geography, and Urban Challenges
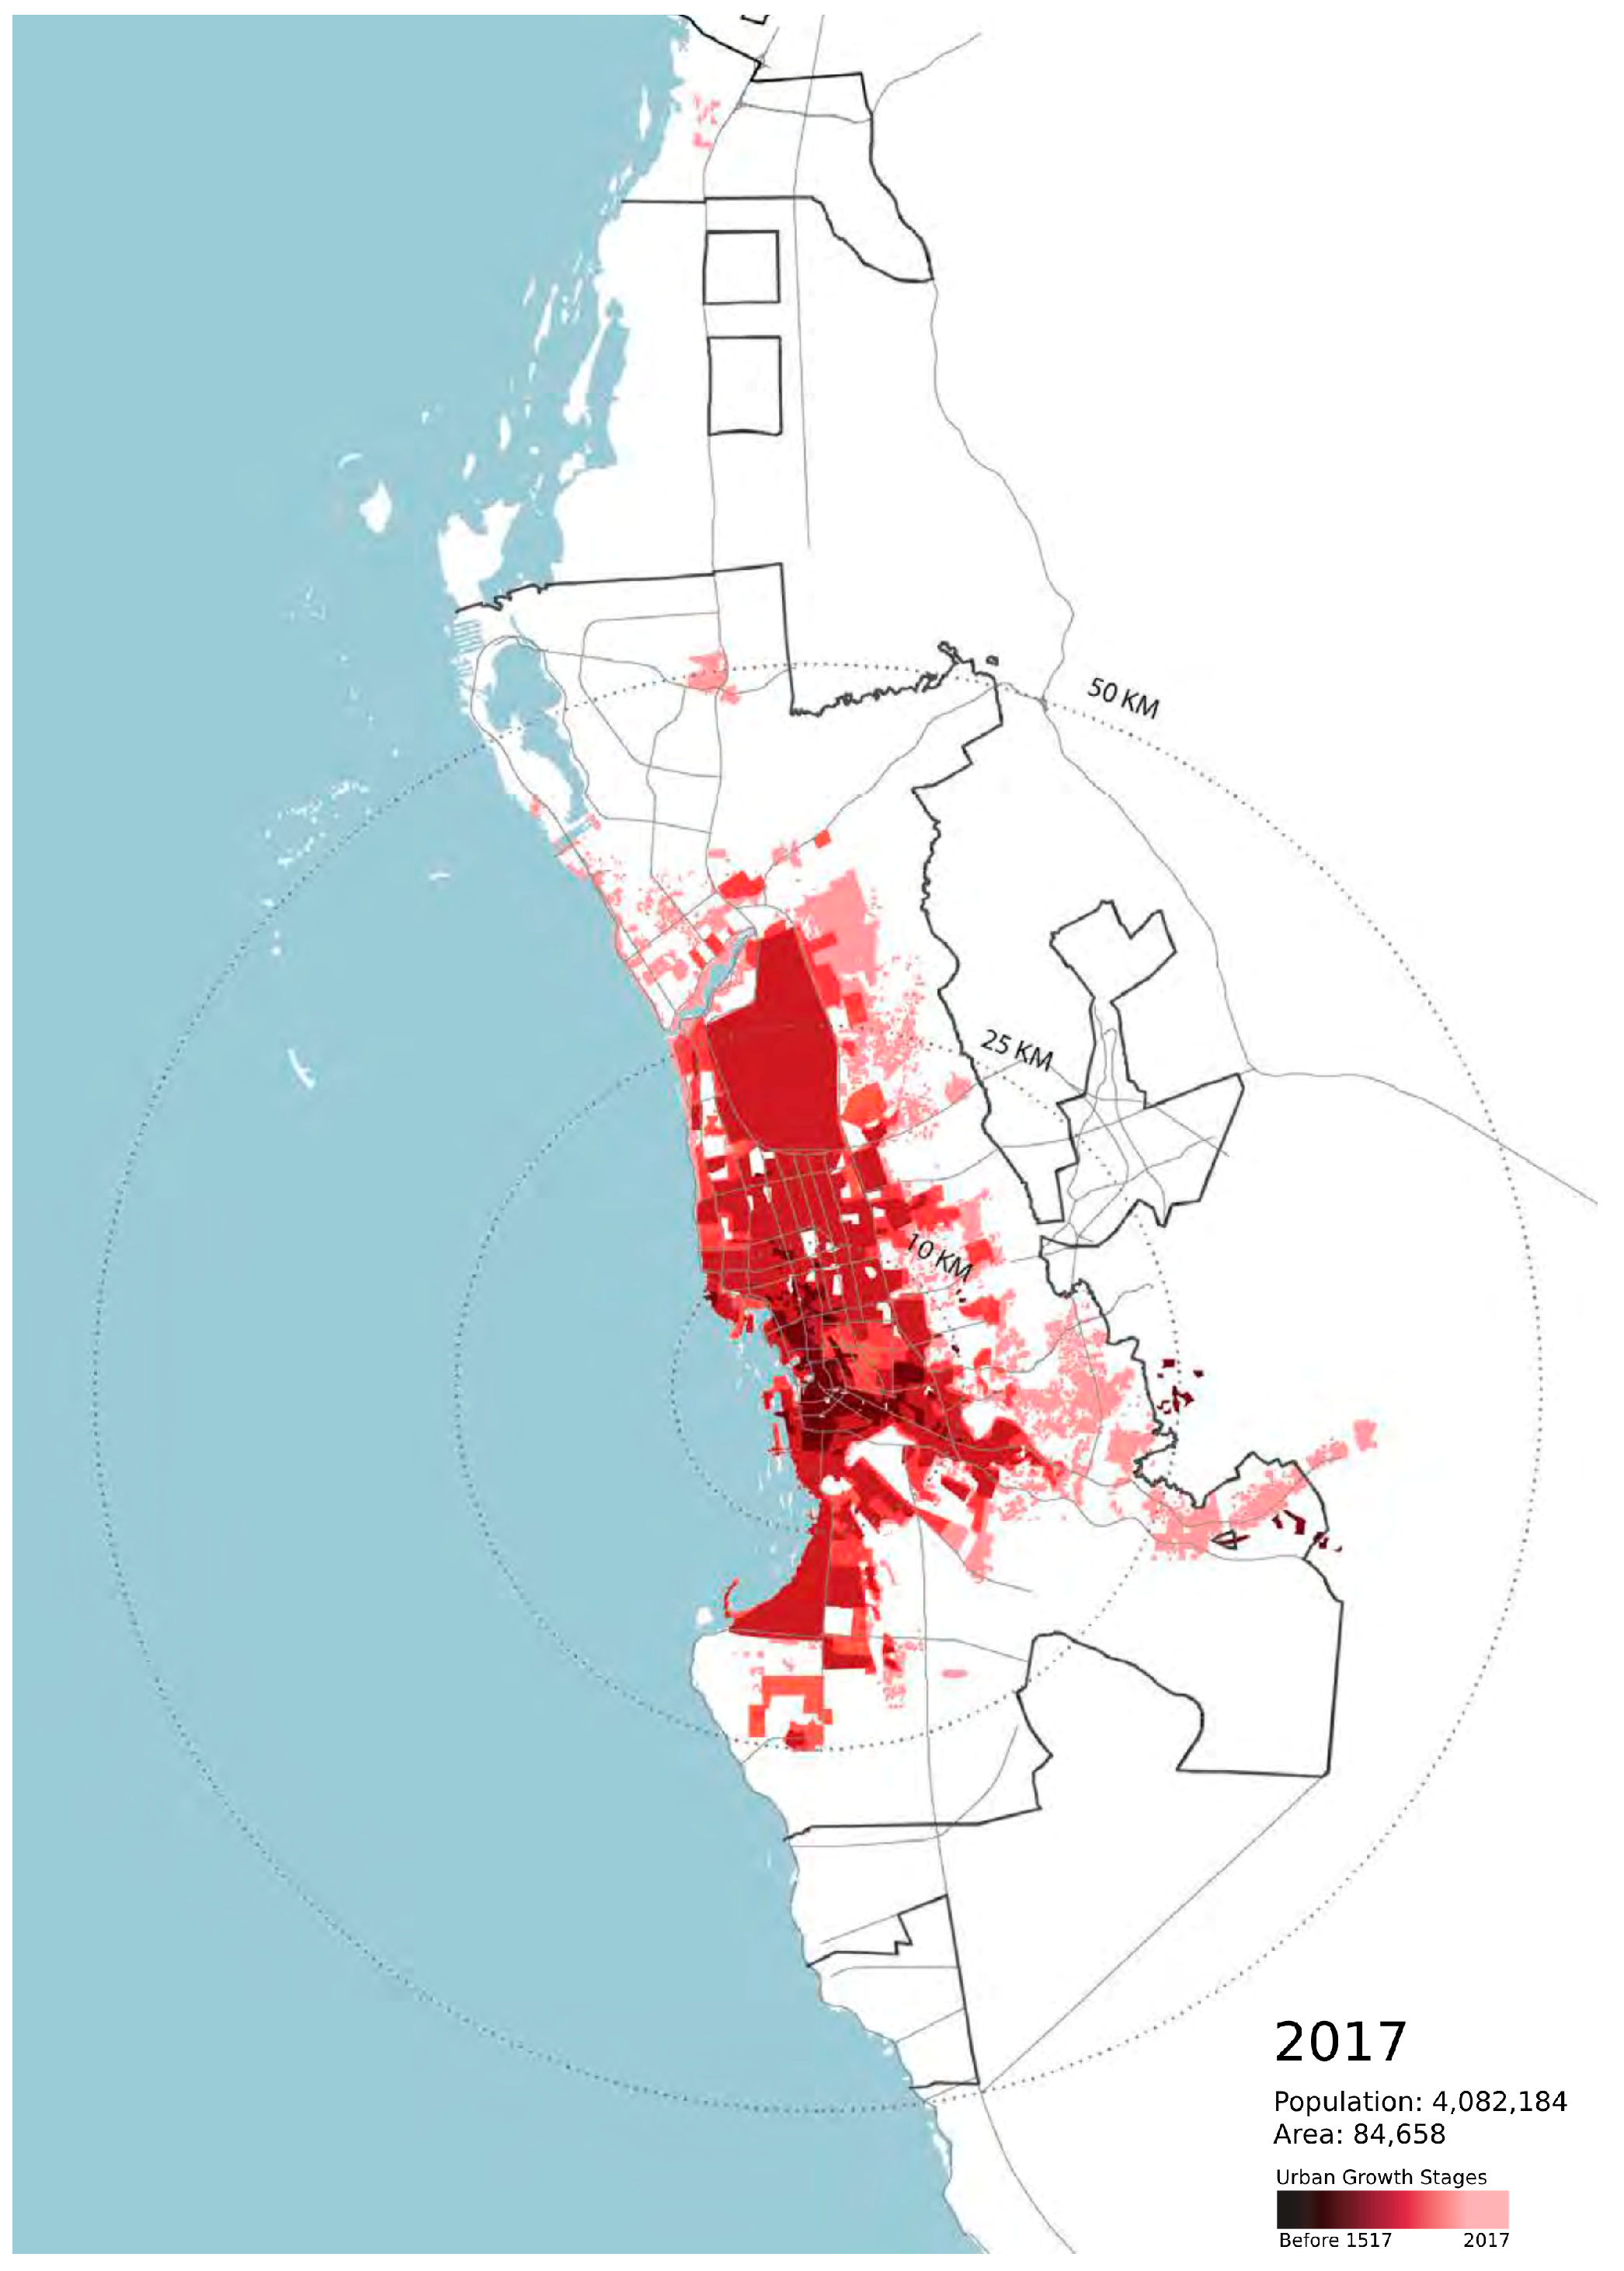

4.2. Major Flood Events in Jeddah: Historical Impacts and Challenges
5. Final Results
Data Analysis
6. Discussion
7. Recommendations
7.1. Mobility
7.1.1. Short Term
- Optimize transport routes and utilize intelligent traffic management systems to reduce journey times.
- i.
- Implementation: Introduce AI-driven traffic flow management and optimize road signal timing to reduce congestion.
- ii.
- Feasibility: High feasibility due to available traffic data and existing smart mobility infrastructure.
- iii.
- Expected Impact: Reduced journey times, lower emissions, and improved traffic efficiency.
- Promote electric vehicles (EVs) and expand the network of EV charging stations.
- i.
- Implementation: Provide incentives for EV adoption and integrate charging stations in residential and commercial areas.
- ii.
- Feasibility: Moderate—It requires government incentives and private-sector engagement.
- iii.
- Expected Impact: Lower air pollution and reduced reliance on fossil fuels.
7.1.2. Long Term
- Improve and expand public transport networks with low-emission electric buses and high-capacity rail systems.
- i.
- Implementation: Invest in metro and BRT (Bus Rapid Transit) systems, particularly in underserved areas.
- ii.
- Feasibility: Moderate to high—It requires significant policy and funding commitment.
- iii.
- Expected Impact: Increased mobility options, reduced congestion, and improved urban air quality.
- Reduce vehicle emissions across the city by transitioning fleets to low-emission vehicles.
- i.
- Implementation: Enforce emission regulations, provide incentives for fleet electrification, and introduce low-emission zones.
- ii.
- Feasibility: Moderate—It requires gradual policy enforcement and infrastructure development.
- iii.
- Expected Impact: Decreased air pollution improved public health, and alignment with global sustainability goals.
- Expand the city’s bike lane network and introduce bike-sharing systems.
- i.
- Implementation: Construct safe, dedicated bike lanes and integrate public bike-sharing.
- ii.
- Feasibility: Moderate—It requires urban space allocation.
- iii.
- Expected Impact: Increased non-motorized transport usage, reduced emissions, and healthier urban lifestyles.
- Build wide, safe, and shaded pedestrian paths throughout the city, incorporating green corridors to balance urban density.
- i.
- Implementation: Retrofit pedestrian infrastructure with shading elements and tree-lined walkways.
- ii.
- Feasibility: High—It requires integration into urban planning policies.
- iii.
- Expected Impact: Improved walkability, urban cooling, and enhanced accessibility.
- Redesign major corridors to improve safety and prevent serious crashes.
- i.
- Implementation: Apply urban street design best practices such as traffic calming, improved intersections, and pedestrian-friendly layouts.
- ii.
- Feasibility: Moderate—It requires detailed traffic studies and phased implementation.
- iii.
- Expected Impact: Reduced traffic fatalities and improved pedestrian safety.
7.2. Infrastructure
7.2.1. Short Term
- Attract investment through zoning and incentives.
- i.
- Implementation: Introduce zoning regulations and financial incentives to encourage sustainable infrastructure investments through public–private partnerships.
- ii.
- Feasibility: High feasibility—It is supported by existing urban planning frameworks and Vision 2030.
- iii.
- Impact: Increased sustainable development projects, economic growth, and improved infrastructure resilience.
- Establish free public Wi-Fi networks.
- i.
- Implementation: Set up Wi-Fi hotspots in public parks, transportation hubs, and high-density areas.
- ii.
- Feasibility: Highly feasible—Minimal technological and financial barriers.
- iii.
- Impact: Improved digital accessibility and increased public safety through enhanced communication channels.
- Rainwater harvesting incentives.
- i.
- Implementation: Offer incentives, guidelines, and technical assistance to promote household rainwater harvesting.
- ii.
- Feasibility: Feasible—It is easy to implement at household levels with moderate investment.
- iii.
- Impact: Reduced urban flooding and improved local water resource management.
- Redundancy systems for backup power.
- i.
- Implementation: Adopt renewable energy storage solutions, such as solar battery storage, in critical infrastructure like hospitals and emergency centers. Encourage private sector adoption of distributed energy storage.
- ii.
- Feasibility: High—Proven renewable technologies are available for immediate integration.
- iii.
- Impact: Minimized service disruptions, enhanced energy security, and improved emergency resilience through sustainable backup power solutions.
7.2.2. Long Term
- Incorporate green building standards.
- i.
- Implementation: Mandate green building codes and provide support for sustainable building practices.
- ii.
- Feasibility: Moderate—It requires comprehensive legislative support.
- iii.
- Impact: Long-term reduction in energy consumption and improvement in urban sustainability.
- Execute green infrastructure for stormwater management.
- i.
- Implementation: Develop rain gardens and integrated smart stormwater systems citywide.
- ii.
- Feasibility: High—It has proven effectiveness internationally.
- iii.
- Expected Impact: Significant reduction in flooding risks and improved urban environmental quality.
7.3. Green Spaces
7.3.1. Short Term
- Promote community gardens and urban farms.
- i.
- Implementation: Convert vacant land for community farming; provide technical support.
- ii.
- Feasibility: Highly feasible—It requires minimal initial investment.
- iii.
- Expected Impact: Enhanced community engagement, food security, and improved urban environment.
- Create and promote farmers’ markets with local producers.
- i.
- Implementation: Establish designated spaces for farmers’ markets in urban areas, provide logistical support, and implement policies that prioritize local producers.
- ii.
- Feasibility: High—It requires municipal coordination and policy support but is achievable with community and business involvement.
- iii.
- Impact: Increased access to fresh, local food, support for small-scale farmers, and promotion of sustainable food systems.
- Reduce urban light pollution.
- i.
- Implementation: Introduce lighting standards for buildings.
- ii.
- Feasibility: Very feasible with minimal infrastructure changes.
- iii.
- Impact: Improved ecological health and urban livability.
7.3.2. Long Term
- Develop continuous green corridors.
- i.
- Implementation: Systematic planting and maintenance of trees, and creation of interconnected parks.
- ii.
- Feasibility: Moderate—It requires coordinated planning and sustained funding.
- iii.
- Expected Impact: Significant improvement in biodiversity, urban cooling, and residents’ quality of life.
- Green the city’s streets, parks, and open spaces through Parks without Borders.
- i.
- Implementation: Expand urban greening by planting trees, creating shaded walkways, and making parks more accessible through open design, fostering community interaction and environmental benefits.
- ii.
- Feasibility: High—It can be integrated into existing urban planning policies with moderate investment.
- iii.
- Impact: Improved urban cooling, enhanced walkability, increased biodiversity, and stronger community engagement.
7.4. Environmental
7.4.1. Short Term
- Strengthen coastal ecosystem protection.
- i.
- Implementation: Establish zoning and specific protective regulations for beaches.
- ii.
- Feasibility: High feasibility—It can be enforced through existing environmental frameworks.
- iii.
- Expected Impact: Enhanced coastal biodiversity and sustainability.
- Improve waste and sewage management.
- i.
- Implementation: Upgrade waste collection methods and sewage infrastructure.
- ii.
- Feasibility: Moderate to high; infrastructure investments are necessary.
- iii.
- Expected Impact: Reduced pollution and improved public health.
- Enhance food waste and recycling systems for sustainability.
- i.
- Implementation: Mandate food service establishments to separate food waste for composting, improve curbside recycling by shifting from dual-stream to single-stream collection, and support the development of markets for recycled materials.
- ii.
- Feasibility: High—It can be implemented through regulatory measures and public–private partnerships.
- iii.
- Impact: Increased waste diversion from landfills, enhanced recycling efficiency, and strengthened circular economy practices.
7.4.2. Long Term
- Enhance coastal marine biodiversity.
- i.
- Implementation: Deploy artificial reefs to restore marine habitats and conduct climate impact studies on sea temperature, water quality, and biodiversity to guide conservation efforts.
- ii.
- Feasibility: Moderate—It requires collaboration with marine researchers and environmental agencies.
- iii.
- Impact: Strengthened marine ecosystems, improved biodiversity, and enhanced coastal resilience to climate change.
- Conduct district-specific climate change analyses.
- i.
- Implementation: Develop localized risk assessments using climate data and urban mapping.
- ii.
- Feasibility: High—It can be integrated into existing urban planning and resilience policies with the government.
- iii.
- Impact: Enhances disaster preparedness and targeted adaptation strategies.
- Promote renewable energy and green job creation.
- i.
- Implementation: Encourage renewable energy projects (solar/wind) and support employment in climate-related sectors.
- ii.
- Feasibility: High—It aligns with national renewable energy goal and economic diversification efforts.
- iii.
- Impact: Decreased emissions, energy efficiency, and enhanced climate resilience.
- Implement large-scale organic waste composting.
- i.
- Implementation: Establish community composting and industrial composting facilities.
- ii.
- Feasibility: Moderate—It requires public acceptance and infrastructure.
- iii.
- Expected Impact: Reduced waste, enhanced soil quality, and sustainable waste management.
7.5. Well-Being
7.5.1. Short Term
- Establish Family Justice Centers and health clinics.
- i.
- Implementation: Set up community-based family support and primary healthcare facilities.
- ii.
- Feasibility: Highly feasible—It provides strong social benefits.
- iii.
- Expected Impact: Improved healthcare access and enhanced family and community resilience.
- Create health clinics in areas with primary care shortages.
- i.
- Implementation: Establish primary care clinics in underserved areas, prioritizing districts with limited healthcare facilities.
- ii.
- Feasibility: High—It requires government and private sector collaboration
- iii.
- Impact: Improved healthcare accessibility, reduced strain on major hospitals, and better health outcomes for vulnerable populations.
- Provide opportunities for physical activity for residents.
- i.
- Implementation: Develop accessible parks and recreation areas with adaptive equipment, walking paths, and community fitness programs.
- ii.
- Feasibility: High—It aligns with public health goals and urban planning initiatives, requiring moderate investment and policy support.
- iii.
- Impact: Improved public health, social inclusion, and community well-being, reducing sedentary lifestyles and promoting accessibility for people with disabilities.
- Protect schools with environmental and road safety measures.
- i.
- Implementation: Introduce traffic calming measures, designated pedestrian crossings, and shaded walkways around schools to enhance student safety and accessibility. Incorporate heat-resistant materials and green infrastructure in school design to improve environmental conditions.
- ii.
- Feasibility: High—It can be integrated into existing urban planning and transportation policies with moderate investment.
- iii.
- Impact: Improved student safety, reduced traffic-related accidents, and enhanced learning environments through better climate resilience.
7.5.2. Long Term
- Localized healthcare and senior care services.
- i.
- Implementation: Integrate healthcare facilities within neighborhoods, increasing accessibility.
- ii.
- Feasibility: Feasible—Moderate investment with substantial social benefits.
- iii.
- Expected Impact: Improved healthcare accessibility and quality, especially for vulnerable populations.
- Improve Localized Healthcare Access.
- i.
- Implementation: Establish satellite clinics and decentralized health centers within residential areas to reduce reliance on central hospital campuses.
- ii.
- Feasibility: High—It can be integrated into existing healthcare policies with moderate investment.
- iii.
- Impact: Enhanced accessibility to healthcare, reduced patient travel time, and improved health outcomes for underserved communities.
- Enable crime prevention through environmental design (CPTED)
- i.
- Implementation: Integrate CPTED principles into urban planning by improving street lighting, maintaining green spaces, and optimizing urban layouts to enhance visibility and security.
- ii.
- Feasibility: High—It can be implemented through existing urban planning initiatives with minimal infrastructure adjustments.
- iii.
- Impact: Reduced crime rates improved public safety perception, and enhanced neighborhood livability.
7.6. Emergency Preparedness
7.6.1. Short Term
- Identify areas where high water levels will first penetrate.
- i.
- Implementation: Conduct hydrological studies and flood mapping to identify vulnerable zones where high-water levels are likely to penetrate first. Utilize GIS technology and historical flood data to create a risk assessment model.
- ii.
- Feasibility: High—It can be integrated into existing disaster preparedness frameworks with government and academic collaboration.
- iii.
- Impact: Improved flood response efficiency minimized property damage, and enhanced community resilience against extreme weather events.
- Enhance disaster communication and public awareness.
- i.
- Implementation: Establish an integrated early warning system using SMS alerts, mobile apps, and public announcements. Install clearly marked evacuation routes and emergency shelter signs in high-risk areas. Conduct participatory disaster mapping by engaging local communities in risk identification and preparedness drills.
- ii.
- Feasibility: High—It requires coordination between government agencies and telecom providers but builds on existing technologies.
- iii.
- Impact: Faster emergency response increased public awareness, and reduced casualties and property damage during disasters.
- Community-based disaster preparedness groups.
- i.
- Implementation: Form localized disaster-preparedness groups in high-risk sub-districts. Train residents on risk assessment, first aid, evacuation procedures, and emergency response in collaboration with civil defense and local authorities.
- ii.
- Feasibility: High—It requires community engagement and structured training but is cost-effective and can leverage existing civil defense resources.
- iii.
- Impact: Increased local resilience, faster response times, and reduced reliance on external emergency services during crises.
- Emergency relief and medical transportation routes.
- i.
- Implementation: Identify and designate critical emergency relief and medical transport routes, ensuring uninterrupted access to hospitals, shelters, and supply distribution points. Integrate GIS-based mapping and real-time traffic management to optimize emergency response times.
- ii.
- Feasibility: High—Requires coordination with transportation and emergency management authorities but is logistically feasible with existing infrastructure.
- iii.
- Impact: Faster medical response times, improved disaster relief efficiency, and reduced casualties during emergencies.
7.6.2. Long Term
- Strengthen structural and coastal resilience.
- i.
- Implementation: Implement resilient coastal infrastructure, reinforce buildings to withstand extreme events, and ensure that all homes meet earthquake resistance standards.
- ii.
- Feasibility: Moderate—It requires considerable funding and planning.
- iii.
- Expected Impact: Reduced vulnerability to flooding, storms, and earthquakes, enhancing safety and long-term structural durability.
- Allocate land for future flood protection infrastructure.
- i.
- Implementation: Designate and preserve land for critical flood protection infrastructure, such as dikes, locks, and retention basins, ensuring future adaptability to extreme weather conditions.
- ii.
- Feasibility: Moderate— It requires urban planning integration and proactive land-use policies.
- iii.
- Impact: Prevents urban encroachment on essential flood mitigation zones, ensuring long-term flood resilience and minimizing future infrastructure costs.
- Evaluate and adapt buildings for flood resilience.
- i.
- Implementation: Assess existing structures to identify those at high flood risk, determining whether they should be demolished, repurposed, or relocated. Prioritize the protection of critical infrastructure such as hospitals, schools, and emergency response centers.
- ii.
- Feasibility: Moderate—It requires detailed flood risk assessments and collaboration with urban planners and policymakers.
- iii.
- Impact: Enhances urban resilience by reducing exposure to flooding, ensuring the safety of essential buildings, and improving long-term disaster preparedness.
8. Conclusions
Author Contributions
Funding
Institutional Review Board Statement
Informed Consent Statement
Data Availability Statement
Acknowledgments
Conflicts of Interest
References
- Büyüközkan, G.; Ilıcak, Ö.; Feyzioğlu, O. A review of urban resilience literature. Sustain. Cities Soc. 2022, 77, 103579. [Google Scholar] [CrossRef]
- Cao, H. Urban Resilience: Concept, Influencing Factors and Improvement. Front. Bus. Econ. Manag. 2023, 9, 343–346. [Google Scholar] [CrossRef]
- Ilugbusi, B.S.; Adisa, O.; Chimezie Obi, O.; Feranmi Awonuga, K.; Adelekan, O.A.; Asuzu, O.F. Urban Resilience to Climate Change: A Review of Adaptation Strategies and Infrastructure Innovations. Ecofeminism Clim. Change 2024, 5, 18. [Google Scholar] [CrossRef]
- United Nation. The-Sustainable-Development-Goals-Report-Special Edition; United Nation: New York, NY, USA, 2023. [Google Scholar]
- ARUP. City Resilience Framework 2024 Edition Preparing for the Next Decade; ARUP: London, UK, 2024. [Google Scholar]
- Urban Agenda Platform. Report on the Implementation of the New Urban Agenda; United Nation: New York, NY, USA, 2022. [Google Scholar]
- Meerow, S.; Newell, J.P.; Stults, M. Defining urban resilience: A review. Landsc. Urban Plan. 2016, 147, 38–49. [Google Scholar] [CrossRef]
- UN-Habitat. Guide to the City Resilience Profiling Tool; UN-Habitat: Nairobi, Kenya, 2018. [Google Scholar]
- Cutter, S.L.; Finch, C. Temporal and spatial changes in social vulnerability to natural hazards. Proc. Natl. Acad. Sci. USA 2008, 105, 2301–2306. [Google Scholar] [CrossRef]
- Resilient Cities Network. In What Is Urban Resilience? SAGE: Thousand Oaks, CA, USA, 2022.
- Farhadi, E.; Pourahmad, A.; Ziari, K.; Faraji Sabokbar, H.; Tondelli, S. Indicators Affecting the Urban Resilience with a Scenario Approach in Tehran Metropolis. Sustainability 2022, 14, 12756. [Google Scholar] [CrossRef]
- Figueiredo, L.; Honiden, T.; Schumann, A. Indicators for Resilient Cities. OECD (Organisation for Economic Co-Operation and Development). 2018. Available online: https://www.oecd.org/en/publications/indicators-for-resilient-cities_6f1f6065-en.html (accessed on 20 March 2018).
- Sharifi, A.; Yamagata, Y. Urban Resilience Assessment: Multiple Dimensions, Criteria, and Indicators. In Advanced Sciences and Technologies for Security Applications; Springer: Berlin/Heidelberg, Germany, 2016; pp. 259–276. [Google Scholar]
- Tajani, F.; Chen, M.; Lu, Y.; Peng, Y.; Chen, T.; Zhang, Y. Key Elements of Attentions for Enhancing Urban Resilience: A Comparison of Singapore, Hong Kong and Hangzhou. Buildings 2022, 12, 340. [Google Scholar] [CrossRef]
- BCN. Climate Emergency Action Plan for 2030 Climate Action; Barcelona City Council: Barcelona, Spain, 2021. [Google Scholar]
- Shorris, A. One New York: The Plan for a Strong and Just City; OneNYC: New York, NY, USA, 2015. [Google Scholar]
- Tokyo Metropolitan Government. Tokyo Climate Change Adaptation Policy; Tokyo Metropolitan Government: Tokyo, Japan, 2019. [Google Scholar]
- City of Copenhagen. Copenhagen Climate Adaptation Plan; Municipality of Copenhagen: Copenhagen, Denmark, 2011. [Google Scholar]
- 100 Resilient Cities. Resilient Semarang; Medium: San Francisco, CA, USA, 2016. [Google Scholar]
- ISO 37120:2018; Sustainable Cities and Communities—Indicators for City Services and Quality of Life. ISO: Geneva, Switzerland, 2018.
- World Council on City Data (WCCD). A Global First—Dubai-WCCD Local Data Hub Launched with WCCD President & CEO and TEC Secretary General. 2019. Available online: https://news.dataforcities.org/2019/11/a-global-first-dubai-wccd-local-data.html (accessed on 6 April 2025).
- Saaty, T.L. The analytic hierarchy process (AHP). J. Oper. Res. Soc. 1980, 31, 1073–1076. [Google Scholar]
- Bunruamkaew, K.; Murayama, Y. Site suitability evaluation for ecotourism using GIS & AHP: A case study of surat Thani Province, Thailand. In Procedia—Social and Behavioral Sciences; Elsevier: Amsterdam, The Netherlands, 2011; pp. 269–278. [Google Scholar]
- Almaliki, A.H.; Zerouali, B.; Santos, C.A.G.; Almaliki, A.A.; da Silva, R.M.; Ghoneim, S.S.M.; Ali, E. Assessing coastal vulnerability and land use to sea level rise in Jeddah province, Kingdom of Saudi Arabia. Heliyon 2023, 9, e18508. [Google Scholar] [CrossRef] [PubMed]
- Azzam, A.; Belhaj Ali, A. Urban Sprawl in Wadi Goss Watershed (Jeddah City/Western Saudi Arabia) and Its Impact on Vulnerability and Flood Hazards. J. Geogr. Inf. Syst. 2019, 11, 371–388. [Google Scholar] [CrossRef]
- Hegazy, I.; Helmi, M.; Qurnfulah, E.; Naji, A.; Samir Ibrahim, H. Assessment of urban growth of Jeddah: Towards a liveable urban management. In International Journal of Low-Carbon Technologie; Oxford University Press: Oxford, UK, 2021; Volume 16, pp. 1008–1017. [Google Scholar]
- Weather Spark. Climate and Average Weather Year Round in Jeddah Saudi Arabia. 2024. Available online: https://weatherspark.com/y/101171/Average-Weather-in-Jeddah-Saudi-Arabia-Year-Round (accessed on 14 December 2024).
- Jeddah Municipality. About Jeddah. 2024. Available online: https://www.jeddah.gov.sa/Jeddah/About/index.php (accessed on 14 December 2024).
- Alhubashi, H.; Alamoudi, M.; Imam, A.; Abed, A.; Hegazy, I. Jeddah strategic approaches to sustainable urban development and vision 2030 alignment. Int. J. Low-Carbon Technol. 2024, 19, 1098–1111. [Google Scholar] [CrossRef]
- Ministry of Municipal and Rural Affairs. Future Saudi Cities Programme City Profiles Series: Jeddah. UN Habitat. Available online: www.momra.gov.sa (accessed on 6 April 2025).
- Dubai Manuplicity. Dubai Public Parks. 2025. Available online: https://www.dm.gov.ae/ (accessed on 8 April 2025).
- World Population Review. Dubai Population. 2025. Available online: https://worldpopulationreview.com/ (accessed on 8 April 2025).
- Statista Research Department. Number of Tress Dubai UAE 2020–2023. 2025. Available online: https://www.statista.com/ (accessed on 8 April 2025).
- Saudi vision Saudi Green Initiative. Available online: https://www.vision2030.gov.sa (accessed on 7 April 2025).


| Criteria | Exp 1 | Exp 2 | Exp 3 | Exp 4 | Exp 5 | Exp 6 | Exp 7 | Exp 8 | Exp 9 | Exp 10 | Average Weight | Rank |
|---|---|---|---|---|---|---|---|---|---|---|---|---|
| Mobility | 0.09 | 0.07 | 0.07 | 0.08 | 0.22 | 0.18 | 0.16 | 0.11 | 0.06 | 0.32 | 0.14 | 4 |
| Infrastructure | 0.24 | 0.16 | 0.18 | 0.16 | 0.22 | 0.10 | 0.27 | 0.29 | 0.30 | 0.23 | 0.21 | 2 |
| Green Spaces | 0.05 | 0.09 | 0.12 | 0.19 | 0.07 | 0.07 | 0.09 | 0.13 | 0.13 | 0.08 | 0.10 | 5 |
| Environmental | 0.15 | 0.20 | 0.22 | 0.29 | 0.13 | 0.18 | 0.16 | 0.18 | 0.18 | 0.13 | 0.18 | 3 |
| Well-Being | 0.09 | 0.11 | 0.08 | 0.07 | 0.05 | 0.08 | 0.06 | 0.06 | 0.05 | 0.05 | 0.07 | 6 |
| Emergency Preparedness | 0.38 | 0.35 | 0.33 | 0.22 | 0.34 | 0.42 | 0.27 | 0.22 | 0.30 | 0.20 | 0.30 | 1 |
| Consistency Ratio | 1.48% | 1.86% | 1.73% | 2.60% | 0.89% | 1.03% | 0.44% | 1.66% | 1.90% | 1.98% | - |
| # | Criterion | Indicator | Measure | +/− | Jeddah | Benchmark (Average) | Compliance | Average Weight | Rank |
|---|---|---|---|---|---|---|---|---|---|
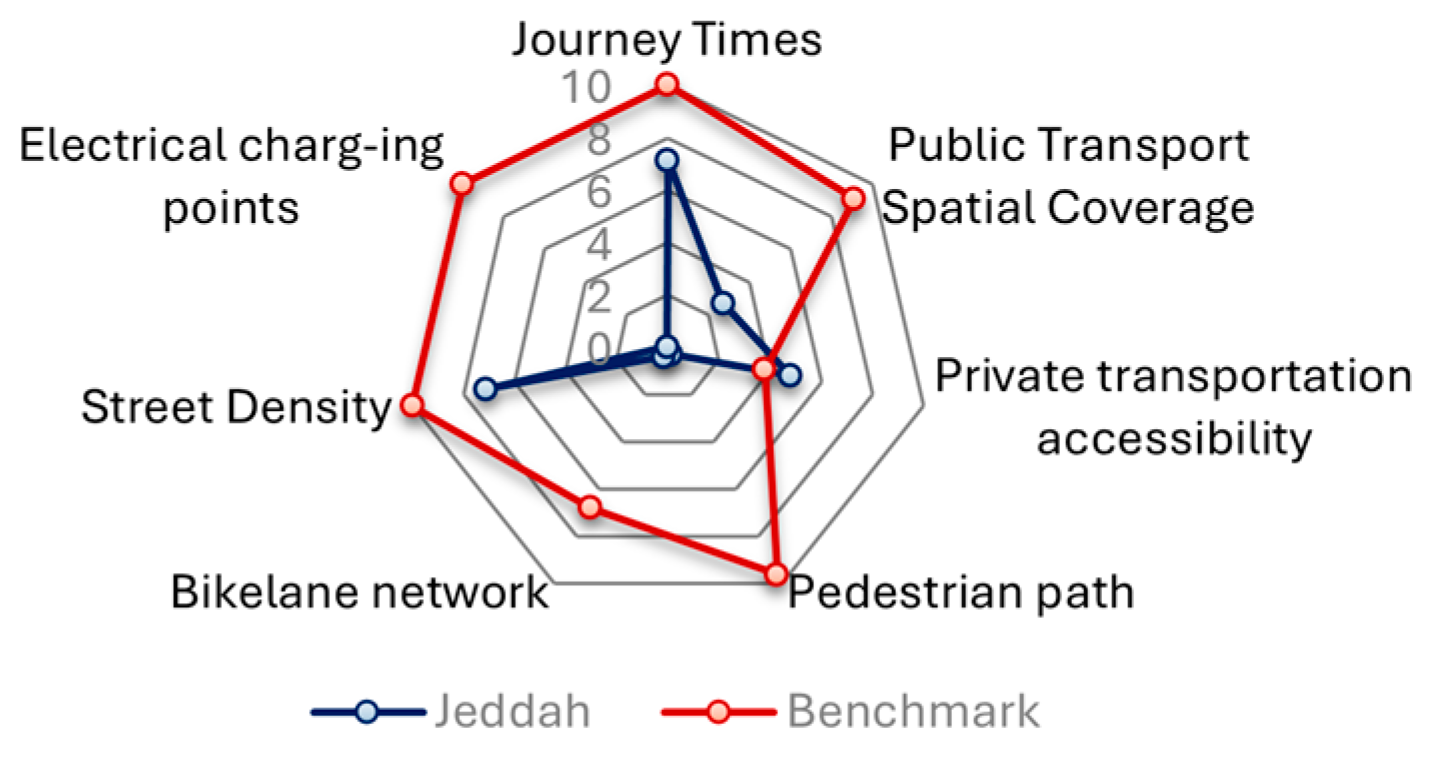
| 1 | Mobility | Journey Times | Average daily journey time per person (minutes). | − | 44 | 31.43 | SC | 0.22 | 2 |
| 2 | Public Transport Spatial Coverage | Ratio of area covered by public transport to the total area of a city (%). | + | 23.99 | 88.33 | MC | 0.31 | 1 | |
| 3 | Private Transportation Accessibility | Ratio of private vehicle ownership to total population (%). | + | 48.46 | 38.57 | FC | 0.16 | 3 | |
| 4 | Pedestrian Path | Ratio of pedestrian path length to total urban surface (%). | + | 0.28 | 96.75 | NC | 0.08 | 5 | |
| 5 | Bike-lane Network | Ratio of bicycle lane length to total road length (%). | + | 0.22 | 59.18% | NC | 0.07 | 6 | |
| 6 | Street Density | Total length of streets per square kilometer of urban area (km/km2). | + | 8.89 | 12.50 | SC | 0.12 | 4 | |
| 7 | Electrical Charging Points | Number of EV charging points per square kilometer of urban area (km2). | + | 0.0102 | 3.45 | NC | 0.04 | 7 | |
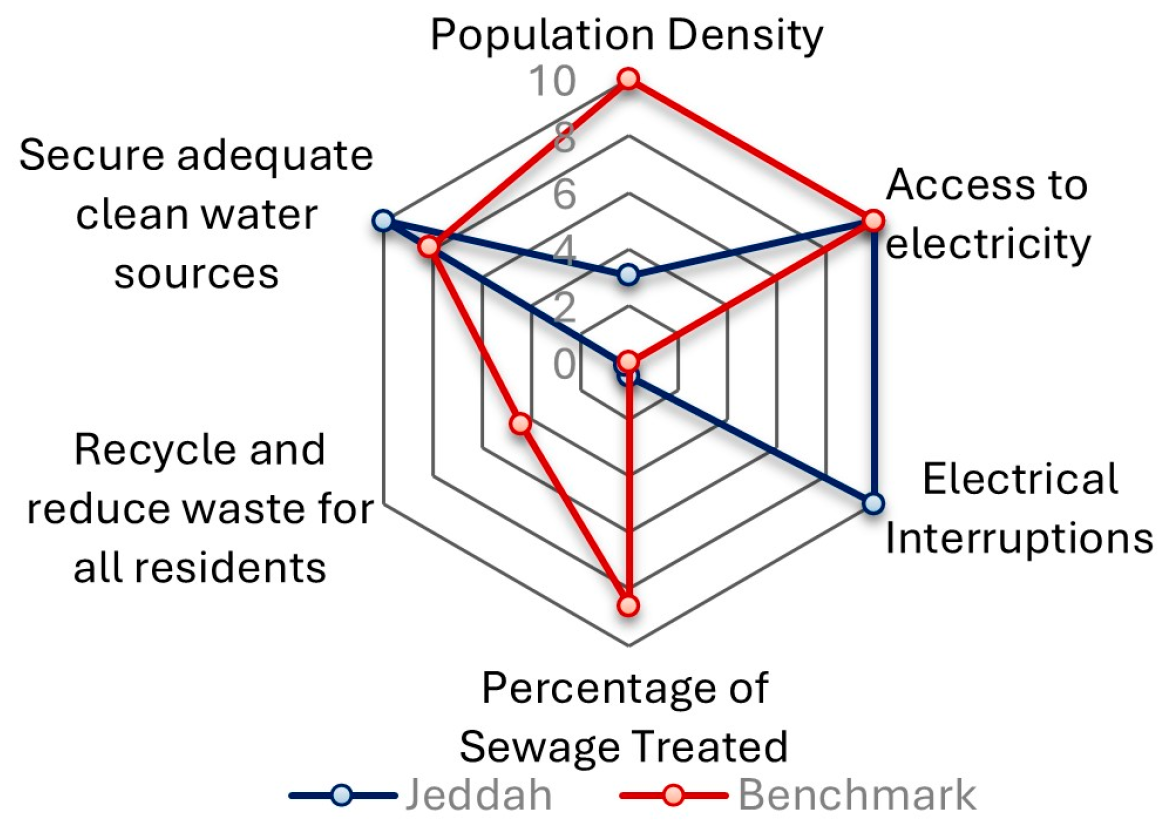
| 9 | Infrastructure | Population Density | Number of people per square kilometer of urban area (people/km2). | + | 2104 | 6852.03 | MC | 0.04 | 6 |
| 10 | Access to Electricity | Ratio of families connected to public electricity to the total number of families (%). | + | 100 | 100 | FC | 0.22 | 2 | |
| 11 | Electrical Interruptions | Average number of customer-hours of interruptions experienced per customer (hours per customer). | − | 0.00003 | 0.303 | FC | 0.08 | 4 | |
| 12 | Percentage of Sewage Treated | Ratio of sewage treated annually to the total sewage produced annually (%). | + | 4.24 (Makkah region) | 86.18 | NC | 0.19 | 3 | |
| 13 | Recycle and Reduce Waste for All Residents | Ratio of the volume of recycled waste to the total volume collected (%). | + | 0.58 | 32.96 | NC | 0.07 | 5 | |
| 14 | Secure Adequate Clean Water Sources | Total volume of water distributed by the total population (m3/year per capita). | + | 128.69 | 105.0 | FC | 0.40 | 1 | |
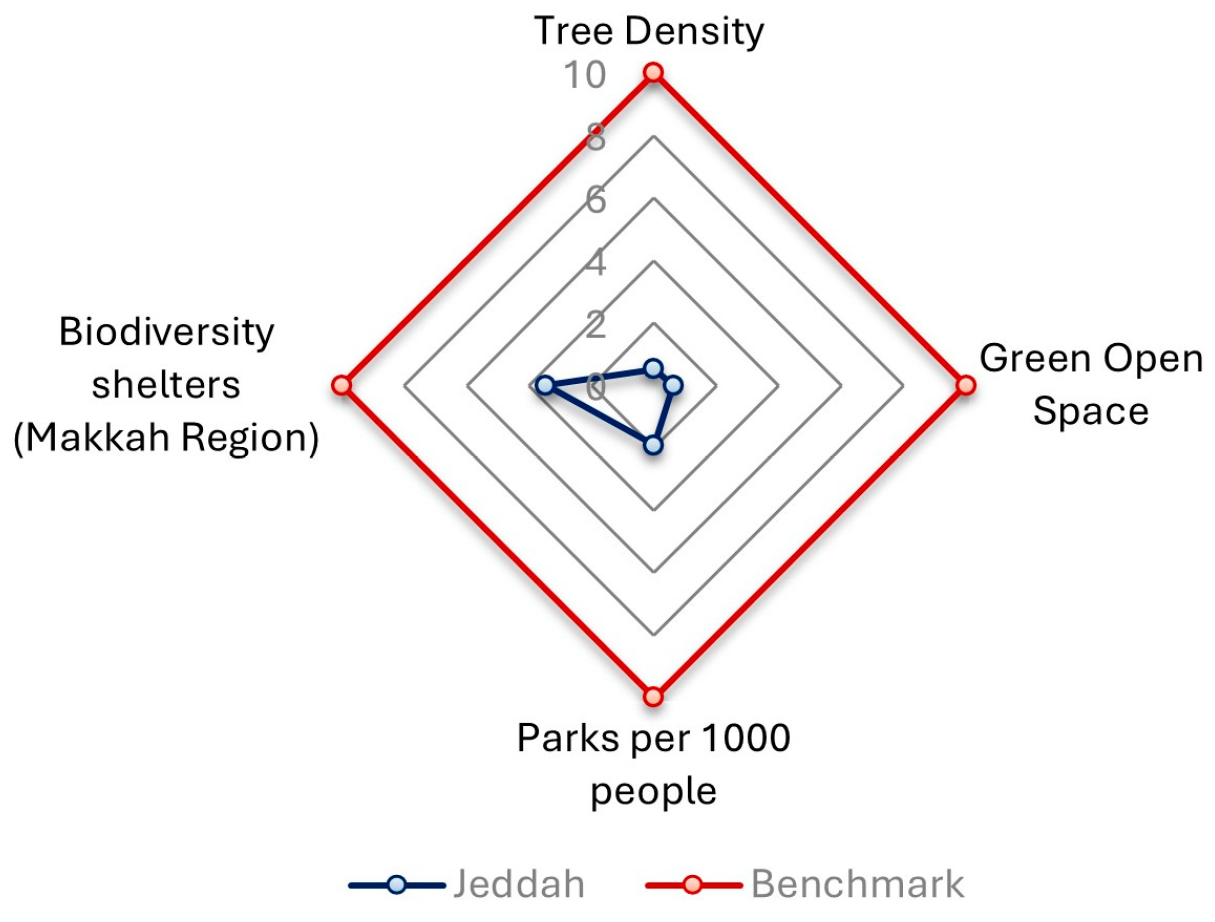
| 15 | Green Space Green Spaces | Tree Density | Total number of trees relative to the total population (trees/person). | + | 0.03 | 0.577 (Dubai: 1.73) | NC | 0.16 | 4 |
| 16 | Green Open Space | Ratio of a city’s total green area to its total urban area (%). | + | 0.13 | 21 (Dubai: 2.5) | NC | 0.34 | 1 | |
| 17 | Public Parks | Ratio of parks available (Parks per 1000 people). | + | 0.044 | 0.23 (Dubai: 0.062) | NC | 0.25 | 3 | |
| 18 | Biodiversity | Ratio of the total area of land designated for natural protection or biodiversity within the city (%). | + | 3.80 (Makkah region) | 8.09 | MC | 0.26 | 2 | |
| 19 | Environmental | Wave Height | Highest recorded wave heights with the average rough wave height worldwide (meters). | − | 3.31 | 2.5 (Rough) | SC | 0.03 | 9 |
| 20 | Sea Level Rise | Highest sea level recorded during extreme tides, storm surges, or annual peaks (millimeters per year). | − | 5 | 3.3 | MC | 0.11 | 5 | |
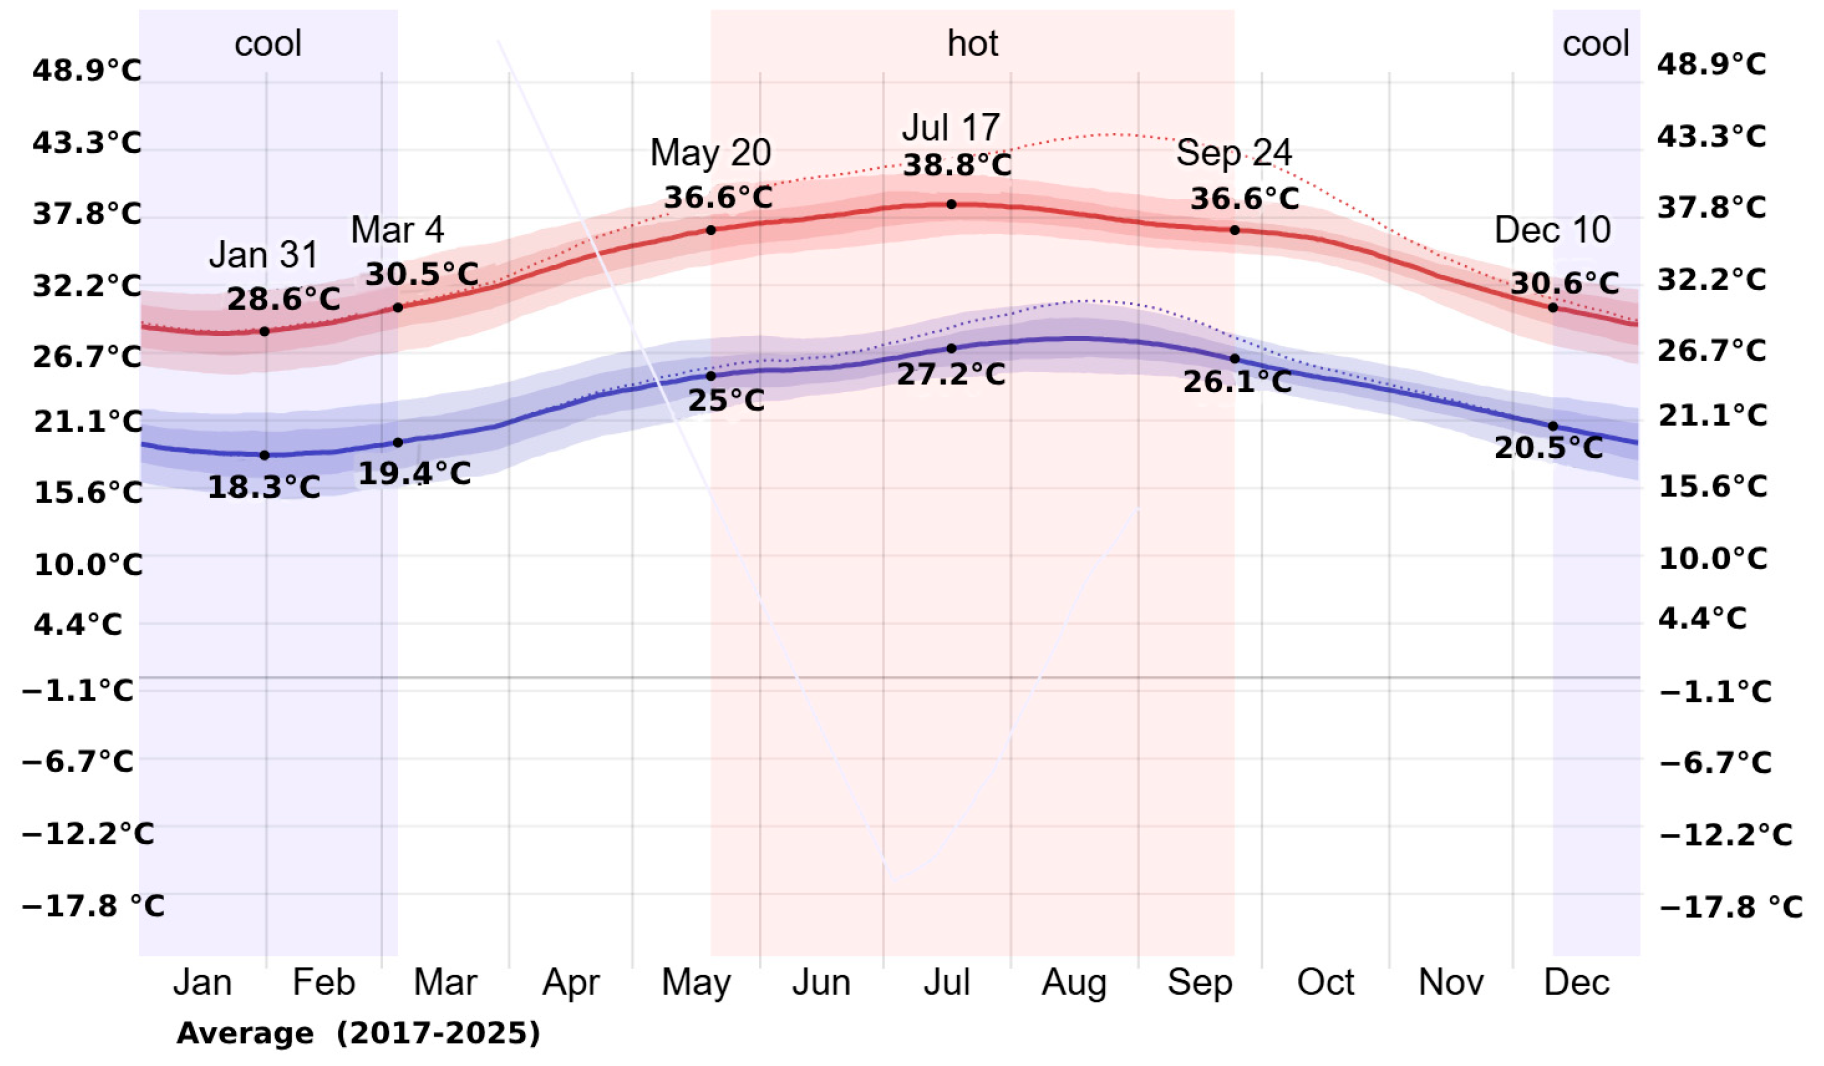
| 21 | Sea Temperature | Average of the sea surface temperatures over a year (°F). | + | 83.21 | 78.8 | FC | 0.06 | 8 | |
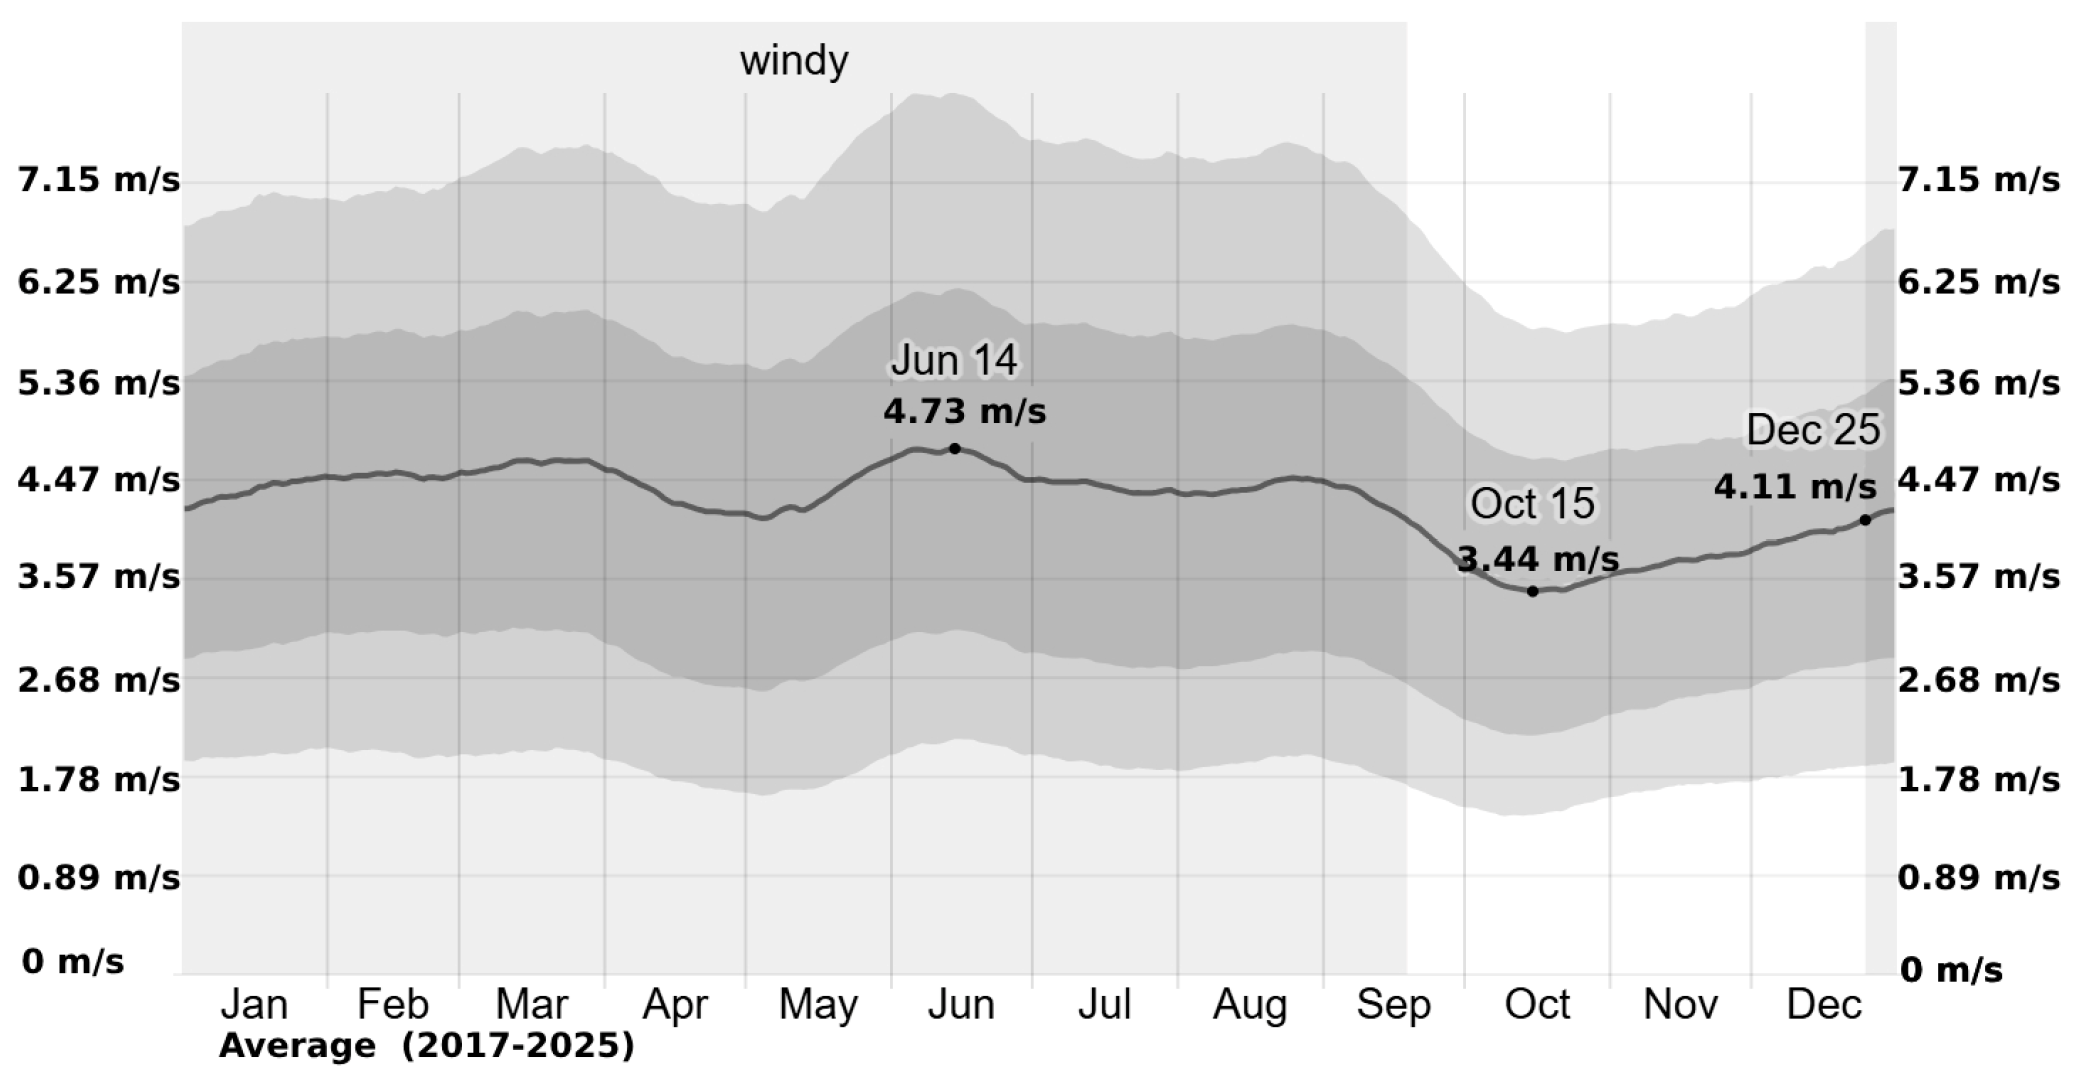
| 22 | Wind Max Speed | Average wind max speed over a year (km/h). | − | 27 | 89 (Storm) | FC | 0.02 | 10 | |
| 23 | PM2.5 across the city | Average concentration of particles in the air over a year (µg/m3). | − | 55.93 | 15 | NC | 0.20 | 1 | |
| 24 | PM10 across the city | Average concentration of particles in the air over a year (µg/m3). | − | 107.8 | 45 | NC | 0.15 | 3 | |
| 26 | NO2 across the city | Average concentration of nitrogen dioxide in the air over a year, measured in parts per billion (ppb). | − | 34.15 | 13.29 | NC | 0.15 | 2 | |
| 27 | SO2 across the city | Average concentration of sulfur dioxide in the air over a year, measured in parts per billion (ppb). | − | 6.29 | 15.27 | FC | 0.08 | 7 | |
| 28 | CO across the city | Average concentration of carbon monoxide in the air over a year, measured in parts per billion (ppb). | − | 488 | 3490 | FC | 0.09 | 6 | |
| 29 | O3 across the city | Average concentration of ozone in the air over a year, measured in parts per billion (ppb). | − | 44.04 | 50.96 | FC | 0.12 | 4 | |
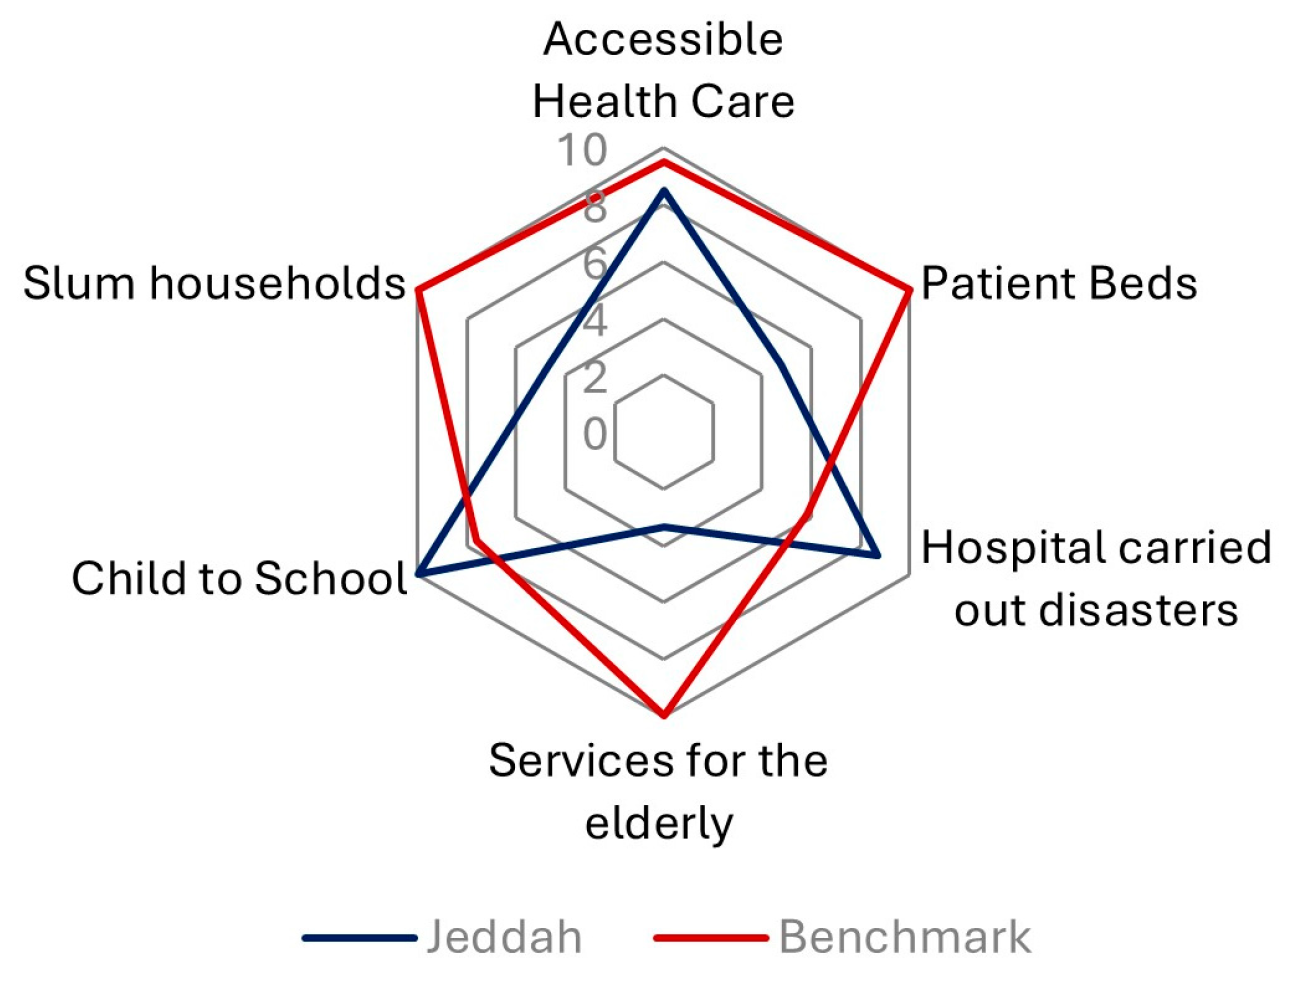
| 30 | Well-being | Accessible Health Care for All Residences | Ratio of residents with health insurance to total population (%) | + | 85.18 (Makkah Region) | 95.38 | FC | 0.28 | 1 |
| 31 | Patient Beds at Hospitals | Ratio of hospital beds to total population (per 1000 people) | + | 2.25 | 4.75 | MC | 0.26 | 2 | |
| 32 | Hospital carried out disasters | Ratio of prepared hospitals and health centers to total facilities (%) | + | 87.84 | 58.63 | FC | 0.25 | 3 | |
| 33 | Adequacy of services for the elderly | Ratio of senior care facilities to senior population (per 1000 seniors) | + | 0.033 | 0.20 | NC | 0.07 | 5 | |
| 34 | Child to School | Ratio of child population to number of schools (children per school) | + | 424.52 | 556.89 | FC | 0.10 | 4 | |
| 35 | Slum households | Ratio of people living in slums to total city population (%) | - | 5.97 | 2.55 | NC | 0.05 | 6 | |
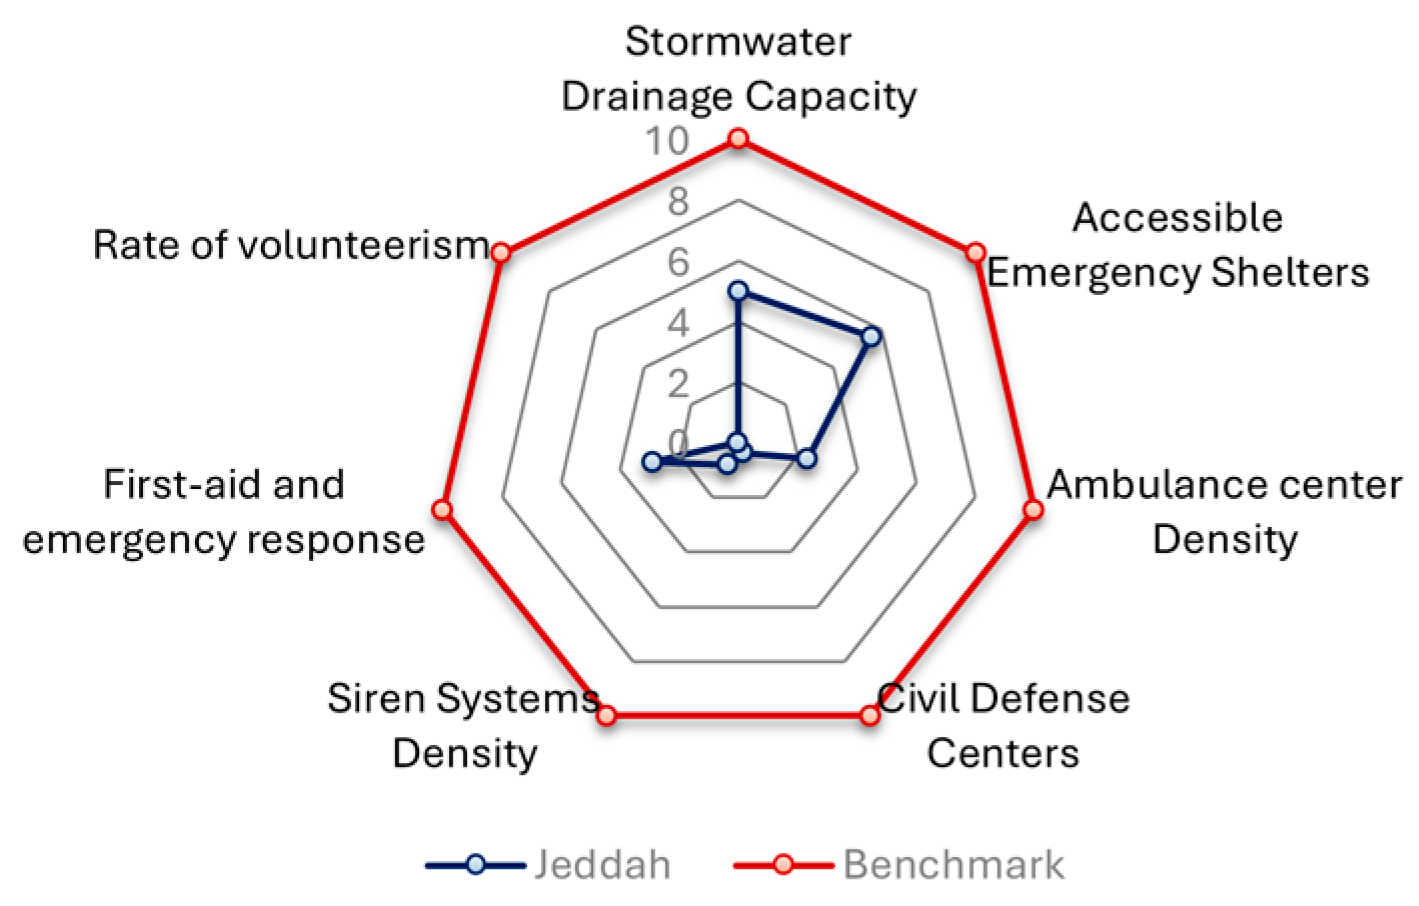
| 36 | Emergency Preparedness | Stormwater Drainage Capacity | Total volume of rainwater runoff generated in an urban area (cubic meters/second). | + | 41.65 | 85 | MC | 0.14 | 3 |
| 37 | Emergency Shelters | Ratio of shelters to total population (%). | + | 0.0056 | 0.01 | MC | 0.11 | 4 | |
| 38 | Ambulance center Density | Number of ambulance stations per square kilometer (stations/km2). | + | 0.011 | 0.047 | NC | 0.33 | 1 | |
| 39 | Civil Defense Centers | Ratio of civil defense center to total population (per 1000 people). | + | 0.0054 | 0.15 | NC | 0.05 | 5 | |
| 38 | Siren Systems Density | Total number of sirens to total urban area (sirens/km2). | + | 0.164 | 2.05 | NC | 0.05 | 6 | |
| 39 | First-aid and emergency response | Ratio of transported patients and injured to the total number of emergency calls (%). | + | 12.12 (Makkah region) | 42 | MC | 0.32 | 2 | |
| 40 | Volunteerism | Ratio of city residents who volunteer to total city population (%) | + | 0.041 (Makkah region) | 26.82 | NC | 0.03 | 7 |
Disclaimer/Publisher’s Note: The statements, opinions and data contained in all publications are solely those of the individual author(s) and contributor(s) and not of MDPI and/or the editor(s). MDPI and/or the editor(s) disclaim responsibility for any injury to people or property resulting from any ideas, methods, instructions or products referred to in the content. |
© 2025 by the authors. Licensee MDPI, Basel, Switzerland. This article is an open access article distributed under the terms and conditions of the Creative Commons Attribution (CC BY) license (https://creativecommons.org/licenses/by/4.0/).
Share and Cite
Dakhil, O.M.; Maatouk, M.M.H.; Aljoufie, M. Urban Resilience Framework for Evaluating Jeddah’s Capacity for Sustainability and Adaptation. Sustainability 2025, 17, 3941. https://doi.org/10.3390/su17093941
Dakhil OM, Maatouk MMH, Aljoufie M. Urban Resilience Framework for Evaluating Jeddah’s Capacity for Sustainability and Adaptation. Sustainability. 2025; 17(9):3941. https://doi.org/10.3390/su17093941
Chicago/Turabian StyleDakhil, Omar Mostafa, Mohamed M. H. Maatouk, and Mohammed Aljoufie. 2025. "Urban Resilience Framework for Evaluating Jeddah’s Capacity for Sustainability and Adaptation" Sustainability 17, no. 9: 3941. https://doi.org/10.3390/su17093941
APA StyleDakhil, O. M., Maatouk, M. M. H., & Aljoufie, M. (2025). Urban Resilience Framework for Evaluating Jeddah’s Capacity for Sustainability and Adaptation. Sustainability, 17(9), 3941. https://doi.org/10.3390/su17093941