1. Introduction
Employment is the cornerstone of economic development and social stability. It not only affects individual livelihoods and social welfare but also serves as a crucial indicator for assessing the economic health and social development level of a country or region [
1]. High-quality employment enhances labor productivity, fosters social harmony, and supports sustainable development. As a result, in the context of globalization and digitalization, achieving high-quality employment—characterized by stability, fairness, and sustainability—has become increasingly critical. Prioritizing employment has consistently remained central to government policy, with the term ‘employment’ mentioned up to 33 times in the Central No. 1 Document over the past three years. As China pursues its “carbon peaking and carbon neutrality” goals amid escalating global environmental challenges, the promotion of high-quality green employment is gaining widespread attention. The proposal of the “carbon peaking and carbon neutrality” goals has provided clear policy guidance and market demand for green employment. By driving the optimization of the energy structure and the low-carbon transformation of industries, it has accelerated the release of technological innovation potential and expanded employment opportunities. The environmental protection industry, covering emerging fields such as environmental governance, clean energy, and carbon capture, can generate multi-tiered job opportunities in technology research and development, equipment manufacturing, and operation and maintenance services. It is increasingly becoming a vehicle for delivering both economic transformation and ecological protection benefits. Notably, the employment-driving effect of the environmental protection industry has gained global recognition. In Europe, expanding employment within the environmental protection industry has proven an effective strategy to address youth unemployment [
2]. Similarly, the
China Labour Market Development Report (2021) projects sustained growth in China’s green employment sector under the “dual carbon” initiative.
Therefore, employment within the environmental protection industry is essential for advancing high-quality economic development in China. It not only facilitates the green transformation of the labor market and supports the attainment of the “dual carbon” targets through talent and technical expertise but also contributes to optimizing employment structure, enhancing job quality, expanding opportunities for workers, and driving the green transformation of the economic structure, thus achieving a balance between economic growth and environmental sustainability. However, limited attention has been directed toward evaluating employment quality within the environmental protection industry at this stage. This highlights the need for a scientifically sound, quantifiable evaluation system to monitor high-quality employment in this sector, offering both theoretical and practical insights for developing a comprehensive policy support framework. Based on the concept of high-quality employment, this paper focuses on the environmental protection industry as a representative case, constructing an evaluation system for high-quality employment levels in this sector. Employing the entropy method, Moran’s Index, and spatial econometric models, the study examines the spatiotemporal characteristics and determinants of high-quality employment across 31 provinces (including autonomous regions and municipalities directly under the central government) in China from 2011 to 2022. A comprehensive understanding of these dynamics will provide theoretical support and practical insights for policy recommendations aimed at promoting high-quality employment within the environmental protection industry.
The concept of high-quality employment has garnered significant attention in both academic and policy-making spheres due to its multidimensional nature. High-quality employment encompasses not only job stability and fairness but also sustainability, which directly affects worker well-being and the long-term development of society [
3,
4,
5]. Existing research on high-quality employment can be broadly divided into three thematic categories. The first category focuses on defining the concept of high-quality employment. Scholars in this area aim to elucidate the core elements and scope of high-quality employment to enable accurate measurement and comparison across industries and regions [
6,
7]. Within this category, two primary perspectives emerge. One perspective emphasizes the importance of employees’ evaluations of their work, particularly regarding mental health impacts [
8], job satisfaction [
9,
10], and overall quality of life. This view highlights aspects such as work experience, interaction styles, employment equality, and social dialog, drawing on the concept of “quality of working life” introduced in Europe and the United States in the 1970s. The International Labour Organization further expanded this perspective through its concept of “decent work”, which underscores the importance of workers’ rights, social security, and social dialog. The second perspective advocates for a comprehensive approach, incorporating both micro and macro dimensions of high-quality employment. On the micro level, this includes job matching efficiency [
11], employment satisfaction [
12], and social welfare [
13], while on the macro level, it encompasses factors such as unemployment rate [
14], labor remuneration [
15], job security, and labor relations [
16]. This broader approach has been particularly explored by national scholars since the early 21st century, emphasizing the importance of workers’ ability to earn a fair wage in a satisfying and challenging work environment, as well as the overall state of the labor market and working conditions.
The second category of research focuses on scientifically measuring employment quality. This line of research employs relevant data and diverse measurement methods to quantify employment quality, aiming to enhance understanding and enable comparisons of employment conditions across different groups and time periods. Two main perspectives dominate this approach. The first perspective suggests that employment quality can be assessed through objective indicators such as workers’ income levels, working conditions, and access to social security, which collectively reflect workers’ economic and social status [
17,
18]. The second perspective advocates for incorporating subjective indicators, including job satisfaction, work–life balance, and similar factors. These subjective measures provide deeper insight into workers’ psychological well-being and overall quality of life [
19,
20].
The third category of studies explores the key factors influencing employment quality, analyzed at both the macro and micro levels to provide a comprehensive understanding of the complex determinants of employment quality. At the macro level, researchers have examined the impact of various factors, such as the policy environment, economic development, technological innovation, and employment structure, on employment quality [
21,
22,
23]. For instance, Lawrence and Bapna emphasize the critical role of government policy support and financial investment in promoting employment growth and improving employment quality [
24,
25]. Su and Li, among others, highlight the positive effect of technological innovation in fostering development and enhancing employment levels, noting that innovation not only drives industrial upgrading but also generates more high-skilled and well-paid job opportunities for workers [
26,
27]. At the micro level, studies delve into factors that influence employment quality at both the individual and organizational levels. At the individual level, key factors include educational background, skill acquisition, work experience, age, gender, and health status. Specifically, workers with higher levels of education and skills are more likely to secure high-quality employment opportunities, typically reflected in higher wages and better working conditions [
28]. Additionally, accumulated work experience enhances workers’ competitiveness in the labor market, thus improving employment quality [
29,
30]. Age and gender also affect employment opportunities and career progression in certain industries and regions [
31,
32]. At the organizational level, factors such as work environment, corporate culture, work–life balance, and career development opportunities play a significant role. A supportive work environment and a positive corporate culture are closely linked to higher job satisfaction and employee loyalty [
33,
34]. Work–life balance is crucial to employment quality, directly influencing workers’ health and well-being [
35]. Furthermore, organizations that provide career advancement opportunities are more likely to attract and retain talent, which in turn enhances overall employment quality [
36,
37].
In summary, the existing literature has extensively explored the connotations, measurement methods, and influencing factors of high-quality employment, yielding valuable insights. However, there are still several areas that warrant further investigation. First, current assessments of employment quality predominantly focus on the macro-industrial level, lacking a differentiated indicator system that accounts for the technology-intensive and policy-driven characteristics of the environmental protection industry. Second, there is a lack of empirical examination based on panel data regarding the spatiotemporal differentiation and dynamic evolution of employment quality in China’s environmental protection industry. Third, in terms of research methodology, traditional econometric models struggle to effectively capture the spatial correlation effects of employment quality across regions, leading to endogeneity bias in the analysis of spatial spillover mechanisms. To address these gaps, this study builds on the concept of high-quality employment and incorporates the fundamental characteristics of employment in the environmental protection industry. It selects targeted indicators and constructs a comprehensive evaluation system for high-quality employment in China’s environmental protection industry, encompassing four dimensions: employment environment, employment remuneration, employment capability, and employment security. The entropy method is employed to measure the high-quality employment level of the environmental protection industry across 31 Chinese provinces from 2011 to 2022. Furthermore, the study applies the Moran index and spatial econometric models to analyze the spatiotemporal characteristics and influencing factors of high-quality employment in the environmental protection industry.
The potential innovations of this study are as follows: (1) This study constructs a high-quality employment evaluation system tailored to the characteristics of the environmental protection industry, addressing the limitation in existing research where industry-level indicator systems lack precision. (2) By utilizing panel data from 31 Chinese provinces between 2011 and 2022, this paper systematically analyzes the spatiotemporal differentiation of high-quality employment in the environmental protection industry under the “dual carbon” goals, providing empirical support for studying the dynamic evolution of green employment quality. (3) Through spatial econometric modeling, this study reveals the spatial synergy mechanism behind the improvement of employment quality in the environmental protection industry, offering a scientific basis for the government to enhance employment quality in the sector and promote coordinated and sustainable regional development.
2. Construction of Indicators for High-Quality Employment in the Environmental Protection Industry, Data Sources, and Research Methodology
2.1. Selection Criteria for Environmental Protection Industries
In 2021, China published the Statistical Classification of Energy Saving and Environmental Protection Clean Industry, which provides a clear framework for defining the scope of the energy-saving and environmental protection clean industry. This classification includes key sectors such as energy saving, environmental protection, clean production, and clean energy industries. However, the level of detail in these divisions often makes it challenging to access relevant data comprehensively. For instance, environmental protection-related activities such as clean energy production, green building design, agricultural pollution control, and biomass energy utilization are inherently linked to the environmental protection industry. Yet, data on these activities are primarily embedded within aggregated statistics for broader sectors such as manufacturing, construction, and agriculture. Consequently, they cannot be directly extracted as standalone categories from official statistical classifications, making it difficult to conduct precise and systematic analyses. To address these limitations, this study refines the official classification by incorporating factors such as data availability, the direct environmental impact of each industry, and insights from existing research. Based on these considerations, six major sectors are selected as representative areas of the environmental protection industry: forestry, comprehensive utilization of waste resources, professional and technical services, water management, ecological protection and environmental governance, and public facility management. The rationale behind the selection of these sectors is as follows:
Firstly, China’s forest carbon sequestration capacity, estimated at approximately 400 million tons, represents a significant global carbon sink. Expanding forest carbon sequestration, enhancing forestry management practices, and optimizing forestry policy frameworks are crucial for achieving the country’s “Dual Carbon” goals. Forestry, as the cornerstone of the environmental protection industry, plays a critical role in maintaining biodiversity, promoting carbon sink creation, and preserving ecological balance. Forest ecosystems are essential for climate regulation, and soil and water conservation, and serve as a core component in achieving sustainable development. From an employment perspective, forestry covers various activities such as afforestation, forest protection, and forest resource monitoring, providing a wide range of job opportunities for labor with different skill sets and educational levels. These jobs not only contribute to the development of the forestry sector but also play an important role in promoting high-quality employment in the environmental protection industry. Secondly, the comprehensive utilization of the waste resources industry helps reduce environmental pollution and resource wastage by transforming waste into valuable resources. This industry promotes resource recycling and provides a material foundation for the green transformation of the economy. Thirdly, the professional and technical services sector within environmental protection functions as both a consultant and innovator, offering expertise in areas such as environmental impact assessments, pollution control technologies, and ecological restoration programs. These services are crucial for enhancing the industry’s environmental protection standards and fostering technological innovation. With the increasing requirements of environmental protection, the demand for high-quality professionals in the professional and technical services industry is increasing, and these talents receive high salaries and good career development opportunities, but also promote the improvement of the overall quality of employment in the environmental protection industry. Fourth, the water management industry is responsible for the rational allocation, management, and protection of water resources, playing a crucial role in preventing and controlling water pollution and maintaining the ecological balance of water environments. Water resources are fundamental to human survival and development, and the stable development of the water management industry is of great significance for ensuring human well-being. Fifth, the ecological protection and environmental governance sector is directly engaged in ecological restoration and environmental management, including the remediation of polluted sites, management of ecological protection areas, and environmental monitoring. This sector is a key force in improving environmental quality and safeguarding ecosystems. The development of this industry is directly related to the achievement of environmental protection goals, with a growing demand for specialized talents that are increasingly diversified and high-end. From environmental monitoring technicians to ecological restoration experts, employment positions at various levels provide strong support for high-quality employment in the environmental protection industry. Finally, the public facilities management industry contributes to the creation of healthier and greener living environments by maintaining and optimizing public facilities such as urban parks and green spaces. It plays a significant role in enhancing urban environmental quality and improving the overall quality of life for residents.
In summary, these six sectors have been selected not only because they encompass key areas within the environmental protection industry, but also due to their central roles in environmental protection, resource management, technical services, water resource conservation, ecological restoration, and public space management. This definition enables the study to offer a more comprehensive and nuanced assessment of high-quality employment in China’s environmental protection industry. It provides policymakers and industry planners with a scientific foundation for decision-making, ultimately contributing to the healthy development of the environmental protection industry and the overall optimization of the labor market.
2.2. Development of an Evaluation System for High-Quality Employment in the Environmental Protection Industry
This study argues that the definition of high-quality employment can be understood from two key dimensions. First, given the current economic context, society should ensure the provision of sufficient employment opportunities while guaranteeing fair and reasonable compensation, comprehensive employment security, and continuous career development opportunities for workers. Specifically, this encompasses a safe and healthy working environment, competitive pay and benefits, job stability, comprehensive social security, and avenues for career progression. This employment model aims to meet the material and spiritual needs of workers, promote their holistic development, and contribute to sustainable socio-economic growth. Secondly, high-quality employment also refers to employment that aligns with market demand and supports technological progress and the optimization of industrial structures. In other words, high-quality employment not only enhances individual well-being but also serves as a driving force for economic and social development, as well as industrial upgrading. Within this framework, the upgrading of workers’ skills is of particular importance. Not only is it essential for personal career growth, but it also serves as a prerequisite for adapting to and driving economic and social transformations. To assess the level of high-quality employment in the environmental protection industry in a scientific, reasonable, and objective manner, this study develops an evaluation index system based on four dimensions: employment environment, employment ability, employment remuneration, and employment security, drawing upon the relevant literature [
18,
37,
38,
39].
The employment environment is directly related to the realization of high-quality employment. This study selects five indicators to measure it: regional economic development level (GDP), employment rate in the environmental protection industry, fiscal expenditure on energy conservation and environmental protection, urbanization level, and urban unemployment rate. The regional economic development level (GDP) reflects the overall economic condition of a region, as economic growth provides a fundamental guarantee for job creation. A higher GDP indicates more resources available for investment in the environmental protection industry, thereby generating more job opportunities and laying an economic foundation for high-quality employment. The employment rate in the environmental protection industry measures the industry’s capacity to absorb labor and serves as an important basis for assessing the sufficiency of employment opportunities in the sector. Fiscal expenditure on energy conservation and environmental protection represents government investment in the industry and reflects the level of policy support. Increased fiscal spending can promote the implementation of environmental projects, driving job growth within the sector. The advancement of urbanization is accompanied by a growing demand for environmental protection, such as urban sewage treatment and waste management, which expands employment opportunities in the environmental protection industry. Finally, the urban unemployment rate serves as an inverse indicator of the employment environment. A lower urban unemployment rate suggests less competitive pressure in the labor market, facilitating more stable and higher-quality job opportunities for workers.
Employment capability reflects workers’ ability to create value within an industry and their career development potential. This study measures it using four indicators: labor productivity in the environmental protection industry, the proportion of employees with a bachelor’s degree or higher, fixed asset investment in the environmental protection industry, and R&D investment. Labor productivity in the environmental protection industry is a key indicator of workers’ ability to generate value. Higher labor productivity is often associated with higher wages, more advanced technology applications, and broader career development opportunities, making it an essential component of high-quality employment. The proportion of employees with a bachelor’s degree or higher reflects the concentration of highly skilled talent within the industry. The influx of talent facilitates technological innovation and industrial upgrading, thereby improving overall employment quality. Fixed asset investment in the environmental protection industry serves as a crucial indicator of the industry’s growth potential and market confidence. Investment growth typically drives technological advancements, industry expansion, and the creation of more high-skilled jobs. R&D investment is fundamental to the advancement of environmental protection technologies. It fosters the creation of high-end research positions and stimulates the development of the entire industrial chain, ultimately enhancing the overall quality and level of employment in the industry.
Employment remuneration is a key dimension for assessing high-quality employment. This study selects three indicators for evaluation: the average wage of employees in the environmental protection industry, social security and employment expenditure, and the urban-rural wage gap. The average wage of employees in the environmental protection industry directly reflects workers’ economic returns and serves as one of the core indicators for measuring employment quality. Social security and employment expenditure determine the level of welfare protection for workers. A well-developed social security system helps enhance workers’ sense of security and job stability. The urban-rural wage gap reflects employment equity. A smaller gap indicates a more balanced distribution of job opportunities and income, aligning with the principles of high-quality employment.
Employment security is crucial for workers’ long-term career stability and rights protection. Indicators such as medical insurance coverage, work injury insurance coverage, and unemployment insurance coverage reflect the level of protection workers receive in terms of healthcare, occupational injuries, and unemployment. A comprehensive social insurance system can alleviate workers’ concerns, thereby enhancing employment stability and quality. The labor dispute settlement rate measures the effectiveness of workers’ rights protection. A higher settlement rate indicates that workers’ legal rights are safeguarded in a timely and effective manner, fostering a favorable employment environment and promoting high-quality employment.
These indicators comprehensively depict the concept of high-quality employment in the environmental protection industry from multiple perspectives, covering key aspects such as job creation, workers’ skill utilization, economic returns, employment stability, and rights protection.
The specific evaluation system for high-quality employment in the environmental protection industry is outlined in
Table 1.
Data Source: The data used in this study are derived from official statistical yearbooks published by government departments, including the China Statistical Yearbook, China Population and Employment Statistical Yearbook, and China Labour Statistical Yearbook. Additionally, data from provincial statistical yearbooks (for autonomous regions and municipalities directly under the central government) and provincial statistical bulletins are also utilized. Since this study is based on provincial-level data analysis in China and involves multiple data dimensions, some regions have missing data for specific years. For example, Qinghai Province only reported the total fixed asset investment in the environmental protection industry for 2011–2016 and 2018–2022, leaving a one-year data gap. To ensure data completeness and the accuracy of the analysis, this study applied interpolation methods to address the missing values. Common interpolation techniques in existing research include linear interpolation, mean imputation, and spatial interpolation. Given that the dataset used in this study is panel data with a clear time trend, linear interpolation was chosen as it assumes a linear change in values over the missing period. This method is particularly effective for handling indicators with strong temporal continuity, ensuring higher accuracy in filling data gaps. Therefore, this study employs linear interpolation to complete missing values, minimizing the impact of data gaps on research findings and enhancing the robustness of the analysis.
In addition, in order to verify the robustness of the linear interpolation method, this paper evaluates the reliability of the linear interpolation method by calculating the mean square error (MSE). The final calculation result is MSE = 0.036, and the mean square error is less than 5%. This shows that the results of interpolation are more robust when dealing with data-missing problems.
2.3. Research Methodology
2.3.1. Entropy Value Method
The entropy value method is a widely used objective weighting technique in comprehensive evaluation systems. It effectively minimizes the influence of human subjective judgment on evaluation outcomes, thereby enhancing the credibility and accuracy of the results. Unlike traditional subjective weighting methods, the entropy value method calculates the weight of each indicator by quantifying data uncertainty, ensuring a more objective evaluation. In this study, the entropy value method is applied to the comprehensive assessment of the green logistics development level in the Zhengzhou metropolitan area, ensuring the objectivity and accuracy of the evaluation results. The evaluation process is carried out in the following steps:
- (1)
Data Type Standardization. The indicators of different dimensions, different orders of magnitude, and different attributes (positive and negative) are unified and standardized. The specific formula is shown in Equations (1) and (2):
where
X* is the standardized value;
Xij represents the value of the
jth indicator in year
i; max(
X) is the maximum value of indicator
Xij; and min(
X) is the minimum value of indicator
Xij. Equation (1) is used for processing positive indicators, mapping their values to the [0, 1] range, ensuring that higher indicator values correspond to standardized values closer to 1. This transformation more clearly reflects the positive impact of these indicators on high-quality employment in the environmental protection industry. For example, in the case of the “employment rate in the environmental protection industry”, a positive indicator, this equation standardizes employment rate data across different regions and years, ensuring comparability on a unified scale for subsequent analysis and evaluation. Equation (2) is designed for negative indicators. While its underlying principle is similar to that of the positive indicator equation, its calculation method is the inverse. The goal is to map negative indicator values to the [0, 1] range in such a way that smaller values correspond to standardized values closer to 1, indicating a weaker negative impact on employment levels. For instance, in the case of the “urban unemployment rate”, a negative indicator, the standardization process reverses its evaluation direction to align with positive indicators. This transformation allows different types of indicators to be analyzed within the same framework, enhancing the scientific rigor and comparability of the evaluation.
- (2)
Determination of indicator weights: After data standardization, the process of determining indicator weights involves the following steps.
- b.
Based on the calculation result of Equation (3), the entropy value of each index is calculated. The calculation formula is shown in Equation (4):
where
,
n represents the number of samples. The entropy value
ej is used to measure the degree of disorder in the information of an indicator. A smaller entropy value indicates that the information provided by the indicator is more orderly, implying a higher importance of the indicator within the evaluation system.
- c.
According to the entropy value of each index obtained by Equation (4), the coefficient of variation in each index is calculated. The calculation formula is shown in Equation (5):
The coefficient of variation dj reflects the degree of variation in an indicator. A larger coefficient of variation indicates greater differences in the indicator across different samples, meaning it has a more significant impact on the evaluation results.
- d.
The weight of each index is calculated according to the results of the variation coefficient of each index obtained by Equation (5), as shown in Equation (6):
where,
Wj represents the final determined weight of the
jth indicator, while the total number of indicators is considered. Through this calculation, the weights of each indicator in evaluating the high-quality employment level of the environmental protection industry are ultimately determined, ensuring that the evaluation results are more objective and accurate.
- e.
Calculation of Evaluation Indices for Indicators. The index of different indicators is calculated according to the weight of indicators and the value after the standardization of indicators. The specific formula is shown in Equation (7) as follows:
where, the value of
S ranges from [0, 1]. The closer
S is to 1, the higher the level of high-quality employment in the environmental protection industry in that region. Conversely, the closer
S is to 0, the lower the high-quality employment level in the environmental protection industry for that province. Using this calculation as a benchmark enables a more intuitive quantification and comparison of the high-quality employment levels in the environmental protection industry across different regions.
2.3.2. Moran Index
To conduct a thorough analysis of the spatial distribution characteristics of high-quality employment in China’s environmental protection industry, this study employs Moran’s I as the analytical tool. The specific calculation process of the Moran index is shown in Equations (8) and (9):
where
represents the spatial weight matrix,
denotes the level of high-quality employment in the
ith region,
refers to the level of high-quality employment in the
jth region,
is the mean level of high-quality employment, and
signifies the sample variance.
2.3.3. Spatial Panel Modeling
The use of spatial econometric modeling offers a more precise analysis when employment activities exhibit spatial interdependence. This approach enhances the traditional panel data model by incorporating a spatial dimension, which accounts for the geographic location of the study subject, thereby capturing spatial correlations between variables more effectively [
40]. This model not only reveals the interactions of employment activities across different regions but also evaluates the potential influence of spatial factors on employment quality, providing a more comprehensive understanding of the employment dynamics. Building on the methodologies employed by previous scholars [
41], this paper adopts the spatial Durbin model to analyze the factors influencing the level of high-quality employment in China’s environmental protection industry. The calculation formula is shown in Equation (10):
where
represents the level of high-quality employment in the environmental protection industry for province (autonomous region, municipality directly under the central government)
i in period
t;
is the element in row
i and column
j of the spatial weight matrix, with a nested matrix of economic distances being employed for the analysis in this study. The development of the environmental protection industry is not only constrained by regional economic conditions but is also closely linked to geographical location. The economic-geographic nested matrix integrates economic and geographic factors, providing a more comprehensive reflection of the interregional influence on high-quality employment levels in the environmental protection industry. This matrix is calculated based on local latitude and longitude distances, allowing for a more precise measurement of the actual spatial distance between regions. By incorporating economic factors, the weight assignments in the spatial weight matrix more accurately capture the real interactions between different regions in terms of high-quality employment levels in the environmental protection industry. Its calculation method is
, where
dij represents the economic distance between region
i and region
j, and
distanceij is the actual geographic distance calculated based on the local latitude and longitude of regions
i and
j. Through this calculation method, the closer the actual geographic distance between regions, the larger the economic-geographic distance
dij, resulting in a higher weight in the spatial weight matrix. This implies a more significant mutual influence on the high-quality employment level in the environmental protection industry. Conversely, the farther the distance, the smaller the weight, indicating a relatively weaker mutual influence.
denotes the spatial autoregressive coefficient; represents the coefficient of the explanatory variables; indicates the coefficient of the spatial lagged term; and consists of a series of explanatory variables. Based on the research of existing scholars, the following explanatory variables are selected for this study: the level of economic development (GDP): the logarithm of per capita GDP; the level of capital investment (Inv): the logarithm of total fixed asset investment in the environmental protection industry; the level of urbanization (Urb); the level of governmental support (Gov): the logarithm of total government expenditure on social security and employment; the intensity of research and development (Res): the percentage of internal expenditure on R&D funding; the level of employment (Peo): the number of people employed in the environmental protection industry; the level of industrial structure (Str): the percentage of employment in the tertiary industry. While indicates province fixed effects, denotes time fixed effects, and is the random perturbation term.
3. Results of the Measurement and Characterization of the Level of High-Quality Employment in the Environmental Protection Industry (Time and Space)
3.1. The Results of Measuring the Level of High-Quality Employment in the Environmental Protection Industry
The entropy method was employed to quantify the level of high-quality employment in China’s environmental protection industry, using various indicators and their corresponding weights as outlined in
Table 1. Higher composite scores indicate that the industry performs more effectively in terms of high-quality employment, while lower scores suggest areas for potential improvement in enhancing employment quality within the sector. The specific calculation results are presented in
Table 2.
The results presented in
Table 2, which measure the level of high-quality employment in China’s environmental protection industry from 2011 to 2022, clearly show an upward trend over this period. This reflects the growing national attention and investment in the environmental sector. Notably, economically developed municipalities such as Beijing and Shanghai scored significantly higher than the national average, underscoring the excellence of job opportunities and employment quality in these regions.
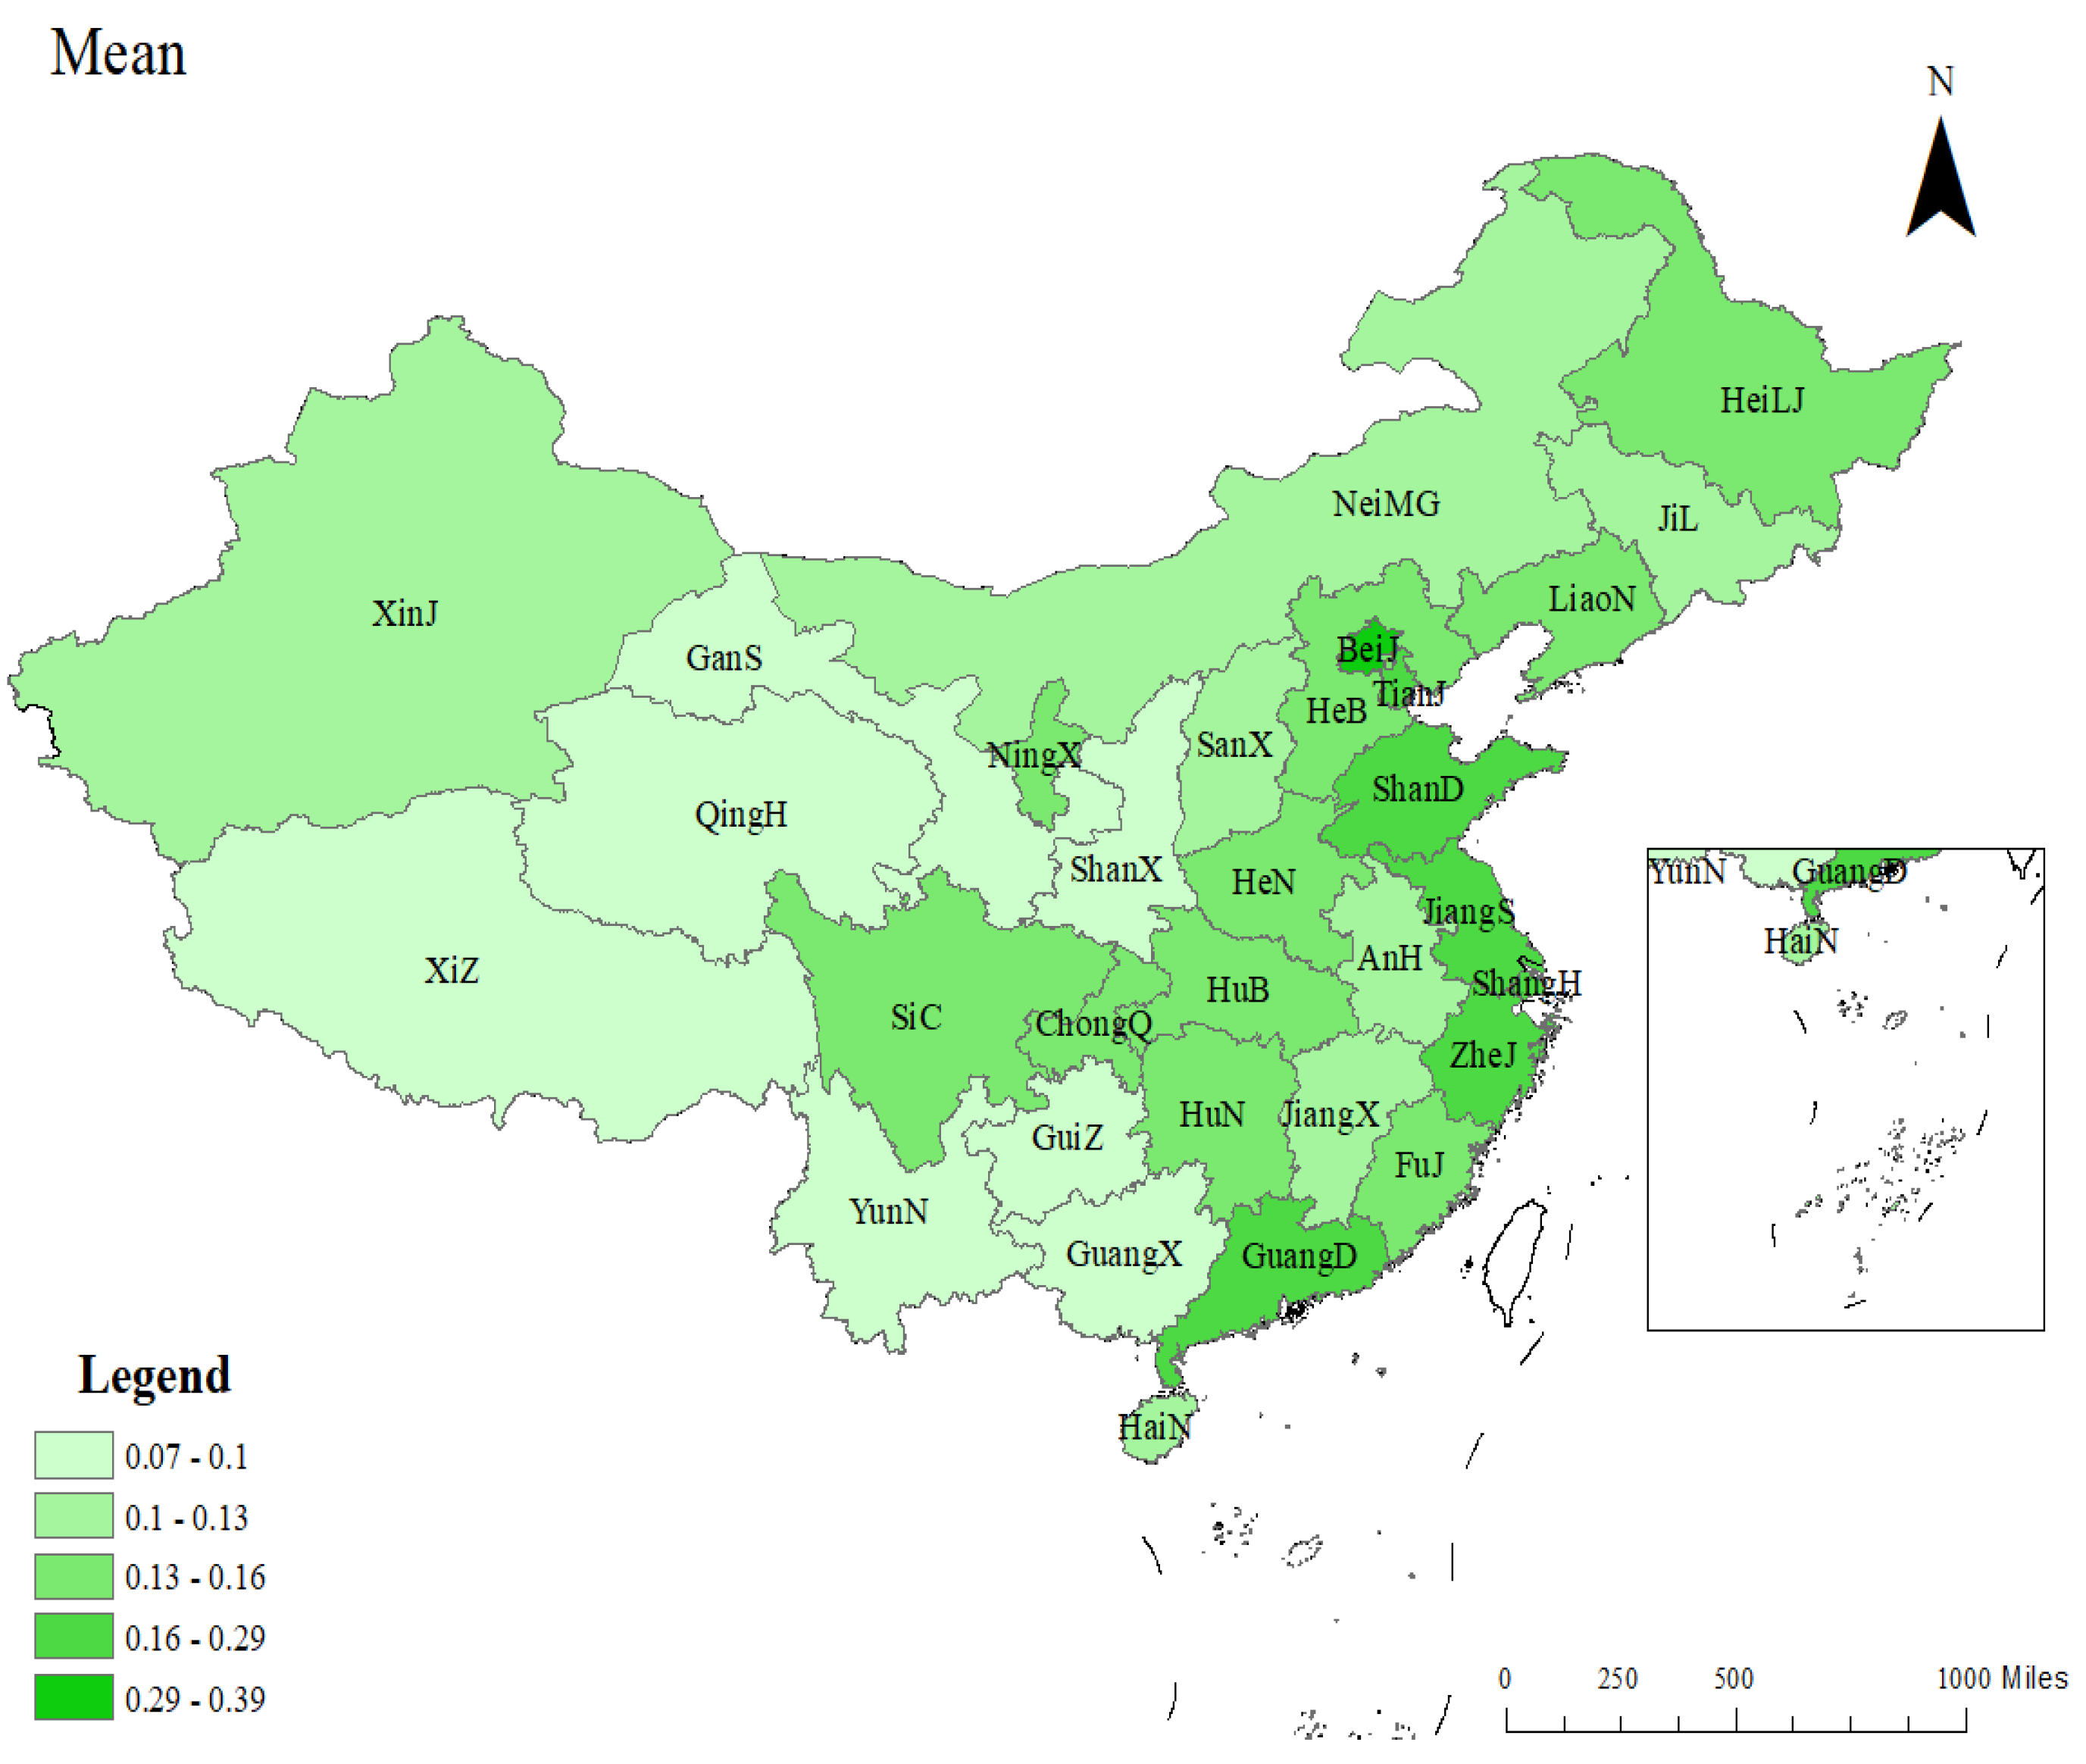
Figure 1 presents the average distribution of employment quality in China’s environmental protection industry across provinces from 2011 to 2022, with darker colors indicating higher employment quality levels. Observing
Figure 1, it can be seen that seven provinces (municipalities), including Beijing, Tianjin, Shanghai, Jiangsu, Zhejiang, Shandong, and Guangdong, have consistently maintained employment levels above the national average during the study period. Additionally, in terms of the average level of high-quality employment across provinces (autonomous regions and municipalities), Beijing, Tianjin, Liaoning, Shanghai, Jiangsu, Zhejiang, Shandong, and Guangdong demonstrate performance exceeding the national average. In contrast, the remaining 23 provinces (autonomous regions and municipalities) fall below the national average, with Guangxi Zhuang Autonomous Region, Guizhou, Yunnan, Tibet Autonomous Region, Gansu, and Qinghai ranking at the bottom. The top-ranking provinces (autonomous regions) are primarily concentrated along China’s eastern coastal economic belt, benefiting from early reform and opening-up policies, higher levels of economic development, and rapid industrial upgrading. These regions have developed and strengthened awareness of environmental protection and sustainable development at an earlier stage. Conversely, the lower-ranking provinces are mostly located in China’s western regions, where natural conditions are relatively harsh, economic development lags behind, and industrial structures remain less diversified. These areas face significant shortcomings in high-quality employment within the environmental protection industry, mainly due to insufficient financial investment, weak technological innovation capacity, and a shortage of specialized talent, limiting their potential for industry development. These findings highlight that the overall level of high-quality employment in China’s environmental protection industry remains relatively low, with significant regional disparities.
The overall development of China’s environmental protection industry and the performance of individual regions were further analyzed, with the results presented in
Figure 2. Since 2011, employment levels in the environmental protection industry have followed a steady upward trajectory, rising from 0.1 in 2011 to 0.2 in 2022. This trend reflects the country’s increasing emphasis on environmental protection, driven by heightened environmental awareness and strong policy support. The industry’s expansion underscores its growing role in the national economy and its contribution to high-quality employment opportunities. Notably, a sharp increase in employment levels occurred between 2020 and 2021, coinciding with China’s strategic commitment to achieving carbon peaking and carbon neutrality—the “dual carbon” targets. This policy shift spurred substantial investments from both national and local governments in environmental technologies, clean energy, and energy-saving initiatives, accelerating technological innovation, upgrading industrial structures, and generating new employment opportunities within the sector. However, after 2021, employment levels declined, largely due to the lingering economic effects of the COVID-19 pandemic, which led to slower economic growth, business downsizing, a deteriorating job market, and heightened unemployment risks, all of which negatively impacted overall employment quality. Despite these challenges, employment quality within the environmental protection industry continues to improve, though there remains considerable room for further growth and enhancement in both employment expansion and overall job quality relative to the broader economy.
From a comparative regional perspective, the eastern region continues to lead in the level of high-quality employment in China’s environmental protection industry. This can be attributed to its strong economic foundation, high job-absorbing capacity, and advantages in wages and employment conditions. The region has made substantial investments in the environmental protection industry and in research and development, creating favorable conditions for industry growth and generating significant employment opportunities. The central region has also experienced rapid growth in high-quality employment in the environmental sector in recent years, approaching the national average by 2022. Notably, during the pandemic, the quality of employment in the central region did not decline as much as in the national or eastern regions. Instead, it continued to rise, likely due to labor shortages and rising production costs in the eastern region, prompting some environmental companies to relocate operations to the central region, where costs are lower and labor supply is more stable. In contrast, the western region, while still facing challenges in terms of relatively low levels and slow growth of high-quality employment due to natural conditions and economic limitations, is gradually unveiling the potential of its environmental protection industry. With the continued implementation of the national development strategy for the Western region and a growing emphasis on ecological protection, the Western region is expected to experience an increase in high-quality employment levels in the future. In conclusion, although the level of high-quality employment in China’s environmental protection industry has been subject to short-term fluctuations due to the pandemic, the long-term growth trend remains intact. With continued support from national strategies, the industry is poised for more balanced and higher-quality development.
3.2. Analysis of the Spatial Distribution of High-Quality Employment in the Environmental Protection Industry
To gain a deeper understanding of the spatial distribution characteristics of high-quality employment in China’s environmental protection industry, spatial autocorrelation analysis was employed. The objective was to identify potential spatial dependencies in employment quality between provinces. The results of this spatial autocorrelation analysis, based on data collected over the study period, are summarized in
Table 3. The analysis reveals that Moran’s I is greater than zero for all years within the time span examined, and it remains statistically significant at the 5% level. This consistently positive Moran’s I indicates the presence of positive spatial autocorrelation in the level of high-quality employment across China’s environmental protection industry. In other words, geographically, proximate provinces tend to exhibit similar levels of high-quality employment, suggesting that proximity plays a role in shaping employment quality. Upon further examination of Moran’s I over time, a clear upward trend is evident from 2011 to 2022. This increasing trend not only reflects the dynamic evolution of spatial autocorrelation in the level of high-quality employment but also suggests that spatial correlations have strengthened over the years. This trend may be linked to factors such as national policy support for the environmental protection industry, greater regional economic integration, and heightened public awareness of environmental issues. Additionally, the year-on-year growth of Moran’s I imply a gradual emergence or reinforcement of regional clustering in the spatial distribution of high-quality employment within the environmental protection industry. These findings highlight the importance of considering spatial factors when designing and implementing policies aimed at promoting employment. Policymakers should account for inter-regional disparities to foster coordinated development and improve the overall quality of employment across regions in the environmental protection industry.
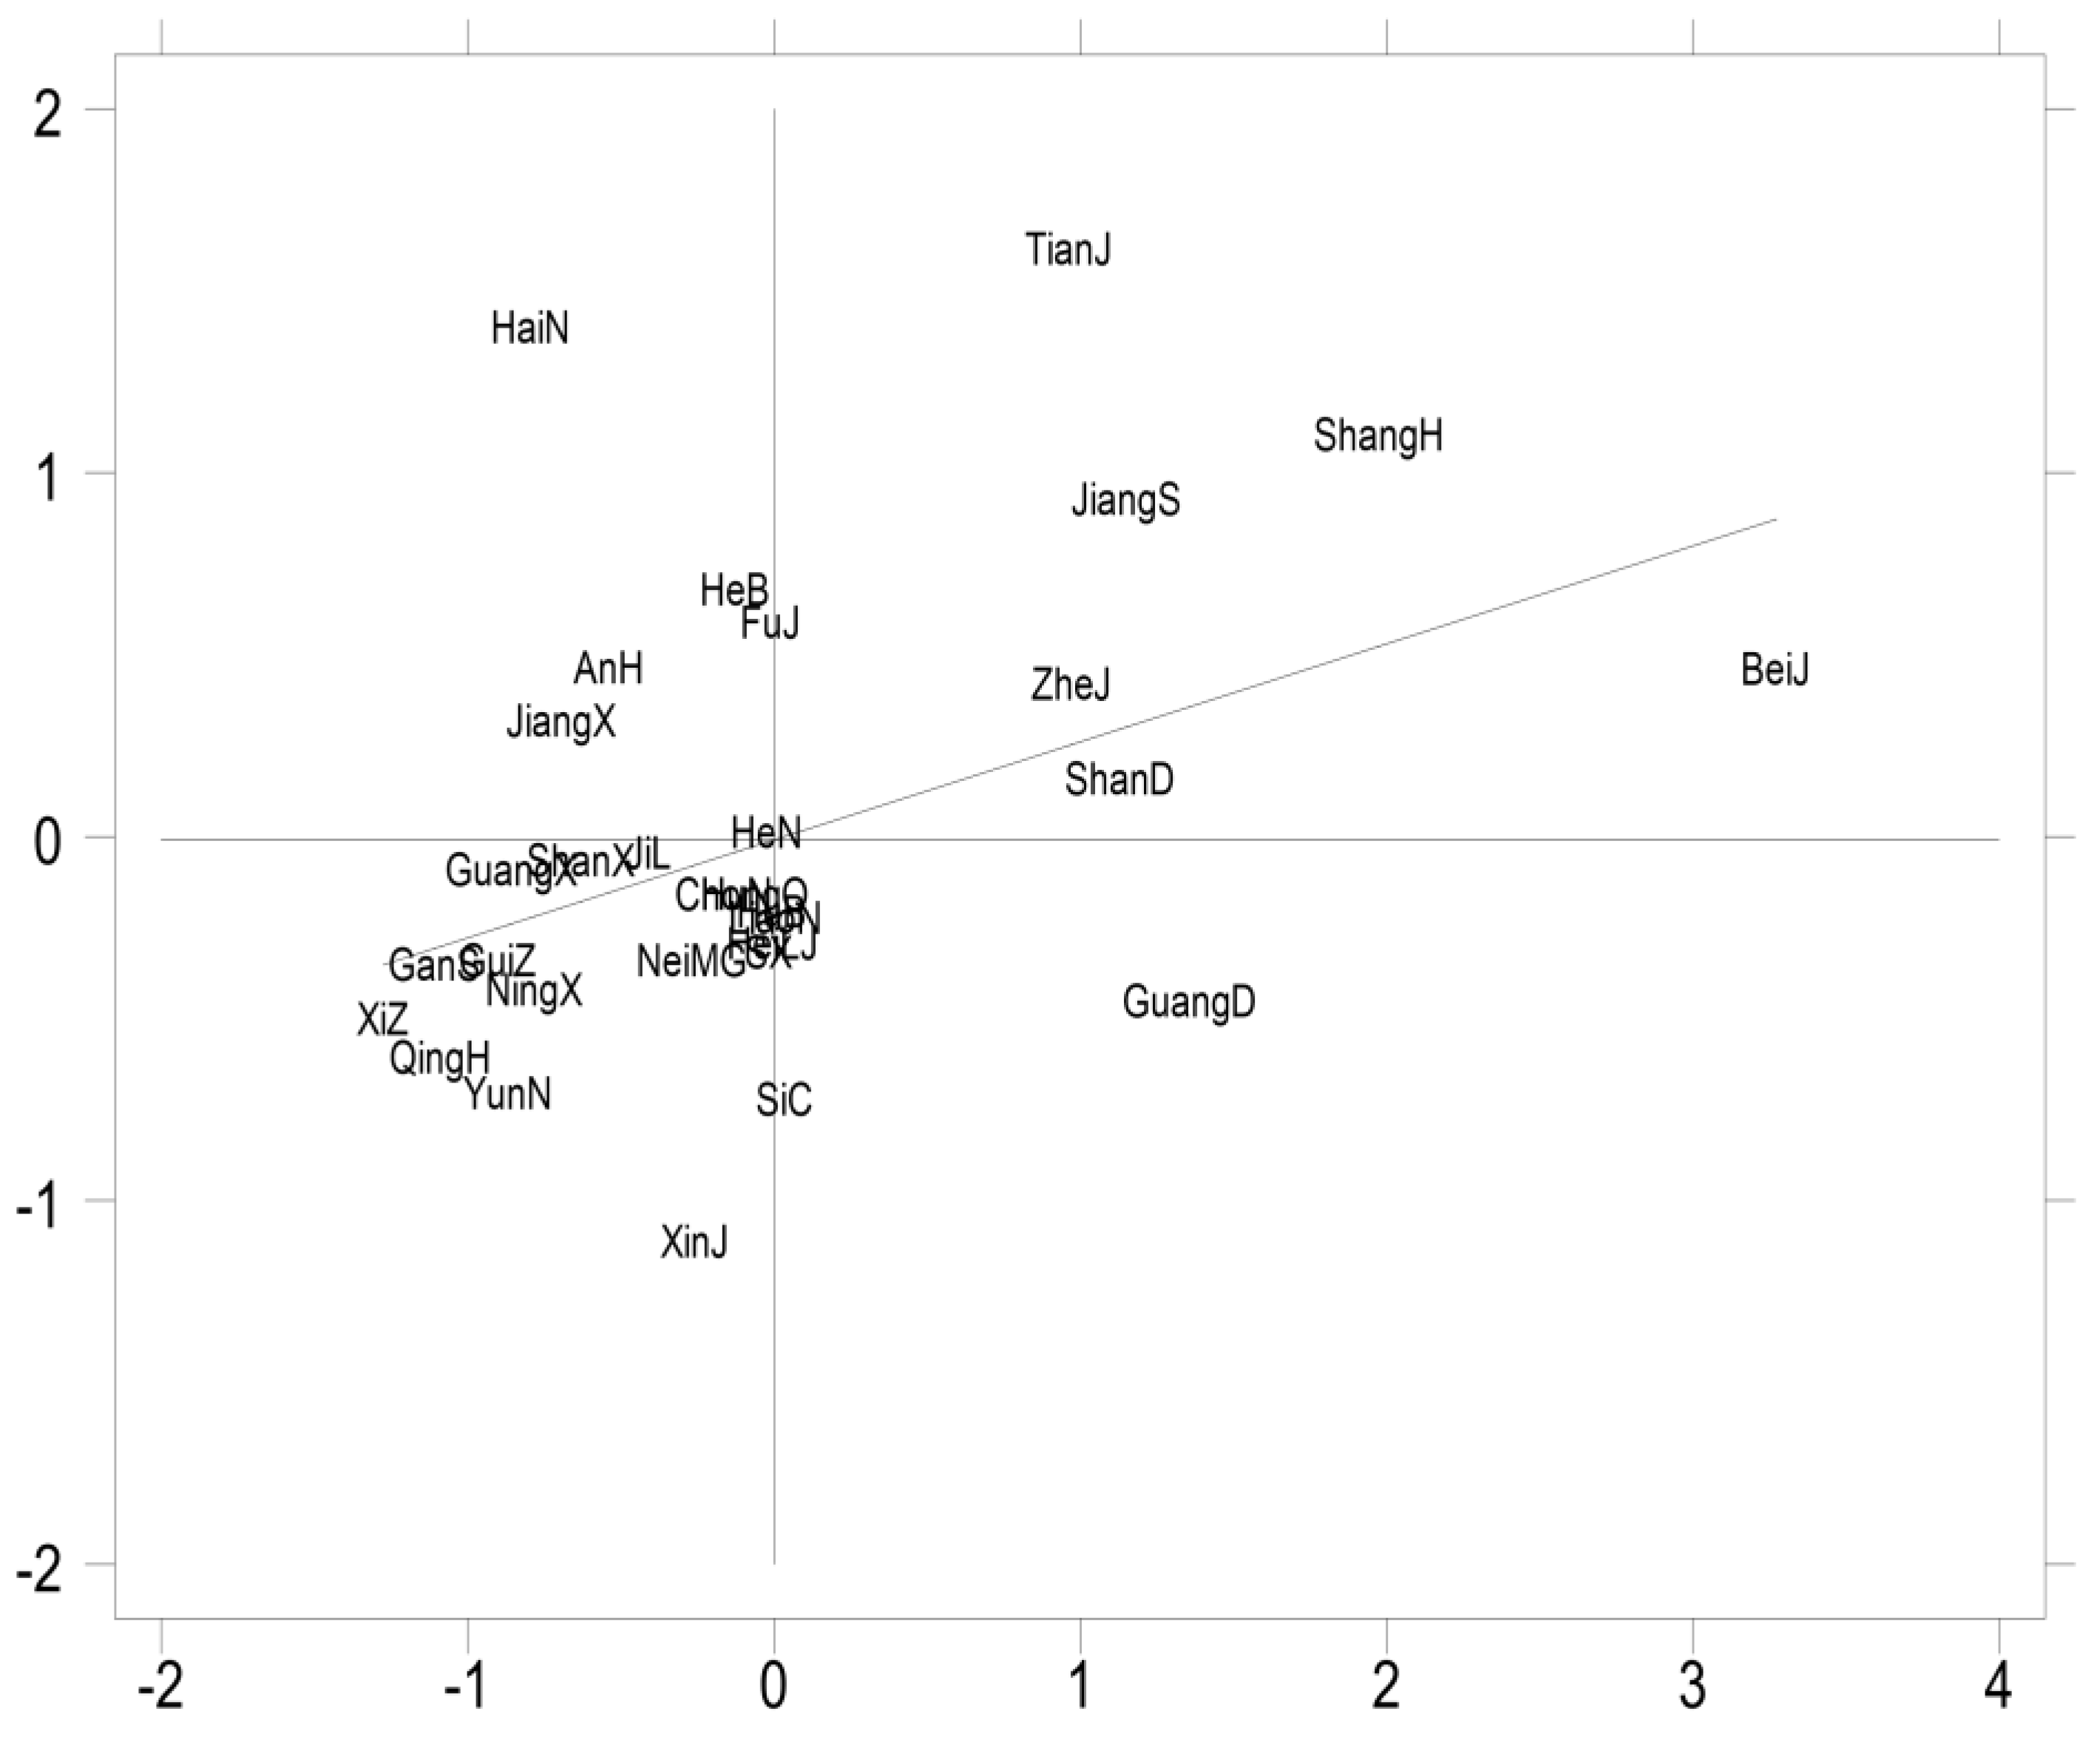
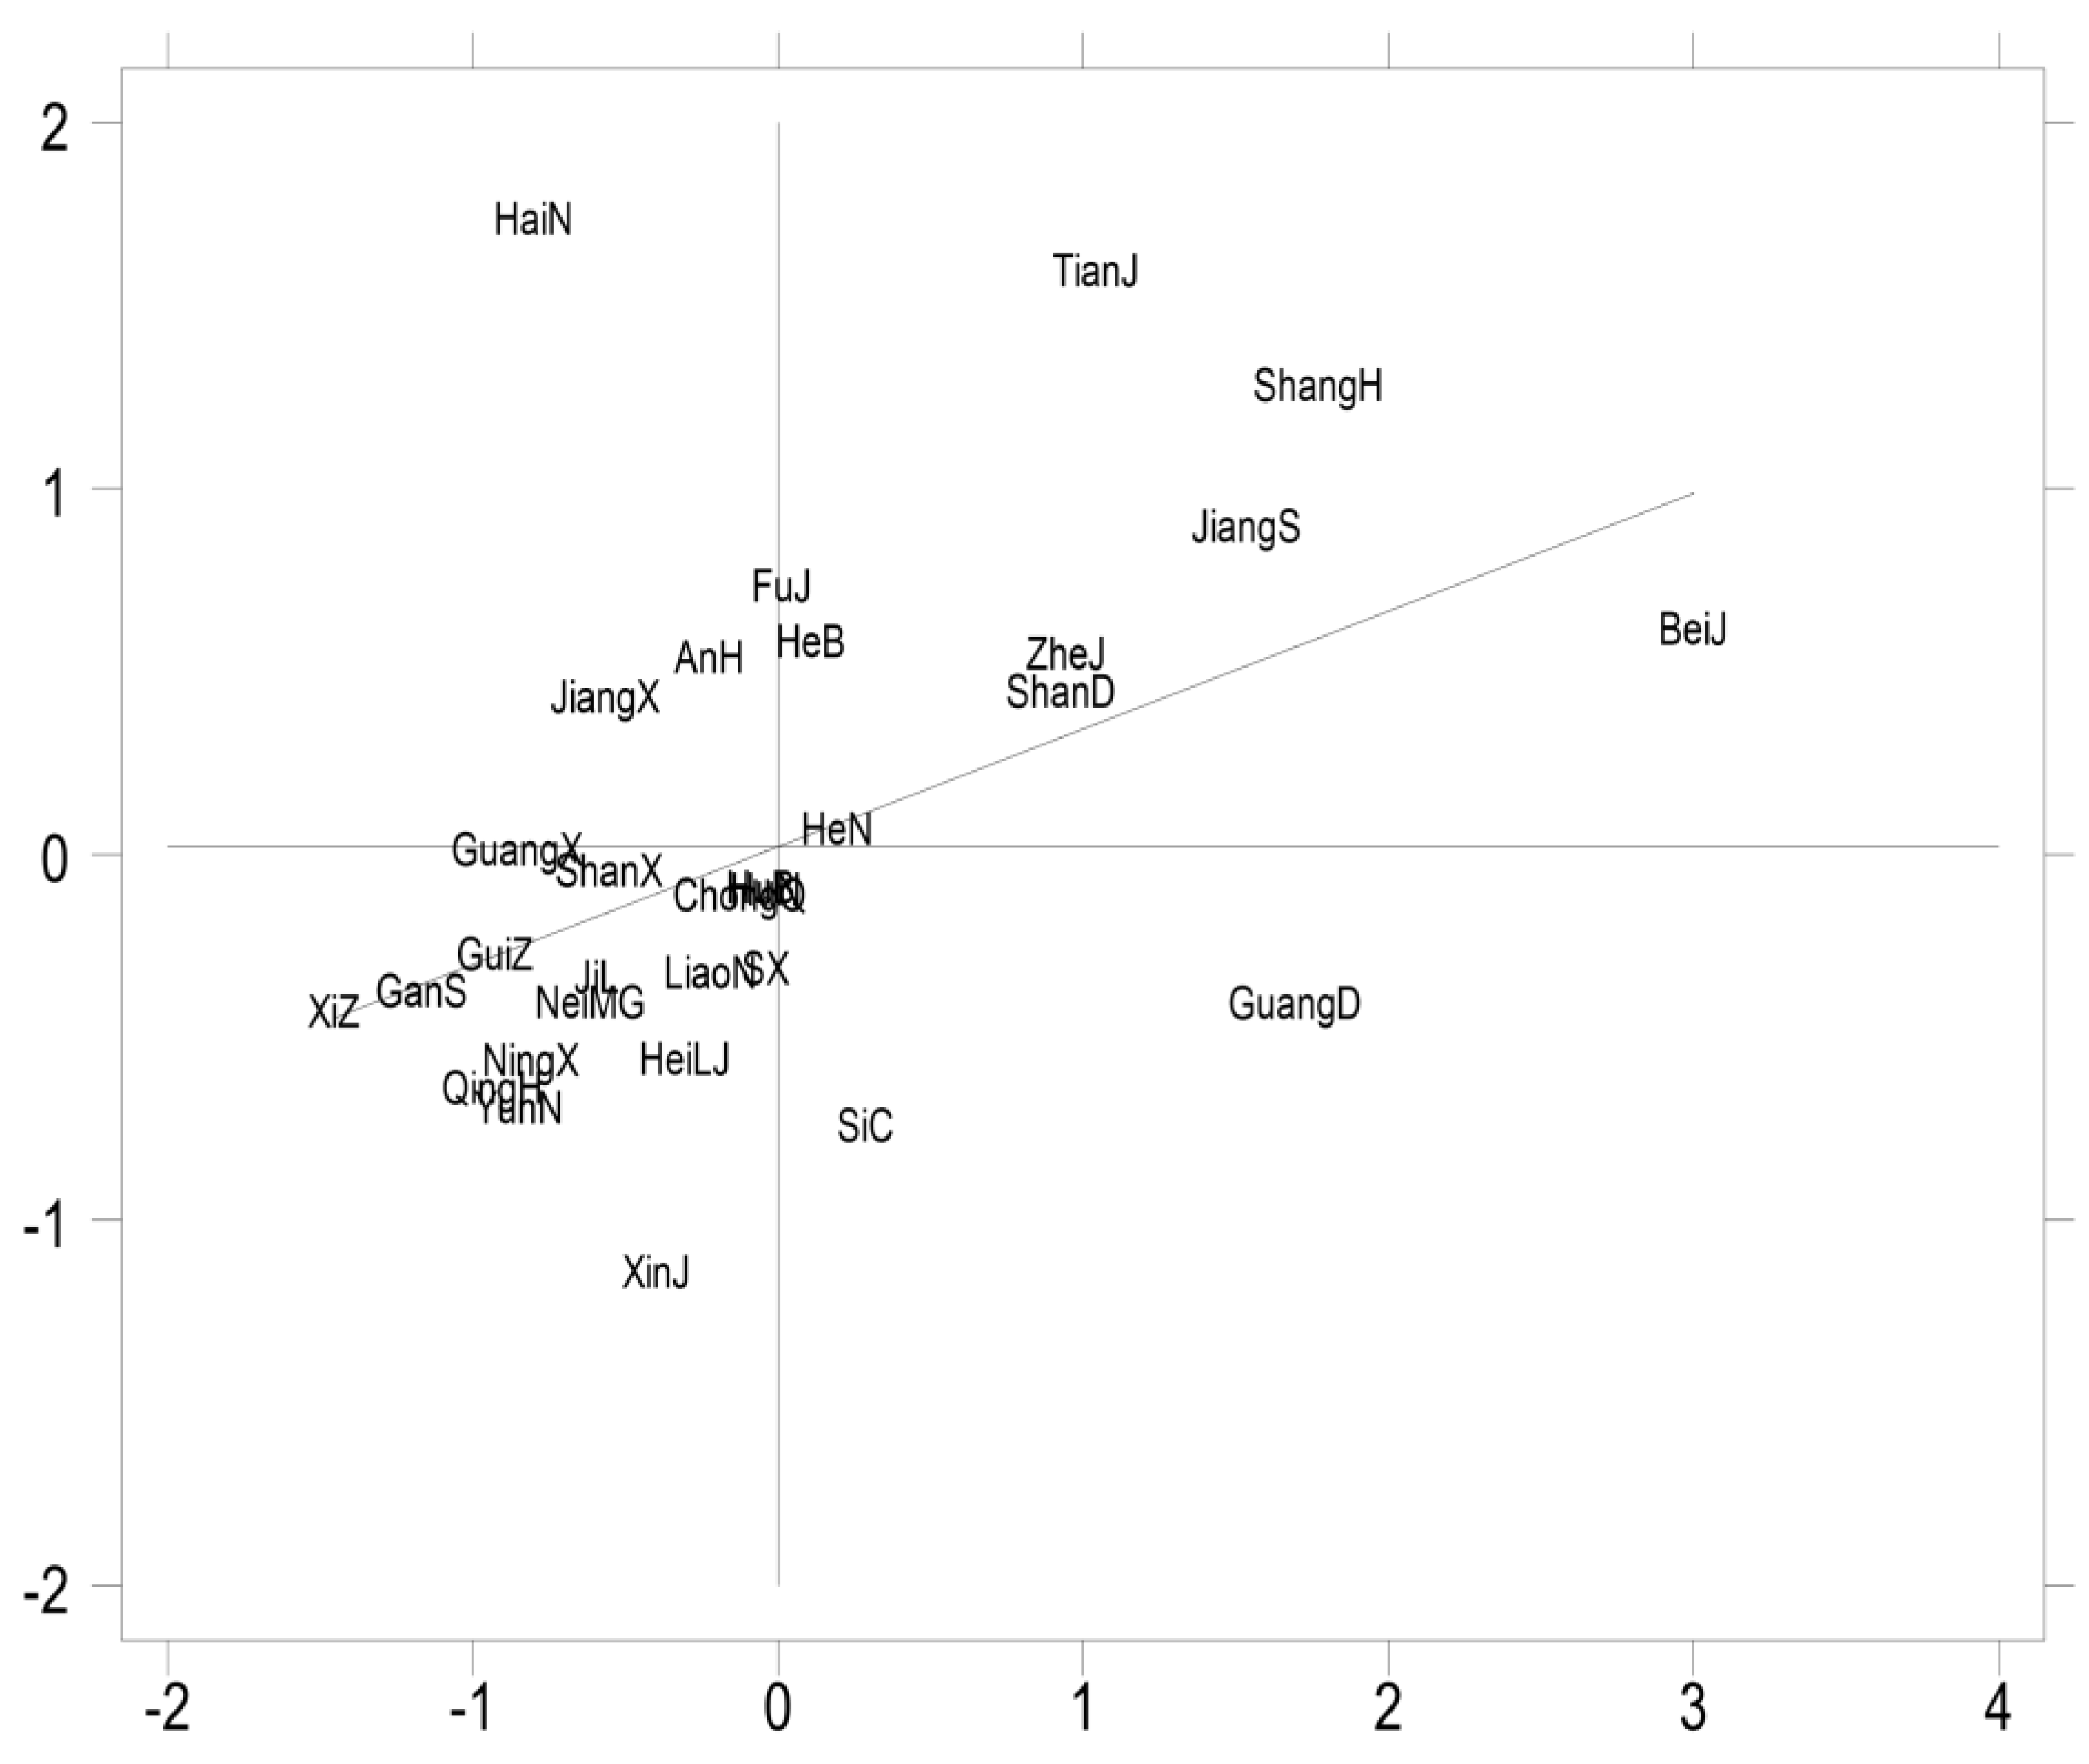
To further explore the spatial agglomeration characteristics and geographical distribution of high-quality employment in China’s environmental protection industry, this study quantitatively analyzes the local Moran’s I index for the selected time periods. Due to space limitations, this paper presents the results of the local Moran’s I analysis for the years 2011, 2017, 2020, and 2022, as shown in
Figure 3,
Figure 4,
Figure 5 and
Figure 6.
As a tool for revealing the autocorrelation of spatial data, the local Moran’s I scatterplot illustrates the relationship between spatial deviation and spatial lag. In this scatterplot, the X-axis represents the spatial deviation, indicating the degree to which the observed value deviates from its spatial average. A high value on the X-axis suggests that the level of high-quality employment in the region exceeds the national average. The Y-axis represents the spatial lag, which reflects the relative level of high-quality employment in the region and its neighboring regions. A high value on the Y-axis implies that both the region and its neighboring regions exhibit a higher level of high-quality employment. The local Moran scatterplot divides regions with significant spatial autocorrelation into four quadrants to identify different patterns of spatial correlation: Quadrant 1 (H–H): High–High Agglomeration refers to regions with high-quality employment, as well as their neighbors. Quadrant 2 (L–H): Low–High Agglomeration indicates regions with low-quality employment surrounded by neighbors with high-quality employment. Quadrant 3 (L–L): Low–Low Agglomeration signifies areas with generally low-quality employment, including neighboring regions. Quadrant 4 (H–L): High–Low Agglomeration describes regions with high-quality employment, contrasted by lower levels in neighboring areas.
The provinces and urban areas categorized into the four spatial aggregation types for the years 2011, 2017, 2020, and 2022 have been summarized, with the results presented in
Table 4.
From the data presented in
Figure 3 and
Table 4, it is evident that China’s spatial agglomeration pattern of the environmental protection industry underwent significant changes from 2011 to 2022. The number of regions classified as H–H (High–High) has steadily increased, while the number of regions classified as L–L (Low–Low) has correspondingly decreased. This shift signifies a notable improvement in the level of high-quality employment within the environmental protection industry and reflects the rapid development of the sector in recent years. Moreover, the data also indicate a significant spatial dependence in the high-quality employment level of China’s environmental protection industry, with a pronounced local spatial autocorrelation in its distribution. Specifically, the regional distribution characteristics are primarily manifested in the dominance of H–H (High–High) and L–L (Low–Low) clusters. The H–H agglomeration areas are concentrated in economically developed regions such as the Beijing-Tianjin-Hebei region (Beijing, Tianjin, and Hebei) and the Yangtze River Delta (Shanghai, Jiangsu, and Zhejiang). In contrast, L–L agglomeration areas are mainly found in the five northwestern provinces and parts of the southwestern provinces.
The formation of this spatial differentiation pattern fundamentally stems from the deep divergence in factor allocation efficiency and institutional evolution paths across regions. In H–H agglomeration areas, competitive advantages manifest in three progressive layers: First, a high level of marketization and strong capital accumulation capabilities provide the material foundation for the development of the environmental protection industry. Second, innovation networks centered around universities and research institutes generate technology spillover effects, fostering a full-chain transformation system from basic research to pilot incubation and industrial application. This continuously drives the employment structure toward high-value-added segments. Third, institutional innovations such as carbon emission trading and green finance pilot programs not only directly create emerging professions like carbon asset management and environmental risk assessment but also guide production factors toward green sectors through price signals. In contrast, L–L agglomeration areas, mainly located in northwestern and parts of southwestern China, face multiple constraints. Despite their abundant ecological resources, weak environmental infrastructure and limited financing channels hinder the effective conversion of resource advantages into industrial competitiveness. Furthermore, the lock-in effect of traditional energy-dependent economic structures results in delays in local governments’ enforcement of environmental regulations and adoption of green technologies, leading to a vicious cycle of “low-end industrial lock-in—outflow of quality factors—stagnation in employment quality”. Additionally, compared to the developed eastern regions, the harsh natural environment of northwestern China not only raises operating costs for enterprises but also reduces its attractiveness to high-end talent, further exacerbating regional disparities in employment quality. These multiple constraints collectively trap L–L regions in a development dilemma regarding high-quality employment in the environmental protection industry.
The above analysis highlights the significant development imbalance in the employment quality of China’s environmental protection industry. To address these challenges, targeted strategies must be formulated and implemented to stimulate the growth of the environmental sector and create high-quality employment opportunities in underdeveloped regions. First, policy support should be strengthened to establish a tailored support system for L–L agglomeration areas. The government should introduce special financial subsidies and tax incentives to lower the entry barriers for enterprises in the environmental protection industry. Additionally, leading enterprises from developed eastern regions should be encouraged to set up branches or collaborative industrial parks in the western regions, leveraging industrial chain expansion to enhance local employment quality. Second, reinforcing research and development (R&D) systems and promoting collaboration between universities, research institutes, and industries should be prioritized to drive innovation in environmental technologies. Finally, optimizing interregional industrial coordination mechanisms is essential. The advanced experiences of H–H agglomeration areas should be disseminated to L–L regions, utilizing the technological, financial, and managerial expertise of H–H regions to facilitate industrial upgrading in L–L areas.
In conclusion, while the quality of employment in China’s environmental protection industry still has significant room for improvement, the increasing number of H–H type regions and the decreasing number of L–L type regions indicate a positive trend in the sector’s development. Looking ahead, with the continued strengthening of national support for the environmental protection industry, along with advancements in scientific and technological innovation and industrial restructuring, it is anticipated that more regions will join the ranks of high-quality employment. This will contribute to the promotion of a green, circular, and low-carbon economic model, further supporting sustainable growth in China’s environmental protection industry.
3.3. Analysis of Factors Affecting the Level of High-Quality Employment in the Environmental Protection Industry
This study adopts the Spatial Durbin Model (SDM) to explore the factors influencing the high-quality employment in the environmental protection industry across 31 provincial-level administrative regions of China. The regression analysis results are presented in
Table 5. The findings show that the spatial autocorrelation coefficient (
ρ) is −0.1538, which is significant at the 10% level. This result highlights the significant spatial correlation between provinces in terms of high-quality employment. Furthermore, the study primarily selects seven indicators to examine their impact on high-quality employment in the environmental protection industry: economic development level (GDP), fixed asset investment (Inv), urbanization level (Urb), government expenditure on social security and employment (Gov), R&D investment (Res), environmental protection industry employment (Peo), and the share of tertiary industry output (Str).
Economic development level (GDP) reflects regional economic vitality and serves as a fundamental economic factor supporting the improvement of employment quality in the environmental protection industry. Fixed asset investment (Inv), as a core indicator of capital accumulation, directly affects the construction of environmental protection infrastructure and the industry’s capacity to bear growth. Urbanization level (Urb), through population agglomeration effects and technological diffusion channels, drives demand for environmental services and upgrades the employment structure. Government expenditure on social security and employment (Gov) reflects policy intervention efforts and helps address the shortage of talent in the environmental protection industry. R&D investment (Res) is a key indicator of innovation-driven capacity and provides impetus for technological innovation in environmental protection and the creation of high-end jobs. Environmental protection industry employment (Peo) itself has a scale economy effect; its growth can create a positive cycle of improved employment quality through industrial chain collaboration. Share of tertiary industry output (Str) represents the degree of economic structural transformation, and the deep integration of the tertiary industry with the environmental protection industry can generate high-value-added employment opportunities. These indicators encompass both the economic fundamentals and industrial structural characteristics, as well as policy regulation and innovation-driven factors, and they can systematically reveal the multidimensional mechanism of environmental protection employment quality within the spatial correlation network. By discussing these influencing factors, this study provides a theoretical basis for understanding the regional collaborative development path of environmental protection industry employment quality and lays the foundation for analyzing mechanisms to optimize environmental governance and employment policy coordination across provinces. To investigate whether these influencing factors generate significant spatial spillover effects within the province and neighboring regions, the study employs partial differential equation techniques to analyze the estimation results of the Spatial Durbin Model. The specific data analysis results are shown in
Table 6.
The data analysis results in
Table 6 show that economic development (GDP) has a significantly positive direct and spatial spillover effect on high-quality employment in the environmental protection industry. This indicates that as per capita gross domestic product (GDP) increases, regional economies strengthen, leading to greater demand for environmental technologies and services. The presence of spatial spillover effects further suggests that regions with higher per capita GDP positively influence the environmental protection industry employment in surrounding areas. Typically, these economically developed regions are more active in environmental policy-making, financial investment, and international cooperation. Through interregional policy coordination and economic cooperation, these factors can stimulate the growth of the environmental protection industry in neighboring areas and improve the level of high-quality employment in those regions.
The increase in urbanization level (Urb) does not have a significant direct impact on high-quality employment in the environmental protection industry and is accompanied by a significant negative spatial spillover effect. This suggests that the impact of urbanization on employment is constrained by factors such as industrial structure, labor market flexibility, and the demand for environmental services. If urban areas do not effectively plan for environmental protection measures or if the growth in environmental demand lags behind, the employment level in the environmental protection industry may not rise with urbanization. The negative spatial spillover effect reflects regional imbalances, where urbanization may lead to excessive concentration of resources, intensifying environmental pressure and reducing employment opportunities in surrounding areas. Furthermore, rapid urbanization may increase the demand for low-cost labor, which can suppress the demand for highly skilled environmental protection professionals.
Fixed asset investment (Inv) has a significantly positive direct impact on high-quality employment in the environmental protection industry. An increase in fixed asset investment typically indicates the upgrading and expansion of environmental technologies and facilities, directly driving the demand for specialized talent and improving both the quantity and quality of employment opportunities. However, fixed asset investment does not exhibit significant spatial spillover effects, suggesting that the benefits of investment are primarily confined to the region where the investment occurs, with limited diffusion to surrounding areas. Moreover, regional differences in economic development levels and the industrial structure of the environmental protection industry may hinder the positive impact of investment from directly transferring from one region to another, further limiting the spillover effects.
Government expenditure on social security and employment (Gov) has a positive direct impact on high-quality employment in the environmental protection industry. Government investments provide financial support and incentives, such as vocational training, employment services, and innovation projects, enhancing the attractiveness of employment in this industry. However, the lack of significant spatial spillover effects may stem from the geographical targeting of these expenditures, which are often concentrated in specific regions. Regional disparities and differences in policy implementation efficiency may also weaken the spillover effects. Therefore, while promoting high-quality employment within a region, government expenditure should also strengthen its impact on surrounding areas.
R&D investment (Res) does not have a significant direct impact on high-quality employment in the local environmental protection industry, as its results tend to have a lag and R&D activities themselves do not directly create immediate employment. However, its spatial spillover effect is significantly positive, indicating that regional innovation can drive the upgrading of the environmental protection industry and improvement of employment quality in surrounding areas through knowledge sharing, industrial chain collaboration, and technological diffusion. Additionally, the innovation ecosystem and technical talent reserves formed by R&D activities further enhance the innovation radiation effect through interregional mobility.
The increase in environmental protection industry employment (Peo) significantly improves the local high-quality employment level, suggesting that the expansion of the industry directly drives growth in employment demand. However, its spatial spillover effect is not significant, which may be due to the distinct regional characteristics of the environmental protection industry. The segmentation of regional markets, industry barriers, and labor mobility restrictions may weaken the cross-regional collaborative effects.
The share of tertiary industry output (Str) does not have a significant direct impact on high-quality employment in the environmental protection industry. Although the growth of the tertiary industry can drive the demand for environmental services, this demand takes time to translate into changes in the employment market. However, the spatial spillover effect is significantly positive, indicating that the growth of the tertiary industry has a positive chain effect between regions. Specifically, the expansion of the tertiary sector is often accompanied by urbanization and increased environmental awareness among residents, both of which raise the demand for environmental technologies and services, generating positive externalities in neighboring regions.
3.4. Robustness Test
A single spatial geographic nesting matrix may not be able to fully and robustly reflect the spatial characteristics and influencing factors of high-quality employment in the environmental protection industry. The emphasis of different spatial weight matrices is different, and a single matrix may miss some important information, leading to bias in the research results. Therefore, in order to ensure the reliability and robustness of the research results, in addition to the above nested economic geography matrix based on the calculation of local latitude and longitude distance, the economic geography weight matrix is also used for analysis. The weight matrix is measured based on the per capita GDP interpolation between the two places. The specific calculation formula is
, where
Eij represents the economic and geographical weight between regions
i and
j, and
GDPi and
GDPj represent the per capita
GDP of regions
i and
j. The specific analysis results are shown in
Table 7:
The regression results in
Table 7 are highly similar to those in
Table 5, with no significant differences in the significance of the main effect coefficients and spatial weight coefficients. Most critically, the spatial autocorrelation coefficient
ρ remains significant at the 10% level. This indicates that even after replacing the spatial weight matrix, the research results do not exhibit substantial fluctuations. This phenomenon strongly validates the robustness of the findings, demonstrating that the study can consistently and reliably reflect the impact of various factors on the high-quality employment level in the environmental protection industry under different spatial weight settings, thereby enhancing the credibility of the research conclusions.
4. Conclusions and Policy Recommendations
This study develops an evaluation framework for high-quality employment in China’s environmental protection industry, employing the entropy method to assess key dimensions such as the employment environment, remuneration, security, and skill levels. The findings reveal a steady increase in high-quality employment within the sector over the past decade, especially since the implementation of the national “Dual-Carbon” goal, which has significantly bolstered employment in this field. However, regional disparities in employment quality remain prominent, with the economically advanced eastern coastal regions consistently outperforming the western regions in terms of employment levels. This gap is particularly evident within the current development framework. Furthermore, this study conducts an in-depth analysis of the spatial correlation of high-quality employment levels and their determinants using the Moran index and spatial panel models. The results show positive spatial autocorrelation in the distribution of high-quality employment across provinces, indicating that, geographically proximate provinces tend to exhibit similar levels of high-quality employment. Additionally, key factors such as economic development, fixed asset investment, government support, and R&D investment are closely linked to employment quality in the environmental protection industry. The increasing levels of urbanization and the growing importance of the tertiary sector have created new opportunities and growth areas for employment in the environmental sector. Spatial autocorrelation analysis also highlights significant agglomeration patterns in high-quality employment, underscoring the role of geographical proximity in shaping employment outcomes. Based on the above findings, this study proposes the following policy recommendations from the dual perspectives of regional coordination mechanism construction and employment quality improvement path optimization to promote the comprehensive development of high-quality employment in the environmental protection industry:
First, establish a cross-regional collaborative innovation and industrial chain linkage mechanism to promote balanced regional development. The government should carefully design and implement targeted regional development policies based on local economic foundations, resource endowments, and environmental carrying capacities to optimize the geographical layout of the environmental protection industry. Given the significant spatial spillover effects of R&D investment (Res) and the tertiary industry (Str), it is recommended that interregional technology-sharing platforms and industrial collaboration networks be established. Efforts should focus on fostering an “R&D–transformation–application” linkage system between economically developed regions (high-GDP areas) and their neighboring areas. Through technology transfer centers and environmental industry alliances, innovation outcomes from developed regions can be strategically disseminated to less-developed areas. Meanwhile, leveraging the regional synergy of the tertiary industry, deeper integration between the service sector and the environmental protection industry should be encouraged. For instance, cross-provincial cooperation projects in environmental consulting and green finance can be established, using market demand in developed regions to drive the upgrading of environmental service supply capacities in surrounding areas.
Second, implement differentiated policies and resource compensation mechanisms to narrow regional development gaps. In response to the negative spillover effects of urbanization (Urb) and the insufficient spillover of government spending (Gov), regional policy design needs to be optimized. On the one hand, the urbanization process should incorporate “ecology-employment” coordinated planning, requiring highly urbanized areas to support surrounding regions through ecological compensation mechanisms. For example, directing a portion of environmental investments toward neighboring areas for ecological restoration projects can create cross-regional employment opportunities. On the other hand, the structure of government expenditures should be adjusted to establish a dedicated interregional environmental employment fund. This fund should focus on supporting vocational training and infrastructure connectivity in underdeveloped regions. A “paired assistance” model could be implemented, where developed regions allocate part of their social security expenditures to support joint environmental talent training programs in neighboring areas. Additionally, tax incentives should be introduced to encourage enterprises to establish cross-regional operations, breaking down market segmentation in the environmental industry (Peo). By fostering an industrial division of labor—where core cities lead in technological innovation while surrounding areas provide supporting services—regional complementarities and shared benefits can be realized, systematically reducing development disparities.
Third, the employment environment and labor protection in the environmental protection industry should be improved. To attract and retain talent, it is essential to create a safe, healthy, and equitable working environment. The government should revise and strengthen labor laws and regulations, reinforcing occupational health standards to ensure that the rights and well-being of environmental protection employees are fully safeguarded. Concurrently, enterprises should be encouraged to establish competitive remuneration packages, offer attractive salaries, and provide clear opportunities for career advancement. By doing so, companies can enhance employee satisfaction and foster loyalty to the organization, which will, in turn, contribute to a stable and motivated workforce.
Fourth, the marketization and internationalization of the environmental protection industry should be promoted. Efforts should focus on deepening market-oriented reforms within the sector, removing industry barriers, and encouraging increased participation from social capital. Additionally, China should actively engage in international environmental cooperation projects, introduce advanced global environmental protection concepts and technologies, and expand its presence in the global market. These initiatives will help enhance the international competitiveness and influence of China’s environmental protection industry, positioning it as a global leader in sustainable development.
5. Limitations and Future Research Directions
Although this study evaluates and analyzes the current state of high-quality employment in China’s environmental protection industry, it still has several limitations. First, the study relies solely on macro-level data to assess employment quality across different regions but lacks in-depth research at the micro level, particularly concerning enterprises and individual employment experiences. This omission may weaken the multidimensional nature of employment quality evaluation. Second, while the model incorporates multiple influencing factors, limitations in data availability and research methods may have led to the omission of key variables, such as corporate social responsibility within the industry and the specific employment demands of emerging subsectors in the environmental protection industry. These omissions could affect the comprehensiveness and accuracy of the research findings. Third, the study primarily focuses on the environmental protection industry in China’s 31 provincial-level administrative regions (provinces, autonomous regions, and municipalities) without analyzing differences across cities of varying sizes or between urban and rural areas. The development patterns and employment quality of the environmental protection industry may differ significantly across cities of different scales. Likewise, variations in industry distribution, employment opportunities, and job quality between urban and rural areas may exist. Neglecting these differences could limit the depth and scope of the research. To address these limitations, future research can be improved in the following ways. First, incorporating enterprise-level data and individual survey data would allow for a deeper analysis of micro-level factors affecting employment quality in the environmental protection industry, thereby enhancing the study’s comprehensiveness and practical relevance. Second, expanding the set of variables to include key factors such as corporate social responsibility, green technological innovation, and vocational training mechanisms would strengthen the explanatory power of the model. Additionally, employing more refined spatial econometric methods, such as spatial panel data models or causal inference approaches, could improve the robustness of the research conclusions. Finally, broadening the research scope to compare employment quality in the environmental protection industry across cities of different sizes and between urban and rural areas would help uncover employment characteristics under different regional development models. This, in turn, would provide more targeted recommendations for optimizing environmental protection industry policies.


