1. Introduction
With the advancement of photovoltaic technology, in addition to the need to reduce the use of fossil fuels, which cause great pollution and have a finite useful life, the opportunity arises to use solar energy to generate electricity.
The Intergovernmental Panel on Climate Change (IPCC) published in the Special Report on Renewable Energy Sources and Mitigation of Climate Change different branches of the use of converting solar energy into another type of energy capable of supplying different technologies and serving a variety of services. The IPCC then cites the following as different applications: passive solar (bioclimatic architecture), active solar (solar heating and cooling), photovoltaic solar (electricity production), the generation of electricity (thermal solar concentrators for high temperatures) and the process inspired by photosynthesis of the reactor fed by carbon dioxide (CO2), water and a metal or metal oxide, which, when exposed to solar radiation, produces hydrogen, oxygen and carbon monoxide.
This study aims to evaluate the performance of photovoltaic systems for electricity generation, specifically to design a photovoltaic system for the operation of an electric car that is to be used either four times a week (with one day of use and one day of battery charging) or seven times a week. In addition, an economic and ecological analysis will be carried out to assess the feasibility of the system.
In the use of solar energy in the form of photovoltaic conversion, both direct and indirect solar radiation are used, but only the former has a significant conversion effect.
Solar cells made of silicon have a high energy conversion efficiency of about 25–26% [
1]. In 2021, with the incentive to use renewable energy, nations reached the mark of 168 GW of installed solar energy capacity [
2].
Figure 1 shows the evolution of photovoltaic installations globally; the main consumers are developed countries due to strong incentives for installing photovoltaic systems. Such exponential growth of these installations may suggest greater possibilities for the advancement of the electric vehicle market.
In 2021, China set a record for the installation of photovoltaic systems of 54.9 GW, making it the world leader in the use of solar energy. It was followed by the United States with 27.3 GW and India with 14.2 GW [
2].
Figure 2 is based on the EPIA report “Unlocking the sunbelt Potential of Photovoltaics” [
2] and shows a different view on solar energy investment. Despite the strong dominance of China, USA and India in installed power capacity in the territory, the installed generation capacity of the photovoltaic system per inhabitant is led by Australia, Germany and Japan [
2].
Australia has an impressive value in terms of installation, with more than 1 kW per inhabitant, and the world reference value is 119 W/capita installed worldwide [
2].
2. Photovoltaic System
Considering the existing forms of electrical generation, solar energy is a source that is undergoing great development; with the advancement of technology and the reduction in the cost of photovoltaic cells, this option for generating electrical energy has become economically viable, environmentally accepted, of high reliability and low maintenance. Its biggest disadvantage is still the high initial implementation costs, but these are offset by the low maintenance and operating costs [
3,
4].
Figure 3 shows the reduction in the cost of solar modules; their use is becoming more and more profitable over the years with the advancement and dissemination of technology.
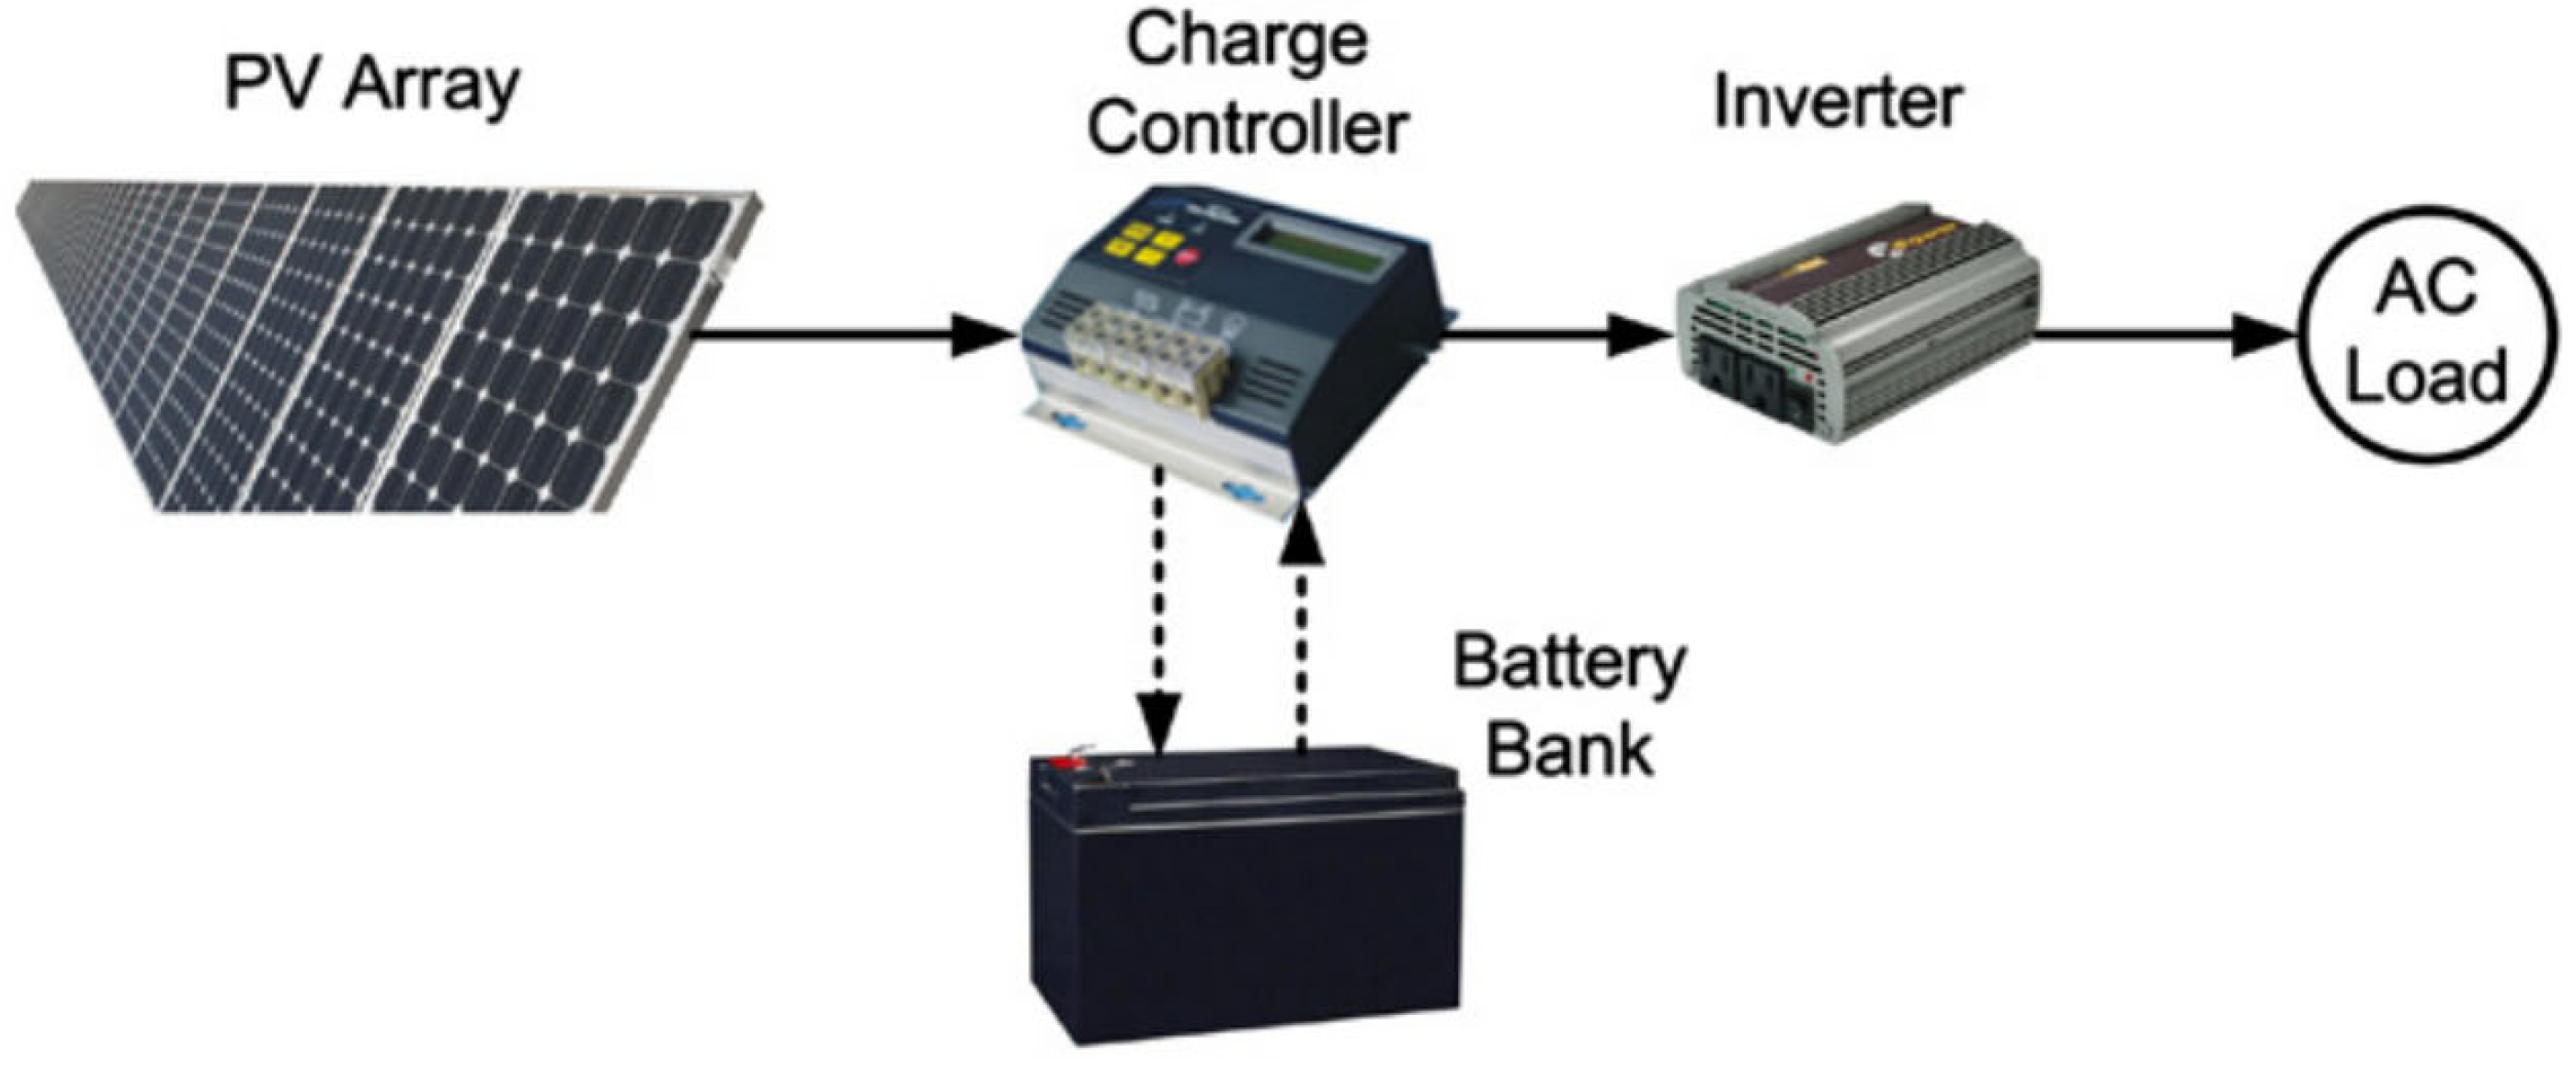
Photovoltaic energy comes from the sun and is classified as renewable. Its transformation takes place through the conversion of solar energy into electrical energy. The basic photovoltaic solar energy system consists of photovoltaic modules (panels), a charge controller, an inverter and a battery, which is an item that is considered optional [
5,
6].
The main components of a solar energy system include photovoltaic modules, also known as solar panels, which consist of several photovoltaic cells that generate electricity from sunlight. When sunlight hits these cells, it excites electrons and thus generates an electric current. Solar modules do not have moving parts, which prevents wear or failure; they do not use fuel for operation, they do not vibrate, they are silent and they do not harm the environment when they are used correctly and with proper maintenance [
7,
8].
The charge controller is responsible for regulating and managing the energy flow from the photovoltaic generators to the batteries, as well as protecting them from deep discharge resulting from a long period without generation, increasing their useful life and making the system more efficient [
9].
The inverter is a device whose function is to convert the energy generated by photovoltaic panels from direct voltage (DC) to an alternating voltage (AC), and also to equalize the voltage and frequency levels of the network, generating sinusoidal waveforms and harmonic and sinusoidal bass [
10].
The battery is an electric accumulator that in an off-grid system ensures the supply of energy when there is no sun. It is responsible for all the energy storage produced by the solar panels, and it is what determine the autonomy of the system. In an on-grid system they are expendable [
11].
Figure 4 shows a basic configuration of an off-grid isolated photovoltaic system (with a battery) for electricity generation.
The power generated by the photovoltaic modules is propagated to the load controller, which regulates the current flow. If there is a need for a load, the controller sends this current flow directly to the inverter, which transforms the direct current into AC current and then supplies the system as needed; if not, this current is directed to the battery that stores this energy until required by the project load [
13].
3. Electric Vehicle
Electric vehicles are powered by electric motors that are either centrally located or directly coupled to the wheels and provide propulsion. Their energy is stored in a battery bank, which supplies the electrical power required for operation. One of the biggest challenges for these vehicles is their limited autonomy, mainly due to the lack of space for larger battery banks and the technological limitations of energy storage [
14].
The development of electric vehicle design began in the late 19th and early 20th centuries; at this time, the world vehicle market was led by electric motors.
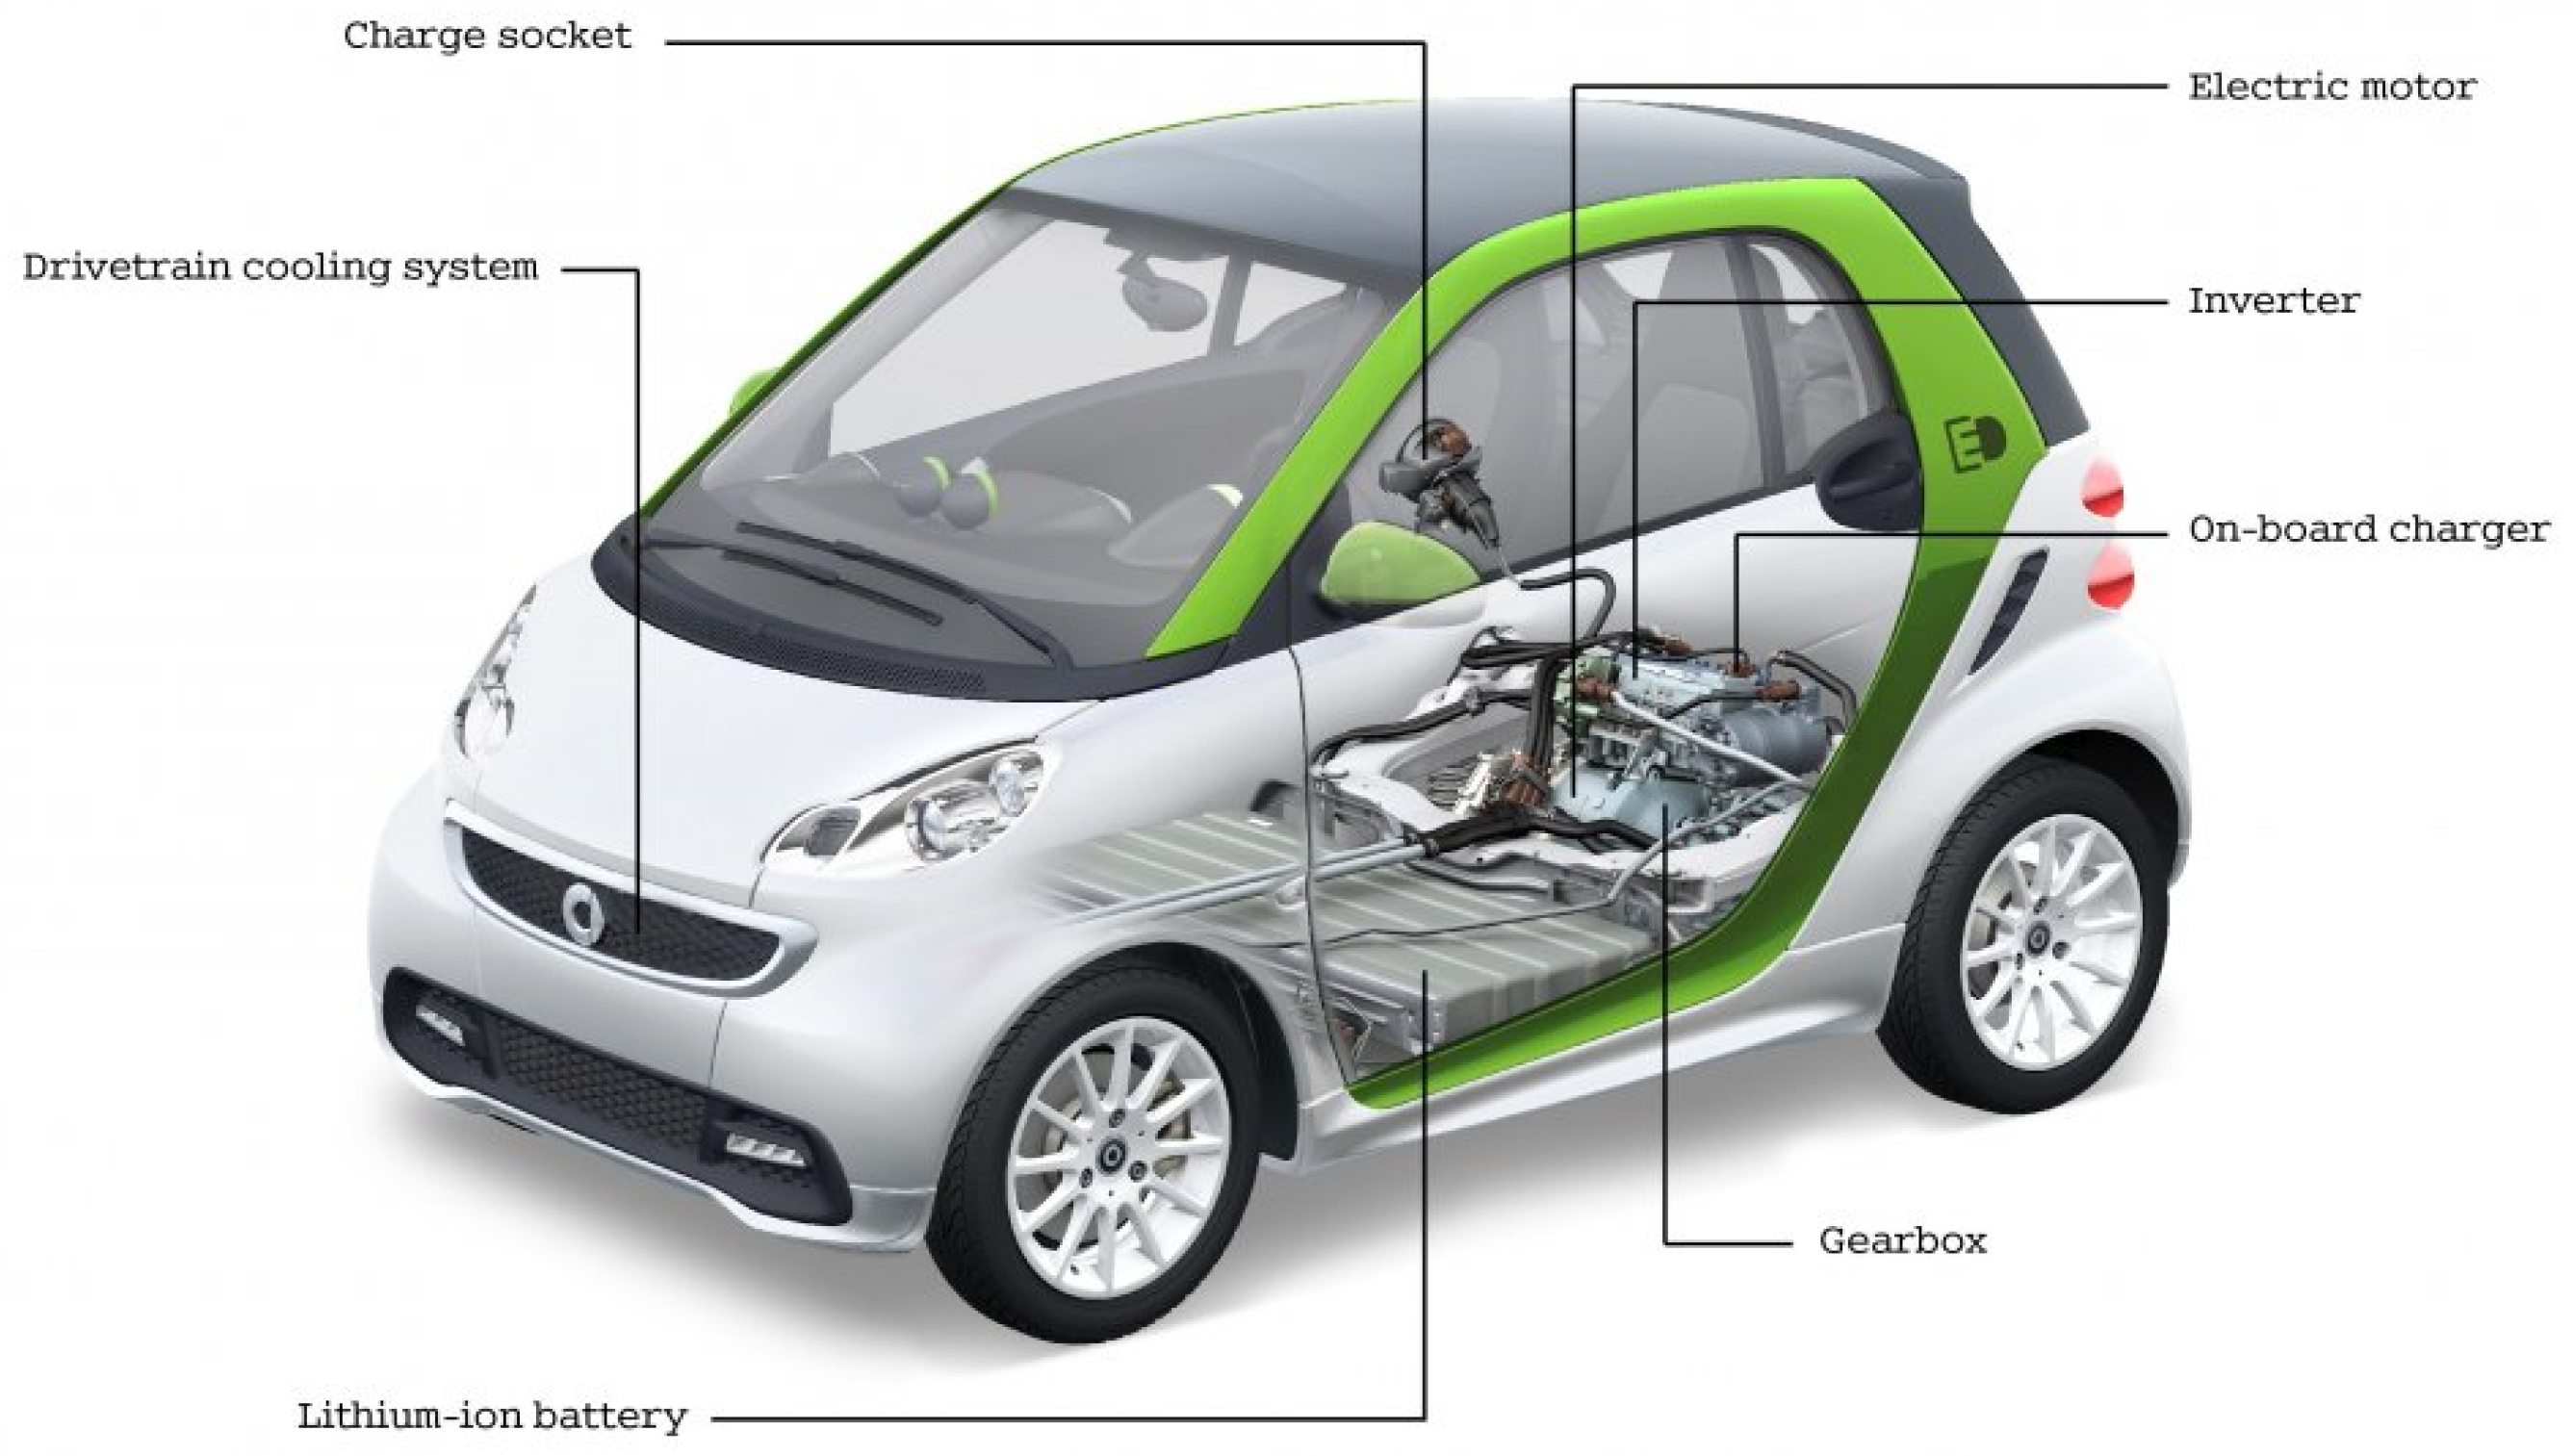
Electric vehicles utilize an electric motor in place of an internal combustion engine. These vehicles are powered by a substantial traction battery pack and require connection to a wall outlet or charging infrastructure, referred to as electric vehicle supply equipment, for recharging. As they operate solely on electricity, BEVs produce no tailpipe emissions and do not include conventional liquid fuel components, such as fuel pumps, fuel lines or fuel tanks. Key components of an electric vehicle are the battery (electric auxiliary), charge port, DC/DC converter, electric traction motor, onboard charger, power electronics controller, thermal system (cooling), traction battery pack and transmission (electric) [
15].
4. Problem Modeling
We calculate the sizing of a photovoltaic plant required to power the Daimler Smart Fortwo electric car for use four and seven days a week.
Figure 5 shows the schematic model of the electric vehicle under investigation.
4.1. Dimensioning of the Number of Solar Panels
The photovoltaic plant for power generation will be installed in Brazil, where the average is 6 h of peak daily solar irradiation (latitude: −23.5489; longitude: −46.6388; 23°32′56″ south; 46°38′20″ west).
The Smart Fortwo has a 55 kW electric motor that runs on 96 VDC and has a battery storage capacity of 17.6 kWh. It offers a daily range of 1.5 h or a distance of 109 km and reaches an average speed of 73 km/h, according to the manufacturer’s tests [
18].
The solar panels to be used in this study have a nominal power of 550 W, a maximum power voltage of 41.7 V, a maximum power current of 13.2 A, an open-circuit voltage of 49.6 V, a short-circuit current of 14 A and a module efficiency of 21.3%.
Equation (1) is used to calculate the average daily consumption of the electric vehicle.
where P represents the total system power, U is the system voltage and a current of 13.01 A is considered. SH denotes the sun hours, D represents the number of days, DU refers to the days of use and W corresponds to the week. The load capacity of each photovoltaic module is determined using Equation (2).
where LC stands for the load capacity of the individual photovoltaic modules, hi for the peak hours of solar radiation per day and Imax for the maximum current. The number of photovoltaic modules connected in parallel for the system is determined using Equation (3).
where NMP stands for the number of photovoltaic modules connected in parallel. The number of photovoltaic panels connected in series is determined using Equation (4).
NMS stands for the number of photovoltaic modules connected in series and U
mf for the VDC voltage of the individual photovoltaic modules. The total number of photovoltaic modules used in the system is determined using Equation (5).
TNM stands for the total number of photovoltaic modules used in the photovoltaic system. The short-circuit current of the solar module is determined using Equation (6).
Isc denotes the short-circuit current of the solar module, with a safety factor of 1.43 applied.
4.2. Battery Sizing
If the plant is of the off-grid type, that is, the photovoltaic system will not be connected to the grid, it will be necessary to dimension the battery bank. It will be available for charging at any time of the day, but it will store the energy needed to charge the electric vehicle only when there is sunlight, that is, when it is possible for the photovoltaic modules to transform the energy emitted by the sun into electrical energy.
For an independent battery bank, in addition to the cost of the battery itself, it would be necessary to include the infrastructure for storing the equipment, as it cannot be exposed to the elements. This value is not included in the calculations of this study, as the project already demonstrates infeasibility with the battery costs alone.
Another point to highlight is that this section refers to the calculations for an independent battery bank, intended for the direct charging of the electric vehicle’s batteries. These calculations are not required.
Deep-cycle batteries operate in a non-critical state, each with a capacity of 12 VDC and 220 Ah. The total load capacity of the battery bank powering the project is determined using Equation (7).
The total load capacity of the battery bank (TBC) is determined using a safety factor of 1.2 and a multiplication factor of 6.25, which accounts for the battery’s deep cycle in a non-critical application; these safety factors are used as engineering criteria and published by [
19]. The number of batteries connected in parallel is calculated using Equation (8).
where NBP represents the number of batteries connected in parallel, and CB is the charge capacity of each battery. The number of batteries connected in series is determined using Equation (9).
where NBS represents the number of batteries connected in series, and Ubat is the VDC voltage of each battery. The total number of batteries used in the photovoltaic plant, denoted as TNB, is determined using Equation (10).
4.3. Charge Controller Sizing
For dimensioning the charge controller, one with a maximum solar current of 80 A will be selected; its continuous power is obtained from Equation (11).
where CPC represents the continuous power of the controller, and Imc is the maximum solar current of the selected controller. The surge power of the controller is determined using Equation (12), where SPC is the continuous current of the controller, and CDC is the controller’s direct current.
The total number of controllers connected in parallel in the photovoltaic plant design is determined using Equation (13), where TNC represents the total number of controllers connected in parallel.
4.4. Inverter Sizing
The total AC power of the inverter used in the project is determined using Equation (14), where
represents the total AC power of the system.
The estimated surge power of the inverter is calculated using Equation (15).
4.5. Economic Analysis for the Photovoltaic Generation System
Economic viability seeks to translate the fact that the costs and efforts spent on its implementation and operation are advantageously offset by the revenues and benefits earned over a convenient period of time. For the case of the system as a source of electric generation harnessing the sun’s energy with the purpose of feeding electric vehicles, it is expected that the cost of energy is lower than using conventional electric energy, supplied by energy companies [
20].
In this article, the economic viability methodology used by [
20,
21] will be adopted and adapted for this study. It will cover the calculation of the production costs of the system, based on the cost of fuel to power the internal combustion vehicle and the cost of the photovoltaic system to supply the electric vehicle. The cost of maintaining and operating the systems will also be considered.
The values of the annual revenue referring to the implementation of photovoltaic systems will be analyzed in replacement of the energy supplied by the electric energy distribution companies.
The investments needed to make a photovoltaic plant viable are related to the acquisition of materials, the main components being the photovoltaic modules, frequency inverter, charge controller and battery, the latter being optional and being able to directly use the batteries of the electric vehicle. In addition to the materials, there is the cost of installing, operating and maintaining the plant operating with the photovoltaic system.
For this work, a photovoltaic system will be designed for Brazil, where, according to the Solarimetric Atlas of Brazil [
22], the daily average of sunlight is 6 h, considering the climatic intermittency throughout the year. This work proposes two situations, the first with the use of a battery bank, which would increase this average by 2 to 4 h, due to the accumulation of energy in it, and the second situation with the direct use of the car battery.
Table 1 shows the average costs for power generation at the plant.
Equation (16) presents the relation of the cost of electricity produced using a photovoltaic system.
where C
el is the cost of electricity produced (USD/kWh), I
SGF is the total investment required (USD), H is the number of hours of operation per year (h/year), C
op is the cost of operation (USD/kWh), C
man is the system maintenance cost (USD/kWh), f is the annuity factor (1/year) and E is the electricity generated (kW).
The annuity factor can be obtained using Equation (17) [
21].
where r the annual interest rate (%), and k is the principal amortization period or payback (years).
4.6. Environmental Analysis of the Comparison Between Systems
The methodology proposed by [
23] aims to calculate an ecological energy efficiency indicator, but [
24] proposes an adaptation through the use of an emission factor (EF) (kg(CO
2)
eq/kWh), and the constants c, K and n as can be seen in Equation (18).
The ecological efficiency (ε) has a dimensionless value that varies between 0 and 1, with 0 being the result that points to the most polluting generating systems and 1 to the least polluting generating systems.
According to the boundary conditions stipulated by [
25], the constants of Equation (18) can be defined, and thus we have Equation (19) as a function of the electrical efficiency of the system used.
where ε is the ecological efficiency (-), EF is the emission factor for the photovoltaic solar electric energy system of 0.0590 (kg(CO
2)
eq/kWh) [
25] and for the electric energy of the grid (considering the largest share being from hydroelectric plants) of 0.0817 (kg(CO
2)
eq/kWh) [
26], and the electrical efficiency (η) of the photovoltaic solar system is 21.4% [
27], and that of the electrical grid system is 80.0% [
28,
29].
5. Results
For sizing the photovoltaic plant, it is necessary to know the amount of daily solar radiation in the place of installation and the demand for electricity for the project. An overview of the SGF can be seen in
Table 2; Equations (1)–(15) were used for its composition.
The sizing of the plant was designed to power one electric car under the following conditions: daily use, that is, 7 days a week, and 4 days a week. According to the solar irradiation map of Brazil [
30], the average daily sunlight exposure is 6 h.
Table 2 presents the results for the different scenarios analyzed in this study.
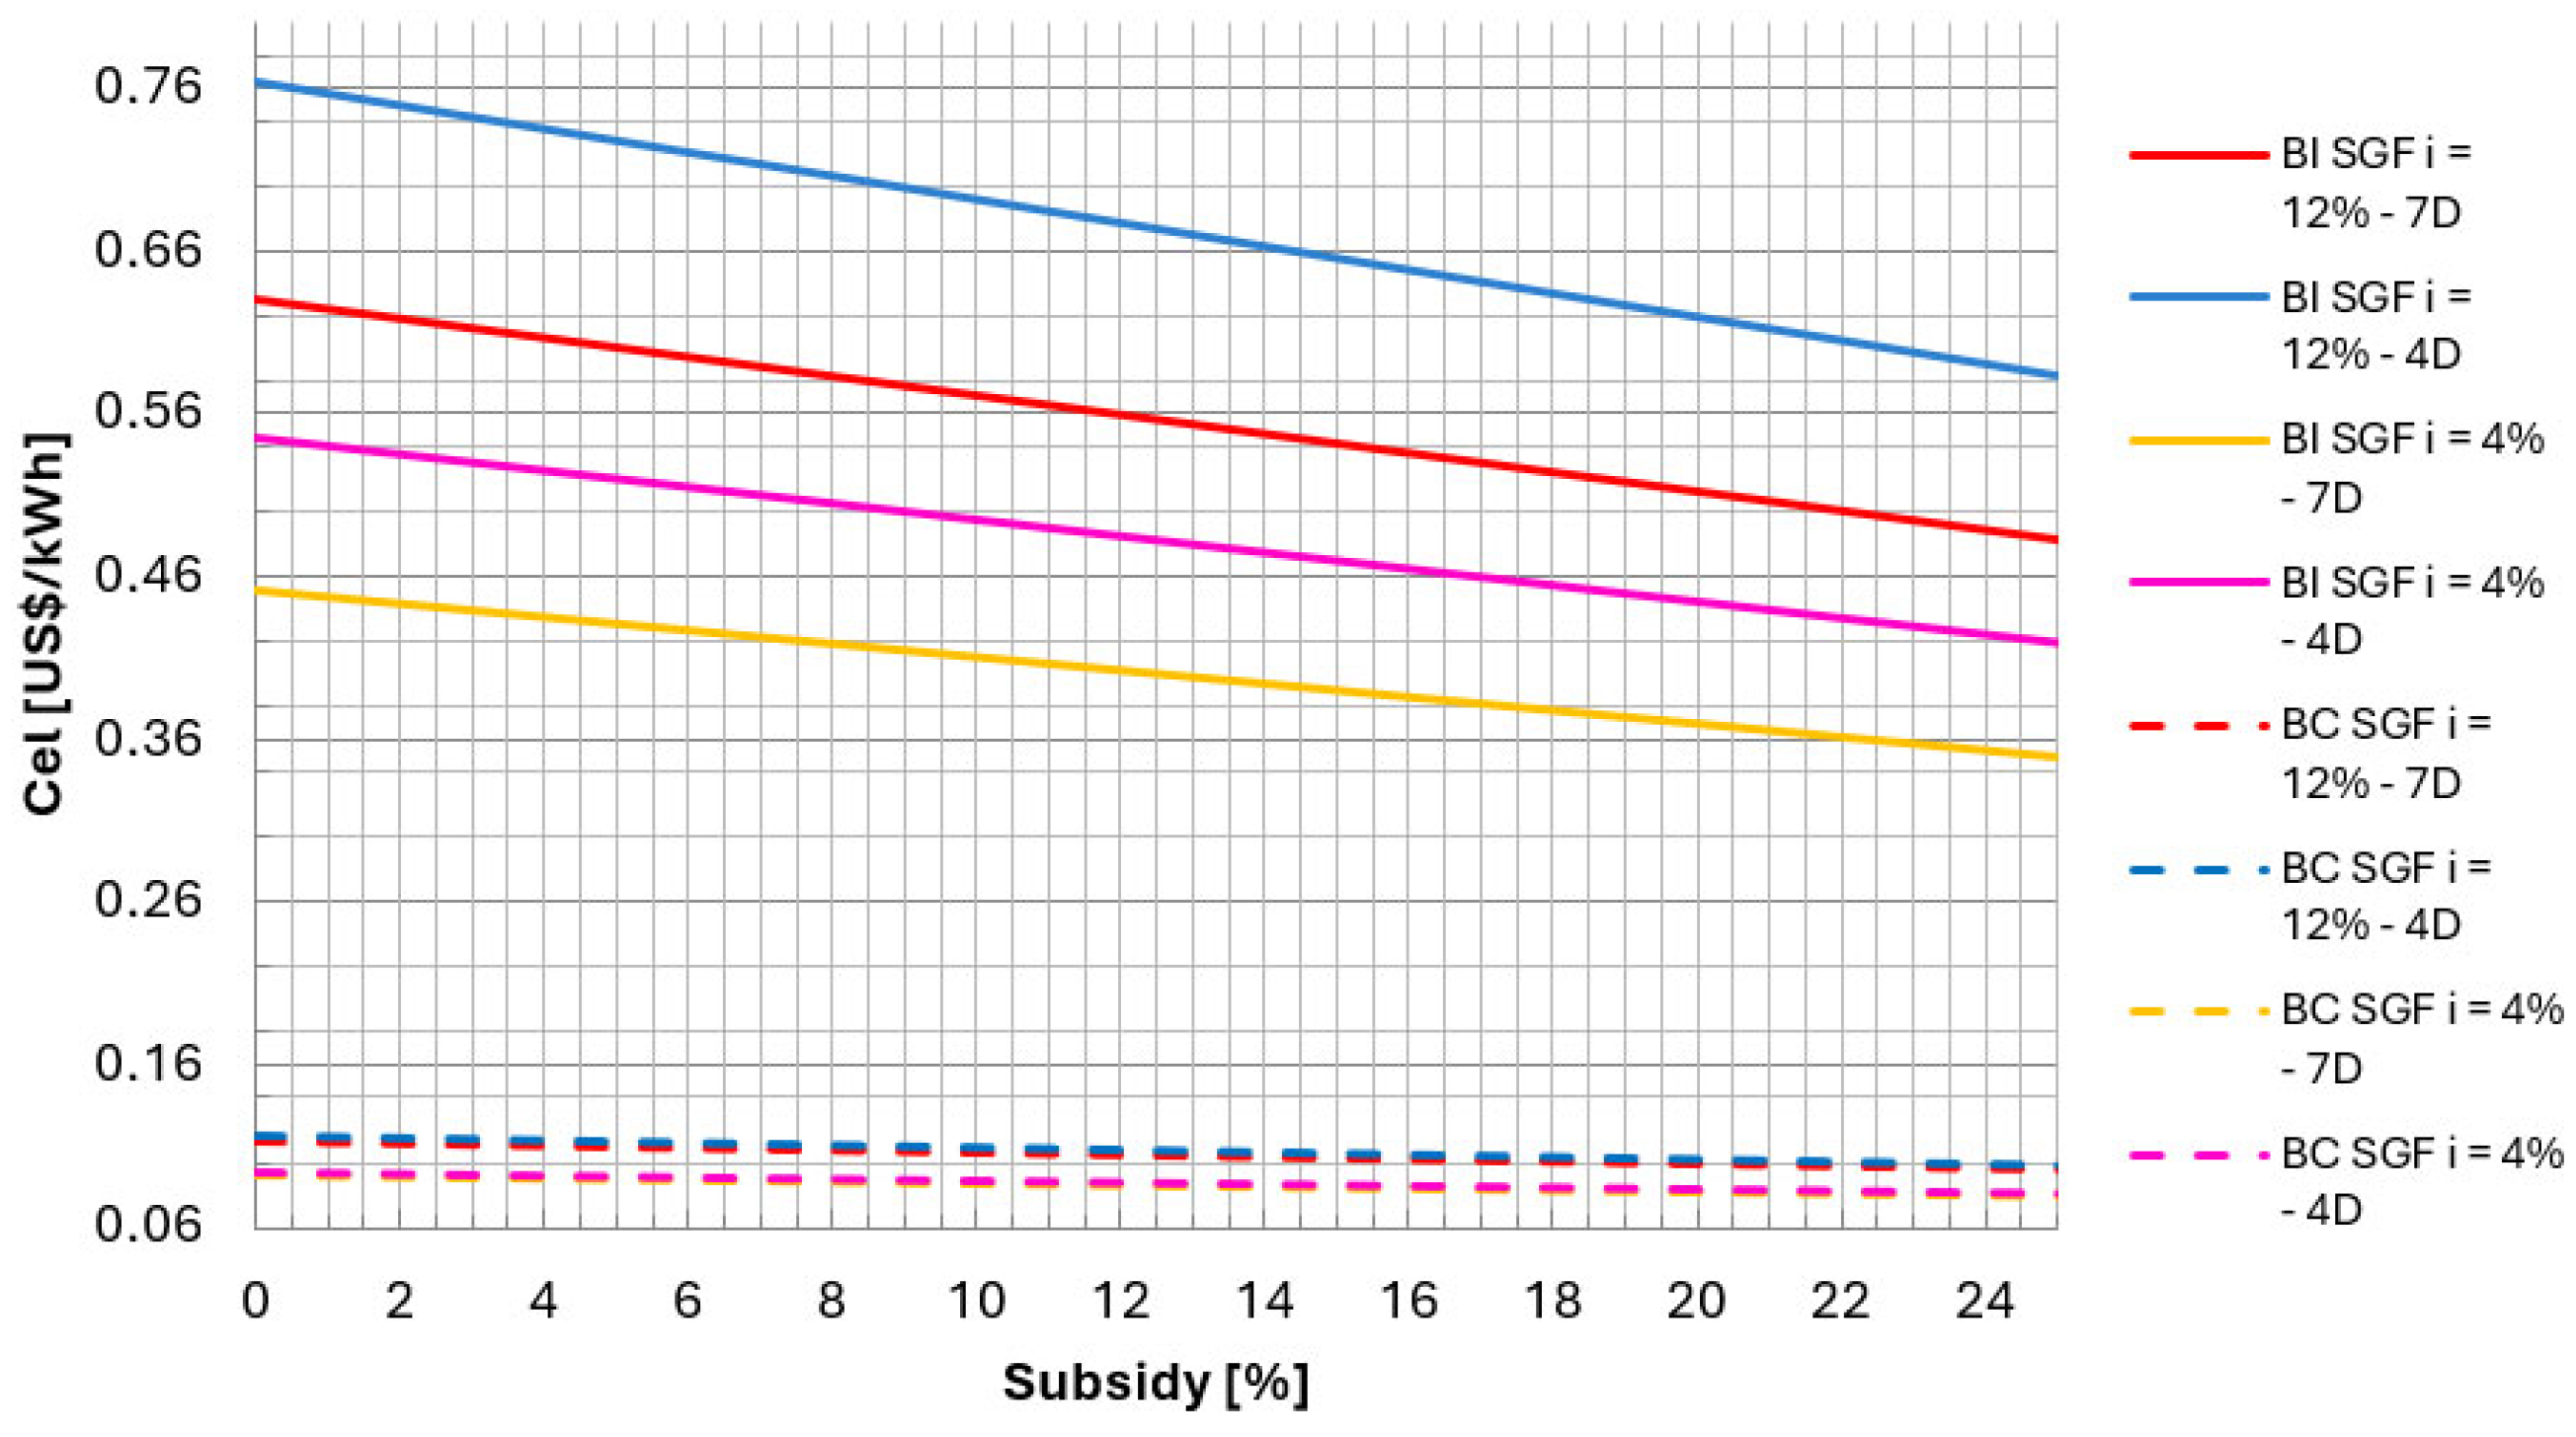
Figure 6 shows the cost of electricity produced by the photovoltaic system in two situations, using an independent battery bank (BI) and directly charging the electric car battery (BC).
For each situation, the interest rates of 4 and 12% practiced by the BNDES bank were considered. Subsidies between 10 and 50% provided by the government’s social programs solar and eolic, biomass, cogeneration and PCH [
31] were also considered, which aim to generate electricity, with an amortization period of 10 years, a deadline set by the Brazilian government’s subsidy program.
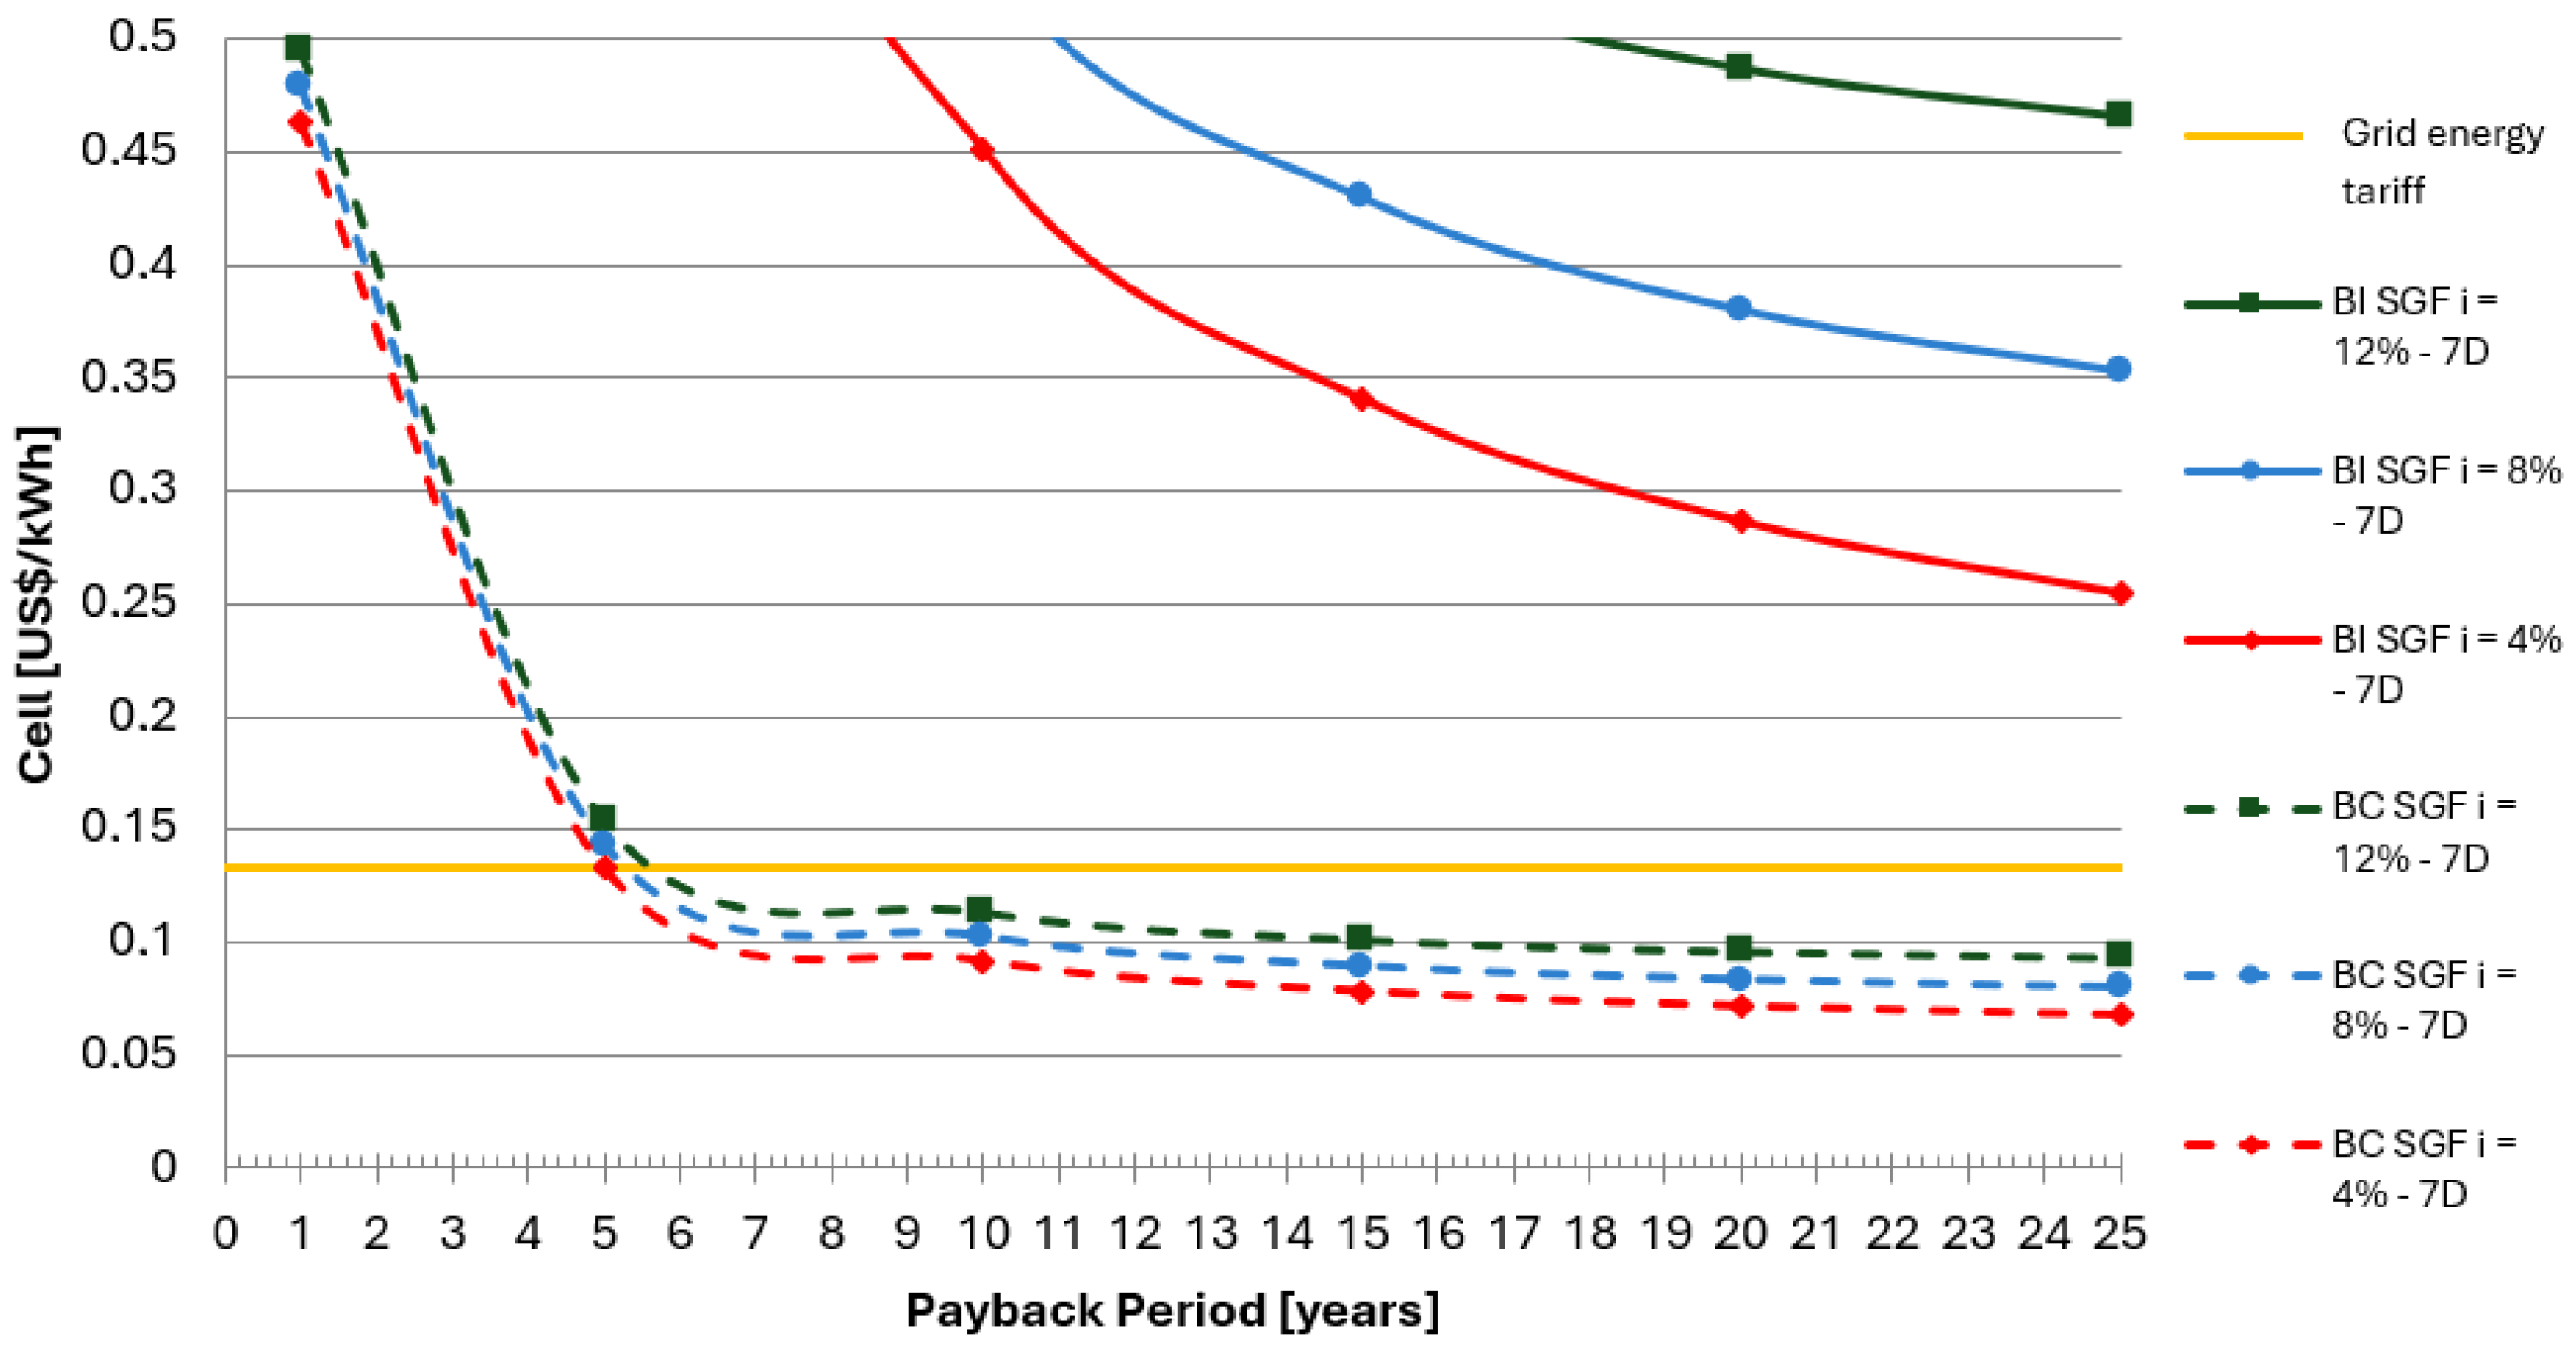
Figure 7 presents the result of the variation in the cost of electricity for an SGF considering solar radiation of 6 h/day. An investment cost of the photovoltaic system using electric car batteries was estimated at around USD 0.81/W, this value includes the necessary equipment to compose the system (photovoltaic modules, inverters and charge controller) added to the cost of operation and maintenance of the plant; all these items are specified in
Table 1. If it is necessary to create a bank of independent batteries, the cost of the plant increases to USD 8.31/W, relative to their purchase.
As an example, the cost of electricity generated by the SGF when using the car 4 days a week without subsidy and using a BI is approximately USD 0.63/kWh, for an interest rate of 12%. When a 50% subsidy is applied, the cost of electricity produced decreases to USD 0.45/kWh, and there is a 46% reduction in the value of power generation. In the situation of using BC, with the same interest rate, the cost of electricity produced is USD 0.12 without government aid and USD 0.095 with a 50% subsidy.
The cost of electricity production decreases over the years for the SGF, and the value related to the initial investment in the plant reduces over time according to the amortization rate. This behavior is related to the annuity factor, which is dependent on the annual interest rate considered. In addition, another factor that influences the distribution of production cost curves is the annual operating period of the plant (H).
5.1. Cost of Electricity by the SGF
The cost of producing electricity was calculated with the variation in the annual interest rate of 4%, 8% and 12%. The cost of production decreases over the years due to the amortization rate, which is related to the annuity factor that depends on the considered interest rate. Another factor of great influence on the cost of electricity production is the annual operating period of the plant, which for the case studied is 2190 h, as well as the average price of electricity supplied by concessionaires in Brazil, which for 2022 was 0.133 USD/kWh.
In
Figure 8 and
Figure 9 the cost of electricity generated by the SGF can be seen. When using a bank of independent batteries, there is no viability of operation when compared to the energy supplied by the concessionaire. When energy storage is carried out directly in the electric car battery, the cost of electricity generated by the SGF becomes viable.
Table 3 presents the payback in relation to the concessionaire’s energy for each region.
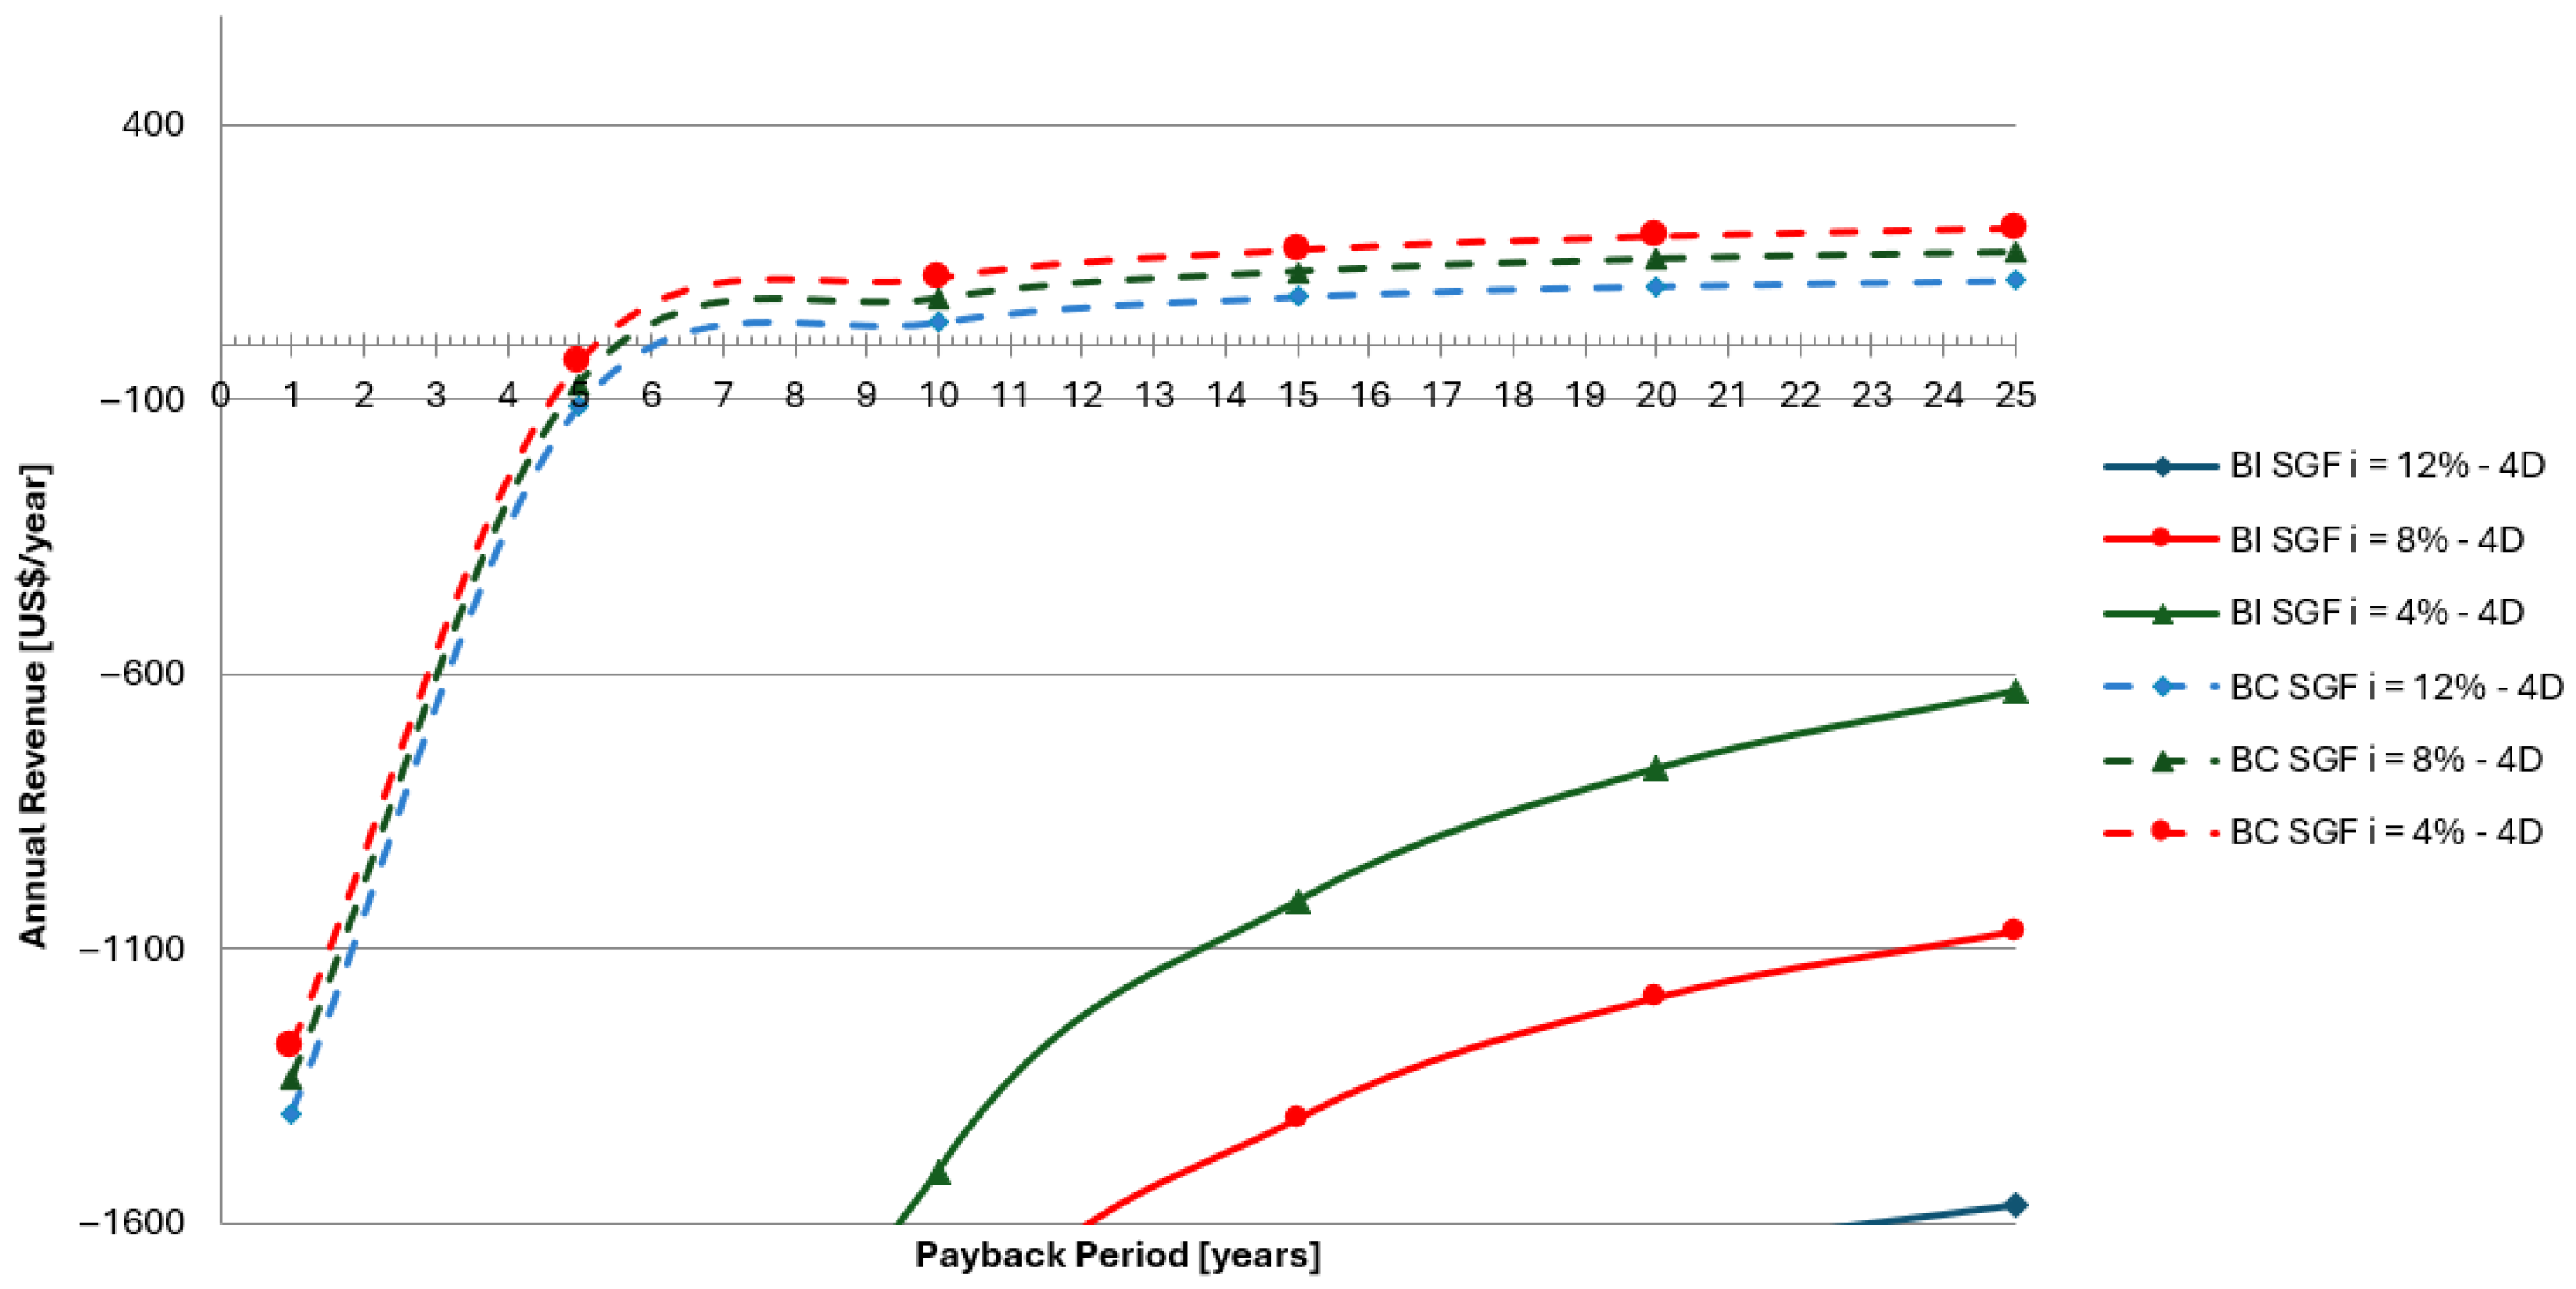
Figure 10 and
Figure 11 show the expected annual revenue for each situation as a BI and for BC as a function of the investment payback period and the variation in the annual interest rate.
For the condition of using an independent battery bank, the impossibility of implementing this system for generating electricity in any region is verified; this occurs because the price of the battery is very high, making the system very expensive.
For the electric vehicle battery generation and direct supply system,
Table 4 shows the payback period for an interest rate of 4%, 8% and 12%. It is feasible for all investments since the useful life of the photovoltaic panel is 25 years, informed by the manufacturer.
5.2. Annual Revenue with Subsidy
Figure 12 shows the period of return on invested capital considering a subsidy of 30% provided by government social programs and an interest rate of 4%. It is possible to observe the reduction in payback for the investment of an SGF to power electric vehicles.
5.3. Economic Analysis for the Electric Vehicle
Using the result of the cost of electricity generated through photovoltaic renewable sources (item 5.2), the cost per kilometer traveled will be calculated.
For the electric car, the economic analysis will be through the energy generated by the SGF and using the electricity from the Brazilian energy concessionaire. A comparison will be made with the cost per kilometer driven by a gasoline-powered car with the same characteristics as the electric car.
For the study of the economic viability associated with the cost per kilometer traveled using renewable energy, the following considerations were made:
Electric car: Smart electric model from Daimler;
Smart 1.0 model, three-cylinder in-line engine from Daimler;
For cost items in which the reference is in national currency, the exchange rate USD 1.00 = BRL 4.88 was used;
Annual interest rate on renewable energy generation by SGF: 4%;
Hours of operation of the SGF according to the average solar incidence in Brazil: 2190 h/year;
Amortization or payback period: 8 years;
Fuel consumption (gasoline) for the ICE car: 20.40 km/L or 8.94 kWh/km (Smart Forfour 1.0 4P);
Electricity consumption for electric motor car: 0.16 kWh/km (Smart Electric Forfour 4P);
Average speed of use: 100 km/h (NEFZ, ECE R101);
Average electricity tariff in Brazil for the commercial and service sector: 0.13 USD/kWh;
Electricity tariff for Brazil using renewable energy from SGF: 0.104 USD/kWh when the vehicle is used 4 days and 0.122 USD/kWh when the vehicle is used 7 days a week.
Figure 13 presents the cost per kilometer driven by the two types of cars. When using an internal combustion engine vehicle, the cost for a distance traveled of 100 km is USD 8.38, and for an electric car, traveling the same mileage, the value varies from USD 1.63 to USD 2.09, depending on the source used.
Table 5 shows the exact cost for each source used to power electric car batteries.
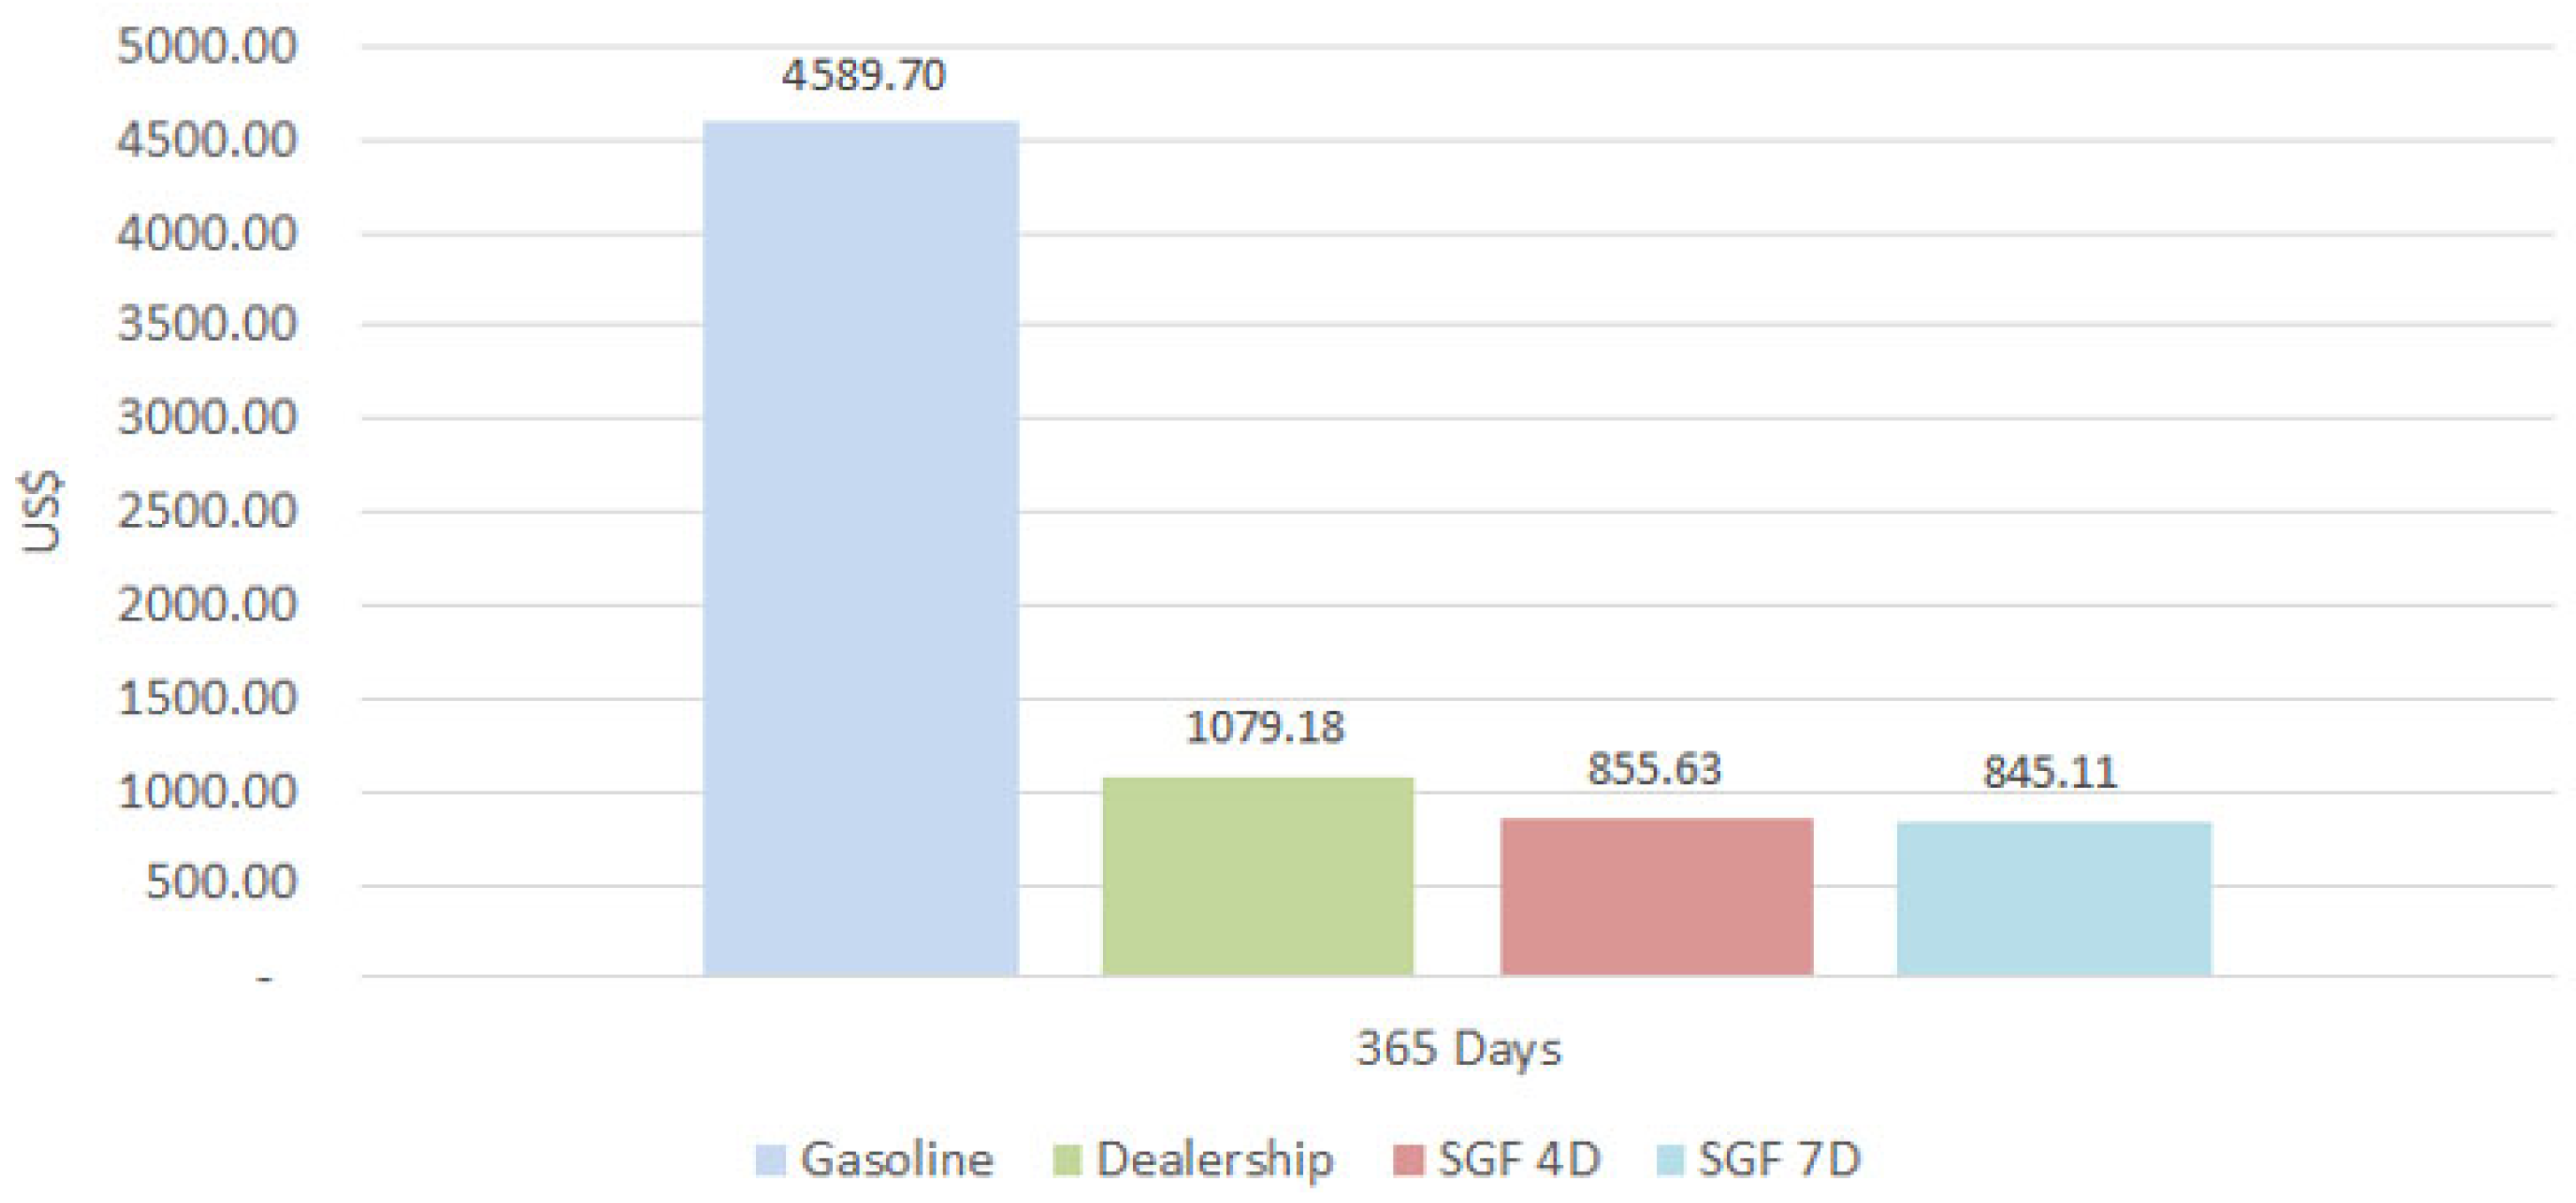
Figure 14 shows the cost of using the ICE and electric car, for 1 year, with a distance traveled of 150 km per day, referring to the autonomy of the electric car.
The annual cost for an electric car is 76.49% lower when using electricity supplied by energy utilities in Brazil and 81.35% lower for energy from photovoltaic plants compared to an internal combustion engine car.
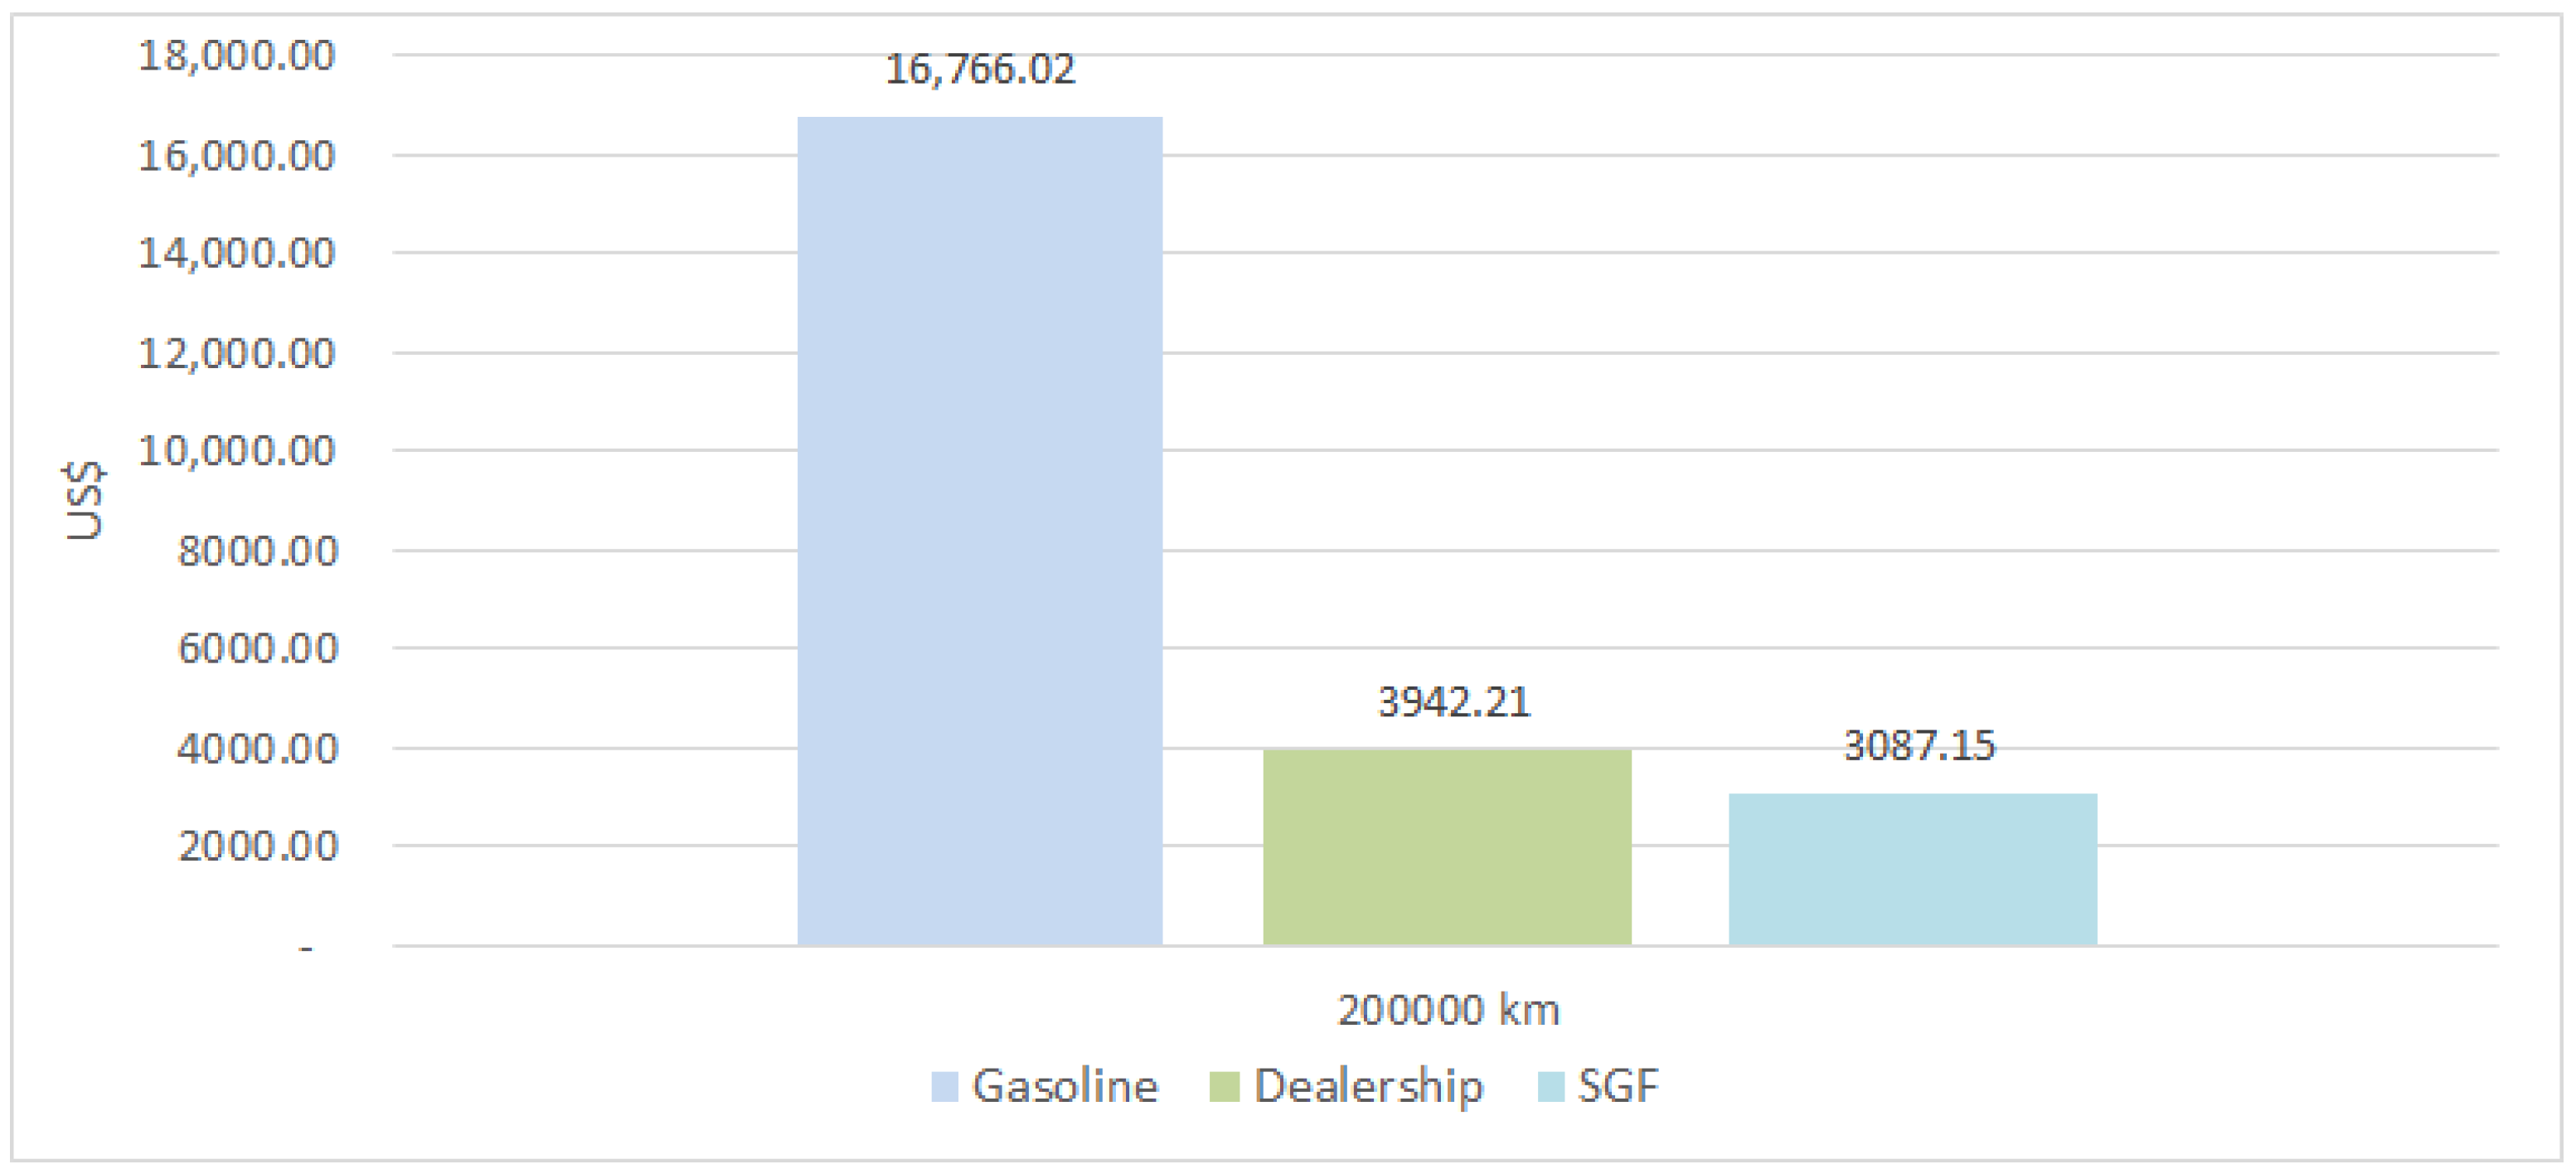
Figure 15 shows the supply cost considering the useful life of an internal combustion engine, which is approximately 200,000 km. The cost of using an ICE car with the conditions specified at the beginning of item 5.3 is USD 10,844.26, while the electric car spends USD 4177.18 if it uses grid energy, and if it operates with renewable energy for the battery supply, this value decreases even more, an average of USD 3310.00 for the SGF.
In addition to the cost of use being higher than the ICE car, the maintenance cost is also higher than that of the electric motor. For comparison purposes,
Figure 16 shows the main maintenance items for the ICE car and
Figure 17 for the electric car.
5.4. Environmental Analysis Result
Table 6 shows the results related to the ecological efficiency of each of the electrical energy systems used. Both systems showed a result above 0.85, demonstrating a high performance of ecological efficiency.
In Brazil, most of the electrical energy in the grid comes from hydroelectric plants, which not only have a higher level of conversion efficiency than photovoltaic panels but also have a lower emission factor (EF), demonstrating a greater ecological efficiency result.
6. Conclusions
Considering that damage to the environment is one of man’s greatest concerns, technological growth has added to the incentive and need for research that brings results with a view to achieving the goals established by the UN and other international cooperation bodies, which has made power generation electricity through photovoltaic panels a sustainable and profitable opportunity.
It was observed that the results obtained from the point of view of environmental aspects are strongly influenced by the emission factor of each energy system for electricity generation. Between the two compared systems, the network presented a result that points to a greater ecological efficiency, with a result of 0.9441; however, the photovoltaic solar system also presents a high result of 0.8987, allowing us to conclude that from the environmental point of view, both systems are interesting for electricity generation, having a high ecological efficiency.
It was observed in the economic results that the costs related to the use of gasoline and electricity as fuel present differences greater than 76%, evidenced by a lower cost when using an electric vehicle; it is important to emphasize that only the aspect of fuel use was considered without taking into account the deterioration of the vehicles and their components.
It is possible to conclude that the main objective of the study was achieved, since there was economic and environmental feasibility using energy generated through a photovoltaic plant in the two proposed conditions (4 and 7 days of use) in order to power an electric car. In the case of using a bank of independent batteries to store electrical energy in order to charge the car later, the system becomes economically unfeasible.
The sizing of the plants is necessary so that there is no oversizing, making the project unfeasible, and so that there is also no insufficiency to supply the demand for electric energy necessary to power electric vehicles.
Additionally, government incentives such as tax reductions and lower import fees are necessary to promote the production of electric vehicles.
The results found in this study are in agreement with [
33], where the analysis led to the identification of an energy-saving pathway that enabled the realization of energy conservation benefits and CO
2 reduction in Seoul, through the use of solar energy for electric vehicle charging. In a study conducted in the Maldives, [
34] also demonstrated the efficiency of using solar panels to power electric vehicles, even with limited land area. Additionally, in an analysis conducted in Spain, [
35] concluded the feasibility of solar energy for electric vehicles, highlighting the importance of associated government projects for successful implementation.
This study did not include an analysis of the battery lifespan. A life cycle assessment of the batteries is required, and the associated costs should be integrated into the project if their use becomes necessary. For this study, the use of a battery bank was considered unfeasible.
Author Contributions
Conceptualization, T.S.C.; Methodology, T.S.C., C.H.S.M. and T.M.d.S.; Formal analysis, T.S.C.; Investigation, T.S.C.; Data curation, T.S.C.; Writing—original draft, T.S.C.; Writing—review & editing, T.S.C., C.H.S.M., J.L.S. and T.M.d.S.; Supervision, J.L.S. and T.M.d.S. All authors have read and agreed to the published version of the manuscript.
Funding
This research received no external funding.
Institutional Review Board Statement
The study did not require ethical approval.
Informed Consent Statement
Informed consent was obtained from all subjects involved in the study.
Data Availability Statement
Data are contained within the article.
Conflicts of Interest
The authors declare no conflicts of interest.
Abbreviations
The following abbreviations are used in this manuscript:
| IPCC | Intergovernmental Panel on Climate Change |
| (CO2)eq | Carbon dioxide equivalent |
| DC | Direct voltage |
| AC | Alternating voltage |
| UN | United Nations |
References
- Vigneswari, M.; Madhubala, V.; Nagarajan, C.; Sudha Periathai, R.; Jeyapriya, R.; Meenambigai, A. Power and Efficiency of Photovoltaic Cell Enhanced by Ce-Zn2V2O7:V2O5 Multiphase Nanoperovskite. Inorg. Chem. Commun. 2023, 153, 110765. [Google Scholar] [CrossRef]
- Europe, S. Global Market Outlook For Solar Power/2022–2026; SolarPower Europe: Brussels, Belgium, 2022; ISBN 9789464518610. [Google Scholar]
- Costa, D.d.; Cobas, V.R.M. Electric Vehicles Charged with Solar-PV: A Brazilian Case Study for 2030. Vehicles 2023, 5, 1743–1759. [Google Scholar] [CrossRef]
- Almasri, R.A.; Alharbi, T.; Alshitawi, M.S.; Alrumayh, O.; Ajib, S. Related Work and Motivation for Electric Vehicle Solar/Wind Charging Stations: A Review. World Electr. Veh. J. 2024, 15, 215. [Google Scholar] [CrossRef]
- Victoria, M.; Haegel, N.; Peters, I.M.; Sinton, R.; Jäger-Waldau, A.; del Cañizo, C.; Breyer, C.; Stocks, M.; Blakers, A.; Kaizuka, I.; et al. Solar Photovoltaics Is Ready to Power a Sustainable Future. Joule 2021, 5, 1041–1056. [Google Scholar] [CrossRef]
- Gouvêa, E.C.; Castro, T.S.; de Souza, T.M. Performance Analysis of Interconnection and Differential Power Processing Techniques under Partial Shading Conditions. Energies 2024, 17, 3252. [Google Scholar] [CrossRef]
- Panagoda, S.S.; Tilanka, G.; Sandunika, I.; Alwis, S.; Panagoda, L.P.S.S.; Sandeepa, R.A.H.T.; Perera, W.A.V.T.; Sandunika, D.M.I.; Siriwardhana, S.M.G.T.; Alwis, M.K.S.D.; et al. Advancements in Photovoltaic (Pv) Technology for Solar Energy Generation. J. Res. Technol. Eng. 2023, 4, 30–72. [Google Scholar]
- Raman, P.; Murali, J.; Sakthivadivel, D.; Vigneswaran, V.S. Opportunities and Challenges in Setting up Solar Photo Voltaic Based Micro Grids for Electrification in Rural Areas of India. Renew. Sustain. Energy Rev. 2012, 16, 3320–3325. [Google Scholar] [CrossRef]
- Dorel, S.; Gmal Osman, M.; Strejoiu, C.V.; Lazaroiu, G. Exploring Optimal Charging Strategies for Off-Grid Solar Photovoltaic Systems: A Comparative Study on Battery Storage Techniques. Batteries 2023, 9, 470. [Google Scholar] [CrossRef]
- Rabbani, M.A. Solar Power Systems and Dc to Ac Inverters. Acta Tech. Corviniensis-Bull. Eng. 2020, 13, 19–28. [Google Scholar]
- Sokolovskij, E.; Małek, A.; Caban, J.; Dudziak, A.; Matijošius, J.; Marciniak, A. Selection of a Photovoltaic Carport Power for an Electric Vehicle. Energies 2023, 16, 3126. [Google Scholar] [CrossRef]
- Kaldellis, J.K.; Zafirakis, D.; Stavropoulou, V.; Kaldelli, E. Optimum Wind- and Photovoltaic-Based Stand-Alone Systems on the Basis of Life Cycle Energy Analysis. Energy Policy 2012, 50, 345–357. [Google Scholar] [CrossRef]
- Sheeja, V.; Kalpana, R.; Subramaniam, U.; Almakhles, D.J. Control of Converter for a Solar PV-BESS Powered Telecom Load With Real, Reactive and Harmonic Power Exchange With Grid. IEEE Access 2023, 11, 141008–141021. [Google Scholar] [CrossRef]
- Kumar, M.; Panda, K.P.; Naayagi, R.T.; Thakur, R.; Panda, G. Comprehensive Review of Electric Vehicle Technology and Its Impacts: Detailed Investigation of Charging Infrastructure, Power Management, and Control Techniques. Appl. Sci. 2023, 13, 8919. [Google Scholar] [CrossRef]
- U.S. Department of Energy. How Do All-Electric Cars Work? Available online: https://afdc.energy.gov/vehicles/how-do-all-electric-cars-work (accessed on 22 March 2025).
- DAIMLER. Plug in. Peel out. Smart Forwto Electric Drive. 2015. Available online: https://www.mercedes-benz.ca/content/dam/mb-nafta/ca/owners/operators-manual/2015/operators-manual/MY15_OwnersManual_electric_drive_EN.pdf (accessed on 22 March 2025).
- Castro, T.S.; de Souza, T.M.; Silveira, J.L. Feasibility of Electric Vehicle: Electricity by Grid × Photovoltaic Energy. Renew. Sustain. Energy Rev. 2017, 69, 1077–1084. [Google Scholar] [CrossRef]
- Daimler Dados Técnicos Smart. Available online: https://www.smart.com/pt/pt/index/smart-forfour-electric-drive-453.html#?product=forfour (accessed on 6 July 2023).
- Pinho, J.T.; Galdino, M.A. Manual de Engenharia Para Sistemas Fotovoltaicos; CEPEL-CRESESB Edição: Rio de Janeiro, RJ, Brazil, 2014. [Google Scholar]
- REIS, L.O.M. dos Lógica Fuzzy Aplicada Ao Controle de Um Sistema Híbrido de Geração de Energia Elétrica: Eólica, Fotovoltaica e Biogás; Universidade Estadual Paulista: São Paulo, SP, Brazil, 2002. [Google Scholar]
- Silveira, J.L. Cogeração Disseminada Para Pequenos Usuários: Estudo de Casos Para o Setor Terciário; Universidade Estadual de Campinas: Campinas, SP, Brazil, 1994. [Google Scholar]
- Pereira, E.B.; Martins, F.R.; Gonçalves, A.R.; Costa, R.S.; Lima, F.L.; Rüther, R.; Abreu, S.L.; Tiepolo, G.M.; Pereira, S.V.; Souza, J.G. Atlas Brasileiro de Energia Solar, 2nd ed.; INPE: Dos Campos, SP, Brasil, 2017; ISBN 978-85-17-00089-8. [Google Scholar]
- Cardu, M.; Baica, M. Regarding a Global Methodology to Estimate the Energy–Ecologic Efficiency of Thermopower Plants. Energy Convers. Manag. 1999, 40, 71–87. [Google Scholar] [CrossRef]
- Viola, L.; Silva Paulino, R.F.; Luz Silveira, J. Ecological Aspects of Electrolytic Hydrogen: Comparing Renewable and Non-Renewable Sources. In Proceedings of the 17th Brazilian Congress of Thermal Scienceljkllkls and Engineering, Águas de Lindóia, SP, Brazil, 25–28 November 2019. [Google Scholar] [CrossRef]
- Campos, V.A.F. de Aspectos Técnicos, Econômicos e Ambientais de Sistemas Híbridos Aplicados Em Edificações Familiares e Propriedades Rurais, Universidade Estadual Paulista “Júlio de Mesquita Filho”; Universidade Estadual Paulista: São Paulo, SP, Brazil, 2019. [Google Scholar]
- Aparecida, L.; Oliveira, N.; Ramos De Souza, M.; Pereira, M.L.; Filho, M. Potencial De Redução De Co2 Pelo Uso De Energia Elétrica Em Motobombas Utilizadas No Processo De Irrigação No Município De Dona Euzébia-Mg: Um Estudo Comparativo Das Matrizes Hidrelétricas E Fotovoltaicas; Universidade Federal de Goiás: Catalão, GO, Brazil, 2017. [Google Scholar]
- Moura, C.H.S.; Silveira, J.L.; Lamas, W.d.Q. Dynamic Production, Storage, and Use of Renewable Hydrogen: A Technical-Economic-Environmental Analysis in the Public Transport System in São Paulo State, Brazil. Int. J. Hydrog. Energy 2020, 45, 31585–31598. [Google Scholar] [CrossRef]
- Coronado, C.R.; Carvalho, J.A.; Quispe, C.A.; Sotomonte, C.R. Ecological Efficiency in Glycerol Combustion. Appl. Therm. Eng. 2014, 63, 97–104. [Google Scholar] [CrossRef]
- Caus, T.R. Energia Hidrelétrica: Eficência Na Geração. 2014. Available online: http://repositorio.ufsm.br/handle/1/1380 (accessed on 20 December 2024).
- Solargis Mapa de Irradiação Normal Global No Brasil. Available online: https://solargis.com/maps-and-gis-data/download/brazil (accessed on 6 July 2023).
- BNDES. BNDES Divulga Novas Condições de Financiamento à Energia Elétrica; BNDES: Rio de Janeiro, RJ, Brazil, 2016. [Google Scholar]
- Motors, S. Como Está Seu Carro. Available online: http://www.savemotors.com.br/site/internas/com_seucarroagora_resultado.php (accessed on 7 January 2018).
- Ku, J.; Kim, S.-M.; Park, H.-D. Energy-Saving Path Planning Navigation for Solar-Powered Vehicles Considering Shadows. Renew. Energy 2024, 236, 121424. [Google Scholar] [CrossRef]
- Ahusan, A.; Nizam, Y. Development of a Solar-Powered Electric Car Model: Practical Efficiency and Performance Analysis in the Context of Maldives. In AIP Conference Proceedings; AIP Publishing: New York, NY, USA, 2024; Volume 3245, p. 020008. [Google Scholar]
- Hoseinzadeh, S.; Nastasi, B.; Groppi, D.; Astiaso Garcia, D. Socio-Techno-Economic-Environmental Investigation of Scenarios-Based Combination Sources of Green Energy System—A Case Study in Spain. Energy Rep. 2024, 12, 2611–2620. [Google Scholar] [CrossRef]
| Disclaimer/Publisher’s Note: The statements, opinions and data contained in all publications are solely those of the individual author(s) and contributor(s) and not of MDPI and/or the editor(s). MDPI and/or the editor(s) disclaim responsibility for any injury to people or property resulting from any ideas, methods, instructions or products referred to in the content. |
© 2025 by the authors. Licensee MDPI, Basel, Switzerland. This article is an open access article distributed under the terms and conditions of the Creative Commons Attribution (CC BY) license (https://creativecommons.org/licenses/by/4.0/).


 ,
, 


