Abstract
As a key factor driving economic growth, the connotation and extension of new quality productivity have been expanding. This has a profound impact on the path of total factor productivity improvement. Therefore, this paper combines the qualitative comparative analysis (QCA), necessary conditions analysis (NCA), and data envelopment analysis (DEA) methods and adopts a group study to analyze the driving mechanism of total factor productivity (TFP) enhancement in 30 provinces in China from the perspective of new quality productivity. The study finds that (1) a single new quality productivity component does not constitute a necessary condition for TFP; (2) three new types of ecological factors can drive regions to realize high total factor productivity, including innovation-driven, green-led, and service-embedded factors, reflecting the complex mechanism of high-quality development in China’s provinces; and (3) the high factor productivities of the eastern, central, and western regions are clearly differentiated, with different grouping paths, which are manifested in the ”leading” development of the east, the “following” development of the center, and the “accompanying” development of the west, revealing the regional “leading” development and the “accompanying” development and showing the diversified path of regional high-quality development.This study not only deepens our understanding of the relationship between new quality productivity and total factor productivity in theory, but also provides scientific basis and decision support for different regions to formulate differentiated high-quality development strategies empirically.
1. Introduction
With the rapid development of information technology, the rise of new industries, and the reconstruction of the global value chain, the traditional form of productive forces is undergoing unprecedented changes. From the international perspective, in recent years, economic globalization has encountered a countercurrent, and arguments such as “delinking and breaking the chain” and “small yards and high walls” have become increasingly prevalent; from the internal perspective, China is facing challenges of increasing population aging and increasing pressure on the ecological environment, and the impetus of the traditional exuberant mode of development is weakening. The 20th CPC Central Committee’s Third Plenary Session suggested supporting the combination of various modern factors of production to create new, high-quality productive forces and to substantially increase the productivity of all factors. In the complex competitive landscape, the innovation and upgrading of productive forces has become the primary motivating factor for the improvement in national competitiveness. We are required to accelerate the development of the metamorphosis model and continuously increase total factor productivity to promote fundamental changes in the quality, efficiency, and dynamics of economic development.
At present, new quality productivity, driven by advancements in science and technology and combining high-tech, high-efficiency, and high-quality features, is gradually taking shape and showing strong vitality. “New quality productivity” is a concept that has gradually emerged in China’s policy context and academic discussions in recent years, mainly referring to advanced productivity forms formed through revolutionary technological breakthroughs, innovative allocation of production factors and the in-depth transformation and upgrading of industries. At its core, it relies on science and technology innovation to drive productivity from traditional modes to a more efficient, smarter, and more sustainable direction, providing new momentum for high-quality economic development. New-quality productivity not only represents an additional phase in the evolution of productive forces but is also a driving force for the advancement of comprehensive economic and social transformation and sustainability. From the perspective of new quality productivity, the improvement in total factor productivity is not exclusively reliant on the increase in conventional variables but also relies more on multidimensional synergistic innovations such as scientific and technological innovations, institutional innovations and management innovations. These combinations of innovations not only enhance the effectiveness of production factor utilization but also encourage improvement, industrial structure optimization and economic growth transformation. From the standpoint of new quality productivity, the enhancement of the productivity of all factors is not driven by a single factor but rather is a complex and comprehensive process composed of multiple factors working and acting together [1].
At the level of the policy structure, the State Council and the Party Central Committee have carried out a comprehensive and clear explanation and strategic planning for new quality productivity. However, in this topic, research gaps are reflected in the vague definition of the concept of new quality productivity, the lack of exploration of its relationship with traditional determinants of productivity, the static nature of TFP studies, the lack of analysis of factor combination and allocation, and the lack of attention to the characteristics of different regions and cross-regional comparison in regional studies. In the realm of academic discussion, what is the deep conceptual definition of new-quality productivity? What is the internal logic of total factor productivity? How can the theoretical analysis framework be constructed? What are the specific practical cases (i.e., typical facts) mapped? Currently, the academic community has not reached a broad and unanimous consensus. To explore the driving mechanism of total factor productivity enhancement from the perspective of new quality productivity in depth, this paper performs a group study based on the dynamic fuzzy set qualitative comparative analysis (fsQCA) method. The significance of this study is that, on the one hand, by deeply exploring the relationship between new quality productivity and total factor productivity, it helps to better understand the important role of new quality productivity in promoting economic and social development; on the other hand, by revealing the power mechanism of total factor productivity enhancement, it helps to provide theoretical justification for the region to create an approach to economic policy that is more rational and scientific, which is important for encouraging China’s economy to attain superior development.
2. Literature Review and Theoretical Framework
2.1. Literature Review
2.1.1. Total Factor Productivity
Total factor productivity (TFP) is an additional form of production efficiency under the condition of the established factor input level, and its essence is resource allocation efficiency. According to whether the coefficients of the production function model need to be approximated, the mainstream methods of total factor productivity measurement in academia are mainly categorized into parametric and nonparametric estimation methods. The former are based on Solow’s residual method [2], which decomposes the output growth into two parts—input growth and residual growth—and later develops into the stochastic frontier method. The latter is based on the core of the DEA (data envelopment analysis), which is used to measure the data at macro- and meso-scale levels and can be used in conjunction with Malmquist’s method. It can be combined with both the Malmquist and Luenberger indices, from which the TFP growth rate (TFPG) can be measured. In line with the theory of endogenous expansion of the economy, when the labor input factor is constant among the factors affecting the productivity of all factors, the increase in total factor productivity depends on innovation inputs, and several studies have confirmed that advancements in technology greatly advance the growth of total factor productivity and generate regional heterogeneity [3,4]. Giriliches [5], Mairesse and Hall [6], and Diling-Hansen [7] reported that R&D inputs in the production activities of firms in the United States, France, and Denmark, respectively, significantly contribute to total factor productivity, as scholars’ attention to the growth of the green economy is ongoing. To increase productivity, they have begun to focus on green development research, and it has been found that green technology can not only effectively reduce energy consumption per unit of output but also further optimize the energy structure [8,9]. Most of the studies on the online economy take enterprises as samples, confirming that the digital economy promotes the agglomeration of high and new industries, brings about economies of scale, and accelerates resource element rational allocation and the reorganization of resource factors to improve TFP [10]. Additionally, some research indicates that the digital economy promotes superior economic development by virtue of the enhancement of entrepreneurial activity [11]. In other studies, the factors affecting total factor productivity include human capital, the market development level, the business environment [12], legal regulation [13], and resource allocation efficiency [14,15], which can be used to improve total factor productivity by accelerating the pace of scientific and technological innovation, assisting enterprises in improving quality and efficiency, and guiding the transformation of the industrial structure and other paths [16].
2.1.2. New Quality Productivity
“New quality productivity” has rich connotations. In July 2023, General Secretary Xi Jinping mentioned the important concept of new quality productivity during his investigation in Sichuan, Heilongjiang and other places [17]. As a popular concept in the two sessions of 2024, it has added new content to the theoretical system of the socialist political economy with Chinese characteristics; academic research has focused mainly on the basic connotations and characteristics, evaluation and measurement, and influencing factors and paths of this theory. In terms of the basic connotation and characteristics, as early as in Capital, Marx highlighted “productive forces, i.e., the development of productive capacity and its elements” [18], whereas the improved nature of the productive forces is the driving force behind key subversive technological breakthroughs [19], including the workers’ leap. The ideal blend of labor objects and labor materials, which is the inheritance and advancement of Marx’s productive forces theory, is essentially a new concept and introduces a new quality to productive forces. Inheritance and development of the theory are essentially major leaps in social productivity [20]. This productivity has high-quality, high-tech, and high-performing attributes characterized by innovation, the key to quality. Some scholars summarize new productivity as three “new” modules: new manufacturing, new services, and new business forms [21], whereas others summarize it as the integration of new technology, new energy, and the digital economy [22]. In terms of measurement and evaluation, some scholars start from the essential connotation of new quality productivity and construct indicators from the three dimensions of laborers, objects of labor, and means of production [23], whereas some scholars start from the demand for modernization and development and construct indicators from the three dimensions of innovation and technology, industrial upgrading, and conditions of development [24]; there are also evaluation indicator systems constructed from the two dimensions of inputs and outputs of the new quality production factors [25]. Research shows that the factors affecting the new quality productivity include science and technology, the digital economy [26], the institutional environment, the industrial structure [27], labor factors, technology factors, knowledge factors [28], and the energy structure [29]. Hu Ying explored the cultivation path from the four aspects of fostering innovative talent, adhering to innovations in science and technology, fostering new industries, and improving the mode of production [30], and Du Chuanzhong suggested that the cultivation path can be explored from the three dimensions of elements, technology, industry, system and other aspects to promote the development of new quality productivity [31].
2.1.3. New Quality Productivity and Total Factor Productivity
There is a deep inherent relationship between new quality productivity and total factor productivity. New quality productivity is rooted in productivity [32], the core of which is driven by innovation, and the core symbol is the improvement in the productivity of all factors. The comprehensive research on new quality productivity and total factor productivity is relatively scarce, and most of the existing literature focuses on the discussion of total factor productivity from the perspective of new quality productivity, or vice versa, or analyzes the two from a specific perspective. For example, Gong Binlei and Yuan Weilan conducted a theoretical discussion, measurement analysis, and empirical research on agricultural total factor productivity from the perspective of new quality productivity [33]. Zhang Jianping and Xu Runda et al. analyzed the mechanism of higher education development on total factor productivity from the perspective of new quality productivity [34]. Based on the perspective of enterprise total factor productivity, Shi Dan and Sun Guanglin discussed the relationship between data factors and new quality productivity [35]. Cai Xiangjie and He Zhengchu studied how new quality productivity affects total factor productivity from the perspective of scientific and technological innovation [36]. Liu Wenxiang and Zhao Qingsi pointed out that “the proposal of new quality productivity… will help to get rid of the dependence on factor driving and investment scale driving, and improve total factor productivity through high-level scientific and technological innovation” [37]. Some studies believe that new quality productivity generates an industrial iterative effect: traditional industry modernization and transition promote industrial chain synergy while enhancing industrial-added value and become significant catalysts for the creation of new kinetic energy [38].
2.1.4. Review of the Literature
Throughout the existing literature, scholars have achieved many results in their research on new levels of productivity, quality, and total factor productivity. However, there is still some potential for growth. The current research focuses mostly on the broad description of the definition and characteristics of new quality productivity and total factor productivity and explores only the notion of new quality productivity and its impact on total factor productivity at the theoretical level, lacking specific quantitative standards and measurement dimensions. Few in-depth and targeted analyses and discussions on how different regions and industries can develop new quality productivity according to their own characteristics to increase total factor productivity exist. There has been little in-depth, targeted analysis and discussion on how different regions and industries can develop new quality productivity according to their own characteristics to increase total factor productivity. Focusing on the theoretical foundation and logical framework of new quality productivity and total factor productivity, the dynamic fsQCA approach is used in this investigation. To analyze the synergistic effects of new manufacturing, new energy, new services, and new environmental factors in depth, a multidimensional system of the driving mechanism of the productivity of all factors as seen through the lens of new quality productivity in each region can be built, a multifaceted path of practice can be planned, and relevant solutions and recommendations can be proposed. This study expands the research scope of the power mechanism of TFP improvement from the standpoint of fresh, high-quality output. It integrates the viewpoint of new quality productivity into the study of total factor productivity and, based on the results of the analysis of different groupings, formulates targeted policy measures to encourage the economy’s steady growth, which offers a fresh perspective for understanding the new dynamics of economic growth.
2.2. Theoretical Framework and Modeling
2.2.1. Theoretical Framework
Referring to the macro overview of Hong Yinxing and other scholars [22], this paper constructs a new productivity indicator system at four levels: new manufacturing, new energy, new services, and a new environment (Figure 1). Among them, new manufacturing emphasizes original innovation and disruptive technological innovation, and in addition to the traditional factors of production, data are added as a new factor of production, with the growth of key industries and the cultivation of future industries as the main task. New energy echoes China’s “double-carbon” goal, and, to achieve the “carbon peak” and “carbon neutral” goals, it is necessary to rely on new energy systems, such as clean energy and green technology; new services focus on the development of production services that have a significant impact on the global industrial chain, including R&D and design services, warehousing and courier services, financial services, energy-saving and environmental protection services, and production leasing and leasing services for production activities. The productive service industry in the United States accounts for as much as 56% of GDP, whereas the productive service industry in China accounts for only approximately 27% of GDP, which is where China’s productivity falls short; the new environment refers to the digital industrial ecosystem and high-quality business environment, and the new manufacturing, new energy and new services cannot be separated from the business environment and digital economy. At present, the digital industry’s contribution to the quality of the new productivity level has increased, and the comprehensive nature of the new quality of productivity has gradually increased, whereas the quality of the business environment for the development of new manufacturing, new energy, and new services has provided a strong guarantee and a good market environment.
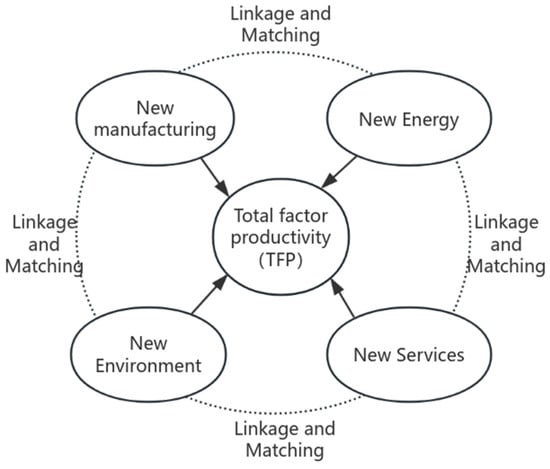
Figure 1.
Research framework.
2.2.2. Models and Methods
- (1)
- DEA–Malmquist model
Nonparametric data envelopment analysis (DEA) was jointly proposed by three scholars, Charnes, Coopor, and Rhodes, in 1978 [39], and its core concept is to use mathematical planning and statistical means to accurately define the optimal boundary (i.e., frontier) for production activities under the premise of ensuring that the inputs and outputs of the decision-making units (DMUs) are maintained at activity’s optimal boundary (i.e., frontier) while ensuring that the inputs and outputs of the decision-making units (DMUs) remain constant. The method maps DMUs onto this frontier and compares the relative efficiency of each DMU by evaluating the degree of its deviation. The Malmquist index method allows for the selection of multiple input and output variables for efficiency analysis, so regional total factor productivity is analyzed using the data envelopment model (DEA–Malmquist) [40], which includes input and output indicators. Among them, the input indicators incorporate both capital and labor inputs. The measurement of labor input is performed by the average annual number of employees in the region, capital input is selected as net fixed assets, and the output indicators use the data of the operating income of the manufacturing industry. DEAP 2.1 software was used to calculate each Chinese province’s total factor production.
- (2)
- FaQCA methodology
Instead of the traditional statistical analysis framework of the “independent variable–dependent variable” dichotomy, this study adopts the qualitative comparative analysis (QCA) method supported by the set theory. The traditional method is limited to the independent or interactive effects of a single variable or a few variables, but due to the obvious heterogeneity of the region, there may be multiple “different paths” between the antecedent conditions and the results of different groups. The QCA method, with its unique grouping perspective and strong explanatory power, can reveal the complex relationship between multiple factors and their joint effects on the results and provide a useful tool for analyzing the results of all factors. Due to its unique group perspective and powerful explanatory power, the QCA method can reveal the complex relationships among multiple factors and their joint influence on the results, providing an effective instrument for examining the driving mechanism of total factor productivity improvement. Therefore, the use of QCA can more comprehensively capture the complex interactions and combined effects among multiple factors and follow the logic of actual “multicausal concurrency”. QCA methods mainly include the clear set (csQCA), mv (QCA multivalued set), and fuzzy set (fsQCA) methods. (1) The traditional regression analysis method is mainly suitable for exploring the “net effect” of a single factor, while fsQCA can find the configuration relationship and the common destination between multiple factors. (2) Considering that fsQCA, as a qualitative comparative analysis method of fuzzy sets, can break through the limitations of clear set csQCA, only processing binary variables and multi-valued set mvQCA’s limited classification of variables, and consider different degrees of various factors with fuzzy sets, it is more suitable for the characteristics of new quality productivity factors which are complex, changeable, and difficult to accurately divide or simply classify.
3. Research Design
3.1. Data Collection
The following criteria were followed to collect and screen the data: (1) Representativeness: to ensure that the sample is representative of the new quality productivity in different industries, regions, or economic characteristics of China. This helps to enhance the generalizability and applicability of the findings. (2) Coverage: The sample should cover as many types and characteristics of NQP as possible, in order to fully reveal the mechanism of its impact on total factor productivity. At the same time, care should also be taken to maintain a balance among the samples and avoid over-concentration on a particular type or characteristic. Following the principles of case typicality, similarity, heterogeneity, and comprehensiveness, panel data empirical analysis is conducted across 30 provinces (excluding Tibet, Hong Kong, Macao, and Taiwan) across the country in 2022. The sources of the data used are the China Science and Technology Statistical Yearbook, China Statistical Yearbook, and China Energy Statistical Yearbook. Each province’s statistics report on social and economic issues in the country’s progress is published alongside the Torch Statistics Yearbook. The data of individual indicators are missing in some years; in these cases, the interpolation method is used to complete these datasets.
3.2. Objects of Study
The value of TFP for each province in 2022 was measured using DEAP 2.1 software, and these data were used as the final outcome variable. One indicator that supports economic growth is TFP, which can have a positive, zero, or negative value), and it reflects the combined effect of technological advances, organizational innovations, specialization, and production innovations on production efficiency.
Conditional Variables
New Manufacturing. Containing new production variables, new manufacturing technology, new scientific findings, and new goods and applications [21], this paper selects two dimensions: product innovation and process innovation. Product innovation is an important driving force for industrial upgrading and transformation. Through the continuous introduction of new products, enterprises can gradually eliminate the dependence on poor technology and low value-added products and transform to high-tech and high-value products, which is measured by the number of enterprises that achieve product innovation in this paper; process innovation can optimize the production process, reduce waste, and increase manufacturing efficiency by means of technological advancements, equipment, and operation methods, which is determined by the number of enterprises that achieve process innovation in this paper.
New energy. The revolutionary direction of the new industry is to innovate, develop, and use clean energy. New energy sources include geothermal, wind, solar, and biomass energy sources, and this paper selects the two dimensions of the solar energy utilization level and the wind power utilization level. The new energy sector is a key driver of improved productivity and quality, giving rise to a new model and new momentum in the energy field. The development and technological progress of these new industries not only promote the improvement in new energy efficiency but also enhance the competitive advantage of new energy over traditional energy sources, thus promoting the green market-oriented transformation of the energy structure, which is measured by the installed capacity of wind power installations and solar power generation.
New services. Ten major categories, such as R&D and design, quality testing, trade agency, financial services, cargo transportation, warehousing and courier services, information services, and production support services for production activities are covered. This paper selects two dimensions, namely, the development of scientific research services and the development of financial services. The development of the scientific research service industry can encourage the close integration of innovation and industrial chains, enhance the transformation rate of scientific research results, and help improve TFP. This paper uses the number of scientific research and technology service employees to measure this; the financial service industry provides important financial support for innovation activities, and, through a variety of financing channels such as the stock market and the bond market, the financial service industry is able to satisfy the financial needs of technological innovation enterprises at different stages and improve the conversion rate of technological achievements and the amount of industrialization; this indicator is determined by the number of monetary and financial service employees.
New environment. Given the new production and development environment brought about by the technological revolution, the creative distribution of production variables and the profound industry reform and modernization, this paper selects two dimensions: the digital atmosphere and the business environment. The digital environment breaks the geographical limitation of the traditional market, and enterprises can realize information sharing and collaboration between downstream and upstream businesses through the digital supply chain platform, which is measured by the quantity of people with internet broadband access in this paper; marketization, the rule of law, and internationalization are the three core elements used to build a first-class business environment, with marketization as the foundation, the rule of law as the guarantee, and internationalization as the direction, and the three are synergistically promoted. A good business environment can offer businesses a stable business environment and predictable support for policies and reduce their business risk; this indicator is measured by the business environment index.
3.3. Data Calibration
In accordance with previous research results and based on the data characteristics of condition variables and outcome variables, this study adopts the direct calibrating technique for converting all indicators into fuzzy set affiliation scores [41]. Referring to the calibration standard of Du Zhouyun and other scholars [42], and, based on the current circumstances of the case, the levels of TFP, new manufacturing, new energy, new services, and new environment are cross-calibrated to the 0.5 quantile point; the fully unaffiliated quantile point is 0.05, the fully affiliated quantile point is 0.95, and the calibration of each outcome and condition is summarized in Table 1.

Table 1.
Selection and calibration of conditions and outcome indicators.
4. Analysis of Results
4.1. QCA Requisite Analysis
Necessity Analysis of Individual Conditions
Based on the mainstream qualitative comparative analysis (QCA) research specification, this part of the study aims to verify whether only one condition (and its non-sets) is an essential precondition for influencing regional TFP. The level of consistency is a key indicator of whether a condition is a necessary precondition, and, when the level of consistency is at or above 0.9, the condition is recognized as an essential prerequisite for the result. Table 2 shows the results of testing the necessary conditions for TFP in both high- and low-level regions using fsQCA 3.0 software. An analysis of the data in Table 2 reveals that the level of consistency of all the conditions does not reach the threshold of 0.9. Therefore, it can be concluded that there is not a single prerequisite that affects TFP at non-high and high levels.
Table 2.
Analysis of necessary conditions.
4.2. Analysis of the Adequacy of the Configuration
In contrast to the necessary conditions analysis described above, the configuration analysis attempts to reveal a sufficiency analysis of the different configurations of multiple conditions that lead to an outcome. In conducting the grouping adequacy assessment process, this paper clearly defines the frequency threshold as 1 and sets the primality threshold for consistency as 0.8, whereas the PRI’s constancy threshold is set as 0.6. The overall solution consistency is 0.913, which suggests that the conditional configurations have strong explanatory power for the results of achieving high levels of TFP. The coverage of the overall solution is 0.594, which suggests that the overall results have fairly strong explanatory power for the selected cases. Given that there is no consensus in the existing literature to clearly indicate the direction of how a particular new quality productivity condition affects the results, in conducting counterfactual analysis, this study hypothesizes that if a single new quality productivity condition exists or does not exist, it may have an effect on TFP. The four groupings in Table 3 can be viewed as combinations of sufficient conditions for high levels of TFP, and this paper pinpoints the circumstances at the core and edge for each solution through contrasting the nested structure.
Table 3.
High-level total factor productivity grouping analysis.
According to the results shown in the table, a solid circle indicates the presence of a condition, a forked circle indicates the absence of a condition, and a blank space indicates an ambiguous state, i.e., the condition can be present or absent. Large circles are core conditions (conditions that exist in both parsimonious and intermediate solutions), small circles are auxiliary conditions (conditions that exist only in intermediate solutions), and groupings with the same core conditions are grouped together. This study reveals three new productivity groupings (M1, M2a, M2b, and M3) that can contribute to high TFP. Among them, the core conditions, M2a and M2b, are categorized in the same category, which together constitute the second-order grouping states. Next, each kind of group state (solution) is named and analyzed in depth with related information. Combined with the previous theoretical analysis, this paper takes product innovation, process innovation, new energy, and new services as the “anchors” of the naming of the group states, in which M2 and M3 are not driven by high-tech manufacturing compared with M1. Therefore, M1 is named innovation-driven. New energy is the core condition of M2, which is named green-leading. Considering the development of financial services as the core condition of M2, which is named green-led; M2a and M2b are also green-led. Considering the development of financial services as the core condition in M3, it is named the service-embedded type. Typical cases often arise from the combination of condition paths with high consistency. When the consistency is near 1, there is a substantial relationship between the condition combination and the result, such that the cases in the condition combination are more likely to be typical cases. Logically possible condition combinations and their corresponding number of cases are identified using the fuzzy set affiliation score matrix with the help of the truth table algorithm in the DEAP 2.1software to determine the appropriate case frequency threshold.
4.2.1. Innovation-Driven Type
M1 indicates that a significant amount of product innovation, a high level of process innovation, a high level of scientific research service development, an elevated degree of financial service development, a non-high level of wind power utilization, a low-level business environment as the fundamental requirement, and a non-high level of solar energy utilization, with a low level of digitalization as the auxiliary circumstance, can produce a high level of TFP. Thus, the presence of new manufacturing and new services plays a central role, and higher levels of innovation and well-developed services can break the constraints of the other conditions and lead to high levels of TFP.
The consistency of grouping 1 is 0.896, and the case coverage of this path is 23.4%, which explains approximately 23.4% of the TFP cases. Beijing is a typical innovation-driven region. As a national and worldwide center for innovation in science and technology, Beijing has continued to implement the Leading Action Plan for Basic Research and the Breakthrough Plan for Key Core Technologies, a forward-looking layout of emerging fields of future industries; strengthened the construction of international science and technology innovation centers; and made efforts to push forward the development of new energy, new materials, commercial spaceflight, low-altitude economy, and other strategic emerging industries. These industries have become the mainstay of the creation of new, high-quality productivity. As a new growth point of the digital economy in the future, Beijing Zhongguancun Internet 3.0 Industrial Park has built an Internet 3.0 ecosystem and created an industrial ecological highland since its opening, initially forming an ecological upstream and downstream cooperation and synergistic effect; Beijing actively promotes the agglomeration of productive service industry enterprises in specific areas to form industrial cluster effects. For example, it encourages productive service enterprises to gather on the “one axis” along Ronghua Road, National Xinchuang Park and the “two wings” of the International Pharmaceutical Innovation Park and provides support such as rental subsidies for office space.
4.2.2. Green-Led Type
M2 contains M2a and M2b, and in M2a and M2b, the core conditions of the two are the same. There is a substitution relationship in the marginal conditions, and the existence of new energy plays a central role, which means that at a significant amount of wind power and solar energy utilization, the other conditions are not important for a high level of TFP. Compared with other conditions, new energy is particularly important for high levels of TFP, and if a province (region) pays attention to the development of new energy and takes effective measures, it can achieve high levels of TFP even without high levels of new manufacturing, new services or a new environment. This also means that regional attention to new energy issues can effectively break the constraints of objective conditions such as innovation, the environment and industry on a region’s ability to improve TFP, thus naming this model green-led.
The consistency of grouping 2 is 0.922, and the case coverage of this path is 60.6%. This route can provide information regarding 60.6% of the total factor productivity cases. The typical provinces associated with green-led new quality productivity include Hebei, Inner Mongolia, Shanxi, Gansu, Qinghai, and Ningxia. Inner Mongolia, Gansu, Qinghai and other places are blessed with wind and solar energy resources with high development value, and the local authorities vigorously promote the large-scale construction of wind power and photovoltaic projects, as well as actively explore and practice “PV+” diversified and comprehensive application modes, such as the complementary use of agriculture and photovoltaics, the integration of fisheries and photovoltaics, and the creation and application of renewable energy sources such as biomass and hydrogen. It also actively explores and practices “PV+” diversified and comprehensive application modes, such as complementary agriculture and PV, the integration of fisheries and PV, and the development and utilization of hydrogen energy, biomass energy and other emerging energy. These regions have responded positively to the national policy call for new energy development by issuing a number of local policy publications, such as the “Regulations on Promoting New Energy Development in Hebei Province”, the “Seven Policies and Measures of the Inner Mongolia Autonomous Region on Supporting the Construction of ‘Optical Storage and Charging’ Integration Projects and Assisting the Development of Green Transportation to Further Promote the Consumption of New Energy”, and the “Provincial (Regional)” and “Regional” policies and measures. The “14th Five-Year” Renewable Energy Development Plan of each province (region) provides solid policy assurance for the growth of new energy.
4.2.3. Service-Embedded Type
M3 indicates a high level of solar energy utilization, a substantial amount of financial service development, and a non-high level of wind power utilization as the core conditions, supplemented by a high level of product innovation, a high level of process innovation, a high level of scientific research service development, a high digital environment, and a high business environment as the peripheral conditions. This group of provinces reflects the fact that, in an underdeveloped new energy environment, the region achieves high levels of TFP mainly through the role of new manufacturing, new services, and a new environment.
The regularity of grouping 3 is 0.893, the distinct coverage is 0.109, the original coverage is 0.261, and the path is able to explain approximately 26.1% of the TFP cases. The typical province belonging to the service-embedded type is the Zhejiang Province, which focuses on superior development and improvement in innovation capacity in the production service industry in the process of development. On the one hand, it encourages modernization and changes in the conventional production service industry by introducing cutting-edge technologies and management models; on the other hand, it actively cultivates new business forms and service models, such as intelligent manufacturing services, supply chain finance, and digital logistics, for the purpose of meeting demand in the market for new quality productivity. In addition, Zhejiang also focuses on the role of innovation platforms, such as the opening of the AIGC Intelligent Computing Center in Turing Town, which offers substantial assistance for the advancement of the field of artificial intelligence. Zhejiang Province is dedicated to establishing a rule-of-law, market-oriented, and global business environment and provides businesses with a fairer and more transparent market environment through measures such as relaxing market access and strengthening market supervision. According to the survey report titled “Ten Thousand Private Enterprises Evaluating the Business Environment” published by the All-China Federation of Commerce and Industry in 2023, Zhejiang Province’s business environment is among the top ten in the national ranking.
4.3. Paths of Total Factor Productivity Differentiation Among East, Central and West China
Due to the influence of economic level, infrastructure, resource endowment, geographic location, and other factors, the degree of new quality productivity varies noticeably depending on the area, i.e., regional heterogeneity. This inevitably affects the high-level TFP path in East China, West China, and Central China. This study divides the eastern, central, and western provinces [43]. Through a comparative analysis of the TFP in each region, we explore the effects of the new manufacturing level, new energy level, new service level, and new environment level on the local TFP in different regions, as shown in Table 4.
Table 4.
Total factor productivity (high-level) groupings of East, Central, and West China.
4.3.1. “Leading the Way” in East China
Two sets of groupings (paths), E1 and E2, exist for the generation of high TFP in the eastern region. E1 shows that, under the circumstances of low levels of solar energy utilization, low levels of wind power utilization, and a non-advantageous digital environment and business environment, the development of a high scientific research service industry as a core condition, the development of a high level of product innovation, a high level of technological innovation, and a high level of financial services as a peripheral condition constitute groupings that could likewise generate a high level of results of TFP. A typical province belonging to E1 is Hebei, where the development of its financial services industry has been relatively fast, even though there are still gaps in the digital and business environment compared with some advanced provinces. With the continuous improvement in the financial market and the innovation of financial instruments, enterprises in the Hebei Province are able to obtain financial support more easily, which promotes scientific and technological innovation and industrial upgrading. E2 shows that the goal of high TFP can be achieved with a low level of wind power utilization, a high level of solar energy utilization, the development of scientific research services, and a high-quality digital environment as the core conditions, and with product innovation, process innovation, the development of financial services, and a good business environment as the peripheral conditions. A typical city belonging to the eastern grouping is Tianjin. Tianjin adheres to the strategic pull of Beijing–Tianjin–Hebei coordinated development; jointly builds “six chains and five clusters”; focuses on high-end instrumentation and industrial mother machines, network security, the industrial internet, and other key industrial chains to supplement and extend the chain; focuses on building world-class advanced manufacturing clusters; and presses the “fast-forward button” on the biomedical, new energy, new materials, aerospace, intelligent technology, and other emerging industries. This emphasis focuses on expanding the application scenarios of Xinchuang, promoting the industrialization of innovative drugs, and improving the supporting facilities of the aerospace industry.
4.3.2. Central “Follow-the-Leader” Development
There are two groupings (paths) of M1 and M2 for the generation of high TFP in the central region. M1 indicates that a high level of TFP can be achieved with non-high scientific research services as the core condition, even without a high product innovation level, high process innovation level, good digital environment and business environment, and with high level of solar energy utilization, high level of wind power utilization, and high development of financial services as the marginal conditions. The typical province belonging to the M1 grouping is Shanxi, which is located in the Yellow River’s several bends and serves as a clean energy base, with rich PV application scenarios and advantages in terms of natural resources; specifically, some areas in Shanxi have more than 3000 h of sunshine per year, which is a high value of solar energy and provides natural advantages for PV power generation. M2 indicates that a high product innovation level, high process innovation level, and a good digital and business environment are the marginal conditions, even if the new energy synthesis level, high wind power utilization level, and high financial service development are marginal conditions that can also achieve a high level of TFP. Given that the environment is a marginal condition, even if the level of comprehensive utilization of new energy is not high and the comprehensive development of new services is not perfect, it will drive the region to improve TFP. The typical province belonging to the M2 configuration is Jiangxi, where the pharmaceutical industry has a strong foundation, with a number of pharmaceutical industry clusters, such as Jinxian medical devices and Zhangshu pharmaceuticals. The pharmaceutical industry has continued to innovate and develop; has built a complete industrial chain system covering the fields of traditional Chinese medicine, chemical drugs, biological drugs and medical devices; and has successfully created a new model of “medicine +” integration and development. The textile industry is actively promoting intelligent and green transformation, enhancing the products’ additional value, and gradually realizing the subversive innovation mode of whole-chain transformation and “high-level grafting”. The central region has the geographical advantages of taking over the east and leading the west, as well as connecting the south and the north. Compared with the central area, the eastern region has a low level of new productivity development, a labor-intensive industrial structure, insufficient use of new energy and pollution reduction, significant innovation potential and latecomer advantages, and it is in the “follow-leader” stage of development.
4.3.3. “Running with the Pack” Development in the West
The generation of high TFP in the western region has two groupings (paths), W1 and W2. W1 indicates that, in regions with non-high-tech manufacturing, non-high-tech services, and non-high industrial digitization levels, the use of new energy as the core condition and good pollution reduction and abatement as the marginalization condition can also improve TFP. The typical provinces belonging to the W1 grouping are Inner Mongolia, Ningxia, and Xinjiang, which rely on unique geographic locations. These areas are rich in resources, coal, oil, gas, and mineral reserves, coupled with high green vegetation coverage and green development running out of the “acceleration”; however, the number of digital industries is scarce, the digitalization level of the industry is low, the market appeal is insufficient, the innovative potential has not been fully tapped, and the new quality of the industry is not sufficient. W2 shows that a high innovation development level, high technology market development, high-tech energy utilization, and high industrial digitization are the core conditions, and the development of the productive service industry and living service industry as peripheral conditions results in high TFP in the region. The typical province belonging to the W2 grouping is Shaanxi, which has balanced development in all dimensions, although it has the energy industry as the “ballast”; however, combined science, technology, and business industries are not close, the degree of digital industrialization has not fully developed, the overall level of new productivity is low, and it is in the old and new kinetic converter, which is in urgent need of “accumulating momentum and empowering” for TFP. Compared with the central and eastern regions, the western region has the advantage of natural resources, particularly in relation to renewable energy; however, the development of the digital industry and modern service industry is lagging, and competitiveness is weak. To accelerate the development process of new quality productivity, we draw on and learn from advanced experiences.
5. Discussion and Implications
5.1. Discussion
Promoting the productivity of all factors through the lens of new quality productivity is the key to realizing high-quality development. This study adopts the fsQCA method and selects China’s thirty provinces as examples. Through condition grouping analysis, we explore the linkage effects and driving paths of new manufacturing, new energy, new services and new environmental factors on regional TFP in detail and reveal the key core conditions affecting TFP. The study yielded the following results.
- Overall, new manufacturing, new energy, new services, and new environmental factors do not individually constitute high total factor productivity conditions, suggesting that individual factors do not constitute bottlenecks to high TFP. At the level of the full sample of 30 provinces, there are four groups of high TFP conditions, i.e., three driving paths, which can be categorized as innovation-driven, green-led, and service-embedded.
- Behind high TFP is the interaction of multiple factors, and it is crucial to consider multiple factors when formulating economic policies and development strategies, as each factor effectively combines and enhances regional TFP in a “different paths to the same destination” mode.
- Due to the different characteristics of resources, geographic locations and degrees of economic development of different regions, the differences between regions are obvious. High factor productivity differentiation is evident in the eastern, central, and western regions of China. This is manifested in the “leading” development of the east, the “following” development of the center, and the “accompanying” development of the west. The significant differences in the driving paths of high factor productivity also illustrate the wide variety of conditions that contribute to the heterogeneity of the productivity of all factors, as seen through the lens of new quality productivity.
5.2. Practical Implications
5.2.1. Promoting Multifactor Synergies
Given that new manufacturing, new energy, new services, and new environmental factors alone do not constitute sufficient conditions for high total factor productivity, emphasis should be placed on synergies and integration among them. Governments and enterprises, as the key actors in the promotion process, should work together to implement a comprehensive development strategy, which needs to accurately connect with the frontiers of technological innovation, lead the wave of industrial upgrading, accelerate the green transformation of the energy structure, and continue to explore the boundaries of innovation in the service model. Through policy guidance, resource allocation optimization, market mechanism innovation, and other multidimensional means, the efficient transformation and application of technological innovation results will be promoted to push the industrial structure in the direction of more advanced and rationalized development while accelerating the transformation of the energy system to a low-carbon, clean and efficient path, leading the service industry in a more astute, personalized, and modernized direction. The organic combination of this series of initiatives will effectively stimulate the synergistic effect among various factors, which will not only promote a notable rise in the productivity of all factors, but also profoundly reshape the power structure of economic growth, injecting a powerful catalyst for achieving superior economic development.
5.2.2. Strengthening Innovation-Driven Development Strategies
Innovation, as a core driver of economic growth, is a key factor in increasing TFP. To this end, we need to continue to increase funding for technology and science innovation, provide adequate support at the level of fiscal and tax policies, and guide the active investment of social capital, with the aim of building a diversified and comprehensive investment system for innovation in science and technology. Concurrently, we should build an innovation system that deeply integrates industry, academia, and research and support businesses, academic institutions, and scientific research centers to strengthen cooperation; jointly conduct fundamental research and applied research and development; and devote ourselves to solving the key technological bottlenecks and “tricky” problems constraining the development of the industry. In addition, it is particularly important to produce a sound and efficient system for changes in scientific and technological accomplishments and encourage the transformation of technology and scientific accomplishments from the laboratory to the market and into real-life productive forces by optimizing the transformation process, improving the incentive mechanism and strengthening the defense of rights to intellectual property. This process is also indispensable for creating an open and inclusive innovation environment, and we should actively build an international exchange platform to attract top talent and innovation resources from both domestic and international resources, forming a good ecology of free sharing of innovation outcomes and the flow of innovation components and injecting inexhaustible power to increase total factor productivity.
5.2.3. Development of a Green-Led Economy
The development of green technology and sectors that protect the environment should be encouraged, and enterprises should embrace renewable energy, low-carbon and ecologically sustainable technologies and equipment in the production process through policy guidance mechanisms and market mechanisms to lower environmental pollution and resource usage. These actions consist of, but are not restricted to, offering tax breaks, green credit support, and the composition and mandatory implementation of guidelines for environmental protection, which are aimed at lowering the cost thresholds for implementing green technology by businesses and enhancing their marketplace. These actions include but are not restricted to, the provision of tax incentives, green credit support, and developing and implementing environmental laws and protection guidelines. They aim to lower the cost threshold for enterprises to embrace green technologies, increase their competitiveness in the market, and encourage them to take up the social responsibility of reducing the use of resources and damage to the environment while seeking financial gain. Moreover, investment in and R&D of green energy (such as wind and solar power) should be accelerated to increase its share in the energy mix. As an important part of the creation and application of sources of renewable energy, including solar and wind, the future energy grid can not only effectively alleviate the pressure of fossil energy depletion but also significantly lower greenhouse gas emissions and fight global warming. Therefore, the government should increase financial subsidies and technical support for green energy projects, encourage technological innovation and industrial upgrading, accelerate the commercialization process of green energy technologies, build a perfect green energy market system, promote fair competition between green energy and traditional energy sources by means of marketization, and gradually increase the proportion of green energy in the overall energy structure to establish a strong basis for realizing the green transformation of the energy structure.
5.2.4. Encouraging the Close Integration of Services and Manufacturing
The service-embedded model suggests that the combination of modern industries with modern services can significantly increase TFP. Therefore, enterprises should be encouraged to expand into productive services. Productive services, such as R&D and design, finance services, information technology services, and supply chain management, are important bridges that connect producers and consumers and promote industrial upgrading. Enterprises should actively grasp this trend and continuously expand and optimize the supply of productive services through internal incubation, external cooperation or cross-border integration. Additionally, the government should provide policy assistance to serve as a guide, facilitate market access, and provide financial support to create favorable conditions for enterprises to expand the field of productive services. Through the in-depth practice of the service-embedded model, enterprises can build a more flexible, efficient, and synergistic value creation system and improve their market and core competitiveness adaptability. At the same time, this will also promote the synergistic development and profound integration of modern industry and the modern service industry, injecting a powerful catalyst for the economy’s superior growth.
5.2.5. Implementation of a Differentiated Regional Development Strategy
To promote development that is coordinated with the national economy, deeply grasping the unique conditions and stages of development of each region and formulating differentiated regional development strategies and corresponding policy support measures according to local conditions are essential. Specifically, the eastern region, as an early stage of economic development, should continue to give everything to its advantages of strong innovative capacity and a high degree of openness, focus on modern service industries and high-tech industries, lead national industrial upgrading and high-quality development trends, strengthen docking with the international market, broaden the scope of cooperation, and enhance international competitiveness. The central region should actively integrate into the overall situation of regional coordinated development, strengthen cooperation and linkages with the eastern region, take the initiative to undertake the transfer of industries from the east, and, through the introduction of technology and reinnovation through digestion and absorption, upgrade its own industrial level and value chain position and realize leapfrog development. The western region needs to maintain the core concept of ecological priority and green development, simultaneously strengthen ecological protection and restoration, accelerate the pace of infrastructure construction, and establish a strong basis for social and economic advancement. Moreover, the unique natural resources and human landscape advantages of the western region encourage the growth of the regional characteristics of green industry, cultural tourism, and other new industrial sectors to foster and encourage the development of new economic growth points. This will encourage the sustained growth and diversity of the regional economy.
6. Conclusions
This study makes an important theoretical breakthrough, challenging the conventional wisdom that a single factor determines high total factor productivity (TFP). By deeply analyzing the impact of new manufacturing, new energy, new services, and new environmental factors on new quality productivity, we find that these factors alone are not sufficient to constitute a sufficient condition for high TFP. Instead, the interaction of multiple factors plays a key role in the formation of high TFP. This finding provides a new theoretical perspective for understanding the multiplicity and complexity of regional economic development and helps to break the limitations of single-factor determinism.
In terms of empirical evidence, this study utilizes data from 30 provinces and reveals three main driving paths for high TFP through a cohort study: innovation-driven, green-led, and service-embedded. These paths reflect the characteristics and advantages of different regions in economic development, providing valuable empirical evidence for policy makers. In addition, the study finds significant differences in high factor productivity among the eastern, central, and western regions, and points out the characteristics of their respective development. This finding not only reveals the imbalance in regional economic development, but also provides an important reference for regions to formulate differentiated development strategies.
Future research is also aimed at combining the theories and methods of multiple disciplines, such as economics, management, and environmental sciences, to more comprehensively analyze the mechanism of the impact of new quality productivity on TFP. Through interdisciplinary cooperation and communication, a more comprehensive and scientific guidance system can be promoted to provide more precise and effective policy recommendations for regional economic development. In addition, based on the regional differences and driving paths found in this study, future research can further explore how to formulate more precise and effective regional economic policies and development strategies, so as to promote the balanced and sustainable development of all regions and contribute to the construction of a new pattern of high-quality development.
Author Contributions
Conceptualization, K.L., M.C. and Q.Z.; data curation, M.C.; formal analysis, K.L., M.C. and Q.Z.; funding acquisition, K.L.; methodology, K.L., M.C. and Q.Z.; supervision, K.L., M.C. and Q.Z.; software, M.C.; writing—original draft, K.L. and M.C.; writing—review and editing, K.L., M.C. and Q.Z. All authors have read and agreed to the published version of the manuscript.
Funding
The National Social Science Foundation of China, Research on the Theoretical Logic, Realization Mechanism and Practical Path of the Deep Integration of China’s Industrial Chain and Innovation Chain (22BJY103); Key Project for 2023 on Industry-Education Integration Research at Undergraduate Universities in Henan Province(21): Research and Practice of an Innovative Talent Training Curriculum System for ’New Business Studies’ under the Perspective of Industry-Education Integration.
Institutional Review Board Statement
Not applicable.
Informed Consent Statement
Not applicable.
Data Availability Statement
Data are available in a publicly accessible repository.
Conflicts of Interest
The authors declare no conflicts of interest. The funders had no role in the design of the study; in the collection, analyses, or interpretation of data; in the writing of the manuscript; or in the decision to publish the results.
References
- Fan, G. The Logic, Multidimensional Connotation and Significance of “New Quality Productivity”. Rev. Political Econ. 2023, 14, 127–145. [Google Scholar]
- Solow, R.M. Technical change and the aggregate production function. Rev. Econ. Stat. 1957, 39, 312–320. [Google Scholar] [CrossRef]
- Zhai, X.; An, Y. The relationship between technological innovation and green transformationeffciency in China: An empirical analysis using spatial panel data. Technol. Soc. 2021, 64, 101498. [Google Scholar] [CrossRef]
- Zhang, J.; Chang, Y.; Zhang, L. Do technological innovations promote urban green development?-Aspatial econometric analysis of 105 cities in China. J. Clean. Prod. 2018, 182, 395–403. [Google Scholar] [CrossRef]
- Griliches, Z. Productivity, R&D and Basic Research at Firm Level in the1970s. Am. Econ. Rev. 1986, 76, 141–154. [Google Scholar]
- Mairesse, J.; Hall, B. Estimating the Productivity of Research and Development in French and US Manufacturing Firs: An Exploration of Simultaneity lssues with GMM Methods. In International Productivity Difference and their Explanations; Wagner, K., Van Ark, B., Eds.; Elsevier Science: Amsterdam, The Netherlands, 1996; pp. 285–315. [Google Scholar]
- Dilling-Hansen, M.; Eriksson, T.; Madsen, E.S.; Smith, V. Research and Development and Productivity: Evidence from Danish Firm-Level Data; International Advances in Columbia University Press: New York, NY, USA, 1966. [Google Scholar]
- Liu, G.; Wang, B.; Zhang, N. A coin has two sides: Which one is driving China’s green TFP growth? Econ. Syst. 2016, 40, 481–498. [Google Scholar] [CrossRef]
- Li, J.; Chen, L.; Chen, Y.; He, J. Digital economy, technological innovation, and green economic efficiency—Empirical evidence from 277 cities in China. Manag. Decis. Econ. 2022, 43, 616–629. [Google Scholar] [CrossRef]
- Zhao, C.; Wang, W.; Li, X. How digital transformation affects enterprise total factor productivity. Financ. Trade Econ. 2021, 42, 114–129. [Google Scholar]
- Zhao, T.; Zhang, Z.; Liang, S. Digital economy, entrepreneurial activity and high-quality development-Empirical evidence from Chinese cities. Manag. World 2020, 36, 65–76. [Google Scholar]
- Shen, S.; Li, X.; Dang, L. Business environment and enterprise total factor productivity. Econ. Manag. Res. 2021, 42, 124–144. [Google Scholar]
- Guner, V.G. Macroeconomic Implications of Size-Dependent Policies. Rev. Econom. Dyn. 2008, 11, 721–744. [Google Scholar] [CrossRef]
- Restuccia, D.; Rogerson, R. Policy distortions and Aggregate Productivity with Heterogeneous Establishments. Rev. Econ. Dyn. 2008, 11, 707–720. [Google Scholar] [CrossRef]
- Hopenhayn, H.A. Firms, Misallocation, and Aggregate Productivity: A Review. Annu. Rev. Ofeconomics 2014, 6, 735–770. [Google Scholar] [CrossRef]
- Li, P. Paths and influencing factors of enhancing total factor productivity—A combing analysis of growth accounting and frontier surface decomposition perspectives. Manag. World 2016, 9, 1–11. [Google Scholar]
- Xi, J. Firmly grasp the strategic positioning in the overall development situation of the country and strive to create a new situation of high-quality development in Heilongjiang. People’s Daily, 9 September 2023. (In Chinese) [Google Scholar]
- Marx and Engels Collected Works; People’s Publishing House: Beijing, China, 2009; Volume 7.
- Zhou, W.; Xu, L. On New Quality Productivity: Connotation Characteristics and Important Focus Points. Reform 2023, 10, 1–13. [Google Scholar]
- Zhou, W.; Zhang, Y. New quality productivity and high-quality development: Intrinsic connection and key breakthrough. Acad. Res. 2024, 6, 73–82. [Google Scholar]
- Huang, Q. What is “New” in New Quality Productivity. Ningbo Econ. (Financ. Econ.) 2024, 2, 12–14. [Google Scholar]
- Hong, Y. Developing new quality productivity to build modernized industrial system. Contemp. Econ. Res. 2024, 2, 7–9. [Google Scholar]
- Wang, J.; Wang, R. New quality productivity: Indicator construction and spatio-temporal evolution. J. Xi’an Univ. Financ. Econ. 2024, 37, 31–47. [Google Scholar]
- Sun, L.; Guo, J. Construction and empirical measurement of new quality productivity evaluation index system. Stat. Decis. Mak. 2024, 40, 5–11. [Google Scholar]
- Zhao, R.; Song, X.; Chen, H. New quality productivity, new industrialization and high-quality development. Financ. Econ. 2024, 6, 1–14+25. [Google Scholar]
- Zhang, S.; Wen, J. Digital economy empowers new quality productivity: An analytical framework. Contemp. Econ. Manag. 2024, 46, 1–9. [Google Scholar]
- Li, X.; Wang, L.; Zhang, Y. Spatio-temporal evolution pattern of new quality productivity development in the Yangtze River Economic Belt and its influencing factors. Yangtze River Basin Resour. Environ. 2024, 33, 909–923. [Google Scholar]
- Zhou, J. Research on the statistical measurement, spatial dependence and influence mechanism of new quality productivity from the perspective of factor inputs for high-quality development. Stat. Manag. 2024, 39, 6–16. [Google Scholar]
- Liu, S.; Du, W. Research on low-carbon transformation of energy structure fueled by new quality productivity. J. China Univ. Min. Technol. (Soc. Sci. Ed.) 2024, 26, 47–66. [Google Scholar]
- Hu, Y. Exploration of the Connotation, Characteristics and Path of New Quality Productivity. J. Xinjiang Norm. Univ. (Philos. Soc. Sci. Ed.) 2024, 45, 36–45+2. [Google Scholar]
- Du, C. New quality productive forces form a powerful driving force for development. People’s Forum 2023, 21, 26–30. [Google Scholar]
- Zhang, L.; Pu, Q. Connotative Characteristics, Theoretical Innovation and Value Implications of New Quality Productivity. J. Chongqing Univ. (Soc. Sci. Ed.) 2023, 29, 137–148. [Google Scholar]
- Gong, B.; Yuan, L. Total factor productivity in agriculture under the perspective of new quality productivity: Theory, measurement and empirical evidence. Probl. Agric. Econ. 2024, 4, 68–80. [Google Scholar]
- Zhang, J.; Xu, R.; Sun, A.; Zhang, M. The impact of higher education development on total factor productivity: A perspective of developing new quality productivity. High. Educ. Manag. 2024, 18, 38–51+73. [Google Scholar]
- Shi, D.; Sun, G. Data factors and new quality productivity: Based on the perspective of enterprise total factor productivity. Econ. Theory Econ. Manag. 2024, 44, 12–30. [Google Scholar]
- Cai, X.; He, Z. How New Quality Productivity Affects Total Factor Productivity: The Mechanism and Test of Science and Technology Innovation Effect. Contemp. Econ. Manag. 2024, 46, 1–14. [Google Scholar]
- Liu, W.X.; Zhao, Q.S. Profound Connotation, Significance and Practical Requirements of Xi Jinping’s Important Discourse on New Quality Productivity. J. Jiangxi Univ. Financ. Econ. 2024, 4, 13–23. [Google Scholar]
- Yang, R. Research on total factor productivity of Chinese manufacturing enterprises. Econ. Res. 2015, 50, 61–74. [Google Scholar]
- Charnes, A.; Cooper, W.W.; Rhodes, E. Measuring the Efficiency of Decision Making Units. Eur. J. Oper. Res. 1978, 2, 429–444. [Google Scholar] [CrossRef]
- Fare, R.; Grosskopf, S.; Norris Zhang, Z. Productivity Growth, Technical Progress and Effciency Changes in Industrialized Countries. Am. Econ. Rev. 1994, 84, 66–83. [Google Scholar]
- Ragin, C.C.; Fiss, P.C. Net Effects Analysis Versus Configurational Analysis: An Empirical Demonstration. Redesigning Soc. Inq. Fuzzy Sets Beyond 2008, 240, 190–212. [Google Scholar]
- Du, Y.; Liu, Q.; Chen, K.; Xiao, R.; Li, S. Multiple models of business environment ecology, total factor productivity and urban high-quality development—A group analysis based on the complex system view. Manag. World 2022, 38, 127–145. [Google Scholar]
- Shen, S.B.; Chen, Y.; Lin, B.Q. Impact of technological progress and industrial structure distortion on energy intensity in China. Econ. Res. 2021, 56, 157–173. [Google Scholar]
Disclaimer/Publisher’s Note: The statements, opinions and data contained in all publications are solely those of the individual author(s) and contributor(s) and not of MDPI and/or the editor(s). MDPI and/or the editor(s) disclaim responsibility for any injury to people or property resulting from any ideas, methods, instructions or products referred to in the content. |
© 2025 by the authors. Licensee MDPI, Basel, Switzerland. This article is an open access article distributed under the terms and conditions of the Creative Commons Attribution (CC BY) license (https://creativecommons.org/licenses/by/4.0/).