Article

Simulation of Renewable Energy Systems with Alternative Energy Scenarios in Turkey’s Electrical Energy Planning

1
Department of Industrial Engineering, Atatürk University, Erzurum 25100, Turkey
2
Department of Industrial Engineering, Erzurum Technical University, Erzurum 25050, Turkey
*
Author to whom correspondence should be addressed.
Sustainability 2025, 17(6), 2665; https://doi.org/10.3390/su17062665
Submission received: 11 February 2025 / Revised: 9 March 2025 / Accepted: 14 March 2025 / Published: 17 March 2025

Abstract

:
The rise in global energy demand and the escalating impacts of the climate crisis have made the rapid reduction of CO2 emissions imperative. In response, Turkey has committed to achieving net-zero carbon emissions by 2053 in alignment with the Paris Agreement, emphasizing the critical role of energy transition strategies in meeting this goal. To explore these strategies, this study developed four distinct scenarios encompassing the electricity, transportation, industry, and heating sectors using the EnergyPLAN (v16.22) software. While the first three scenarios focus on renewable energy, aiming to increase the share of renewables from 45% in 2025 to 82% in 2040, the fourth scenario incorporates nuclear energy, achieving greater CO2 reductions despite a relatively lower share of renewables. These scenarios were simulated using the EnergyPLAN model, and the results were analyzed in detail. The modeling outcomes indicate that sustainable energy transition is both environmentally and economically feasible. Additionally, a sensitivity analysis was conducted to assess variations in energy demand, and a cost–benefit analysis was performed to evaluate the economic viability of the scenarios. By adopting a multi-sectoral approach, an aspect rarely explored in the literature, this study provides a comprehensive analysis of nuclear and renewable energy combinations. Furthermore, qualitative analytical methods, including grounded theory and semantic analysis, were employed to elucidate the relationship between energy policies and modeling scenarios. In this regard, the study not only contributes to the academic literature but also offers a scientifically grounded framework to support decision-making processes for policymakers and energy sector professionals.

1. Introduction

Considering that energy is a key factor for economic development and climate change action, Turkey must develop a robust energy transition roadmap that is vital for both economic growth and public health. In this regard, preparing a comprehensive “net-zero roadmap” that encompasses the entire economy, with all sectors and policy areas focusing on the net-zero commitment, is of critical importance. Within this framework, defining interim targets and corresponding action plans in climate and energy policies, along with their policy mechanisms, will be essential. This transition process will pave the way for Turkey to achieve its net-zero emissions target by leveraging its high potential in energy efficiency and renewable energy sources. Along with renewable energy and energy efficiency, another crucial pillar of energy transition is electrification. Since the increase in electrification will play a significant role in decarbonizing all sectors of the economy, the electricity sector is expected to take the lead in the energy transition and the decarbonization of other sectors [1]. In this context, it is inevitable for countries to focus on generating more energy from domestic and renewable energy sources to provide their citizens with a cleaner world. Aligning with this global trend, Turkey is taking steps to enhance its energy production capacity to ensure energy supply security and establish sustainable energy policies. As of the end of March 2024, Turkey’s total installed power capacity has reached 107,959 MW. The distribution of installed capacity by energy sources, as shown in Figure 1, is as follows: 29.6% from hydroelectric power, 23.2% from natural gas, 20.2% from coal, 11.2% from wind, 11.7% from solar, 1.6% from geothermal, and 2.5% from other sources [2].
According to the ‘National Energy Balance Tables 2022’ published by the Ministry of Energy and Natural Resources (ETKB) of the Republic of Turkey in November 2023, Turkey’s total energy consumption in 2022 evaluated on a sectoral basis increased by approximately 10% compared to 2019, the year before the COVID-19 pandemic. This brought the total energy consumption to 120.2 million tons of oil equivalent (mtoe). However, total energy consumption in 2022 was 2.4% lower than in 2021 [3].
As shown in Figure 2, the industrial sector remained the highest energy-consuming sector in Turkey in 2022. That year, the industrial sector accounted for 31.7% of total final energy consumption, while the transportation sector accounted for 25.6%, residential consumption for 22.2%, and the commercial and services sectors for 10.5%. The remaining energy consumption was attributed to agriculture, livestock, and non-energy use. As of today, Turkey’s energy demand is primarily met by fossil fuels. However, due to the non-renewable nature of fossil fuels and their environmental impact, transitioning to renewable energy is a primary objective of government policies. Within this scope, this study aims to develop various scenarios based on the objectives of increasing renewable energy utilization and reducing carbon dioxide emissions, ultimately formulating a roadmap for transition to renewable energy.
The remainder of this study is structured as follows: Section 2 presents a comprehensive literature review, comparing existing studies while highlighting the originality and contributions of this study to the literature. Section 3 provides an overview of the EnergyPLAN model, discusses its advantages over alternative methods, and details all input data used in the model, along with an evaluation of the dataset’s accuracy. In Section 4, the criteria for scenario development are defined, and alternative scenarios are created. The modeling process is explained in detail, and the scenarios are analyzed. Section 5 begins by validating the model using a reference scenario and conducting error analyses to assess its accuracy. Subsequently, a cost–benefit analysis is carried out to evaluate the economic feasibility of the scenarios. A sensitivity analysis is also performed to examine the impact of energy demand variations on system performance, followed by an evaluation and interpretation of the results. Finally, Section 6 summarizes the key findings of the study, discusses the results, and emphasizes the study’s practical and academic contributions. Additionally, recommendations for future research are provided.

2. Literature Research

The transition to renewable energy and energy system modeling studies have gained significant importance in line with sustainable development goals. In the literature, most studies in this context focus on a specific sector or energy source, while integrated and holistic analyses remain limited. EnergyPLAN software is widely used for modeling renewable energy integration and carbon emission reduction scenarios. However, the way this software is utilized and the findings obtained vary significantly depending on the scope of each study. Summaries of the studies related to this research topic in the literature are presented in Table 1.
The literature review indicates that the transition to renewable energy is addressed through various modeling approaches worldwide. Studies reveal that smart energy systems, Vehicle-to-Grid (V2G) technology, energy storage, and sectoral integration play a critical role in energy transformation. Regional analyses demonstrate that countries adopt different strategies depending on their existing infrastructure and energy policies. While energy efficiency and heating systems are prominent in Europe, renewable energy integration and energy security take precedence in Asia and Latin America. Regarding the gaps in the literature, EnergyPLAN software has been frequently utilized for comprehensive analyses on renewable energy integration and carbon emission reduction. However, its application in the literature has often been limited to specific sectors. For instance, studies [5,7] focus on renewable energy integration but overlook key sectors such as transportation and industry, which are crucial for energy transition. These limitations hinder the development of a realistic and feasible modeling framework for energy transition strategies. One study that provides a more advanced scope is [8], which demonstrates that integrating energy systems in Zagreb can enhance system efficiency. However, this analysis is geographically confined to a single city and does not yield insights that can be generalized to a national or global context. This limitation restricts the contribution of local solutions to macro-level energy policies. Many existing studies in the literature remain confined to technical analyses, neglecting the social, political, and economic dimensions of energy transition. For example, study [22] examines the environmental impacts of increasing renewable energy capacity in Slovakia but does not address critical factors such as societal acceptance, the influence on decision-making processes, or regional policy uncertainties. Such studies fail to adequately reflect the reality that energy system transformations are not merely technological issues. Similarly, study [9] develops scenarios for energy transition goals in China’s Sichuan region but does not consider social dynamics or the long-term impacts of energy policies. These shortcomings make it challenging to optimize energy transition scenarios in a way that is both publicly acceptable and capable of delivering long-term benefits. Although nuclear energy is frequently discussed as a low-carbon energy source, studies that comprehensively compare it with renewable energy sources are relatively limited in the literature. Studies [6,28] highlight the role of nuclear energy in reducing Turkey’s energy dependency but do not provide a detailed analysis of how this role can be balanced with renewable energy. This gap prevents policymakers from receiving sufficient guidance on which strategies would be more sustainable in the long term. Another overlooked aspect in the literature is the resilience of energy transition scenarios to future uncertainties. Study [30] evaluates the adaptability of energy systems to future conditions but does not sufficiently detail economic uncertainties, fluctuating technology costs, or variations in climate policies. Analyzing such uncertainties in future scenarios would enhance the technical and social feasibility of energy transition strategies. This study significantly expands the technical and economic boundaries of energy transition scenarios by integrating the electricity, transportation, industry, and heating sectors—an approach rarely addressed in the literature. Moreover, it provides a more in-depth examination of the interactions between these sectors. This holistic approach underscores that sectoral integration is not merely an ideal solution but a practical necessity. The relationship between nuclear energy and renewable energy sources has often been examined in the literature from a superficial and limited perspective. However, this study fills a crucial gap by comprehensively comparing scenarios with and without nuclear energy in terms of environmental impacts, carbon emissions, and long-term costs. The scenarios developed using EnergyPLAN software offer a concrete and feasible roadmap for Turkey to achieve its net-zero carbon targets by 2053, while also proposing solutions to the challenges encountered in this process. This study not only provides a theoretical contribution but also presents a robust and applicable framework for Turkey’s energy transition process. It can be stated that there are very few studies in the literature that encompass such a broad and multi-sectoral integration while also comparing nuclear-inclusive scenarios at this level of comprehensiveness. In this respect, our study not only fills a significant gap in the academic field but also offers valuable insights to policymakers, environmental activists, and energy sector professionals. It provides critical information that will contribute to guiding Turkey’s energy transition decisions in a more informed, sustainable, and strategic manner.

3. Materials and Methods

In this study, the EnergyPLAN software (v16.22) was used to model and analyze scenarios for Turkey’s energy transition. EnergyPLAN is a powerful Delphi-based simulation tool designed to develop sustainable strategies for reducing carbon emissions by integrating different sectors of energy systems (electricity, heating, transportation, industry, etc.). It simulates the operation of the energy system on an hourly basis. Since EnergyPLAN is developed based on a model that prioritizes carbon-free energy production, it gives precedence to renewable energy sources in its simulations [32]. The selection of this software was influenced by its ability to provide comprehensive and multi-sectoral analysis, its suitability for long-term energy planning, and the high level of control it offers to users. By analyzing different sectors together, EnergyPLAN enables a better understanding and optimization of energy system dynamics. In this study, EnergyPLAN was preferred for the following reasons:
Among the energy modeling tools presented in Table 2, EnergyPLAN stands out with its hourly simulation capability and sectoral integration in national/regional energy systems. While MARKAL/TIMES and MESSAGE focus on long-term optimization and economic–environmental analyses, they may lack the necessary temporal resolution at the operational level. LEAP offers a scenario-based flexible approach; however, it is more suitable for demand-side analyses and has limitations in terms of comprehensive energy system integration. HOMER and RETScreen are designed for microgrid analysis and renewable energy feasibility studies, providing detailed assessments at the local level but falling short in the holistic analysis of large-scale energy systems. EnergyPLAN provides a robust framework for both reducing carbon emissions and optimizing total system costs. Its sectoral integration and hourly simulation capabilities make it one of the most suitable options for comprehensive studies, such as renewable energy integration and national energy planning. These features offer a significant advantage for policymakers and researchers aiming to develop sustainable, efficient, and resilient energy systems.
In this study, different scenarios for Turkey’s long-term energy planning were developed using the EnergyPLAN model. Thanks to the model’s detailed analytical capabilities, key aspects such as energy supply security, cost optimization, and carbon emission reduction were examined from a holistic perspective. The data used in the analysis are detailed in Table 3. These data include key components such as energy demand, generation capacity, cost parameters, and emission factors, which were carefully selected to ensure the realism and applicability of the scenarios. The input data incorporated into the EnergyPLAN model contribute to establishing a solid scientific foundation for the long-term energy planning scenarios developed for Turkey.
The data presented in Table 3 form the foundation for the scenario analyses and model validation conducted using the EnergyPLAN model. These data, also utilized in constructing the reference scenario, reflect the current state of the system and serve as a fundamental benchmark for testing the model’s accuracy. Data such as energy demand, installed capacity, and renewable energy share have been used to assess the current state and potential future developments of the energy system. While CO2 emissions and total cost data help analyze the environmental and economic impacts of the scenarios, hourly generation and consumption data support the model’s time-based energy balance analysis. Additionally, data on fuel prices, economic parameters, and the heat pump adoption curve contribute to conducting cost–benefit analyses in long-term energy planning. Within this scope, the goal is to reliably model and compare different scenarios. The reference energy model was constructed using 2022 data obtained from reliable institutions such as the Turkish Electricity Transmission Corporation (TEİAŞ) [34] and the Energy Markets Operation Corporation (EPİAŞ) [33]. Installed Capacity Data: The installed capacity based on Turkey’s energy sources in 2022 and the annual electricity generation amounts were integrated into the model using data provided by TEİAŞ. These data were used to evaluate energy supply security and model capacity expansions. Hourly Generation and Consumption Data: To analyze fluctuations in energy supply and demand in 2022, 8784 h data provided by the EPİAŞ transparency platform were incorporated into the system. These data enable the model to conduct energy balance analysis. These datasets served as a foundation for the reference scenario, ensuring the accuracy of the model and assessing the impacts of different scenarios. The EnergyPLAN software and the provided datasets have established a strong basis for analyzing Turkey’s energy system sustainably. By considering the country’s energy demand, resources, and economic parameters, the utilized data facilitate the development of future energy scenarios. This methodological approach serves as a crucial guide for strategic decisions that will contribute to Turkey’s 2053 carbon neutrality targets.

4. Case Study

The dominant role of fossil fuels in Turkey’s current energy system and their significant contribution to carbon emissions make the transition to renewable energy sources imperative. However, the sectors in which this transition should take place and the role of low-carbon energy sources such as nuclear energy remain subjects of debate. In this context, adopting an integrated and cross-sectoral approach to the energy system will facilitate the development of more comprehensive and feasible energy transition policies. In this case study, four scenarios have been developed, covering the heating, transportation, industrial, and electricity sectors. Each scenario represents different strategies aimed at reducing fossil fuel dependency and increasing the share of renewable energy sources. Additionally, approaches with and without nuclear energy have been comparatively analyzed to assess their impacts on carbon emissions and costs. The findings of this study not only provide an academic contribution but also aim to offer concrete recommendations for Turkey’s energy policies. To achieve this objective, a reference energy system was first established using 2022 data, followed by the development of alternative scenarios. These alternative scenarios have been categorized into four groups, with the following two main objectives:
  • Achieving the 2040 renewable energy target of 80%, as outlined in the report Turkey Renewable Energy Outlook published by Sabancı University Istanbul International Center for Energy and Climate (IICEC) [38].
  • Meeting the CO2 emission reduction targets of 287 Mt by 2030 and 161 Mt by 2040, as stated in SHURA’s Net Zero 2053 report and Istanbul Policy Center’s Turkey’s Decarbonization Roadmap: Net Zero by 2050 report [35].
To align with these objectives, four groups of scenarios have been developed. In the first three groups, it is assumed that nuclear energy is not included in the system. In the fourth group, nuclear energy has been integrated into the system in addition to the scenarios from the first three groups, and the scenarios have been restructured accordingly. All scenarios have been evaluated based on the resulting share of renewable energy, CO2 emissions, and annual costs.

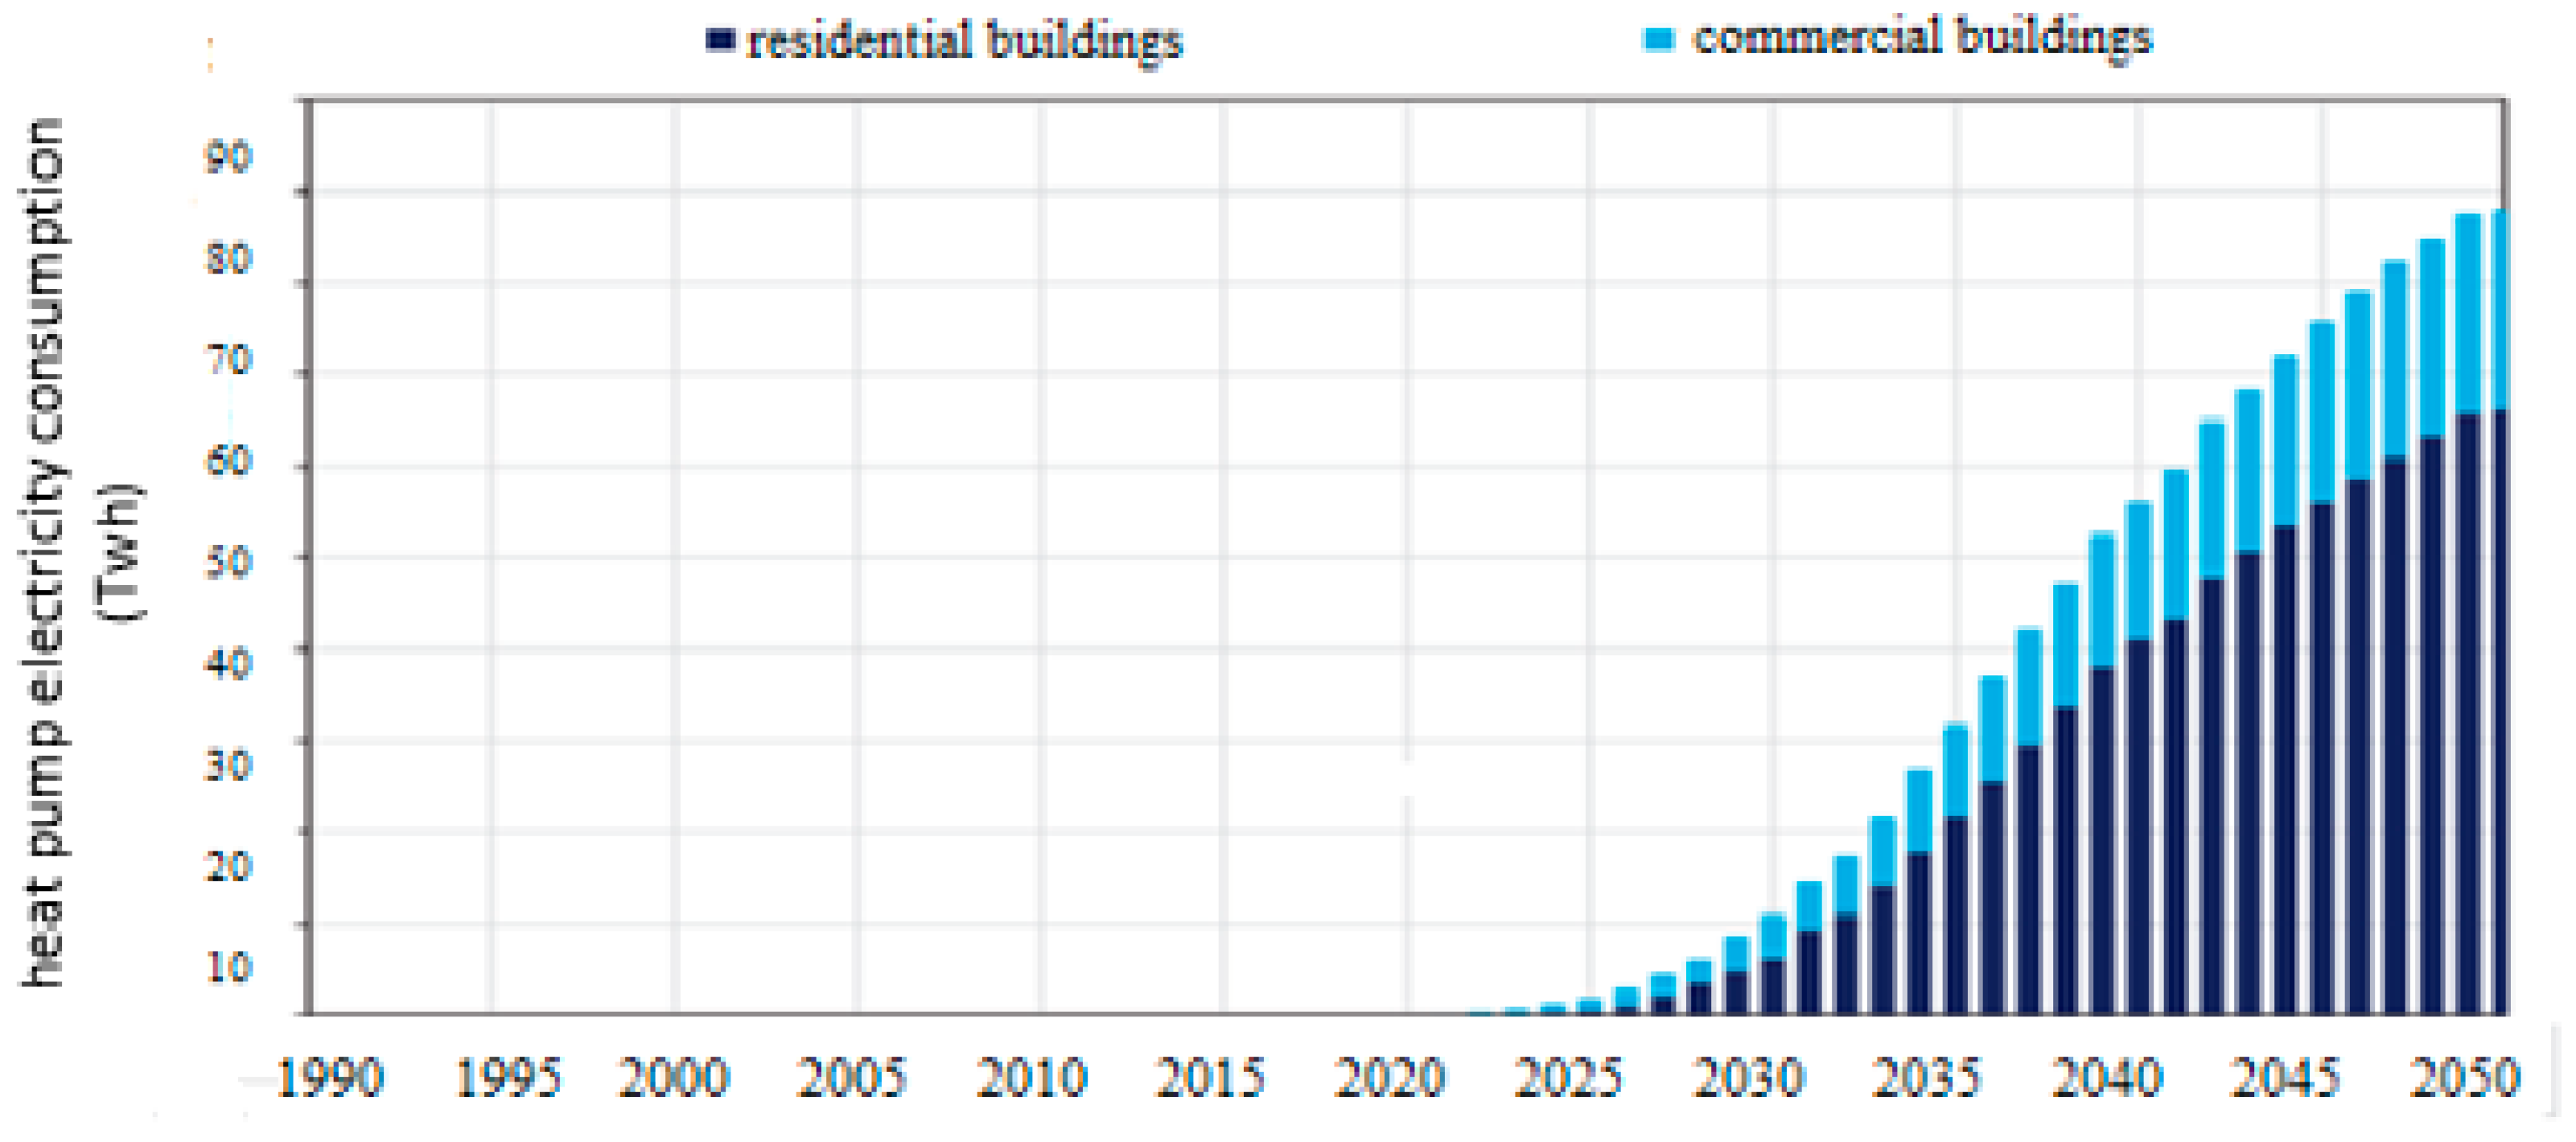
4.1. Development of the First Group of Scenarios (Focused on the Heating Sector)

These scenarios are designed to reduce fossil fuel consumption in the heating sector and minimize carbon emissions. Turkey’s existing heating systems predominantly rely on fossil fuels such as natural gas, coal, and fuel oil. However, these energy sources are both environmentally and economically unsustainable. In this context, high-efficiency and low-carbon-emission technologies, such as heat pumps, have been placed at the center of these scenarios.
According to the Turkey Energy Outlook (TEO 2020) report, Turkey’s energy demand is projected to reach 357.5 TWh in 2025, 423.9 TWh in 2030, 495.1 TWh in 2035, and 570.6 TWh in 2040 [40]. To meet these energy demands and achieve the stated objectives, the first group of scenarios was developed based on the TEO 2020 report. After inputting the expected energy data for 2025 into the model, fossil fuel-based boilers in the heating sector were replaced with heat pumps to align with the objectives. The key reasons for choosing heat pumps include the following:
  • High efficiency: Heat pumps can generate multiple units of heat energy from a single unit of electricity, increasing system efficiency.
  • Low carbon emissions: Since they operate on electricity, their integration with renewable energy sources can significantly reduce carbon emissions.
  • Versatility and adaptability: Heat pumps can be used in a wide range of applications, from residential buildings to industrial facilities, and can be easily integrated into existing heating infrastructure.
  • The heat pump values used in the modeling, as illustrated in Figure 3, have been obtained from the Turkey Renewable Energy Outlook report [38].
As shown in Figure 3, the aim is to increase the use of heat pumps each year. The fact that heat pumps emit significantly less CO2 and have very high efficiency values has led to an increase in their usage [41]. Additionally, it shows the change in electricity consumption over time depending on the use of heat pumps in residential and commercial buildings. The vertical axis represents the total electricity consumption by heat pumps (TWh), while the horizontal axis represents the years. 1990–2020: Electricity consumption by heat pumps remained at a relatively low level. Post-2020: A significant increase in heat pump usage is observed. 2030–2050: The rate of usage continues to increase rapidly. Dark blue (residential buildings): The use of heat pumps in residential buildings has become more widespread compared to commercial buildings. Light blue (commercial buildings): Although heat pump consumption has increased in commercial buildings, it remains lower compared to residential buildings. Increase after 2020: A significant rise in heat pump adoption is observed due to the impact of energy policies and incentives. Acceleration after 2030: It can be stated that technological developments, energy efficiency policies, and carbon reduction targets have increased the adoption rate. Peak in 2050: The modeling predicts that the total electricity consumption by heat pumps will reach 90 TWh. Urban and rural differences: While usage in residential areas increases more rapidly in urban regions, growth in commercial buildings may be more gradual. Seasonal consumption: In cold climate regions, the increase in electricity consumption during winter months may be more pronounced.

4.2. Development of the Second Group of Scenarios (Focusing on the Transportation Sector)

The second group of scenarios focuses on strategies aimed at reducing carbon emissions in the transportation sector. In Turkey, the transportation sector accounts for 25.6% of total energy consumption and leads to high carbon emissions due to fossil fuel-based vehicles. In this context, replacing fossil fuel vehicles with electric vehicles (EVs) emerges as a critical solution for emission reduction. While developing the second group of scenarios, improvements in the transportation sector were incorporated into the existing first group of scenarios. The aim was to integrate electric vehicles into the system to reduce the use of fossil fuels in transportation. The reasons for preferring electric vehicles can be stated as follows:
  • Electric vehicles do not produce direct exhaust emissions, and when electricity is generated from renewable sources, their carbon footprint is significantly reduced.
  • Electric vehicles offer higher energy efficiency compared to internal combustion engines.
  • The widespread adoption of electric vehicles supports energy independence by reducing petroleum imports.
  • The rapid advancement of electric vehicle technology and decreasing costs facilitate their adoption.
For this purpose, the Multi-Layer Perceptron (MLP) artificial neural network model in MATLAB (R2024b) was used to estimate the number of electric vehicles that will be used in the future. Initially, the network was trained using historical data, and it was observed that the trained network made predictions with 98% accuracy. Subsequently, the number of electric vehicles was estimated for the developed scenarios. The obtained vehicle numbers were input into the program, and the generated scenarios were evaluated in terms of CO2 emissions and costs.

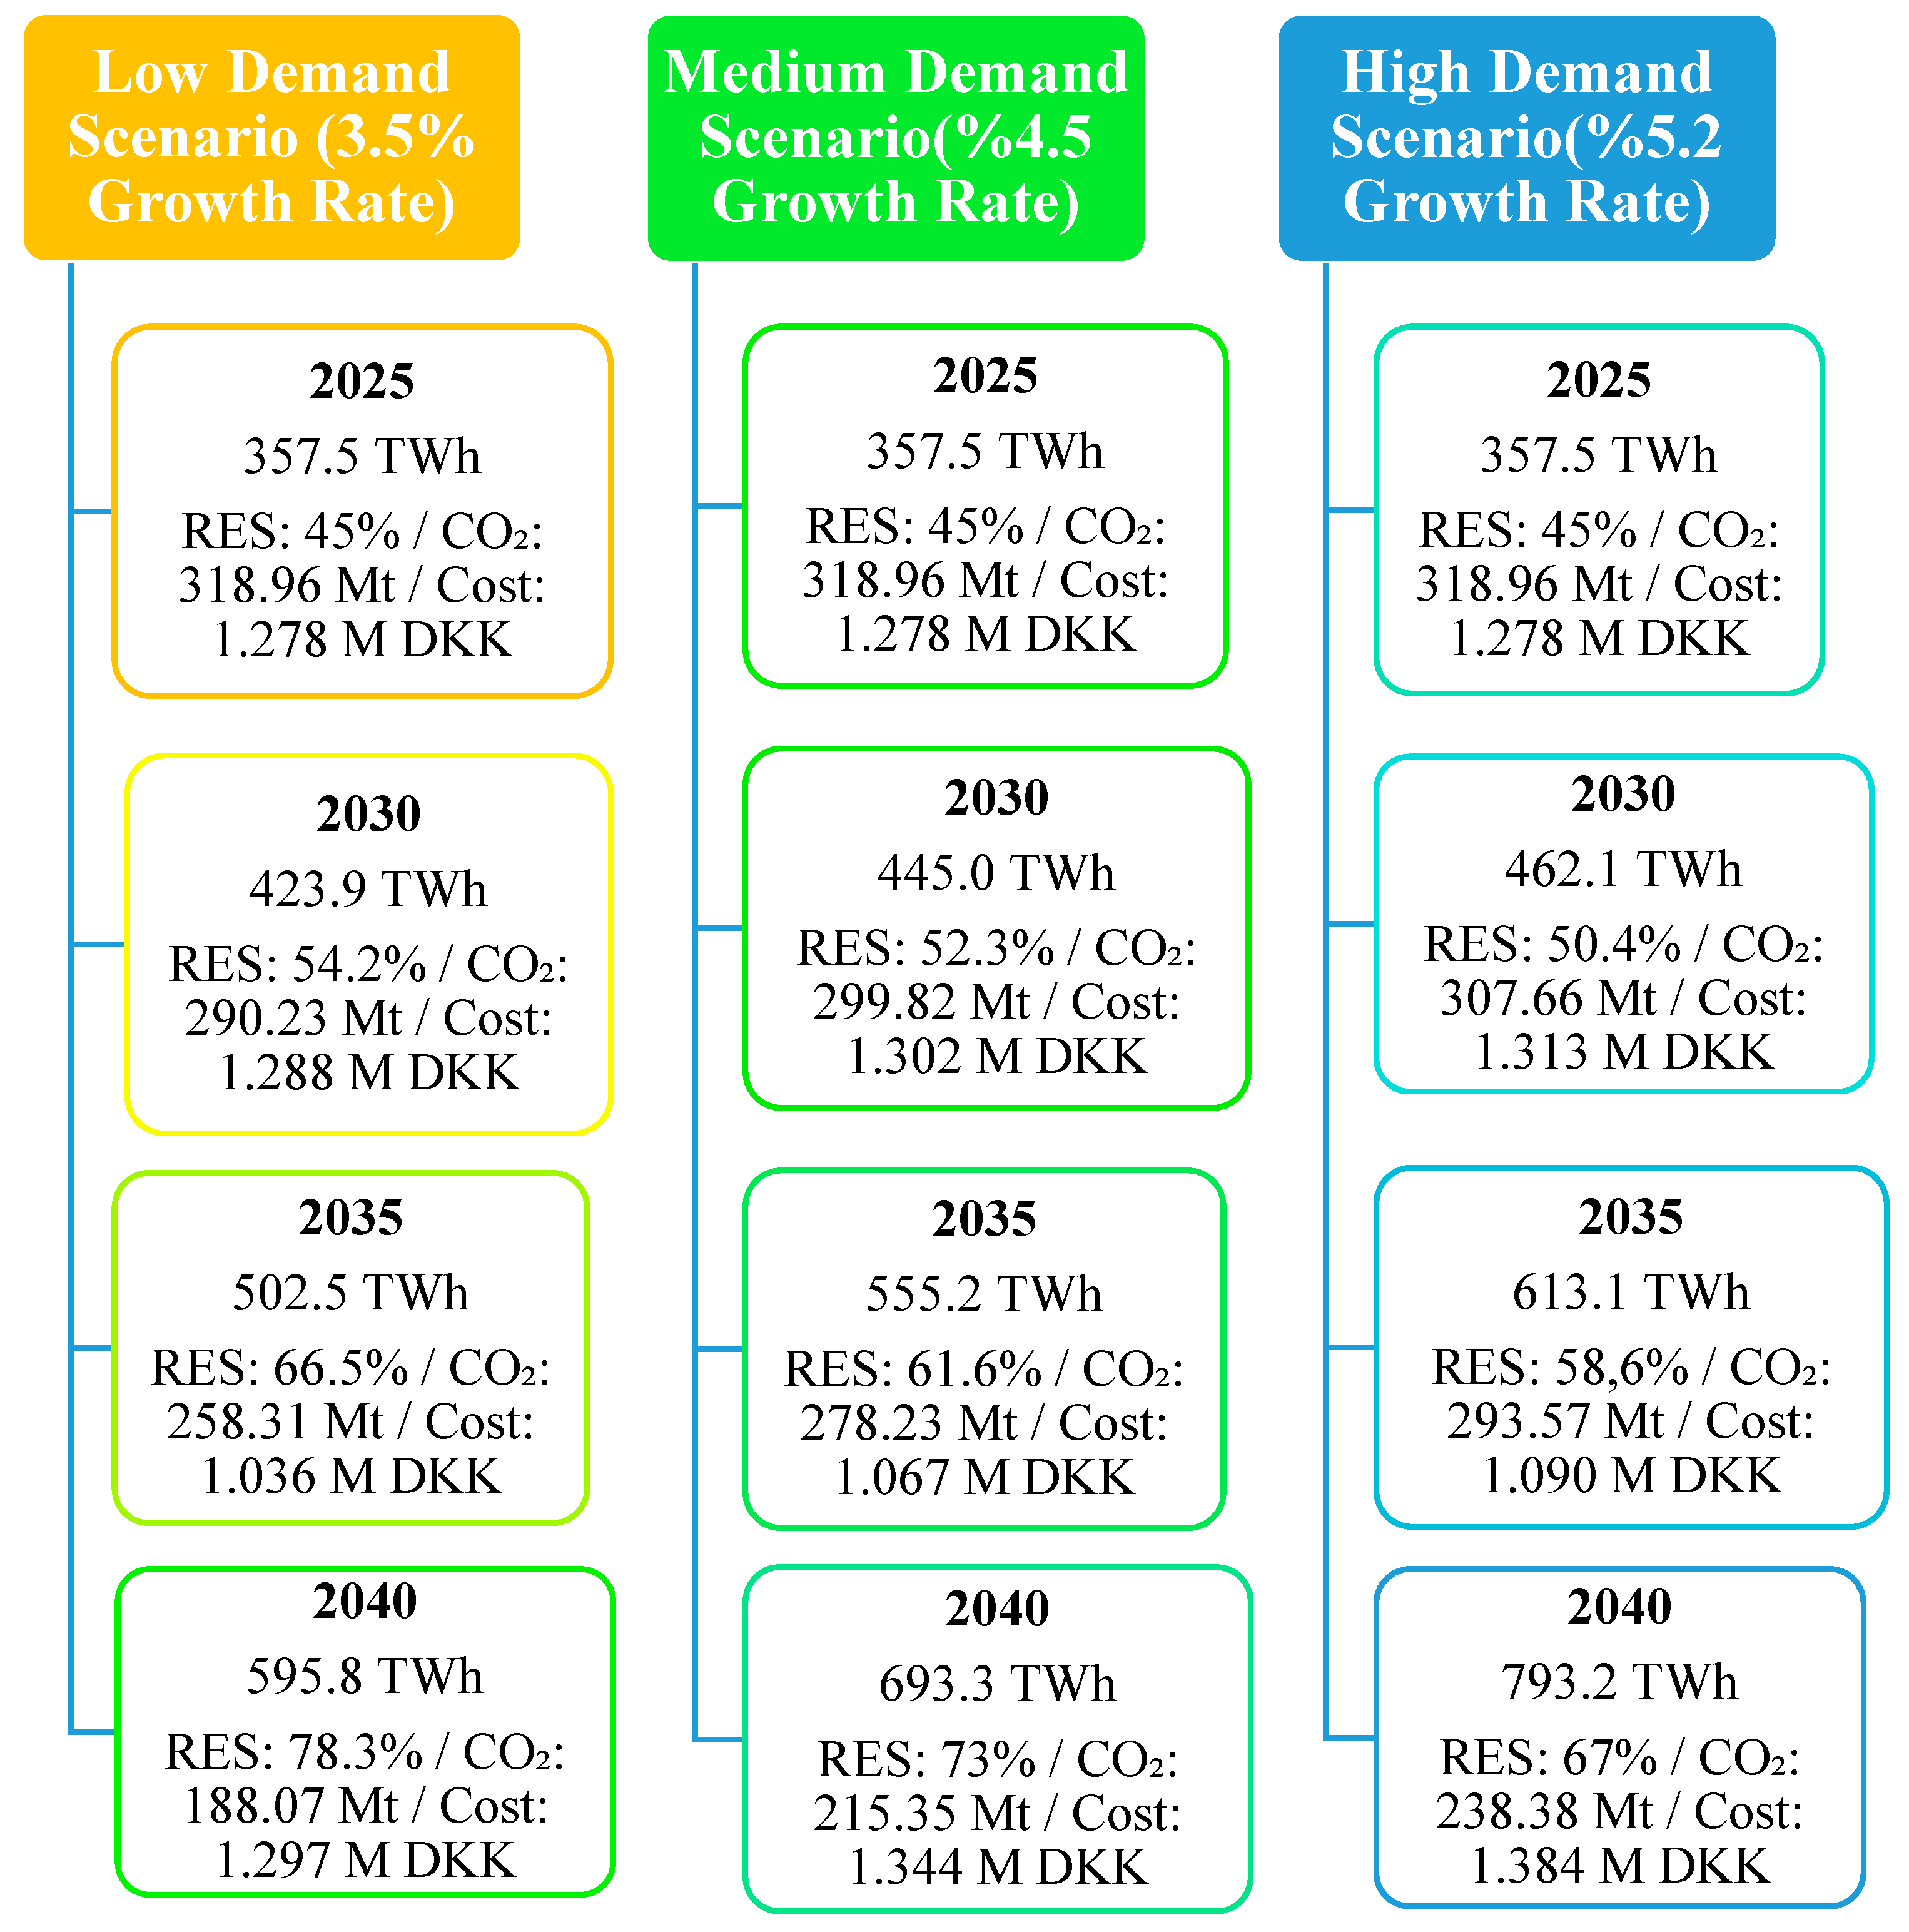
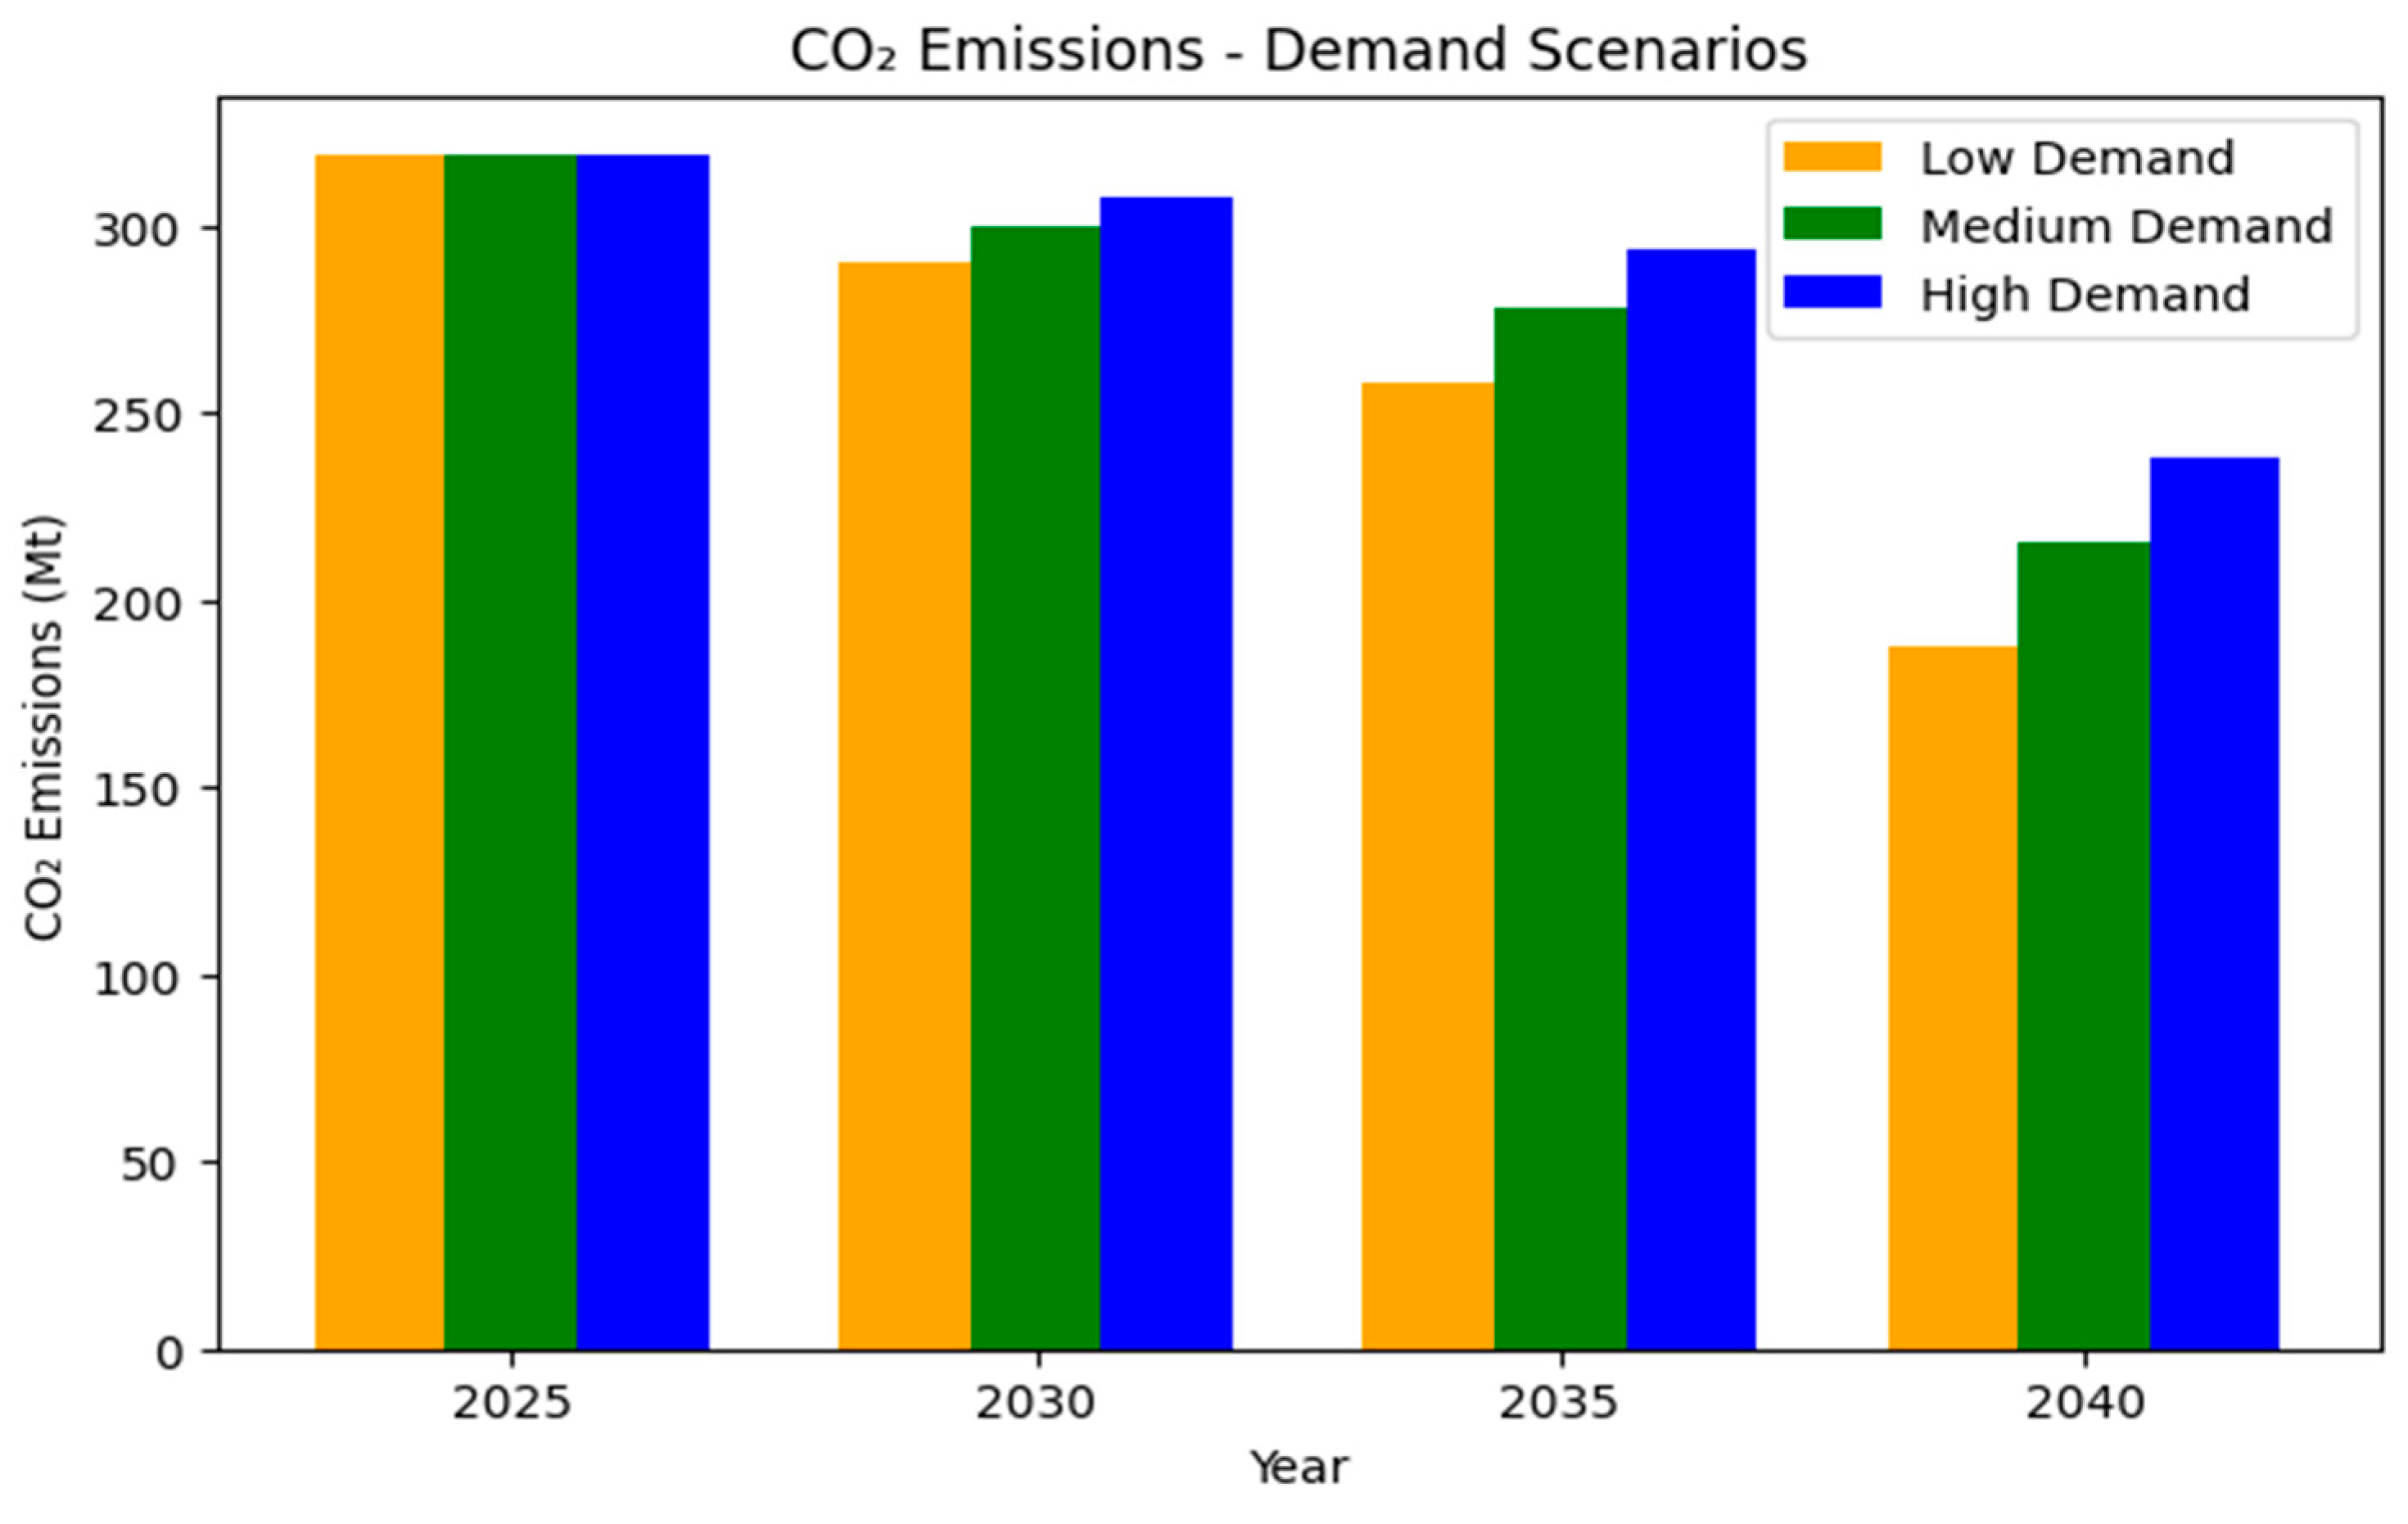
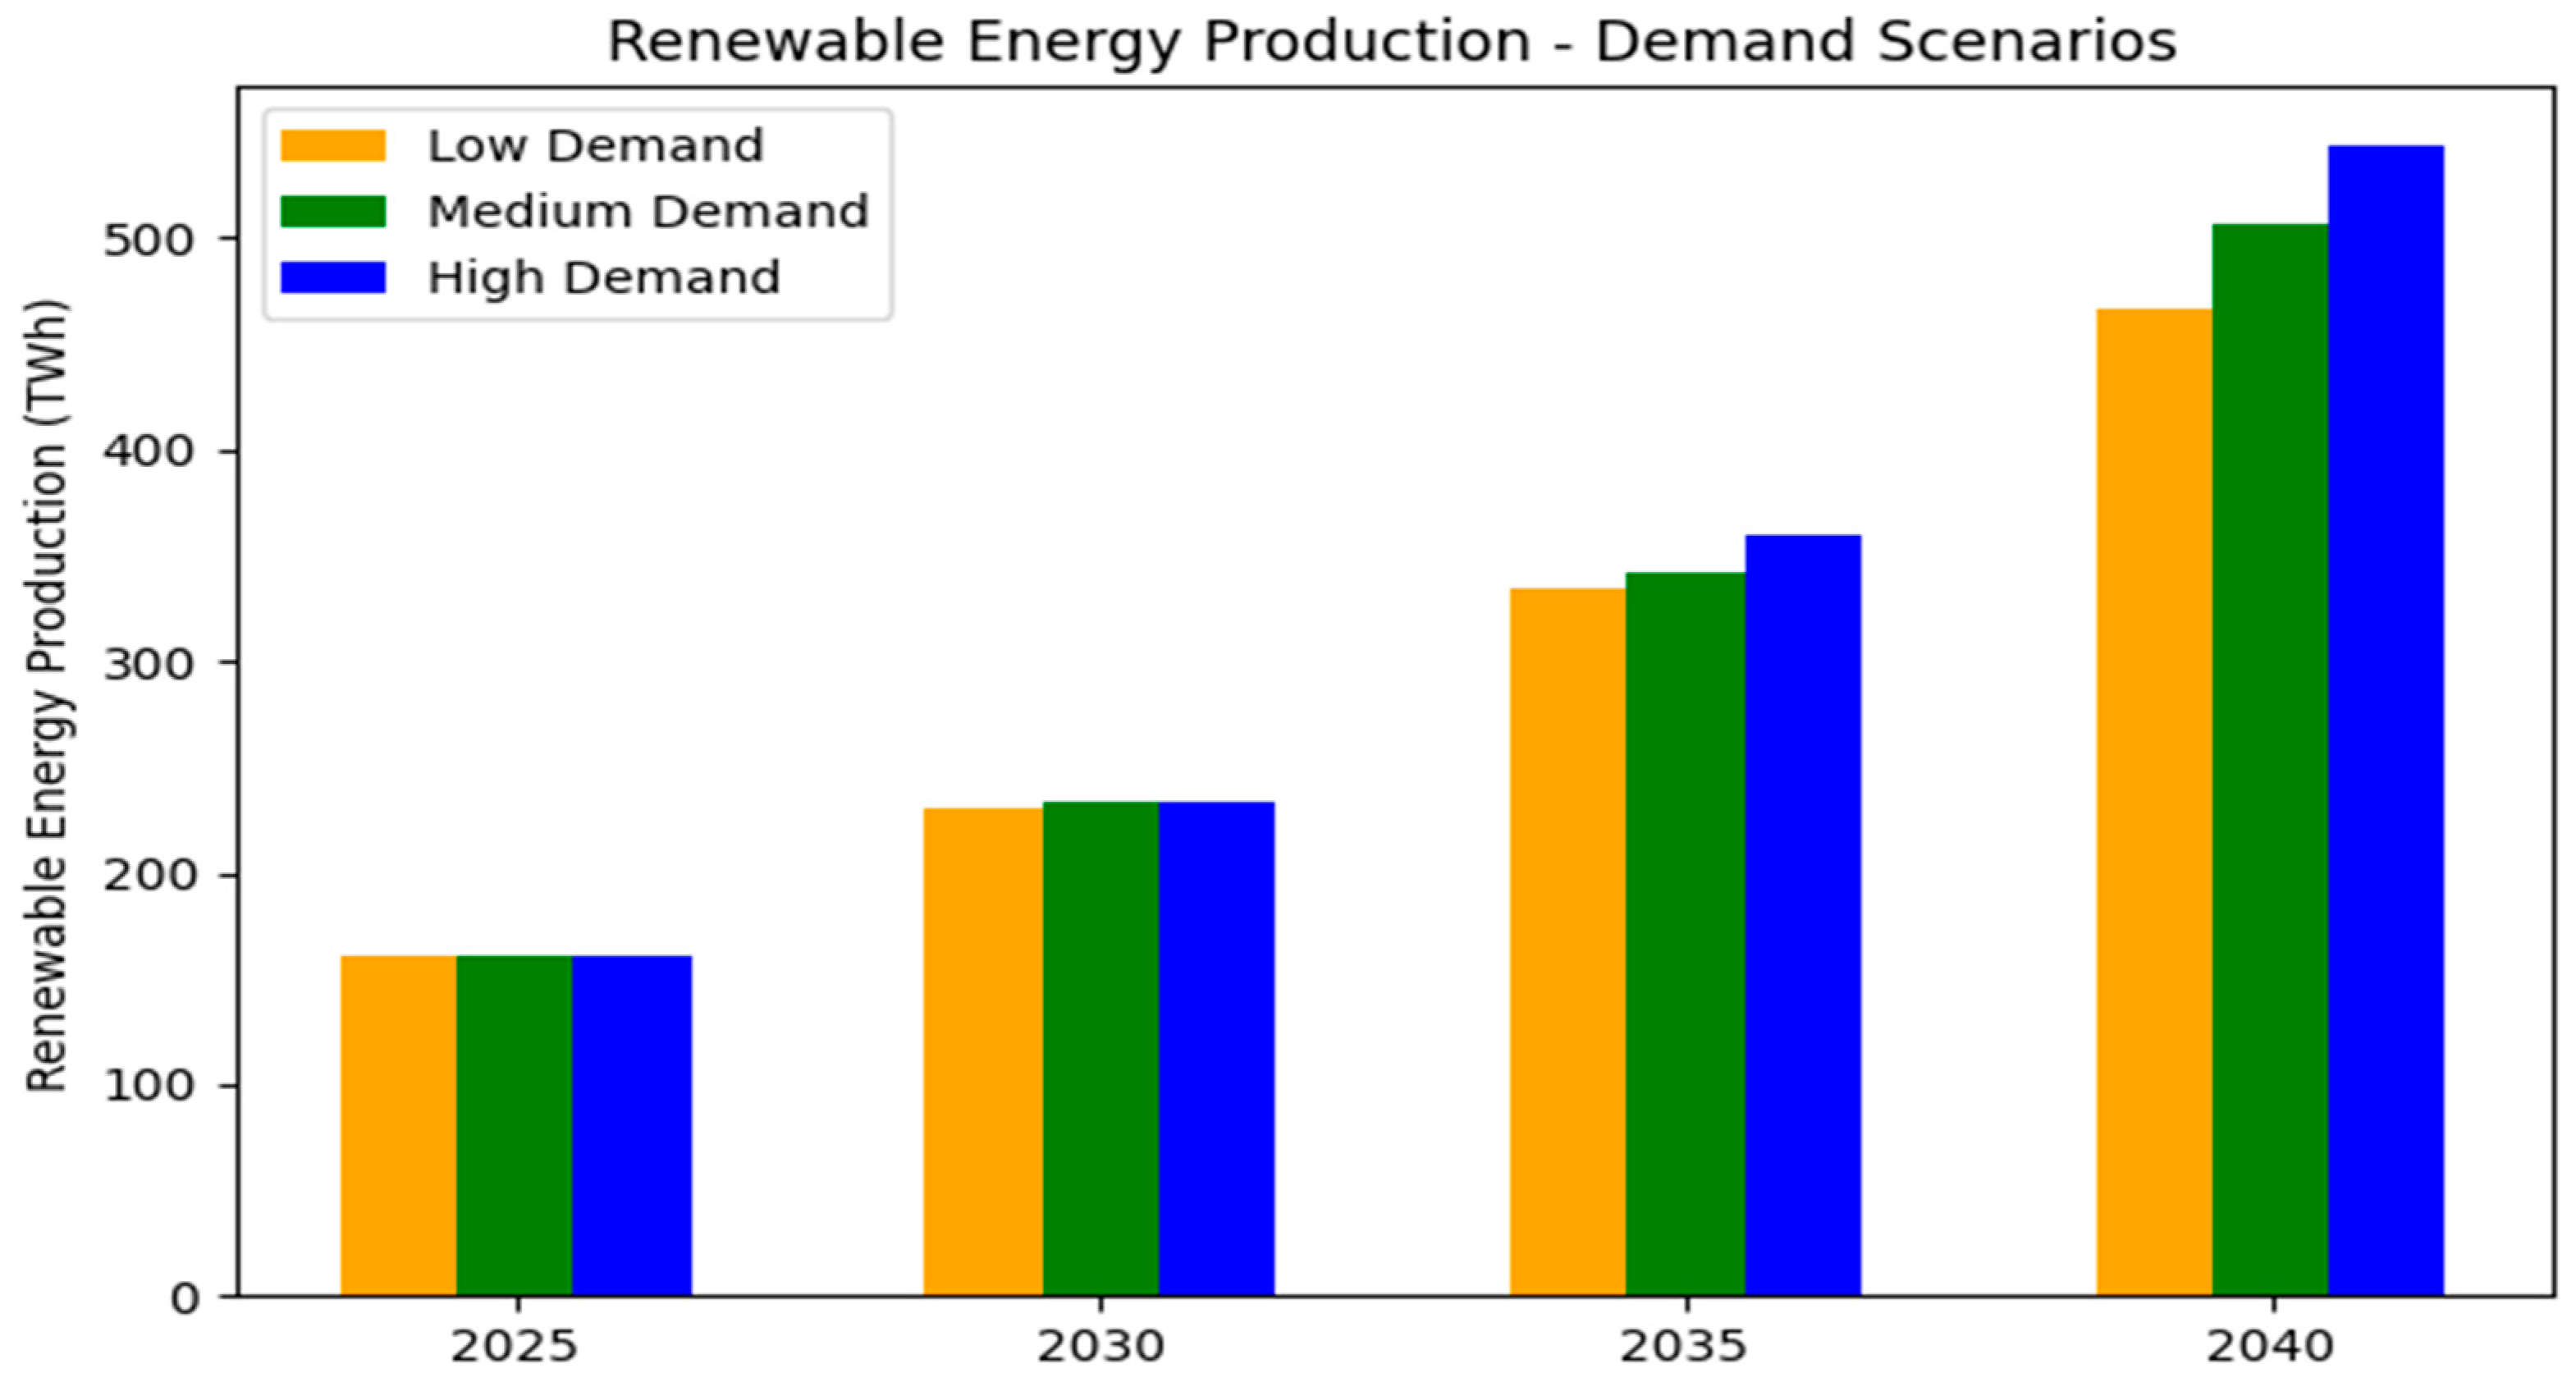
4.3. Development of the Third Group of Scenarios (Focused on Increasing Renewable Energy Capacity)

While developing the third group of scenarios, in addition to the existing second group of scenarios, the aim was to increase the installed capacity of renewable energy to achieve the targeted renewable energy share. The expansion of renewable energy sources has been deemed necessary for the following reasons:
  • Renewable energy sources such as wind, solar, hydroelectric, and geothermal do not produce carbon emissions and can replace fossil fuels.
  • Renewable energy can reduce Turkey’s dependence on imported energy.
  • The long-term operational costs of renewable energy sources are lower compared to fossil fuels.
  • Advances in renewable energy technologies enable their large-scale deployment.
Due to these advantages, a phased increase approach was adopted to approach the targeted 80% renewable energy usage rate by 2040 [38]. The installed capacity of renewable sources was increased by 40% for 2025, and by implementing a 50% increase for 2030, 2035, and 2040, the target share was achieved.

4.4. Development of the Fourth Group of Scenarios (Integration of Nuclear Energy)

The fourth group of scenarios aims to integrate nuclear energy into Turkey’s energy system to reduce carbon emissions and enhance energy supply security. Nuclear energy holds a significant place in energy transition strategies due to its low carbon emissions, continuous energy supply, and potential to reduce dependence on fossil fuels. It is a topic of debate both in Turkey and worldwide, with both supporters and opponents. While environmentalists generally oppose nuclear power plants, some scientists and governments highlight their positive impacts on the environment and economy. Proponents of nuclear energy emphasize that it enhances energy security by diversifying supply, does not produce greenhouse gas emissions compared to fossil fuels, significantly contributes to electricity generation, and has relatively low fuel costs [6]. In general, studies on this topic argue that Turkey needs nuclear energy to reduce energy dependence and ensure long-term, stable energy sources. Many studies emphasize the necessity of raising public awareness about nuclear energy and addressing misconceptions. Consequently, some studies suggest that Turkey should begin generating electricity with nuclear power plants as soon as possible [6,28,42]. In this study, rather than focusing on social aspects, the inclusion of nuclear energy in the system was examined in terms of its effects on carbon dioxide emissions and costs. The main reasons for preferring nuclear energy in these scenarios are as follows:
  • Nuclear power plants produce almost no carbon emissions during electricity generation and support environmental sustainability compared to fossil fuels.
  • Nuclear energy ensures a continuous energy supply by reducing dependence on intermittent sources like wind and solar.
  • It diversifies the energy supply, reducing reliance on foreign energy sources.
  • Nuclear power plants can generate large amounts of energy within a relatively small area.
While developing the scenarios in this group, the nuclear energy quantities planned for energy consumption in 2025, 2030, 2035, and 2040, as stated in the TEO 2020 report [40], were incorporated into the program, and the first three groups of scenarios were restructured. Initially, heat pumps were integrated, followed by electric vehicles, and finally, renewable energy installed capacities were increased, after which the results were analyzed.

5. Discussion

In this study, four different scenarios developed to achieve Turkey’s energy transition targets have been comprehensively evaluated from environmental, economic, and technical perspectives. The findings highlight that the transformation of the energy system requires consideration not only of technical innovations but also of factors such as economic sustainability, social acceptance, and policy alignment. Within this framework, it has been demonstrated that the success of the energy transition necessitates a multidimensional approach. Turkey’s installed capacity and hourly electricity generation data for 2022 were uploaded to the EnergyPLAN software, and scenarios were developed. The results were compared with the obtained data, and the differences between the current state of Turkey’s energy system and its potential transformation were analyzed.
According to Table 4, when the supply/demand data obtained from EPİAŞ are compared with the supply/demand data generated using EnergyPLAN, the differences are observed to be zero or close to zero. This indicates that EnergyPLAN outputs represent the data with high accuracy. Through these validation steps, it has been demonstrated that the developed reference scenario accurately reflects the current system, and future scenarios can be built upon this reference scenario. The program validation was conducted not only based on annual production amounts but also by evaluating monthly average supply data and resource-based monthly supply comparisons. The resulting values confirmed once again that the data were correctly entered into the software.
When examining the average supply data in Table 5 and the wind supply data provided as an example in Table 6, it is observed that the values from EPİAŞ and EnergyPLAN are very close to each other, indicating that EnergyPLAN accurately represents the system. Additionally, error analyses were conducted to test the accuracy of the model.

5.1. Error Analysis Calculations

To assess the accuracy of the EnergyPLAN model used in this study, the actual data from EPİAŞ were compared with the model outputs, and the following error analyses were performed: Mean Absolute Error (MAE), Mean Absolute Percentage Error (MAPE), Root Mean Square Error (RMSE), and R2 (Coefficient of Determination)
The calculations were conducted based on the data presented in Table 4. In the calculations, Y i represents the actual EPİAŞ data, Ŷ i represents the EnergyPLAN model output, and Ȳi represents the average of the actual values.

5.1.1. Mean Absolute Error (MAE)

MAE evaluates the overall error level by taking the average of the absolute differences between actual and predicted values [43]:
M A E = 1 / n i = 1 n Y i Ŷ i

5.1.2. Mean Absolute Percentage Error (MAPE)

MAPE provides a percentage-based error measure, indicating how close the predicted values are to the actual values [43]:
M A P E = 100 / n i = 1 n Y i Ŷ i Y i

5.1.3. Root Mean Square Error (RMSE)

RMSE measures prediction errors and penalizes larger errors more heavily, providing a better assessment of model accuracy [43]:
R M S E = 1 / n i = 1 n Y i Ŷ i 2

5.1.4. R2 (Coefficient of Determination)

R2 indicates how well the model explains the variance in the data. The closer it is to 1, the better the model’s predictive performance [43]:
R 2 = 1 Y i Ŷ i 2 ( Y i Ȳ i ) 2

5.1.5. Model Validation and Error Analysis Results

To evaluate the accuracy of the EnergyPLAN model, the actual EPİAŞ data were compared with the model outputs, and the error analyses in Table 7 were conducted.
This error analysis confirms the accuracy and reliability of the EnergyPLAN model used in the study. The model’s error rate is extremely low, indicating the success of the modeling approach and data integration. In the annual electricity supply and demand calculations, the model closely aligns with the actual system. This validation process enhances the scientific rigor of the study and demonstrates that the proposed energy scenarios are realistic. After completing the model validation process, the developed model was deemed capable of providing reliable outputs. Accordingly, alternative scenarios were created to examine the impacts of different policies and technological developments on long-term energy planning.
The scenarios were analyzed in four groups: First, heat pumps (a) were introduced into the system. Second, electric vehicles (b) were added in addition to heat pumps. Third, renewable energy capacity was increased (c) to achieve the target share of 80%, in addition to the previous two steps. Finally, scenarios were created with and without nuclear energy to assess its impact on the system. The results of these scenarios indicate the following:
(a)
Heat pumps could reduce carbon emissions in the heating sector by 60% by 2040. Studies [6,28] also highlight that heat pumps improve energy efficiency and reduce carbon emissions. However, in this study, the applicability of heat pumps considering regional variations and economic barriers has been analyzed in more detail.
(b)
Electric vehicles could reduce carbon emissions in the transportation sector by 40%. While this finding aligns with study [42], this study provides a more comprehensive assessment of the impacts of charging infrastructure limitations and increased energy demand.
(c)
The literature, particularly the TEO report [40], states that renewable energy investments significantly reduce carbon emissions. However, this study emphasizes that grid integration is crucial for increasing renewable energy capacity.
The renewable energy shares obtained from the scenarios are presented in Table 8, CO2 emissions in Table 9, and costs in Table 10.
According to the scenarios presented in Table 8, the expected renewable energy share for 2025, based on estimated values, is 32.53%. When heat pumps and electric vehicles are integrated, this share increases to 33.36%. In the final scenarios (c), where renewable energy capacity is increased by 40% in 2025, the renewable energy share reaches approximately 45%. Furthermore, when renewable energy capacity is increased by 50% for 2030, 2035, and 2040, the shares are found to be approximately 55%, 70%, and 82%, respectively. Thus, the target share of 80% for 2040 is exceeded. In scenarios where nuclear energy is introduced, a decrease in the share of renewable energy is observed. This reduction is due to the inclusion of nuclear energy as a new energy source in the system, which is classified neither as fossil fuel nor as renewable energy. Designed with a focus on carbon-free electricity generation, EnergyPLAN prioritizes renewable energy sources. It then selects energy sources with the lowest CO2 emissions while considering associated costs. Although the inclusion of nuclear energy has contributed to CO2 emission reduction, it has also lowered the share of renewable energy utilization. In the final scenario group (c), the annual renewable energy shares are found to be approximately 44%, 53%, 63%, and 70%, respectively. The results of the study’s second and primary objective—carbon emission reduction—are presented in Table 9.
When evaluating the scenarios in terms of CO2 emissions, the SHURA report Net Zero 2053 and the Istanbul Policy Center report Turkey’s Decarbonization Roadmap: Net Zero by 2050 project CO2 emissions of 287 Mt by 2030 and 161 Mt by 2040.
According to the results in Table 8, which exclude nuclear energy, the 2030 target has been achieved by 97%, while the 2040 target has been met by 95%. In contrast, the results in Table 9, which include nuclear energy, indicate that the 2030 target has been fully met (100%), while an even better outcome than the projected 2040 target has been achieved. Another key criterion for scenario evaluation is cost, which is presented in Table 10 and Table 11. Calculating energy system costs requires data on investment costs, fixed operation and maintenance expenses, and fuel unit costs. The cost estimations primarily rely on technology data from the Danish Energy Agency (DEA) [37], the EnergyPLAN cost database [17], and the SHURA report Optimal Electricity Generation Capacity for Turkey Towards 2030 [38]. For carbon pricing, the value projected for 2040 in the International Energy Agency’s World Energy Outlook 2020 report [39] has been used. Additionally, electricity generation plant cost data from the SHURA report have been assumed to remain valid for 2040. Based on these cost parameters entered into the model, the scenario results are as follows: Costs consist of investment, variable fixed O&M costs in the EnergyPLAN software. the investment cost is calculated by multiplying the installed power capacity (CWind) by the unit cost (PUnitWind). To calculate the annual investment cost (AInvestmentWind), total investment cost (IWind) is divided by the technical lifetime (i) of power plants. This calculation is performed for each power plant; thus, the investment costs are calculated by the following expressions [37]:
I W i n d = C W i n d + P U n i t w i n d
A i n v e s t m e n t W i n d = I w i n d i
Fixed O&M cost (IFixed O&M) is the specific percentage of the annual investment costs. It is calculated by taking the percentage of the investment cost (IInvestment Cost) for each power plant. On the other hand, variable costs (IVariable) are based on fuel prices and other operational and maintenance costs. Fuel prices are defined and measured in USD/GJ in the EnergyPLAN software.
The total of all these costs makes up the annual total costs (A Total Cost), which is needed in the targeted scenario:
A T a t a l   c o s t = I F i x e d   O & M + I v a r i a b l e + I i n v e s t m e n t   c o s t
The scenario results based on these cost inputs are as follows:
For example, in 2025, as shown in Table 10, in scenarios without nuclear energy, the total variable costs are DKK 410,871 million for scenario (a) with heat pumps, DKK 405,011 million for scenario (b) with electric vehicles, and DKK 381,776 million for scenario (c) with increased renewable capacity. The total annual costs are DKK 1,299,387 million, DKK 1,292,246 million, and DKK 1,278,351 million, respectively.
When examining the results presented in Table 11, for instance, in the year 2040, in scenarios that include nuclear energy, the total variable cost for Scenario a (where heat pumps are integrated into the system) is DKK 532,067 million. For Scenario b (where electric vehicles are also added), this cost decreases to DKK 455,139 million. In Scenario c (where renewable energy capacity is further increased), the total variable cost is further reduced to DKK 314,016 million. Regarding total annual costs, the corresponding values are DKK 1,455,539 million for Scenario a, DKK 1,370,137 million for Scenario b, and DKK 1,292,996 million for Scenario c. A general assessment of the cost results indicates that as additional elements (a, b, c) are incorporated into the scenarios, annual investment costs increase, whereas total variable costs and total annual costs decrease.

5.2. Cost–Benefit Analysis

In this section, a cost–benefit analysis is conducted to evaluate the economic feasibility of the developed scenarios. The analysis process considers direct cost elements such as investment, operation and maintenance costs, and fuel expenditures, while also taking into account economic and environmental benefits such as the reduction in carbon emissions and decreased fuel imports. The findings indicate that each scenario presents its own unique advantages and limitations.

5.2.1. Cost Elements

Based on the data presented in the previous sections of the study, the total cost for each scenario is calculated. The investment cost, operation and maintenance cost, and fuel cost provided in Table 12 are derived from the data in Table 10 and Table 11. These values were compiled using cost data from the Danish Energy Agency (DEA) [37] and the EnergyPLAN database [44].

5.2.2. CO2 Emissions and Carbon Gains

For the year 2040, the economic benefit was calculated based on the carbon emission levels of each scenario and the carbon pricing mechanism. The CO2 emissions (Mt) were taken from Table 8 and Table 9, and the economic gain from carbon reduction (USD/ton CO2) was estimated based on the carbon price of USD 75/ton CO2, as projected in the IEA World Energy Outlook 2020 report [39]. Using this price, the economic gain from carbon reduction was computed [43].
C a r b o n   G a i n = C O E m i s s i o n s × C a r b o n   P r i c e
Renewable Energy 158.82 × 75 = 11,911, Nuclear Energy 132.76 × 75 = 9957 (Million USD).
The nuclear energy scenario, due to its lower CO2 emissions, appears more advantageous in terms of carbon reduction. However, when considering the financial gain from carbon reduction, the renewable energy scenario provides a higher return. This indicates that renewable energy sources present a sustainable and economically advantageous alternative in the long term.

5.2.3. Reduction in Fuel Imports

Both the renewable energy and nuclear energy scenarios reduce fossil fuel consumption, thereby reducing import dependency and providing significant economic savings. Considering global energy market fluctuations and Turkey’s reliance on energy imports, the widespread adoption of renewable energy sources could save approximately USD 20 billion in fossil fuel imports. In the nuclear energy scenario, the increased baseload generation capacity is expected to lead to a larger decrease in natural gas and coal consumption, with total import savings projected to reach around USD 25 billion. These estimates are based on current energy import costs and fossil fuel usage rates, emphasizing the long-term economic benefits of investments in renewable and nuclear energy [39].

5.2.4. Total Benefit and Net Benefit Calculations

The total benefit is calculated as the sum of carbon reduction gains and fuel import savings [43].
T o t a l   B e n e f i t   ( M i l l i o n   $ ) = C a r b o n   R e d u c t i o n   G a i n + F u e l   I m p o r t   S a v i n g s
Renewable Energy = 11,911 + 20,000 = 31,911; Nuclear Energy = 9957 + 25,000 = 34,957.
Since nuclear energy results in greater fuel savings, its total benefit is slightly higher [43].
N e t   B e n e f i t   ( M i l l i o n   $ ) = T o t a l   B e n e f i t T o t a l   C o s t
Renewable energy = 31,911–1,286,538 = −1,254,626; Nuclear energy = 34,957–1,292,996 = −1,258,039
All the data and calculations mentioned above are compiled into a single table.
The cost–benefit analysis conducted in this study indicates that, in both scenarios, the system is not economically self-sustaining due to the investment and operational costs exceeding the economic benefits. While the nuclear energy scenario achieves greater reductions in fossil fuel consumption and higher savings in energy imports, its high investment and operational costs lead to an overall increase in system costs. In contrast, the renewable energy scenario emerges as a more economically viable option by providing lower total costs and higher carbon reduction benefits. The results suggest that renewable energy offers advantages in terms of cost-effectiveness and long-term sustainability, whereas nuclear energy has the potential to reduce CO2 emissions.
Following the cost–benefit analysis, a sensitivity analysis is conducted to examine the impact of key parameters on the results. This analysis helps to assess the robustness of the findings by evaluating the potential effects of changes in energy costs and efficiency on the scenarios.

5.3. Sensitivity Analysis

In this study, a sensitivity analysis was conducted to evaluate the impact of changes in energy demand on system performance. Three different energy demand growth rates were identified, and the EnergyPLAN model was used to analyze their effects on the share of renewable energy, CO2 emissions, and total costs within the scenarios. Energy demand growth is one of the key determinants of Turkey’s energy transition process. Based on historical electricity consumption data and future projections, three different demand growth rates were selected for the sensitivity analysis. As of 2024, electricity consumption is expected to increase by 3.8%, reaching 347.9 TWh, while it is projected to rise to 380.2 TWh in 2025, 455.3 TWh in 2030, and 510.5 TWh in 2035 [2]. The average annual growth rate is estimated to be 3.5% for the 2020–2035 period and 5.2% for 2035–2053 [45]. Additionally, projections for 2019–2028 indicate that the demand growth rate ranges between 3.6% and 4.8% [38]. Over the past two decades, electricity demand has increased at an average annual rate of 4.7% [45]. Based on these data, the sensitivity analysis considers energy demand growth rates of 3.5%, 4.5%, and 5.2%. These values are implemented in EnergyPLAN under the “Electricity Demand” input for the three different scenarios, and the model is executed accordingly.

Sensitivity Analysis Results

The effects of energy demand variations on the system, based on EnergyPLAN model outputs, are summarized in Figure 4.
The results of the sensitivity analysis indicate that an increase in energy demand leads to a reduction in the share of renewable energy within the system, while simultaneously increasing fossil fuel consumption, resulting in a significant rise in CO2 emissions. The growing demand for energy production raises the total system costs, whereas the low-demand scenario emerges as the most favorable option for a sustainable energy system, offering lower emissions, a higher share of renewable energy, and reduced costs. In contrast, the high-demand scenario leads to greater dependency on fossil fuels, higher emissions, and significantly increased energy costs. To ensure long-term sustainability and control costs, it is essential to strengthen energy efficiency policies, increase investments in renewable energy, and promote carbon reduction technologies. Furthermore, the results of the sensitivity analysis were processed using Python (3.12.1) and interpreted graphically.
According to Figure 5, the year 2025 is taken as the starting point, and emissions are assumed to be equal across all scenarios. However, as energy demand increases in 2030 and 2040, emissions also rise, with a more pronounced increase observed in the high-demand scenario. Expanding renewable energy capacity plays a crucial role in reducing emissions; otherwise, the increase in energy demand significantly raises emissions.
Figure 6 illustrates the share of renewable energy in total energy production. As of 2025, the renewable energy share remains constant at 45% across all scenarios. However, in 2030 and 2040, this share varies depending on demand levels. In the low-demand scenario, the share increases, whereas in the high-demand scenario, it remains lower. This indicates that high energy demand reduces the share of renewable energy and increases reliance on fossil fuels. Expanding renewable energy capacity can help mitigate this effect.
According to Figure 7, total energy costs are assumed to be the same across all scenarios in 2025, at approximately DKK 1.278 trillion, based on energy demand. However, in 2030 and 2040, a significant increase in costs is observed as demand rises. While costs increase less in the low-demand scenario, the high-demand scenario sees a greater rise. This indicates that higher energy demand leads to increased total costs, and long-term economic advantages can be achieved through investments in energy efficiency and renewable energy. From a broader perspective, the low-energy demand scenario results in lower CO2 emissions, a higher share of renewable energy, and reduced costs. On the other hand, the high-energy demand scenario leads to increased emissions, a lower share of renewable energy, and higher total costs. For long-term sustainability, energy efficiency policies, investments in renewable energy, and the promotion of technologies that reduce carbon emissions are crucial.
The results of cost–benefit and sensitivity analyses have demonstrated the economic and technical feasibility of different energy scenarios. However, modeling results should not be limited to numerical assessments alone; they must also be considered in the context of energy policies and sustainability goals. In this regard, qualitative analyses have been conducted to examine the alignment of the developed scenarios with national and international energy strategies.

5.4. Qualitative Analyses

This section focuses on grounded theory and semantic analysis methods. The energy transition scenarios developed in this study have been evaluated using the grounded theory approach to analyze how they align with Turkey’s long-term energy policies and sustainability goals. The modeling results have been comprehensively analyzed in accordance with SHURA’s “Net Zero 2053” report and the “Turkey’s Decarbonization Roadmap: Net Zero by 2050” report published by the Istanbul Policy Center [35]. The results of the examined scenarios indicate that renewable energy-focused scenarios significantly reduce carbon emissions in line with the 2053 Net Zero targets, while enhancing energy supply security [35]. This section focuses on grounded theory and semantic analysis methods. The energy transition scenarios developed in this study are evaluated using the grounded theory approach to assess their alignment with Turkey’s long-term energy policies and sustainability goals. The modeling results are comprehensively analyzed in accordance with SHURA’s Net Zero 2053 report and Turkey’s Decarbonization Roadmap: Net Zero by 2050 report published by the Istanbul Policy Center [35]. The results of the examined scenarios indicate that renewable energy-focused scenarios significantly reduce carbon emissions in line with the 2053 Net Zero targets, while also enhancing energy supply security [35]. Although scenarios involving nuclear energy achieve greater CO2 emission reductions, they require detailed evaluation due to high investment costs, which raise concerns regarding economic feasibility. Energy systems that rely on existing fossil fuel dependency impose long-term emission and cost burdens, making them an unsustainable solution. This analysis demonstrates that the study goes beyond technical modeling by providing an integrated assessment that incorporates energy policies. The modeling results align with policy objectives, emphasizing the need to prioritize renewable energy in future energy planning. Additionally, the semantic analysis evaluates renewable energy scenarios within a framework consistent with both national and international energy policies. SHURA’s 2050 Net Zero Roadmap [35] advocates for the rapid expansion of renewable energy sources, and the scenarios in this study exhibit a similar trend. Turkey’s National Energy Plan identifies nuclear energy as a strategic priority, and accordingly, the nuclear scenario in this study aligns with the country’s long-term energy policies. This semantic analysis ensures that the model results are assessed not only from a technical perspective but also through a comprehensive approach that integrates national and international energy strategies.

6. Conclusions

This study aims to promote the widespread adoption of renewable energy sources in Turkey’s long-term energy planning by reducing fossil fuel consumption. Various scenarios were developed using the EnergyPLAN software to comprehensively assess the technical, economic, and environmental dimensions of energy transition strategies. The scenario analyses provide concrete recommendations for the development of sustainable energy policies. The findings indicate that renewable energy-based scenarios offer an effective solution for reducing carbon emissions while also ensuring long-term economic feasibility. Scenarios incorporating nuclear energy facilitate the achievement of lower carbon emission targets; however, they also introduce critical challenges, such as high investment costs. By 2040, the share of renewable energy reaches 82% in scenarios without nuclear energy, whereas it remains at 70% in scenarios that include nuclear power. However, nuclear energy scenarios result in greater reductions in CO2 emissions. This study is among the few in the literature that extensively integrates multiple sectors and conducts a detailed comparison, including nuclear energy. Going beyond conventional energy planning approaches, it examines the effects of energy demand variations through sensitivity analysis, evaluates the economic feasibility of each scenario using cost–benefit analysis, and assesses scenario effectiveness by calculating the cost per unit of CO2 reduction. Additionally, the relationship between energy policies and modeling scenarios has been clarified using grounded theory and semantic analysis methods. In this regard, the study not only contributes to academic knowledge but also provides valuable insights to support decision-making processes for policymakers, environmental activists, and energy sector professionals. By offering an analysis that guides decision-makers in energy policies, economic sustainability, and climate goals, it establishes a scientifically grounded framework for Turkey’s long-term energy planning. The study presents concrete recommendations for policymakers regarding long-term energy strategies, guiding the energy transition process and outlining a comprehensive roadmap for transitioning to a sustainable, low-carbon energy system.
Future research can further contribute to this process by adopting a more holistic perspective, focusing on the social dimensions of energy policies, public acceptance, and the integration of technological innovations.

Author Contributions

All authors have made equal contributions to the manuscript. All authors have read and agreed to the published version of the manuscript.

Funding

This research received no external funding.

Institutional Review Board Statement

Not applicable.

Informed Consent Statement

Not applicable.

Data Availability Statement

The original contributions presented in this study are included in the article. Further inquiries can be directed to the corresponding author.

Conflicts of Interest

The authors declare no conflicts of interest.

Abbreviations

The following abbreviations are used in this manuscript:
MWMegawatt
TWhTerawatt-hour
TEİAŞTurkish Electricity Transmission Corporation
EPİAŞElectricity Market Operator Inc.
CO2Carbon dioxide

References

  1. Energy Transition. Available online: https://shura.org.tr/turkiye-enerji-donusumu-gorunumu-2023 (accessed on 5 September 2024).
  2. Energy Increase Rates. 2024. Available online: https://enerjiverimliligi.enerji.gov.tr (accessed on 6 September 2024).
  3. ETKB. National Energy Balance Tables. 2023. Available online: https://enerji.gov.tr/eigm-raporlari (accessed on 10 September 2024).
  4. Adun, H.; Ishaku, H.P.; Ogungbemi, A.T. Towards Renewable energy targets for the Middle East and North African region: A decarbonization assessment of energy-water nexus. J. Clean. Prod. 2022, 374, 133944. [Google Scholar] [CrossRef]
  5. Akpahou, R.; Odoi-Yorke, F.; Mensah, L.D.; Quansah, D.A.; Kemausuor, F. Strategizing towards sustainable energy planning: Modeling the mix of future generation technologies for 2050 in Benin. Renew. Sustain. Energy Transit. 2024, 5, 100079. [Google Scholar] [CrossRef]
  6. Aktepe, C.; Gökkaya, A. Turkey’s Foreign Trade Deficit and Nuclear Energy Option. J. Bus. Res. 2023, 15, 2978–2995. [Google Scholar]
  7. Arévalo, P.; Cano, A.; Jurado, F. Mitigation of carbon footprint with 100% renewable energy system by 2050: The case of Galapagos islands. Energy 2022, 245, 123247. [Google Scholar] [CrossRef]
  8. Bačeković, I.; Østergaard, P.A. Local smart energy systems and cross-system integration. Energy 2018, 151, 812–825. [Google Scholar] [CrossRef]
  9. Bamisile, O.; Wang, X.; Adun, H.; Ejiyi, C.J.; Obiora, S.; Huang, Q.; Hu, W. A 2030 and 2050 feasible/sustainable decarbonization perusal for China’s Sichuan Province: A deep carbon neutrality analysis and EnergyPLAN. Energy Convers. Manag. 2022, 261, 115605. [Google Scholar] [CrossRef]
  10. Beckmann, J.; Klöckner, K.; Letmathe, P. Scenario-based multi-criteria evaluation of sector coupling-based technology pathways for decarbonization with varying degrees of disruption. Energy 2024, 297, 131248. [Google Scholar] [CrossRef]
  11. Borge-Diez, D.; Icaza, D.; Trujillo-Cueva, D.F.; Açıkkalp, E. Renewable energy driven heat pumps decarbonization potential in existing residential buildings: Roadmap and case study of Spain. Energy 2022, 247, 123481. [Google Scholar] [CrossRef]
  12. Calise, F.; Duic, N.; Pfeifer, A.; Vicidomini, M.; Orlando, A.M. Moving the system boundaries in decarbonization of large islands. Energy Convers. Manag. 2021, 234, 113956. [Google Scholar] [CrossRef]
  13. Cevallos-Sierra, J.; Pinto Gonçalves, A.; Santos Silva, C. Using urban building energy models for the development of sustainable island energy systems. Energies 2024, 17, 3135. [Google Scholar] [CrossRef]
  14. Dominković, D.F.; Hrnčić, B.; Pfeifer, A.; Jurić, F.; Duić, N.; Ivanović, V.; Vušanović, I. Analysis of Montenegro’s transition to a 100% renewable energy system by 2050 in line with European Green Deal targets. Energy Rep. 2021, 7, 121. [Google Scholar]
  15. Ekonomou, G.; Menegaki, A.N. China in the renewable energy era: What has been done and what remains to be done. Energies 2023, 16, 6696. [Google Scholar] [CrossRef]
  16. Hyvönen, J.; Koivunen, T.; Syri, S. Possible bottlenecks in clean energy transitions: Overview and modelled effects–case Finland. J. Clean. Prod. 2023, 410, 137317. [Google Scholar] [CrossRef]
  17. Icaza, D.; Borge-Diez, D.; Galindo, S.P. Proposal of 100% renewable energy production for the City of Cuenca-Ecuador by 2050. Renew. Energy 2021, 170, 1324–1341. [Google Scholar] [CrossRef]
  18. Icaza-Alvarez, D.; Jurado, F.; Tostado-Véliz, M.; Arevalo, P. Decarbonization of the Galapagos Islands. Proposal to transform the energy system into 100% renewable by 2050. Renew. Energy 2022, 189, 199–220. [Google Scholar] [CrossRef]
  19. Icaza-Alvarez, D.; Jurado, F.; Tostado-Véliz, M. Smart energy transition with the inclusion of floating wind energy in existing hydroelectric reservoirs with a view to 2050. Ecuadorian case study. Energy Rep. 2023, 10, 2804–2816. [Google Scholar] [CrossRef]
  20. Icaza-Alvarez, D.; Galan-Hernandez, N.D.; Orozco-Guillen, E.E.; Jurado, F. Smart energy planning in the midst of a technological and political change towards a 100% renewable system in Mexico by 2050. Energies 2023, 16, 7121. [Google Scholar] [CrossRef]
  21. Icaza-Alvarez, D.; Jurado, F.; Tostado-Véliz, M. Smart energy planning for the decarbonization of Latin America and the Caribbean in 2050. Energy Rep. 2024, 11, 6160–6185. [Google Scholar] [CrossRef]
  22. Karatayev, M.; Gaduš, J.; Lisiakiewicz, R. Creating pathways toward secure and climate neutral energy system through EnergyPLAN scenario model: The case of Slovak Republic. Energy Rep. 2023, 10, 2525–2536. [Google Scholar] [CrossRef]
  23. Liu, W.; Best, F.; Crijns-Graus, W. Exploring the pathways towards a sustainable heating system–a case study of Utrecht in The Netherlands. J. Clean. Prod. 2021, 280, 125036. [Google Scholar] [CrossRef]
  24. Li, Y.; Yang, L.; Luo, T. Energy system low-carbon transition under dual-carbon goals: The case of Guangxi, China using the EnergyPLAN tool. Energies 2023, 16, 3416. [Google Scholar] [CrossRef]
  25. Lund, H.; Thellufsen, J.Z.; Sorknæs, P.; Mathiesen, B.V.; Chang, M.; Madsen, P.T.; Kany, M.S.; Skov, I.R. Smart energy Denmark: A consistent and detailed strategy for a fully decarbonized society. Renew. Sustain. Energy Rev. 2022, 168, 112777. [Google Scholar] [CrossRef]
  26. Meha, D.; Bresa, Q.; Bresa, A. Increasing variable renewables in coal-based energy systems under high electrification in the transport and heating sectors: The case of Kosovo. Energy Sustain. Dev. 2024, 82, 101523. [Google Scholar] [CrossRef]
  27. Noorollahi, Y.; Khatibi, A.; Eslami, S. Replacing natural gas with solar and wind energy to supply the thermal demand of buildings in Iran: A simulation approach. Sustain. Energy Technol. Assess. 2021, 44, 101047. [Google Scholar] [CrossRef]
  28. Özalp, M. The Effect of Nuclear Energy Installation in Turkey on Foreign Energy Dependency and Supply Security. C.Ü. J. Econ. Adm. Sci. 2017, 18, 175–188. [Google Scholar]
  29. Pastore, L.M.; Basso, G.L.; Cristiani, L.; de Santoli, L. Rising targets to 55% GHG emissions reduction–The smart energy systems approach for improving the Italian energy strategy. Energy 2022, 259, 125049. [Google Scholar] [CrossRef]
  30. Sorknæs, P.; Johannsen, R.M.; Korberg, A.D.; Nielsen, T.B.; Petersen, U.R.; Mathiesen, B.V. Electrification of the industry sector in 100% renewable energy scenarios. Energy 2022, 254, 124339. [Google Scholar] [CrossRef]
  31. Zhong, J.; Li, Y.; Wu, Y.; Shahidehpour, M. Optimal operation of energy hub: An integrated model combined distributionally robust optimization method with Stackelberg game. IEEE Trans. Sustain. Energy 2023, 14, 1234–1245. [Google Scholar] [CrossRef]
  32. Mühendistan. EnergyPLAN Simulation Program Descriptions. Available online: https://muhendistan.com/energyplan-simulasyon-programi-nedir/ (accessed on 20 March 2024).
  33. EPİAŞ. Available online: https://seffaflik.epias.com.tr (accessed on 15 September 2024).
  34. TEİAŞ. Established Powers According to Sources and Organizations. Available online: https://www.teias.gov.tr/kurulu-guc-raporlari (accessed on 2 October 2024).
  35. SHURA. Available online: https://shura.org.tr/net-sifir-2053-turkiye-elektrik-sektoru-icin-yol-haritasi/ (accessed on 14 August 2024).
  36. Aksoy, O.K.H.; Yiğit, V.; Bavbek, K.G.; Koyuncuoğlu Toma, E.; Rogner, M. Turkey’s Optimum Electricity Generation Capacity Towards 2023; SHURA Energy Transition Center: Istanbul, Turkey, 2020. [Google Scholar]
  37. Data and statistics. Available online: https://www.iea.org/data-and-statistics/data-sets (accessed on 15 August 2024).
  38. Türkiye Renewable Energy Outlook (TREO). 2024. Available online: https://iicec.sabanciuniv.edu/tr/treo (accessed on 11 November 2024).
  39. IEA. World Energy Outlook 2020; IEA: Paris, France, 2020. [Google Scholar]
  40. TEO. 2020. Available online: https://iicec.sabanciuniv.edu/tr/teo (accessed on 11 November 2024).
  41. IP. Available online: https://www.verimli-enerji.com.tr/wp-content/uploads/2017/03/ısı-pompalan-faydaları.pdf (accessed on 20 September 2024).
  42. İşeri, E.; Özen, C. The Position of Nuclear Energy within the Scope of Sustainable Energy Policies in Turkey. İ.Ü. J. Fac. Political Sci. 2012, 2024, 161–180. [Google Scholar]
  43. Chai, T.; Draxler, R.R. Root mean square error (RMSE) or mean absolute error (MAE)?—Arguments against avoiding RMSE in the literature. Geosci. Model Dev. 2014, 7, 1247–1250. [Google Scholar] [CrossRef]
  44. Cost Database. Available online: https://energyplan.eu/wp-content/uploads/2024/10/documentation.pdf (accessed on 22 September 2024).
  45. ETKB. 2023. Available online: https://enerji.gov.tr/bilgi-merkezi-enerji-elektrik (accessed on 6 September 2024).
Figure 1. Installed power sources in March 2024.
Sustainability 17 02665 g001
Figure 2. Energy distribution by sector.
Sustainability 17 02665 g002
Figure 3. Electricity consumption by heat pumps.
Sustainability 17 02665 g003
Figure 4. Energy consumption results based on demand growth scenarios.
Sustainability 17 02665 g004
Figure 5. The impact of changes in energy demand on CO2 emissions.
Sustainability 17 02665 g005
Figure 6. The share of energy in total energy production.
Sustainability 17 02665 g006
Figure 7. Total energy costs.
Sustainability 17 02665 g007
Table 1. Summary of the literature.
StudyYearCountry/RegionTopicMethod/ModelKey Findings
[4]2022MENA RegionCarbon reduction for 2030–2050Regional energy modelingRenewable energy systems and sector integration play a critical role.
[5]2024BeninRenewable energy targets (24.6–100%)Strategic planningCurrent progress makes 50% of the scenario more feasible; full transition is ambitious.
[6]2023TurkeyTrade deficit and nuclear energy optionEconomic analysisNuclear energy could reduce Turkey’s trade deficit and energy dependence.
[7]2022Ecuador (Galapagos)100% renewable energy and carbon footprint reductionSimulationCarbon footprint could be reduced by 85% by 2050 with full renewable adoption.
[8]2018Croatia (Zagreb)Smart energy system vs. traditional renewable systemScenario analysisSmart energy systems offer a more integrated and sustainable solution.
[9]2022China (Sichuan)Deep carbon neutrality analysis for 2030 and 2050EnergyPLANRenewable energy integration is crucial for achieving deep carbon neutrality.
[10]2024GermanyStrategies for achieving carbon targetsSectoral coupling analysisRenewable energy expansion and electrification of heating systems are critical.
[11]2022SpainDecarbonization potential of heat pumpsCarbon reduction scenariosHeat pumps can reduce emissions by 8.43%.
[12]2021Italy (Campania)PV and EV integration in shopping malls2050 scenario analysisPhotovoltaic panels can significantly reduce CO2 emissions.
[13]2024Island energy systemsUrban Building Energy Models (UBEMs)Modeling and analysisUBEMs support renewable integration by improving energy efficiency.
[14]2021MontenegroRenewable energy transition under the European Green DealScenario analysisAccelerated transition offers low-cost and low-drought risk benefits.
[15]2023ChinaRenewable energy transitionPolicy analysisChina’s energy policies and investments were comprehensively evaluated.
[16]2023FinlandCarbon neutrality targetsCritical raw material analysisBiomass use should be reduced, while nuclear and wind energy should be expanded.
[17]2021Ecuador (Cuenca)100% renewable energy scenarioSimulationTransition to renewable energy can reduce fossil fuel dependence.
[18]2022Galapagos Islands100% renewable energy transitionModelingPhotovoltaic and wind energy are recommended; local resource use should be maximized.
[19]2023EcuadorSmart energy systems and V2G impactScenario simulationV2G can enhance storage capacity and reduce fossil fuel dependence.
[20]2023Mexico100% renewable energy transitionSmart energy planningRenewable energy integration is crucial for sustainable development.
[21]2024Latin America and the Caribbean100% renewable energy and deep decarbonizationEnergyPLANWind and solar energy are critical; regional cooperation and regulations are necessary.
[22]2023SlovakiaPathways to a climate-neutral energy systemEnergyPLANSlovakia’s transition to a carbon-neutral energy system was evaluated.
[23]2021The Netherlands (Utrecht)Fossil-free heating scenariosSimulationAdopting heat pumps can achieve 17% energy savings.
[24]2023China (Guangxi)Low-carbon energy transitionEnergyPLANStrategies for renewable integration and emissions reduction were assessed.
[25]2022Denmark2045 carbon-free energy strategySmart Energy SystemsPublic and private sector support is essential for a carbon-free transition.
[26]2024GeneralElectrification and renewable energy integrationModelingHeat pumps enhance sustainability by reducing emissions.
[27]2021IranRenewable energy alternatives to natural gasSimulationSolar thermal collectors are the most cost-effective alternative.
[28]2017TurkeyImpact of nuclear investments on energy securityEconomic analysisNuclear energy can reduce dependency and enhance energy security.
[29]2022ItalyEmission reduction targetsPolicy and economic analysisIntegration of low-temperature district heat pumps is recommended.
[30]2022DenmarkIndustrial sector electrificationSimulationElectrification is assessed in 100% renewable energy scenarios.
[31]2023GeneralOptimal operation of energy hubsGame theory and optimizationA model was proposed to minimize costs under uncertainty.
Table 2. Comparison of energy modeling tools.
ModelScopeKey FeaturesApplication Areas
MARKAL/TIMESLong-term energy optimizationTechnology-based, cost analysisEnergy planning, carbon reduction
MESSAGEEconomic and environmental analysisEmission forecasting, optimizationNational energy policies
LEAPScenario-based energy modelingFlexible, demand analysisCarbon reduction scenarios
HOMERMicrogrid and distributed energyHybrid energy system analysisIsland grids, rural areas
RETScreenRenewable energy feasibilityFinancial and technical analysisRenewable energy projects
EnergyPLANNational/regional energy systemsHourly simulation, sectoral integrationRenewable energy integration, energy planning
Table 3. Data used in the EnergyPLAN model.
Data TypeDescriptionPurpose of UseSource
Energy Demand DataAnnual energy demand projections for different scenariosTo model varying energy needs across scenarios[33]
Installed Capacity Data (MW)Total installed capacity for different energy sourcesTo assess energy supply security and capacity expansion in scenarios[34]
Renewable Energy Share (%)Share of renewable energy sources in total energy productionTo analyze the impact of energy transition in different scenarios[35]
CO2 Emission Data (Mt)Annual CO2 emissions from energy productionTo evaluate environmental impacts[35]
Total Cost Data (Danish Krone—DKK)Total system costs, including investment, operation, and maintenance costsEconomic feasibility analysis[5,36,37]
Hourly Generation and Consumption Data (TWh)8784 h time series dataTo analyze the model’s hourly energy balance[33]
Heat Pump Adoption CurveProjected adoption of heat pumps over the yearsTo model the impact of heat pumps on energy consumption[38]
Fuel Prices and Energy Costs (DKK)Prices of fossil fuels, renewable energy, and electricityFor economic analysis[5,36,37]
Economic Parameters (carbon price, investment costs, interest rates) (DKK)Carbon emission prices, interest rates, and investment costsFor economic analysis and cost–benefit evaluation[39]
Table 4. Model validation between EPİAŞ data and EnergyPLAN model output.
Demand and SupplyEPİAŞ
(TWh/year)
EnergyPLAN
(TWh/year)
Difference
Demand139.30139.310.00
Dammed46.746.70.00
River hydro20.020.00.00
Solar27.827.80.00
Geothermal10.3010.310.00
Wind34.534.50.00
Table 5. Comparison of monthly average energy supply data.
MONTHSMonthly Average Energy Supply Data (MW)
EPİAŞEnergyPLANDifference (%)
January38,06938,117−0.001
February37,85937,968−0.003
March37,98037,8830.003
April35,73535,5090.006
May33,85634,287−0.013
June37,62337,715−0.002
July38,45738,607−0.004
August42,30642,338−0.001
September37,76037,5660.005
October33,75133,7620.000
November34,36634,473−0.003
December35,71435,739−0.001
Table 6. Monthly average wind supply data.
MONTHSMonthly Average Wind Supply Data (MW)
EPİAŞEnergyPLANDIFFERENCE (%)
January416641080.01
February392738770.01
March42794512−0.05
April358334740.03
May280325950.07
June401039750.01
July56065751−0.03
August370635940.03
September340333260.02
October42554380−0.03
November40944138−0.01
December348933680.03
Table 7. Error analysis results and interpretations.
Error MetricsResult (TWh or %)Explanation
MAE (Mean Absolute Error)≈0.002 TWhThe average difference between the model and actual data is extremely small.
MAPE (Mean Absolute Percentage Error)≈0.001%The model’s predicted values are 99.999% accurate compared to actual data.
RMSE (Root Mean Square Error)≈0.002 TWhThe error distribution is very low, with no significant deviations.
R2 (Coefficient of Determination)≈0.99999The model accurately predicts nearly all variations in actual data.
Table 8. Renewable energy share by scenario.
Renewable Energy Share (%)
ScenariosRES for Non-Nuclear ScenariosRES for Nuclear Scenarios
202532.5332.53
2025 a33.3632.70
2025 b33.3632.70
2025 c44.5443.59
203034.4934.49
2030 a36.2735.02
2030 b36.2735.02
2030 c55.1252.87
203536.2236.22
2035 a39.1836.79
2035 b39.1836.79
2035 c69.7262.91
204036.7436.74
2040 a41.0637.00
2040 b41.0637.00
2040 c81.6969.80
Table 9. CO2 emissions results by scenario.
CO2 Emissions Amounts (Mt)
ScenariosCO2 Emissions for Non-Nuclear ScenariosCO2 Emissions for Nuclear Scenarios
2025362.9362.9
2025 a366.66361.67
2025 b356.39351.41
2025 c326.61321.82
2030386.11386.11
2030 a391.85382.04
2030 b355.73345.91
2030 c295.67286.61
2035401.58401.58
2035 a411.74392.49
2035 b358.44339.19
2035 c254.88238.26
2040410.58410.58
2040 a430.90398.35
2040 b325.19292.64
2040 c158.82132.76
Table 10. Costs of the scenarios.
ScenariosCOSTS (Million DKK)
Total Variable CostFixed Operating CostsAnnual Investment CostsTotal Annual Costs
2025
2025 a410,871363,992524,5231,299,387
2025 b405,011362,345524,8901,292,246
2025 c381,776364,528532,0471,278,351
2030
2030 a452,324369,466531,5461,353,336
2030 b427,787364,736532,5991,325,122
2030 c375,278366,328546,9331,288,539
2035
2035 a499,365262,347354,2761,115,988
2035 b459,655264,713372,7641,097,132
2035 c361,746268,843401,5141,032,103
2040
2040 a558,822373,143536,2281,468,193
2040 b481,895362,244538,6531,382,792
2040 c321,657372,667592,2141,286,538
Table 11. Costs of the scenarios (nuclear).
ScenariosCOSTS (Million DKK) with Nuclear
Total Variable CostFixed Operating CostsAnnual Investment CostsTotal Annual Costs
2025
2025 a407,097364,747525,7821,297,626
2025 b401,236363,100526,1491,290,486
2025 c378,036365,283533,3061,276,627
2030
2030 a444,633370,977534,0641,349,674
2030 b420,096366,247535,1171,321,460
2030 c368,181367,838549,4511,285,470
2035
2035 a483,951265,368359,3131,108,632
2035 b444,241267,735377,8001,089,776
2035 c351,229271,865406,5501,029,644
2040
2040 a532,067378,431545,0411,455,539
2040 b455,139367,532547,4661,370,137
2040 c314,016377,955601,0271,292,996
Table 12. Cost–benefit analysis data and results.
ScenarioRenewable EnergyNuclear Energy
Investment Cost (million DKK)592,214601,027
Operation and Maintenance (million DKK)372,667377,955
Fuel Cost (million DKK)321,657314,016
Total Cost (million DKK)1,286,5381,292,996
CO2 Emissions (Mt)158.82132.76
Carbon Reduction Benefit (Million USD)11,9119957
Fuel Import Savings (Million USD)2025
Total Benefit (Million USD)31,91134,957
Net Benefit (Million USD)−1,254,626−1,258,039
Disclaimer/Publisher’s Note: The statements, opinions and data contained in all publications are solely those of the individual author(s) and contributor(s) and not of MDPI and/or the editor(s). MDPI and/or the editor(s) disclaim responsibility for any injury to people or property resulting from any ideas, methods, instructions or products referred to in the content.

