Abstract
The integration of blockchain (BC), artificial intelligence (AI), and green finance (GF) to promote sustainable investments and tackle environmental issues is examined in this study. By employing sophisticated analytical methods, the study seeks to pinpoint the main forces behind GF growth, especially in the field of renewable energy. To guarantee reliable statistical analysis, financial data from Taiwanese companies listed on the stock exchange between 2000 and 2020 are examined using the Generalized Method of Moments (GMM). Furthermore, to make use of AI’s potential to pinpoint the key elements affecting GF development and investment, attention-based convolutional neural networks (CNNs) are used. The links between GF, BC, and AI are analyzed and visualized using a novel method called the Financial Filtered Graph (FFG). The results of the study demonstrate that by increasing the precision of investment forecasts and identifying critical factors that affect GF growth, AI-driven solutions can greatly improve the sustainability of green finance strategies. The suggested methodology effectively supports sustainable investment decisions, as evidenced by its remarkable 98.8% classification accuracy. According to the findings, integrating AI and BC has a lot of potential to enhance green finance’s accountability, transparency, and decision-making processes, all of which will support long-term economic and environmental sustainability.
1. Introduction
Achieving sustainable development has emerged as a top worldwide issue in light of growing environmental deterioration and resource constraints. Blockchain (BC) and artificial intelligence (AI) in particular are digital technologies that have enormous promise for solving this problem by separating economic progress from its detrimental effects on the environment [1,2]. Even while BC and AI are exciting new discoveries in the digital arena, their design and application will have a big impact on sustainable outcomes. By using the promise of BC technology, supply chains may achieve transparency, accountability, and ethical sourcing, enabling fair trade [3,4]. Given increasing worries about the environment and the urgent need for sustainable development, it is imperative to critically examine green financing as a driver of renewable energy expansion in developing nations. The specific mechanisms via which green financial instruments like green bonds, renewable energy investments, and the functioning of carbon markets interact to affect the mainstreaming trajectory of green energy are not well understood, despite the growing recognition of green finance’s potential in environmental stewardship. The complexities of these interactions create a challenging problem, especially when combined with the differing ability of the investment industry in various developing nations to support investment in green finance. In the context of developing nations, where the stock markets are typically less advanced and more unpredictable, this study aims to break down these complexities and provide insight into how well green finance can advance the renewable energy sector [5].
Given the pressing need to switch to renewable energy, a careful examination of GF’s workings and effectiveness in advancing supportable energy alternatives is imperative. This study examines the intricate dynamics of GF and its influence on the renewable energy environment across a range of nations that are developing in order to shed light on the subtleties of financial tools and their role in directing the transition towards cleaner energy sources [6]. The mutually beneficial relationship between renewable energy and GF has become more and more highlighted in the scholarly discourse on these topics. According to a large body of research, the development and implementation of sustainable energy solutions are significantly accelerated by the introduction of green money into the RE sector [6]. For example, green bonds have been emphasized as useful instruments for raising the funds required for significant RE projects, providing investors with a concrete way to support sustainable development objectives. However, it has also been shown that investments in RE have both financial and environmental advantages, attracting a wider pool of capital and fostering the growth of the sector [7].
Since global warming and CO2 emissions are major environmental issues, the idea of sustainability, which is defined as a “political quality distributed between human and non-human actors within a milieu” [8], has gained a lot of attention. As a result, using renewable energy sources is essential to achieving sustainable environmental objectives [9]. According to [10], innovative renewable energy sources are mostly employed in developing nations in an effort to create a cleaner and more sustainable environment, and it is widely believed that energy advancement fosters sustainable development [11].
Environmental sustainability must be promoted immediately due to the swift escalation of environmental issues including resource depletion and climate change. Green financing (GF) has become a vital instrument for directing funds toward sustainable initiatives and renewable energy. Nevertheless, despite its increasing significance, little is known about the intricate connections between business characteristics, green finance (GF), and the function of cutting-edge technology like artificial intelligence (AI). The desire to use AI and data analytics to pinpoint the main forces behind GF growth, better renewable energy investment choices, and accelerate environmental progress is what spurred this study. The project attempts to offer practical insights for enhancing green finance strategies and promoting long-term sustainability by bridging the gap between finance, artificial intelligence, and sustainability.
Researchers have recently looked into how the digital economy affects several facets of sustainable growth. Sun et al. [12] examined the association between industrial wastewater discharge and the digital economy in 281 Chinese cities at the prefecture level. Likewise, Yang et al. [13] clarified the relationship between the digital economy and regional sustainability by concentrating on how they interact. Chien [14] studied how energy efficiency functions as a mediator in the sharing economy and how it affects sustainable development objectives. Sustainable development has also been examined in relation to BC technology, which is intimately related to the digital economy. In order to achieve sustainability goals within the food supply chain, Chandan et al. [15] investigated the usage of BC, highlighting its potential to improve traceability and transparency. Wang et al. [16] examined the potential and difficulties associated with the interaction between digital technology and green development. Litvinenko [17] looked at how the internet economy affected the mining industry and what that meant for managing resources sustainably. Lastly, Nayal et al. [18] determined the critical elements for a successful BC implementation that supports supply chains for sustainable agriculture. Together, these studies advance our knowledge of how the digital economy and sustainable development relate to one another across a range of industries. Sustainability goals must be given top priority in the development and application of BC and AI. We can take advantage of these technologies’ transformative potential to promote a more inclusive and sustainable digital economy by integrating them with the ideas of sustainable development. This calls for taking into account social and environmental aspects in addition to economic ones. To steer the development of BC and AI towards advantageous environmental consequences, stakeholder participation, strong governance procedures, and the incorporation of sustainability considerations are crucial elements. Few studies have looked at the integration of AI models with financial data to discover important drivers of GF growth and investment in renewable energy, despite the fact that prior research has addressed green finance and its role in sustainable investments. Without taking into account the potential of AI-driven solutions to provide more precise and thorough insights into the dynamics of green finance, the existing literature frequently concentrates on financial indicators or conventional techniques of environmental analysis. To overcome this research gap, this paper contributes the following:
- By offering a thorough examination of the association between green finance methods and the growth of the RE sector in emerging countries, an issue that has received little attention, this study fills a significant gap in the knowledge. Using the Generalized Method of Moments (GMM) for the full 2000–2020 timeframe, this study provides new understandings of the intricate, dynamic interactions between these important variables.
- The long-term dynamic interactions between the major factors influencing green finance (GF) over a 20-year period are examined using GMM. It facilitates the measurement of the effects of different financial and economic factors on GF development and investment as well as the identification of causal links. It offers a thorough grasp of the trends, dangers, and possibilities in green finance by taking the entire time period into account.
- AI is used to determine the key elements influencing GF investment and expansion. For GF trends and patterns, CNN’s attention mechanism increases the prediction accuracy and facilitates feature extraction. This strategy uses cutting-edge AI analytics to facilitate improved sustainable finance decision-making. Blockchain (BC), Financial Filtered Graph (FFG) for GF, and AI analysis are utilized.
- The complex connections between blockchain, AI, and Green Finance are examined and shown via the FFG technique. By exposing the underlying patterns and dependencies, it offers a network-based approach for comprehending how different technologies interact. Researchers, investors, and regulators can use this innovative visualization tool to make decisions based on data for sustainable finance.
- The results demonstrate how AI-driven green finance solutions have the potential to greatly enhance people’s lives and establish sustainable development. The classification results of the proposed AI-driven GF management revealed a 98.8% increase in accuracy, highlighting the vital role that GF plays in promoting environmental sustainability globally.
This paper’s structure is designed to offer a thorough and cogent examination of the use of deep learning and BC techniques in maintaining financial data processing for improved financial market sustainability in the framework of GF. Section 2 begins with a comprehensive analysis of related work, and looks at previous research and publications that have advanced our knowledge of financial statement fraud and its applicability in the rapidly changing field of GF. By outlining the Materials and Methods used in our investigation, we address the core of our research in Section 3. The actual results of our study are summarized in Section 4, the Results and Discussion, together with enlightening discussions on the data’s importance and implications for the sustainability of the energy market and green finance. In Section 5, we wrap up our work by outlining the main conclusions and highlighting the wider significance of our findings.
2. Related Work
Distributed technologies like BC and AI have the ability to improve the visibility of supply chains, optimize the use of resources, and restructure incentives to lessen negative externalities when used in conjunction with appropriate value frameworks that put the public good first. But care must be taken to ensure that new technologies do not just speed up pollution and excessive consumption [19]. Hong and Xiao [20] investigated how BC technology and AI might be used to coordinate supply chains and lessen their effects. Additionally, they can help with carbon accounting and offsetting, as well as encourage recycling and circular enterprises. Deploying technologies taking the collaborative frameworks of social and ecological factors into account is crucial to achieving these benefits. In order to help nations take smart and environmentally friendly industrial transformation paths, the report also provides policy suggestions that highlight important leverage areas for digital innovation. Governments may encourage accountability, transparency, and traceability in supply chains by utilizing BC and artificial intelligence. This will encourage sustainable practices and lessen their negative effects on the environment. A numerical analysis shows that integrating BC and AI into supply chain strategies significantly increases efficiency. To sum up, the incorporation of cutting-edge digital technology presents substantial chances for maximizing economic activity and production systems while giving sustainability goals top priority for the benefit of both society and the environment.
Chen and Umair [21] investigated how green financing and the RE sector interacted in a 30-nation-sample between 1990 and 2018. The objective was to examine the interrelated impacts of carbon markets, green bonds, and RE investments, with a focus on how the banking system shapes these linkages. The Generalized Method of Moments (GMM) is used to analyze the data and understand the complex relationships between the factors in order to achieve this goal. The rise of green finance presents a promising opportunity to address environmental concerns and promote sustainable economic growth at the same time. However, little is known about how much of an impact it has on carbon markets and the uptake of renewable energy, particularly in poor countries. The financial maximally filtered graph (FMFG) technique used in several domains was proposed by Hemanand et al. [22] to perform green finance analysis. When the suggested method and the neural model were compared, it was found that the one suggested has a greater accuracy of 98.85%. Metawa et al. [23] presented a novel method for detecting financial statement fraud by utilizing deep learning techniques. In our study, we analyze market data and spot dishonest behavior using a temporal convolutional network (TCN). Our study carefully examines the relevant literature, emphasizing the crucial junction between green energy finance principles and financial statement fraud detection, while the Results and Discussion Section offers thorough assessments and comparisons of conventional baselines, data sources, variable selection, and the design of the TCN model. Our results highlight the TCN model’s potential to provide transparency to the energy markets by demonstrating its remarkable accuracy and dependability in identifying financial statement fraud.
Ramzani et al. [24], in their study, placed emphasis on Denmark and Germany throughout the crucial years of 2019 and 2020, examining how artificial intelligence (SI) and novel finance strategies interact to impact the growth of the RE sectors. Regression analysis, ANOVA, and paired sample t-tests were employed as part of a rigorous methodology to examine the changes in RE production and the impact of AI-driven financial strategies. The findings highlight how AI-powered green finance solutions may effectively bring about significant improvements, positioning Denmark as a likely model for sustainable development. Germany’s reliable electrical infrastructure and the excellent connection revealed by a regression analysis demonstrate the sustainability of its ecologically friendly economic practices. Schulz and Feist [25] examined how distributed ledger technology can be applied to creative climate finance by concentrating their investigation into the Green Climate Fund. Following our examination of several digital system models and possible applications, we will go over some potential political and technological obstacles, such as those pertaining to standards and safeguards, governance procedures, national ownership, and additional capitalization. According to our research, distributed ledger-based solutions may help this fund’s efforts in crucial domains including impact assessment and multi-stakeholder coordination.
Almadadha et al. [26] fills this gap by examining how the decentralized and impenetrable nature of BC technology might improve investment methods, green financial products, and financial disclosures pertaining to climate change. By utilizing these special qualities of blockchain technology and applying Knowledge Discovery in Databases (KDD) techniques, we find trends and create guidelines that emphasize BC’s contribution to financial sector accountability, transparency, and sustainability. This article highlights BC’s disruptive potential in furthering ESG activities and offers a balanced viewpoint on its integration into financial accounting through a thorough review of the literature with case studies. The purpose of the study by Hesary and Yoshino [27] was to highlight the challenges related to green financing and investing in RE projects, and to provide practical solutions for GF gap closure. Workable solutions include expanding the role of public and non-banking financial institutions in long-term green investments, utilizing tax spillover to increase the rate of exchange of green projects, establishing community-based trust funds, lowering credit risk through the creation of green credit guarantee programs, and reducing the risks associated with green investments through financial and policy de-risking.
Hou et al. [28] used cross-country panel data from 2000 to 2021 to empirically evaluate the green financing impact on the growth of RE, using 53 nations and areas that have established green finance enterprises as a research sample. The findings demonstrate that GF has a positive impact on the development of renewable energy, and that its marginal impact is steadily increasing as the level of RE development improves. Only in developed countries, emerging economies, countries with a high degree of GF development, and countries with stringent environmental regulations does GF play a significant role in the development of renewable energy; it is absent from underdeveloped countries, countries with low levels of GF development, and countries with loose environmental regulations. Through increased resource efficiency, streamlined logistics, and the development of innovative business models, digital technologies have the ability to support these crucial industrial transformations. However, in order to fully utilize digital prospects, policies must be in line with one another and guide innovation to maximize benefits for both people and the environment. By coordinating digital innovations with environmental concerns, this paper suggests policy measures that nations might implement to support intelligent, green industrial transformations.
3. Proposed Materials and Methods
This section discusses the data sources used for this study and the proposed methodologies for the analysis of BC-assisted GF sustainability for investment in the global market, as illustrated in Figure 1. The data are preprocessed initially to strengthen them for further processing. Then, the intelligent system analyzes the sustainable investment on GF based on blockchain and ML approaches. The relevant financial data are captured through the GAM approach and then the Financial Filtered Graph is applied to analyze the data followed by a BC-assisted attention mechanism-based convolutional neural network (ACNN) for the analysis of renewable energy source forecasting for sustainable investment in the global market. The step-by-step process of this model is described in the following sections as follows:
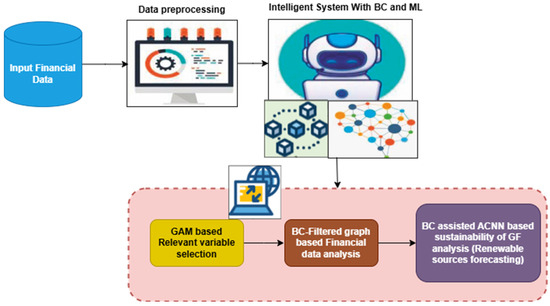
Figure 1.
Overview of proposed BC-AI-assisted GF for sustainable development.
- This study determines the key factors impacting GF development and investment in renewable energy by utilizing AI models like attention-based CNN and the Generalized Method of Moments (GMM) to evaluate financial data.
- A unique method for thoroughly analyzing green finance trends has been made available with the launch of the Financial Filtered Graph (FFG) approach for GF analysis.
- AI-based financial solutions are facilitating sustainable growth in the financial sector with the use of attention-based CNN (ACNN) with blockchain along with statistical methods like regression and t-tests in the global market.
3.1. Data Sources
A carefully chosen sample of businesses listed on the Taiwanese bourses between 2000 and 2020 was used for this investigation. Our dataset included 191 companies in total after painstakingly removing any missing or partial information. Of these, 80 businesses were found to have documented cases of financial statement fraud (FSF), which is defined as the release of false or deceptive financial statements. Such false reporting did not exist for the remaining 111 businesses in our sample. A balanced dataset with a 1:2 ratio between businesses with and without FSF was the outcome of this selection. Both financial as well as other data were carefully gathered from Taiwanese financial magazines to create our dataset, guaranteeing the inclusion of thorough and pertinent information. Table 1 provides a concise summary of the industries included in our sampling dataset, giving a clear picture of the areas we examined.

Table 1.
Dataset dispersal of the sampled companies from the industry domain (2000 to 2020).
3.2. GAM Based Factors Analysis
The dependent variable in this study is a binary dummy variable, meaning that organizations that have stated cases of FsF are assigned 1, while companies which have not reported these types of fraud are assigned a value of 0. We have carefully selected a collection of 18 factors that are commonly used to measure financial statement fraud in order to evaluate this occurrence. These factors, which are also known as corporate governance variables, include four non-financial variables and fourteen financial indicators using the GAM method.
While accounting for a number of financial and economic variables, the generalized approach of moment (GAM) model seeks to assess the correlation between particular banking performance metrics and the use of renewable energy. The model is specified as in Equation (1):
where is the RE consumption of country c at time t and the remaining variables are defined in Table 2. is the control variable that could affect the RE usage of the country such as the GDP growth, trade openness, and so on. is the country-specified effects and is the time-specified effects, to observe the heterogeneity of the country over time, and denotes the error term. The electricity consumption is obtained as
where E denotes the consumption of energy, denote the parameters that reflect the technology changes and composite input, respectively, PE is the price of the energy, F denotes the performance of financial data which includes efficiency and profitability, and PO denotes the production level output. Nonlinear correlations between these parameters and energy consumption are indicated by the presence of α and β in exponents, which can result in either an improvement in financial results or a drop in PE (energy price). The equation suggests that the relative technology importance versus composite input (α/β), PE, F, and PO all have an impact on energy consumption (E). Table 2 offers a succinct synopsis of the measures used in our analysis along with an overview of the research variables. Table 3 states the statistical results of the variables used for this study. There are six factors chosen that are applicable to bank performance, which includes the Return on Assets, equity ratio, net income, gross ratio, earning per share, and percentage of revenue. The sum of the financial score is 102.34 and the standard deviation is 21.7, which means that higher scores will have greater financial stability in terms of GF.
Table 2.
Variables of finance and corporate governance.
Table 3.
Statistical results of the variables.
3.3. Filtered Graph-Based GF Analysis
It is recommended to conduct multiple network investigations in order to simultaneously examine many forms of interdependence in huge databases, for example, by concentrating on four-layer ML networks that relate to partial, nonstationary, and linear correlations between various green financial time variables. The sparse graph of each layer is generated using a conventional network filtering BC procedure, and then the completed sequencing networks are analyzed. Significant alterations in the network’s understood multiplex assets are revealed by the financial data multiplex’s time transformation. In green finance, other such shifts are linked to periods of financial strain. If the single-layer networks are identical, some functionality that differs from the sequenced structure is imperceptible.
For the items related to the financial terms, filtered graphs are incorporated with the ML model, which includes a single hidden layer of network nodes of tj. The output of node i is declared by the processing of wi weight connections with the descriptor . The weight is computed as follows:
H denotes the factors of weight, H(i,j) denotes the connection of weight from input k to ith unit. In a similar manner, the nerve fiber efficiency is assessed. Hi is computed as follows:
where n denotes the hidden layer, H denotes the linking if hidden unit k to minimize the overall i. The shifts in f enable the network to arrange the nonlinear relationship between the data. The sigmoid function is declared as follows:
A network’s training D and H must be approximated, and the linear transfer function f(D) = D must be computed as part of the training process, which is often based on descent training to minimize a portion of an error signal along with a dataset labeled with training analyses. Another way that it differs from a conventional FG network is that operators have taken the position of measurements and initial parameters, respectively. The buried neurons and the different activation site classes constitute a single data-enhanced neuronal class in the classification problem shown in the following equation:
where and are and ’s descriptors, respectively. Every relationship that shares a linguistic label needs to belong to the same class. It has been decided that the rule components D1 and D2 will share the ; therefore, its account is the same in both systems. Let us assume that the study has dataset D with factors F as to insert the data with the global directions of for classification problems. The classifier follows these steps:
Step 1: Choose an alternative sequence from .
Step 2: Multiply the {i − 1, 2, … n} for the processing elements to select the classifier as follows:
The computation is structured as follows if there is no concept node Q:
The sigmoid function with ACNN is trained for he GF-based sustainable growth. The ACNN is described in Section 3.4.
3.4. BC with ACNN-Based Sustainable Growth Development Analysis in Terms of RE Forecasting
An attention-assisted convolutional neural network (ACNN) model for RE forecasting is described in this research. A convolutional neural network (CNN) and a focused attention layer make up the model’s layers (Figure 2). While the CNN layers concentrate on the significance of each attribute and forecast the network’s behavior, the attention layer determines the attention importance of every input attribute or element. For intrusion detection, a CNN’s basic design usually consists of a mix of convolutional layers, layers of pooling, and fully linked layers [29]. For the proposed model, we employed three fully interconnected layers, one convolution layer, and one max-pooling layer. The results of these methods clearly demonstrate that, when applied to all of the various datasets, the model based on a chosen set of configurations outperforms all alternative configurations (Figure 2).
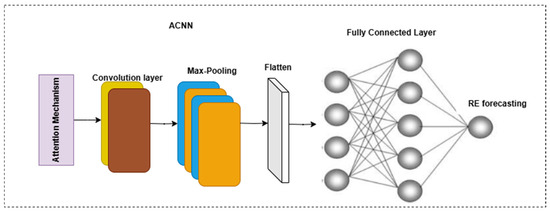
Figure 2.
ACNN-based RE forecasting for sustainable growth based on GF.
Using the attention layer, the proposed model generates a set of focus values that show how important each of the key components is to the current question. To enable this, a softmax function is applied to obtain a set of normalized values for attention after calculating a similarity score between the query and each key element. The output of the attention layer is determined by weighting and adding the results after the attention weights have been calculated. The attention weights Aij for the set of queries Q and keys K with values v are computed using Equation (10) for query i and key j.
where denotes the ith query, K is the jth key, and vector dimensionality is defined as d with the softmax activation function that is used to compute the attention weights. This weight has been used to compute the attention layer output as follows:
where X is the output from ith node and v is the jth value. The output of the attention layer is given as the input into the CNN for RE prediction. The convolution process is described as follows:
where is the convolution layer input, P declares the neuron of the previous layer, is the kernel from I to j and b is the bias. The activation function used in convolution layer is ReLU, which is declared in f as in Equation (14):
During the process of pooling operation from the convolution process in the region, R is chosen as the output of P.
Following the application of the max-pooling layer, the final layer of the pooling’s resultant shape is transformed into a one-dimensional array using the flatten method. This array is subsequently sent as input to the fully linked layers. The ReLU activation function is used by the completely connected layers. As shown in Equation (16), the final completely linked layer generates the result using the softmax function.
An attention-based convolutional neural network (CNN) can be crucial in determining the main factors impacting GF growth and investment in renewable energy when highlighting the connection between green finance (GF), blockchain (BC), and artificial intelligence (AI) to enhance environmental advancement and sustainable investments. The training methods and hyperparameters for this type of model are listed below (Table 4).
Table 4.
Hyperparameters of GmM-ACNN.
4. Results and Discussions
The RE performance influences the consumption of energy based on financial and non-financial data. The performance of the BC-based solutions is evaluated using fraudulent and non-fraudulent financial data. The dataset is divided into sets for testing, validation, and training. To prevent look-ahead bias, it is ensured that the training set includes data that occur prior to the validation and test sets. A 70–15–15% split might be used as the average. Classification measures like the F1 score, accuracy, precision, recall, and Area Under the Curve (AUC) are used during binary classification to assess the model. The accuracy or multi-class F1 score are used if the objective involves classifying data into different classes.
4.1. Correlation Analysis
The matrix of correlations for the variables used in the econometric estimation can be found in Table 5. It indicates that multicollinearity in econometric computations is unlikely since there is no discernible correlation between the two variables.
Table 5.
Multicollinearity analysis.
4.2. Philips–Perron Test
Because they handle heterogeneity and take into consideration specific unit root processes, these tests are widely used. Although the upgraded Dickey–Fuller logit test outcome (11.611 with chi square) indicates that all variables are stationary, a significance score over the 1% threshold (with better validity) indicates that certain components are just static after the initial difference. The improved Table 6 displays the results of the cross-sectional enhanced panel unit root Dickey–Fuller and Phillips–Perron tests, as well as the cross-sectional augmented panel unit root test by Bouyghrissi et al. [30]. As previously stated, the Z-score, sustainable power use, and the dependence test were the criteria that demonstrated cross-sectional independence based on the cross-section. For the first time, the following variables were used in this work as unit roots with Phillips indicators. According to Table 3, the Z-score remains constant at this level, whereas the green economy and RE consumption (REC) remain constant at the first difference. The CIPS-test is used to examine the other parameters. At the same threshold, the management inefficiency, EPS, RIT, equity assets, and liabilities are all unchanged.
Table 6.
Phillips–Perron (PP) results.
Differences in income between nations may have an effect on how the banking sector encourages the use of renewable energy. The nations are separated into three categories. The information is broken down into five income groups according to the World Bank’s World Development Index. These sections have been divided into three groups for the sake of this article. Both upper-middle-income and lower-middle-income countries make up the middle-income group in Figure 3. The statistics also included one income group for growing nations and two for high-income countries. Figure 3 displays a high-level summary of each of the three income groups, as well as data on the number of nations and the average GDP per capita for each. There are some variations when the outcomes of econometric computations for various income brackets are examined more thoroughly. When conducting econometric calculations for a high-income panel, it is crucial to include the market capitalization, quality of assets, and managerial inefficiencies. Both the road and the Z-score (financial stability) are negligible. Relevant coefficients indicate that for every unit increase in market capitalization, sustainable energy consumption as a percentage of overall power usage improves by roughly 0.02 percentage points. Managerial inefficiencies and the asset quality have a significant impact on the percentage of renewable energy used. The dependent variable drops by 0.1.
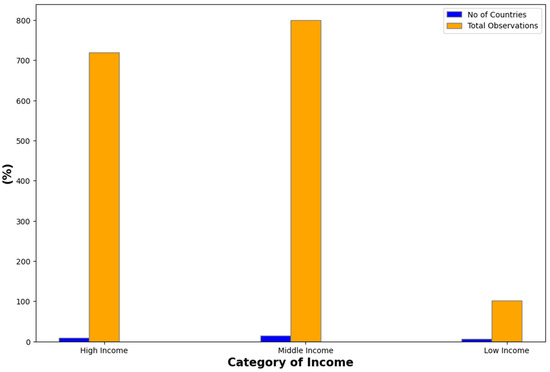
Figure 3.
Each category and number of countries with observations.
4.3. Impact of Filtered Graph with ML Approach Based GF Sustainability Analysis
The term “GF” in Figure 4 refers to funds invested in customer goods, activities, healthcare, and financial arrangements that boost the nation’s economy. The environment fund is one aspect of online green finance, but it is not the only one. It also makes reference to a wider variety of additional ecological objectives, like insurance for biodiversity, water cleanliness, and contemporary contaminant control. Both moderation and adjustment are especially linked to activities related to environmental change: in mitigation, financial streams refer to investments in projects and activities that help reduce or maintain a safe distance from emissions of substances that deplete the ozone layer, while in adjustment, financial streams refer to speculations that also help reduce the susceptibility of people and products to the effects of global climate change. The client plays a more significant part in the private equity industry, impacting and molding the hierarchy schedules that can serve as willing loan possibilities. Natural corruption sites of the sector include things like air pollution; water contamination and shortages; stream encroachment, which is responsible for the spread of medical, pharmaceutical, and healthcare waste; forest loss; loss of green space; and biodiversity, that is transformed by the Green Climate Fund. It has to help reduce poverty and be environmentally sustainable. It is an essential method for incorporating the financial aspect of the shift towards becoming asset-efficient but for lower-income economies and helps in the adjustment to environmental changes.
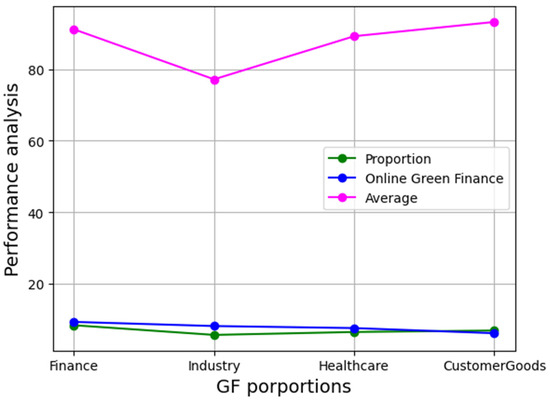
Figure 4.
Online GF using filtered graph impact analysis.
The analysis in terms of the filtered graph for GF management in terms of the processing time is investigated and the results are shown in Figure 5.
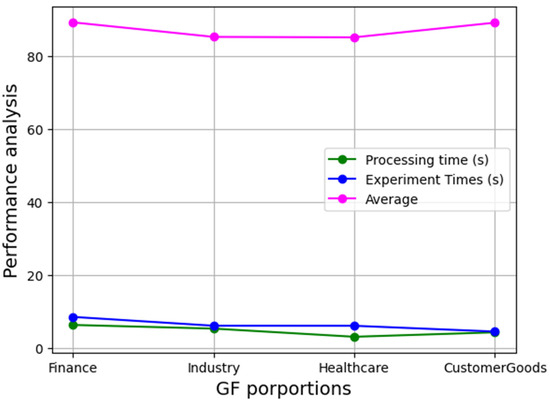
Figure 5.
Processing time of filtered graph with ACNN analysis.
4.4. Impact on RE Forecasting with BC-Based ACNN
The comparison results in terms of forecasting the RE in GF that impacts countries’ sustainability are analyzed in terms of the training and testing accuracy and loss. The results are illustrated in Figure 6. The proposed model is compared with existing approaches such as the financially maximally filtered graph with a CNN [22], the Temporal convolutional neural network (TCNN) [23] and the regression model [24]. The performance of the proposed BC-ACNN-based RE forecasting, which impacts the GF, is illustrated in Figure 6 and Figure 7, which proves the efficiency in terms of the loss and accuracy of the proposed BC-ACNN model, respectively. It is clearly shown that the developed model secured reduced loss and improved the accuracy in forecasting the RE’s impact from the financial data. There is a slight deviation between the testing and testing loss. In 100 epochs, the proposed model secured 0.5% of the training loss and 0.42% of the testing loss. Similarly, for 100 epochs, the proposed model secured 0.98% of the testing data accuracy and 0.986 of the training data accuracy.
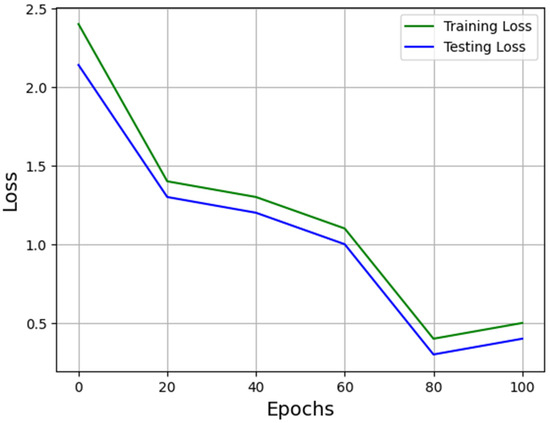
Figure 6.
Training with testing loss of proposed model.
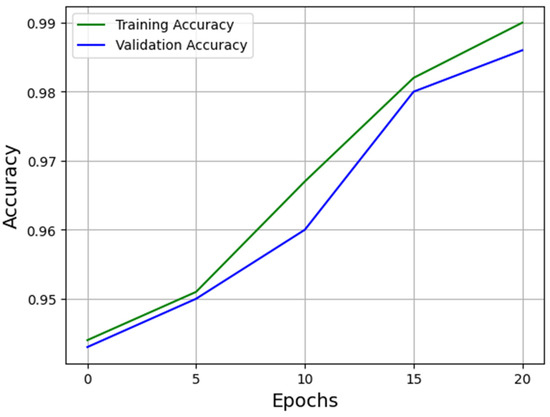
Figure 7.
Training with testing accuracy of proposed model.
Figure 8 shows the performance comparison of approaches that are related to green finance factors that influence the sustainability growth of a nation. Comparatively, the proposed model achieved an improved performance with an accuracy of 0.986, precision of 0.976, recall of 0.978, and F1 score of 0.981. The other considered approaches, such as FGCNN, secured 0.95 for accuracy, 0.943 for precision, 0.941 for recall, and 0.948 for the F1 score. The TCNN model obtained 0.941 for accuracy, 0.93 for precision, 0.928 for recall, and 0.931 for the F1 score. Similarly, the regression model secured 0.963 for accuracy, 0.951 for precision, 0.953 for recall, and 0.981 for the F1 score.
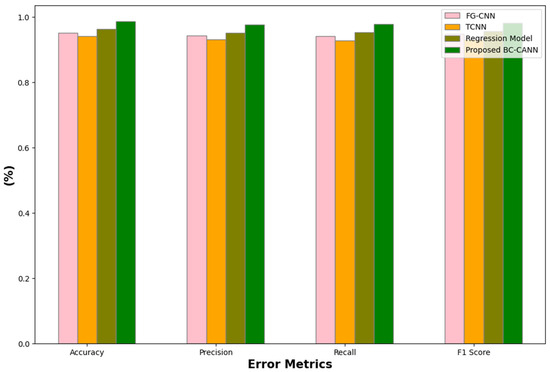
Figure 8.
Performance comparison of RE’s impact on GF approaches.
The impact of the asset quality on the consumption of RE across various income groups lends more credence to the topic, demonstrating that a low asset quality—as demonstrated by an increase in non-performing loans—decreases the usage of green energy sources. This finding is in line with the greater amount of research that highlights the significance of prudent asset management in supporting green financing flows. How high-income and other income groups differ from one another, however, with regard to the influence of asset quality on the use of renewable energy, calls for further research into how open markets and easy access to information might support sustainable energy initiatives financially. A crucial component of green finance’s role in sustainable development is highlighted by the disparate effects of investments in renewable energy across socioeconomic groups, especially the more noticeable benefits in lower-income areas relative to high-income nations. This contradiction implies that important factors influencing the efficacy of these expenditures are the legislative and economic environments in which they take place. This study offers significant new information about how blockchain and renewable energy are impacted by green finance in underdeveloped nations. However, it is limited. It only examines 30 low-income countries, which might not adequately reflect the state of the world or account for all relevant variables. The results may not be applicable to developed economies due to their emphasis on underdeveloped nations. The study may have limitations unique to this econometric approach because it relies on a GMM with filtered graph-based ML for analysis. Additionally, it ignores the social and environmental effects of GF, which stakeholders and policymakers must take into account. These restrictions point to the necessity of a more extensive study that examines the effects of green financing from a wider angle and uses a variety of approaches.
5. Conclusions
This study proposed a filtered graph-based ACNN to investigate the dynamic spillover effects of green bonds, RE investments, and sustainable growth, as well as a GAM-based factor analysis that influences the implications of green financing. Particular emphasis is placed on how the banking system shapes these interactions. The empirical findings from our study shed important light on a number of crucial aspects of how green finance helps emerging nations adopt renewable energy sources and how this affects sustainable growth. First, a striking and strong link between green bond issuance and renewable energy investments was found. This implies that the provision of green finance through bonds has made it easier for money to be allocated to renewable energy projects in the nations that are being considered. By utilizing efficient procedures and expertise exchange, emerging nations working together in GF can accelerate the adoption of sustainable policies by facilitating sharing of information and capacity building. This study’s concentration on Taiwanese companies registered on the stock exchange is one of its limitations; it might not adequately represent the dynamics of green finance across other industries or geographical areas. The findings’ applicability to other nations or industries with different financial systems and environmental regulations may be impacted by this sectoral and geographic restriction. Furthermore, even if the study uses AI models like attention-based CNN, the availability and quality of previous financial data may have an effect on how well the model performs. Because only publicly accessible financial data were used, certain sensitive or private financial data that might have an impact on GF results were left out. In order to gain more comprehensive knowledge of the global dynamics of green finance and its interactions with blockchain and artificial intelligence, future studies could broaden the analysis to include companies from other nations or regions. More specialized insights might potentially be obtained by looking into a larger range of sectors and their unique green finance requirements. Furthermore, the predictive capacity of AI models may be improved by integrating real-time data and investigating their potential for forecasting long-term trends in green finance. Lastly, investigating the incorporation of additional cutting-edge technologies, like blockchain for smart contracts in GF or decentralized finance (DeFi), could further develop the nexus between technology and sustainable finance.
Author Contributions
T.L. and W.T.L. conceptualized the study. T.L. developed the methodology, conducted the analysis, and prepared the original manuscript draft. W.T.L. developed the software and project administration, while M.H.D.H.Y. helped with data curation and validation. The validation of the study was carried out by T.L., W.T.L. and M.H.D.H.Y. W.T.L. and M.H.D.H.Y. reviewed and edited the manuscript. T.L. helped with visualization, and W.T.L. supervised the study. All authors approved the final manuscript and are accountable for their contributions, ensuring the accuracy and integrity of the work. All authors have read and agreed to the published version of the manuscript.
Funding
This research received no external funding.
Institutional Review Board Statement
Not applicable.
Informed Consent Statement
Not applicable.
Data Availability Statement
Data are contained within the article.
Acknowledgments
The authors, Ting Li, Wei Theng Lau, and Mohamed Hisham Dato Haji Yahya, would like to thank the School of Business and Economics, Universiti Putra Malaysia (UPM), Serdang, Selangor Darul Ehsan, Malaysia, for supporting the study by providing the research and lab facilities.
Conflicts of Interest
The authors declare no conflict of interest.
References
- Tsolakis, N.; Schumacher, R.; Dora, M.; Kumar, M. Artificial Intelligence and Blockchain Implementation in Supply Chains: A Pathway to Sustainability and Data Monetisation? Ann. Oper. Res. 2023, 327, 157–210. [Google Scholar] [CrossRef] [PubMed]
- Meng, F.; Zhao, Y. How Does Digital Economy Affect Green Total Factor Productivity at the Industry Level in China: From a Perspective of Global Value Chain. Environ. Sci. Pollut. Res. 2022, 29, 79497–79515. [Google Scholar] [CrossRef] [PubMed]
- Zhou, Y. The Application Trend of Digital Finance and Technological Innovation in the Development of Green Economy. J. Environ. Public Health 2022, 2022, 1064558. [Google Scholar] [CrossRef]
- Esmaeilian, B.; Sarkis, J.; Lewis, K.; Behdad, S. Blockchain for the Future of Sustainable Supply Chain Management in Industry 4.0. Resour. Conserv. Recycl. 2020, 163, 105064. [Google Scholar] [CrossRef]
- Yiming, W.; Xun, L.; Umair, M.; Aizhan, A. COVID-19 and the Transformation of Emerging Economies: Financialization, Green Bonds, and Stock Market Volatility. Resour. Pol. 2024, 92, 104963. [Google Scholar] [CrossRef]
- Wang, Q.; Ren, F.; Li, R. Exploring the Impact of Geopolitics on the Environmental Kuznets Curve Research. Sustain. Dev. 2023, 32, 1700–1722. [Google Scholar] [CrossRef]
- Wang, Q.; Wang, L.; Li, R. Trade Openness Helps Move Towards Carbon Neutrality—Insight from 114 Countries. Sustain. Dev. 2024, 32, 1081–1095. [Google Scholar] [CrossRef]
- Fontaine, A. Debating the Sustainability of Solar Energy: Examining Resource Construction Processes for Local Photovoltaic Projects in France. Energy Res. Soc. Sci. 2020, 69, 101725. [Google Scholar] [CrossRef]
- Abbasi, K.R.; Shahbaz, M.; Zhang, J.; Irfan, M.; Alvarado, R. Analyze the Environmental Sustainability Factors of China: The Role of Fossil Fuel Energy and Renewable Energy. Renew. Energy 2022, 187, 390–402. [Google Scholar] [CrossRef]
- Chang, L.; Saydaliev, H.B.; Meo, M.S.; Mohsin, M. How Renewable Energy Matters for Environmental Sustainability: Evidence from Top-10 Wind Energy Consumer Countries of European Union. Sustain. Energy Grids Netw. 2022, 31, 100716. [Google Scholar] [CrossRef]
- Zhao, X.X.; Zheng, M.; Fu, Q. How Natural Disasters Affect Energy Innovation? The Perspective of Environmental Sustainability. Energy Econ. 2022, 109, 105992. [Google Scholar] [CrossRef]
- Sun, X.; Chen, Z.; Shi, T.; Yang, G.; Yang, X. Influence of Digital Economy on Industrial Wastewater Discharge: Evidence from 281 Chinese Prefecture-Level Cities. J. Water Clim. Change 2022, 13, 593–606. [Google Scholar] [CrossRef]
- Yang, Q.; Ma, H.; Wang, Y.; Lin, L. Research on the Influence Mechanism of the Digital Economy on Regional Sustainable Development. Procedia Comput. Sci. 2022, 202, 178–183. [Google Scholar] [CrossRef]
- Chien, F. The Mediating Role of Energy Efficiency on the Relationship between Sharing Economy Benefits and Sustainable Development Goals (Case of China). J. Innov. Knowl. 2022, 7, 100270. [Google Scholar] [CrossRef]
- Chandan, A.; John, M.; Potdar, V. Achieving UN SDGs in Food Supply Chain Using Blockchain Technology. Sustainability 2023, 15, 2109. [Google Scholar] [CrossRef]
- Wang, L.; Chen, Y.; Ramsey, T.S.; Hewings, G.J. Will Researching Digital Technology Really Empower Green Development? Technol. Soc. 2021, 66, 101638. [Google Scholar] [CrossRef]
- Litvinenko, V.S. Digital Economy as a Factor in the Technological Development of the Mineral Sector. Natl. Resour. Res. 2020, 29, 1521–1541. [Google Scholar] [CrossRef]
- Nayal, K.; Raut, R.D.; Narkhede, B.E.; Priyadarshinee, P.; Panchal, G.B.; Gedam, V.V. Antecedents for Blockchain Technology-Enabled Sustainable Agriculture Supply Chain. Ann. Oper. Res. 2021, 327, 1–45. [Google Scholar] [CrossRef]
- Al Mubarak, M.; Hamdan, A. Sustainable Competitive Advantage through Technological Innovation: An Introduction. In Technological Sustainability and Business Competitive Advantage; Springer: Cham, Switzerland, 2023; pp. 3–8. [Google Scholar]
- Hong, Z.; Xiao, K. Digital Economy Structuring for Sustainable Development: The Role of Blockchain and Artificial Intelligence in Improving Supply Chain and Reducing Negative Environmental Impacts. Sci. Rep. 2024, 14, 3912. [Google Scholar] [CrossRef]
- Chen, J.M.; Umair, M.; Hu, J. Green Finance and Renewable Energy Growth in Developing Nations: A GMM Analysis. Heliyon 2024, 10, e33879. [Google Scholar] [CrossRef]
- Hemanand, D.; Mishra, N.; Premalatha, G.; Mavaluru, D.; Vajpayee, A.; Kushwaha, S.; Sahile, K. Applications of Intelligent Model to Analyze the Green Finance for Environmental Development in the Context of Artificial Intelligence. Comput. Intell. Neurosci. 2022, 2022, 1–8. [Google Scholar] [CrossRef] [PubMed]
- Metawa, N.; Boujlil, R.; Alsunbul, S. Fraud-Free Green Finance: Using Deep Learning to Preserve the Integrity of Financial Statements for Enhanced Capital Market Sustainability. Int. J. Energy Econ. Policy 2023, 13, 610–617. [Google Scholar] [CrossRef]
- Ramzani, S.; Konhäusner, P.; Olaniregun, O.; Abu-Alkheil, A.; Alsharari, N. Integrating AI-Driven Green Finance Strategies for Sustainable Development: A Comparative Analysis of Renewable Energy Investments in Germany and Denmark. Eur. J. Bus. Manag. Res. 2024, 9, 43–55. [Google Scholar] [CrossRef]
- Schulz, K.; Feist, M. Leveraging Blockchain Technology for Innovative Climate Finance under the Green Climate Fund. Earth Syst. Gov. Work. Pap. 2020, 39, 1–26. Available online: https://ssrn.com/abstract=3663176 (accessed on 24 March 2024). [CrossRef]
- Almadadha, R. Blockchain Technology in Financial Accounting: Enhancing Transparency, Security, and ESG Reporting. Blockchains 2024, 2, 312–333. [Google Scholar] [CrossRef]
- Taghizadeh-Hesary, F.; Yoshino, N. Sustainable Solutions for Green Financing and Investment in Renewable Energy Projects. Energies 2020, 13, 788. [Google Scholar] [CrossRef]
- Hou, H.; Wang, Y.; Zhang, M. Green Finance Drives Renewable Energy Development: Empirical Evidence from 53 Countries Worldwide. Environ. Sci. Pollut. Res. 2023, 30, 80573–80590. [Google Scholar] [CrossRef]
- Riyaz, B.; Ganapathy, S. A Deep Learning Approach for Effective Intrusion Detection in Wireless Networks Using CNN. Soft Comput. 2020, 24, 17265–17278. [Google Scholar] [CrossRef]
- Bouyghrissi, S.; Murshed, M.; Jindal, A.; Berjaoui, A.; Mahmood, H.; Khanniba, M. The Importance of Facilitating Renewable Energy Transition for Abating CO2 Emissions in Morocco. Environ. Sci. Pollut. Control Ser. 2021, 29, 20752–20767. [Google Scholar] [CrossRef]
Disclaimer/Publisher’s Note: The statements, opinions and data contained in all publications are solely those of the individual author(s) and contributor(s) and not of MDPI and/or the editor(s). MDPI and/or the editor(s) disclaim responsibility for any injury to people or property resulting from any ideas, methods, instructions or products referred to in the content. |
© 2025 by the authors. Licensee MDPI, Basel, Switzerland. This article is an open access article distributed under the terms and conditions of the Creative Commons Attribution (CC BY) license (https://creativecommons.org/licenses/by/4.0/).