Article

Improving Municipal Solid Waste Services: Insights into Efficiency, Productivity, and Recycling in Brazil

by
Alexandro Barbosa
1,*,
Tadeu Junior de Castro Gonçalves
2 and
Pedro Simões
3
1
Department of Accounting Sciences, Federal University of Rio Grande do Norte (UFRN), Campus Universitario, Lagoa Nova, Natal 59072-970, RN, Brazil
2
Faculty of Accounting, Federal Rural University of the Amazon (UFRA), Capanema Campus, Capanema 68700-665, PA, Brazil
3
RCM2+, Universidade Lusófona, 376, 1749-024 Lisbon, Portugal
*
Author to whom correspondence should be addressed.
Sustainability 2025, 17(6), 2519; https://doi.org/10.3390/su17062519
Submission received: 6 November 2024 / Revised: 3 March 2025 / Accepted: 4 March 2025 / Published: 13 March 2025

Abstract

:
This study analyzed the interactions between efficiency, productivity, and the policy of recyclable materials recovery in municipal solid waste (MSW) services in Brazil, using data from the National Sanitation Information System (SNIS) for 199 MSWs, encompassing a balanced longitudinal panel from 2013 to 2022. In this context, the study employed the dynamic slacks-based measure (DSBM) model to assess the intertemporal efficiency and productivity of MSWs. This model is an additive extension of traditional data envelopment analysis, as it does not focus solely on the overall efficiency of operators. Additionally, multiple correspondence analysis (MCA), multiple independent sample tests, and generalized estimating equations (GEE) were utilized to identify potential interactions among the variables of interest. The main contribution of this study lies in its analysis of dynamic intertemporal efficiency, considering the indirect influence of operating expenses as a carry-over, which impacts the continuity of efficiency across periods. Insights from the results indicated an average efficiency of 61.9% and an accumulated productivity loss over the analyzed period. The recovery of recyclable materials exhibited a negative interaction with both the efficiency of MSW operators performing selective collection and the overall technological advancement of MSW systems. This underscores the importance of integrating this field of study within the circular economy framework and fostering recycling initiatives. Factors such as population density, gross domestic product (GDP), and the COVID-19 pandemic influenced efficiency and, in certain aspects, productivity. The findings provide insights suggesting that policymakers and regulatory agencies should consider these results to enhance eco-efficiency and eco-productivity policies, particularly in alignment with the Sustainable Development Goals (SDGs) and current Brazilian legislation.

1. Introduction

Improper disposal methods, including the use of covered dumps without bottom protection, open dumps, and discarding waste in rivers, lakes, and along roadsides, are common in Brazil and many developing countries. In this sense, municipal solid waste (MSW) remains a chronic issue in these regions, often due to poverty and a lack of funds for adequate treatment methods [1], which can be considered a critical situation in relation to compliance with United Nations Agenda 21.
Factors such as the growth of urbanization, economic development, and improvement of living standards in developing countries are associated with a significant increase in the amount of solid waste generated [2,3]. It is relevant to emphasize that the generation of urban solid waste is considered a natural product of the aforementioned factors. However, the inadequate management of these wastes, including their disposal and final treatment, is responsible for various social and environmental consequences [4,5].
In the economies of emerging countries such as Brazil, Russia, India, China, and South Africa (BRICS), landfills represent the primary method of municipal solid waste disposal. However, many operate irregularly or even clandestinely. Practices such as source separation, recycling, composting, and reducing waste generation are essential to reduce the volume of solid waste sent to these landfills. This helps to extend the useful life of landfills, reduce the need for new disposal areas, and reduce investments [6].
In this context, studies focusing on the evaluation of service efficiency have become increasingly prevalent. Insights derived from studies on the efficiency of solid waste management (SWM) services highlight that this scenario remains relatively less explored in the literature compared to other services, such as the electricity sector [7,8]. In this regard, developing and underdeveloped countries face greater challenges in the inadequate management of solid waste, attributed to nearly absent infrastructure and inadequate processing channels, the scarcity of financial and human resources, as well as political obstacles [9].
In developing regions of Asia and Africa, continents with the highest concentration of emerging countries [10], Zhang et al. [10] examined, through a literature review, the main challenges of SWM in Asian and African countries from 2013 to 2023. Their findings indicate that a lack of public awareness and action, funding sources, infrastructure, and other cultural factors are responsible for delaying proper waste disposal. According to the authors, three main aspects hinder the optimization of SWM: socioeconomic challenges, infrastructure deficits, and cultural factors. The study emphasizes the importance of integrating this field of study into the circular economy framework and promoting recycling initiatives.
Serrona et al. [11] add that poor planning, financial insufficiency, lack of technical knowledge, and ineffective laws are barriers that hinder the implementation of effective and economically viable environmental measures for waste management programs. In the case of Brazil, located in Latin America, the third largest emerging continent [10], it is understood that the formulation and adoption of recent legislation contribute to this scenario.
Previous studies aimed to evaluate the efficiency of operators in the solid waste sector from various perspectives, such as the eco-efficiency and eco-productivity of municipalities in solid waste management in Chile [3,12] and Italy [13]; the assessment of efficiency in the prevention and treatment of industrial solid waste [14,15]; integrated structures and solid waste management systems [16,17]; and other factors influencing waste management performance [18,19,20,21]. Insights from these findings suggest that increased food recycling, waste diversion to composting, and bypassing landfill disposal reduces undesirable indicators, offsetting economic costs and enhancing municipal solid waste efficiency.
For the reasons stated in this context and considering the recovery of recyclable materials as the starting point of the full life-cycle process within industry from a circular economy and eco-efficiency perspective, and examining how recycling practices impact the efficiency and productivity of solid waste management services, this study aims to assess the interactions between intertemporal dynamic efficiency, productivity, and recyclable material recovery policies in Brazilian MSW, offering insights into how these collection policies interact with service performance (efficiency and productivity).
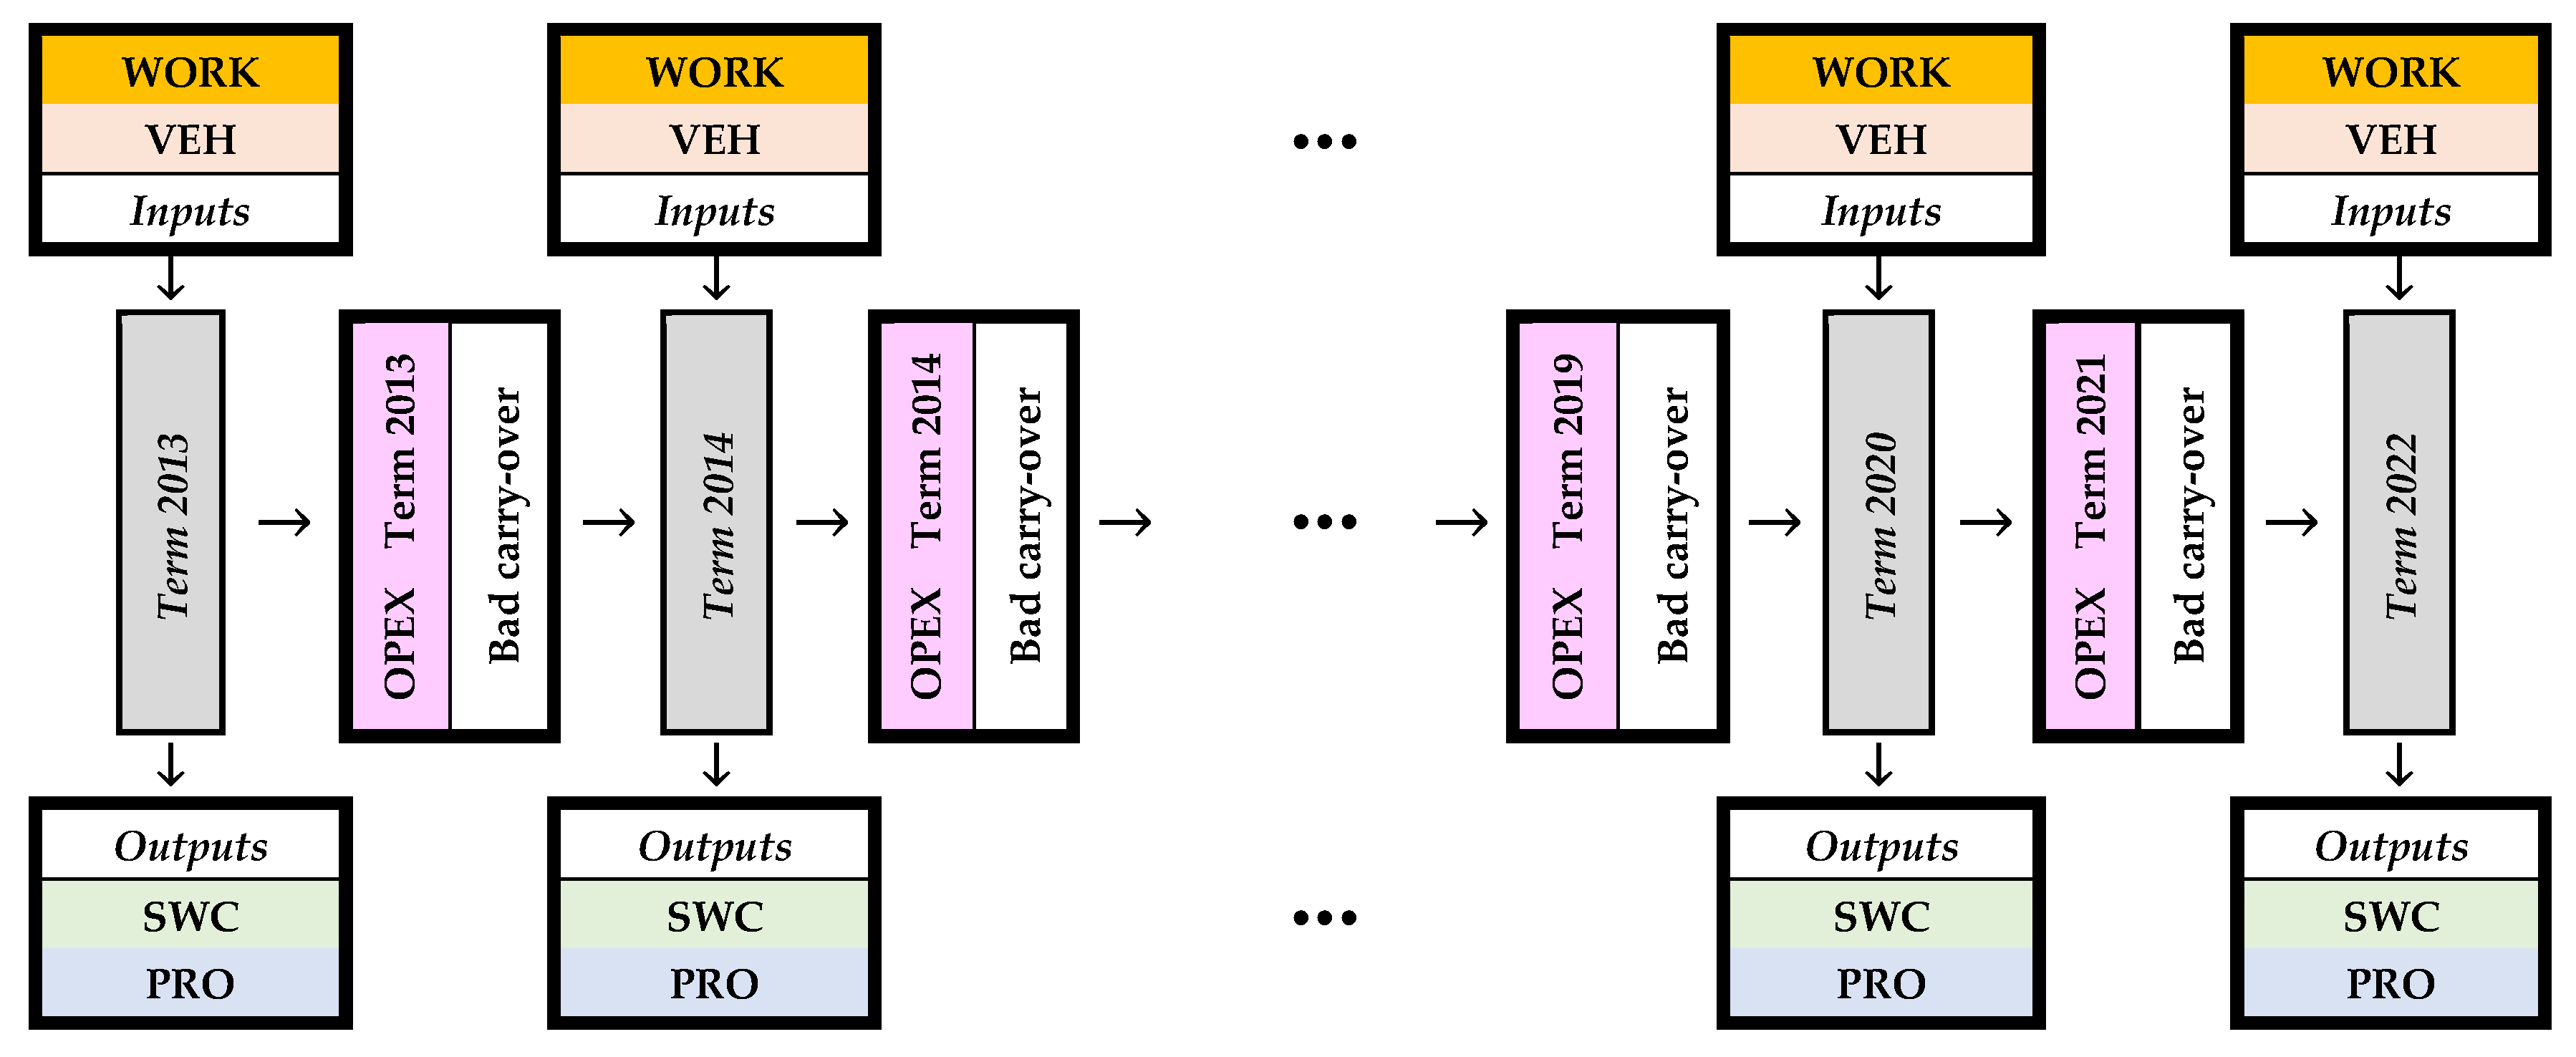
In this regard, the present study distinguishes itself from previous research by employing a data envelopment analysis (DEA) approach using the slacks-based measure [22] within a dynamic intertemporal framework, as originally introduced by Tone and Tsutsui [23] and referred to as the dynamic slacks-based measure (DSBM). Furthermore, it examines the effects of recyclable material recovery using a second-stage explanatory approach.
According to lo Storto [24], DEA provides a single efficiency score that considers multiple inputs and outputs, creating an empirical production function based on observed data, without making any restrictive assumptions about the function that transforms inputs into outputs. However, traditional DEA models have a disadvantage in omitting the intertemporal (dynamic) structure of decision-making units (DMUs) [23]. Thus, the structure proposed for assessing the efficiency of solid waste service providers in Brazil allows the evaluation of the overall efficiency of DMUs and provides additional assessment in an intertemporal (dynamic) manner, wherein ‘carry-overs’ connect the analysis periods (terms).
Considering what was observed in a previous literature review, the current recycling scenario in Brazil requires actions to encourage the implementation of recycling programs in an integrative manner with recycling stakeholders in the planning and management of these activities. The foundations of the circular economy can act as a catalyst for actions to achieve the Sustainable Development Goals (SDGs), assisting in the recovery of economic growth while supporting sustainability policies that recover energy and materials from waste, thereby producing balanced economic, social, and environmental performance. Therefore, the recycling process is essential for the proper management of MSW [1].
Recycling not only offers potential landfill cost savings, but also reduces the volume of waste sent to landfills or incinerators, which helps decrease soil, water, and air contamination through lower emissions. By adopting a full life-cycle approach, recycling supports regulatory authorities in more effectively managing natural resources, including raw materials, land use, and the quality of water and soil; on the other hand, selective collection is more costly in Portugal, and it is unclear whether part of these expenses stems from local administrations’ attempts to pass costs to the receiving industry (paper recycling) or if they result from inefficiencies of waste management [25].
This study presents several contributions to the existing literature, as well as political and practical implications. Firstly, by employing DSBM, this model not only broadens the scope of the existing literature, but also offers an analysis of an emerging country like Brazil. Secondly, the article highlights its contribution to the Sustainable Development Goals, particularly SDG 12 (Responsible Consumption and Production) and SDG 6 (Clean Water and Sanitation).
By providing an assessment of the efficiency of solid waste service providers, this study can be used to inform policy discussions with public managers aimed at sustainable development in the country and other developing nations, where policies for promoting recycling are incipient [26]. Furthermore, it facilitates discussions on reducing improper solid waste disposal, promoting public–private partnerships, and expanding international debates through global cooperation.
Furthermore, the study sheds light on critical issues related to public policy formulation, particularly in the context of the goals established by the new sanitation framework, including Brazilian Federal Laws 14,026/2020 [27], 12,305/2010 [28], and 11,445/2007 [29], as well as regulations aimed at promoting recycling processes, such as Law 14,260/2021 [30] and Decree 12,106/2024 [31]. However, these regulations have not proven effective, as our findings reveal a scenario of inadequate waste disposal and greater inefficiency among operators with selective collection systems, highlighting gaps in implementation and incentives for the recycling industry.

2. Solid Waste Services in Brazil

Brazil ranks 16th in the Latin American and Caribbean region, which includes 42 countries, in terms of solid waste generation (kg/per capita per day) [32]. In line, the public sector in Brazil is decentralized among three levels, the Union (central government), 26 Brazilian states plus the Federal District, and 5570 municipalities; among their competencies is the management of the MSW sector.
Municipalities under direct public administration are responsible for more than 94.6% (4637 of 4900 participants) of the management, which includes 73.7% of the population. Public companies are responsible for 3% of management bodies, autarchies represent 2.7%, and mixed economy companies with public administration represent 0.7%. The household solid waste collection coverage rate for the urban population, in general, reaches 98.7%, and the country’s average rate is 90.5%.
Regarding the coverage rate of household solid waste collection for the urban population, it reaches 98.7% overall, with an average rate of 90.5% for the country. Analyzing by regions, the North (96.2%), Northeast (97.7%), Midwest (98.2%), South (99.3%), and Southeast (99.4%) regions are observed. It is noteworthy that the North, Northeast, and Midwest regions have averages lower than the national average.
According to information from Panorama dos Resíduos Sólidos no Brasil of Associação Brasileira de Empresas de Limpeza Pública e Resíduos Especiais (ABRELPE) [33], the majority of MSW collected is properly disposed of in sanitary landfills. However, the improper dumping of MSW, when compared from 2010 to 2019, has not shown significant variations, decreasing from 43.2% of improper disposal in 2010 to 40.5% in 2019. This means that tons of MSW ended up in open dumps or controlled landfills that lack the necessary systems and measures to protect human health and the environment from harm and degradation.
In addition to data from ABRELPE, information from the Diagnóstico do Manejo de Resíduos Sólidos Urbanos [34], provided by the Sistema Nacional de Informações sobre Saneamento (SNIS) affiliated with the national government, corroborates the temporal stagnation of inadequate disposal practices concerning the collected municipal solid waste mass. As depicted in Figure 1, between 2012 and 2019, the percentage of SWS subjected to inadequate disposal exhibited minimal variation, reaching its lowest point in 2015 at 21.7%.
It is important to note that discrepancies between data from ABRELPE and the Diagnóstico do Manejo de Resíduos Sólidos Urbanos are attributed to methodological differences, including data collection, projections, and sample size. However, it is noteworthy that both sources align in showing the stagnation of inadequate waste disposal practices over time.
In Brazil, Law 12,305/2010 [28], which establishes the National Solid Waste Policy (PNRS), recognizes the economic and social potential of recyclable solid waste. Accordingly, this law prioritizes various aspects of recycling within Brazilian solid waste management. Law 11,445/2007 [29] sets standards for universalization, efficiency, and financial sustainability in solid waste services. Finally, Law 14,026/2020 [27] designates the end of 2033 as the target for universalizing these services, in alignment with Agenda 21, and, more recently, Decree 12,106/2024 [31], which regulated Law 14,260/2021 [30], which establishes incentives for the recycling industry.
However, recycling in Brazil remains relatively modest (collected = 93.0%; recycled = 1.47%; composted = 0.168%; landfilled = 61%; dumping = 39%) compared to that observed in developed countries, highlighting significant opportunities for expanding the actors involved in recycling processes and establishing structured municipal programs aimed at advancing expansion efforts [1], which represents a difficult challenge to be achieved, considering that the evident and widespread omission of Brazilian municipalities in fulfilling duties relating to the recovery of urban solid waste [35].

3. Efficiency, Productivity, and Recycling of Solid Waste Service

For at least three decades, numerous studies have focused on evaluating the efficient management of resources within the public sector from diverse perspectives and contexts [8,12,36,37,38,39,40,41,42,43,44,45]. In the MSW sector, despite being late when compared to the other sectors (e.g., energy, natural gas, water, wastewater, health, education, etc.,) recent studies have been found that present important insights.
Pérez-López et al. [39] contributed to the sector by analyzing cost efficiency by comparing the different ways (direct municipal, contracted municipal, inter-municipal cooperation, and contracted private production) of managing the service in Spanish locations. Analyzing 771 municipalities with populations ranging from 1000 to 50,000, during the period from 2007 to 2010, the authors show that the efficiency of service delivery calculated for the order-m method varies according to the size of the population, where municipalities with larger populations (above 20,000 inhabitants), the use of outsourced forms of management would be the most appropriate, while in municipalities with smaller populations, inter-municipal cooperation presents better results.
Also in the Spanish environment, Benito et al. [40] verified the impact of governance aspects (transparency and citizen participation) and other variables on the level of efficiency of MSW services. Analyzing 43 Spanish operators during the period from 2014 to 2018, the authors found low levels of efficiency in garbage collection and street cleaning services and, incredibly, transparency and citizen participation have little impact on efficiency. Other results indicate that population density, tourist activity in the municipality, and the strength of the local government are also significant in explaining the efficiency of the sector.
In China, Fan et al. [41] evaluated the efficiency of solid waste collection services in 30 provinces, covering the period from 2008 to 2017. By a stochastic frontier (SFA) approach, the average efficiency value was 0.372. Regarding influencing factors, the proportion of the population aged 15 to 64 indicates having a greater positive impact on efficiency, as well as GDP per capita, added value of the tertiary industry, and the level of education.
Studies for the Brazilian situation, such as those by Cetrulo et al. [43], Oliveira et al. [42], and Franco et al. [44] addressed the efficiency of the sector. In general, the cited studies conclude that the collection of urban solid waste needs to be more efficient, and new configurations would bring environmental, economic, and health gains. In addition, national policies (PNRS) have not achieved the desired changes, indicating that the country faces a huge problem in the proper management of municipal solid waste.
In this context, the problem of inadequate MSW disposal (Figure 1), the absence of selective collection and financial incentives for recycling practices, as well as the lack of political measures to increase the sector’s efficiency and productivity over the years, does not appear to be changing. Gonçalves et al. [45], using a dynamic network analysis, indicate an average inefficiency of around 42% in the sector from 2012 to 2022, with productivity remaining stagnant during this period. The study also shows that electoral cycles, GDP, population density, and COVID-19 influenced the combination of operational and economic efficiencies.
Incorporating selective collection (selective collection) and recycling into eco-efficiency measurement, Araya-Córdova [46] indicate improved efficiency among Chilean municipalities that adopt these practices. However, fewer than 5% of municipalities are efficient, which is consistent with the less than 50% probability of adopting recycling programs. Additionally, performance is influenced by exogenous factors, such as population, density, per capita waste generation, and tourism.
lo Sorto [47] presented convergent findings in Italy’s Apulia region, where low cost-efficiency and gains in productivity were observed from 2010 to 2017 during a transitional phase. These results later improved by including eco-efficiency and eco-productivity indicators such as totals for sorted waste (selective collection), unsorted waste, organics, plastic, metal, paper and cardboard, glass, and other materials in DEA estimates, underscoring the importance of environmental indicators in efficiency and productivity analysis.
Connecting cost efficiency with recycling, and waste-picker policies in the Indian cities of Delhi, Pune, and Mumbai results in government cost reductions of approximately USD 13,700 per day, USD 200,000 per year, and USD 9 per ton, respectively. This is due to waste-pickers handling collection, sorting, and transport at no cost to government agencies, and as noted in the literature, this also mitigates environmental costs and reduces landfill capacity issues [48]. Conversely, Cruz et al. [25] suggest that in Portugal, the cost per ton is EUR 86.1 higher for selective collection compared to undifferentiated collection.
Continuing on studies on environmental concerns, in China, the food recycling rate positively impacted MSW efficiency and productivity gains following the implementation of the 2017 waste separation policy. Public satisfaction, driven by economic and environmental factors, was also critical to efficiency, with its influence increasing as the recycling rate rose [49].
Hu et al. [37] evaluated the efficiency of recycling activities in Japan using the Network DEA model. The study analyzed the efficiency of 47 Japanese administrative regions between 2013 and 2017, breaking the process into two stages: waste collection (stage 1) and treatment and processing of recyclables (stage 2). The results indicated that waste collection efficiency is lower than processing efficiency, with metropolitan regions performing better than rural ones, especially in stage 1.
Recent research highlights efficiency in the recycling sector within the context of the circular economy, as in the study by Parte et al. [36]. Using methods such as data envelopment analysis and Tobit regression, the study revealed that larger companies are more efficient, supporting the hypothesis of economies of scale. Variables such as financial risk (rating score, Z-score) and capital structure influence efficiency. Recycling is identified as a strategic sector for the circular economy and the 2030 Agenda, with practical implications for public policies and sustainable business strategies.
Additionally, other studies discuss the role of various factors relevant to evaluating recycling efficiency and performance, such as Rijal et al. [38], who developed a recycling performance assessment procedure by sub-grouping MSWAs based on prominent local demographic characteristics, such as population density, proportion of elderly residents, tourism index, and so forth. The authors emphasized that the demographic characteristics of an area can have varying impacts on recycling performance due to differences in culture, politics, economics, and other factors.
Targeting the discourse into the scope of recovering recyclable materials in the Brazilian scenario, Rutkowski et al. [50] suggest that the use of waste pickers provides cost reductions and the efficiency of the system increases with the optimization of the use of trucks associated with the transfer system and efficiency gains in the operation of efficient collection means that take into account population density.
In this context, there is evidence of a relationship between efficiency and external factors such as population density, income, and COVID-19 in the efficiency of solid waste management. Regarding the effect of recovery of recyclable materials and recycling on the efficiency and productivity of solid waste services, the literature suggests improvements in efficiency and productivity, although the consensus remains undefined. Thus, this study contributes to the existing literature by discussing the scenarios and factors that affect the efficiency/inefficiency and productivity of selective collection in the services provided in Brazil and other emerging countries. In these nations, challenges such as inadequate infrastructure, low public awareness, and weak recycling policies hinder the proper provision of services.

4. Materials and Methods

4.1. Data Collection

The necessary information to calculate efficiency scores was collected from a database linked to the Brazilian federal government. The Sistema Nacional de Informações sobre Saneamento (SNIS) [51] compiles institutional, administrative, operational, managerial, economic–financial, accounting, and quality information related to the provision of basic sanitation services in urban areas across four components of the basic sanitation concept, according to Law 11,445 [29]: drinking water supply; wastewater; urban cleaning and solid waste management; and urban stormwater drainage and management. Municipalities are responsible for providing all input data related to solid waste [52].
The systematic procedure for data collection was as follows: (a) accessing the solid waste module (http://app4.mdr.gov.br/serieHistorica/, accessed on 6 November 2024), (b) searching for municipal management entities, (c) setting filters for reference year (2013 to 2022), (d) selecting operators with legal statuses such as direct public administration, autonomous agencies, public consortia, private companies, and public companies, (e) selecting operators geographically located in the Midwest, Northeast, North, Southeast, and South regions, and (f) selecting municipalities located in all states.
Given this, our study utilizes a balanced longitudinal panel, covering the period from 2013 to 2022. The sample includes service providers with more established characteristics of information completion, as well as providers from the main Brazilian cities, which involve a larger population. Our sample covers 67% of the population from all municipalities participating in the 2022 SNIS database, operating in 24 Brazilian states. The final sample analyzed 199 MSWs (DMUs).

4.2. Intertemporal Dynamic Efficiency and Productivity Model

According to the Relatório Nacional de Gestão de Resíduos Sólidos 2019 [53], only 45% of Brazilian municipalities charge fees for solid waste and urban cleaning services, with revenues covering just 44.1% of urban cleaning expenses. This revenue gap contributes to government deficits, and with fee increases unlikely in the short term, expense reduction in this public utility service emerges as the most immediate option. These expenses carry-over (intertemporal link) across periods, reflecting the minimum resources (workers, vehicles, etc.) required to maintain service levels. Given this premise, an ‘input-oriented’ focus is suitable, as total MSW expenditures are crucial in the intertemporal transfer of efficiency across periods (terms), making it essential for this phenomenon to be captured.
Traditional DEA models do not capture the effect of carry-over activities between consecutive periods, which is why the DSBM model was designed to address this intertemporal phenomenon [23]. In summary, the model proposed by Tone and Tsutsui [23] enables the assessment of overall efficiency across the entire analysis period and allows for the evaluation of dynamic and intertemporal changes over time. In this context, the DSBM model has been applied to assess efficiency in public service sectors, as seen in [54] and [55], where it was used to evaluate economic and financial efficiency in processes related to universal access and revenue collection for Brazilian water and sewage public services, respectively.
In addition, Addae et al. [56] utilized it to assess water-use efficiency across 11 West African countries. Lu et al. [57] focused on evaluating environmental energy efficiency among 48 high-income economies (including China), concentrating on environmental impact and emission reduction strategies. Guo et al. [58] analyzed efficiency based on CO2 emissions from fossil fuels within Organization for Economic Co-operation and Development (OECD) countries and China. Hu et al. [59] investigated renewable energy generation efficiency in Japan, while Hu et al. [60] focused on renewable energy generation efficiency within Asian economies, and Gao et al. [61] explored efficiency through the water–energy–food nexus across Chinese provinces.
For the DSBM to estimate DMU efficiencies, at least one variable must be selected as a carry-over (link) function, with the remaining variables serving as typical DEA inputs and outputs. As per Tone and Tsutsui [23], the links can be classified as follows: (1) desirable (good) link, where the carry-over is treated as output, and any deficit indicates inefficiency; (2) undesirable (bad) link, where the carry-over is treated as input, and any surplus is considered inefficient; (3) discretionary (free) link, a carry-over under the DMU’s control that does not directly reflect efficiency but has an indirect impact across terms; and (4) non-discretionary (fixed) link, an uncontrolled carry-over that indirectly affects efficiency due to its continuity across terms. Given that operational expenses act as a linking activity, with increases leading directly to inefficiency, the DSBM classifies them as an undesirable (bad) link for this work.
Table 1 provides a detailed description of efficiency and productivity variables, highlighting their definitions, support based on previous literature, and notations aligned with the symbolic configurations outlined in Tone and Tsutsui [23]. Figure 2 depicts the dynamic DEA model DSBM employed to analyze Brazilian solid waste services.
The mathematical formulations and explanations within the DSBM model are transcribed from Tone and Tsutsui [23] (pp. 146–150), and Table 1 presents the variables’ correspondence with terms from the authors’ equations. The Malmquist score (productivity) is calculated using the same composition of efficiency variables, and productivity indices for 2013 were calculated using data from 2012. Productivity was also decomposed into its respective components: frontier shift (technological progress) and catch-up (efficiency changes). The DEA-Solver-PRO: Professional Version 11.0 software was used to calculate the efficiency studied and the productivity score. At the end of this process, four variables were obtained: the efficiency score of MSW j in year t (Effjt); the Malmquist productivity score of MSW j in year t (Prodjt); the technical progress measured by the frontier shift score of MSW j in year t (Frontjt); and the efficiency gains measured by the catch-up score of MSW j in year t (Catchjt).
The choice between constant returns to scale (CRS) and variable returns to scale (VRS) models was based on [68], following a paired t-test approach for two related groups: one with efficiency estimated generated using CRS, and another with VRS. When the mean efficiency estimated significantly differs, the VRS model is preferred. If the efficiency estimated does not show a normal distribution, the Wilcoxon signed-rank test is used as a non-parametric alternative for related samples, equally to that conducted by [54,55]. Regarding input–output protocols, the model met adequacy requirements with 199 DMUs, 2 inputs, 1 carry-over (considered an input), and 2 outputs. Kendall’s tau-b checks correlation (coefficient and significance) to confirm isotonicity, according to concerns raised by [69].

4.3. Relationships Between the Recovery of Recyclable Materials, Efficiency, and Productivity

4.3.1. Multiple Correspondence Analysis (MCA) and Multiple Independent Sample Tests

The MCA technique is applied for an initial analysis of perceptual interactions between the recovery of recyclable materials, efficiency, and productivity. In this context, Effjt, Prodjt, Frontjt, and Catchjt were categorized and ranked by interval according to Tukey’s hinges percentiles, as follows:
Effjt classification: values equal to 1 were classified in the ‘Efficient’ group, after which Tukey’s hinges percentiles were calculated using results with any level of inefficiency, producing classifications from the most to the least inefficient, following quartile order in the categories: ‘Largest inefficiencies’, ‘Moderate inefficiencies’, and ‘Smallest inefficiencies’.
Prodjt classification: values equal to 1 were grouped as ‘Stability’. Tukey’s hinges percentiles were calculated for two groups (gains for values greater than 1 and losses for values below 1). Following the same quartile-based separation for each group, classifications were generated as: ‘Largest losses’, ‘Moderate losses’, ‘Small losses’, ‘Small gains’, ‘Moderate gains’, and ‘Largest gains’.
Frontjt classification, and Catchjt classification: Values equal to 1 were classified as ‘No change’ and ‘No movement’, respectively, with Tukey’s hinges percentiles calculated similarly to Prodjt. For frontier shift, this resulted in classifications of ‘Greatest decline’, ‘Moderate decline’, ‘Minor decline’, ‘Minor improvement’, ‘Moderate improvement’, and ‘Greatest improvement’, while for catch-up, the classifications were ‘Greatest setback’, ‘Moderate setback’, ‘Minor setback’, ‘Minor advance’, ‘Moderate advance’, and ‘Greatest advance’.
The recyclable material recovery rate was also classified (Rrecjt classification) for this analysis, with zero values placed in the ‘Zero recovery’ group and non-zero values split into two groups based on the median: ‘Lower’ (50% with recovery rate < median) and ‘Higher’ (50% with recovery rate ≥ median). In this way, MCA was used to assess how these categories of recyclable material recovery align with categories related to efficiency and productivity.
Interactions between efficiency values, productivity, and recyclable recovery rates were further examined in a second round of perceptual analysis using multiple independent sample tests. Considering the classification of recyclable recovery rates, as previously defined into three groups, and the variables Effjt, Prodjt, Frontjt, and Catchjt, Kruskal–Wallis, median, and Jonckheere-Terpstra tests were independently conducted for each group. This second stage highlights associative interactions between recovery classifications and all efficiency and productivity outcomes derived through DSBM, completing this initial analysis of interactions based on pooled data.

4.3.2. Explanatory Econometric Model

Section 3 highlighted that selective collection tends to positively influence MSW efficiency, as supported by most of the literature referenced in this study, and that exogenous factors such as population density, income, and COVID-19 effects were relevant in evaluating MSW efficiency. The analyses outlined in Section 4.3.1 adopted a pooled data structure to present initial insights into the interactions between efficiency, productivity, and recyclable recovery rates.
In this third stage, an explanatory econometric analysis with a longitudinal panel data structure was developed (one for all jt cases and another for cases where Rrecjt > 0). Four econometric models were proposed for each dependent variable: Effjt, Prodjt, Frontjt, and Catchjt. The independent variables include Rrecjt (variable of interest) and the exogenous variables population density (Denjt), GDP per capita (GDPjt), and the period affected by the COVID-19 pandemic (COVID19jt), as per the empirical foundation and descriptions provided in Table 2.
Formulations (1)–(4) represent the explanatory models for each case.
Model   1 E f f j t = β 1 R r e c j t + β 2 D e n j t + β 3 G D P j t + β 4 C O V I D 19 j t + ε j t
Model   2 P r o d j t = β 1 R r e c j t + β 2 D e n j t + β 3 G D P j t + β 4 C O V I D 19 j t + ε j t
Model   3 F r o n t j t = β 1 R r e c j t + β 2 D e n j t + β 3 G D P j t + β 4 C O V I D 19 j t + ε j t
Model   4 C a t c h j t = β 1 R r e c j t + β 2 D e n j t + β 3 G D P j t + β 4 C O V I D 19 j t + ε j t
To estimate Models 1 through to 4, we utilized generalized estimating equations (GEE), which are the longitudinal panel data-based version of generalized linear models (GLM) [76]. GEEs was selected in this study due to their suitability for the nature of the dependent variables Effjt, Prodjt, Frontjt, and Catchjt. Several applications of GEE as an explanatory econometric model exist in contexts where the dependent variable is derived from data envelopment analysis, such as in Jalali Naini et al. [77] for efficiency in the Iranian insurance sector, Dohmen et al. [78] for hospital efficiency in the Netherlands, Barbosa et al. [79] and Dantas et al. [80] for Brazilian football club efficiency, Barbosa et al. [54] and Barbosa et al. [55] for the efficiency of Brazilian water utilities, and most recently, within the focus sector of this study, Gonçalves et al. [45] for the efficiency of Brazilian municipal solid waste services.
For GEE model estimation, certain configurations are necessary and applicable in this study: (1) distribution family (e.g., Gaussian, binomial, gamma), (2) link function (e.g., identity, log, logit, probit), and (3) correlation structure within the group or working correlation matrix (e.g., exchangeable, independent, unstructured, autoregressive, stationary). The configuration that yields the lowest quasi-likelihood under the independence model criterion (QIC) is the most robust and selected for explanatory purposes [81].
In Model 1, Effjt is classified as efficient or inefficient, fitting a binomial distribution family, as seen in [45,54,55,79]. We tested identity and logit link functions. For Models 2 through to 4, we assumed that Prodjt, Frontjt, and Catchjt follow a Gaussian distribution family with an identity link function, as proposed in [80]. We evaluated all possible combinations of correlation matrices, distribution families, and link functions, selecting the parameterization that produced the lowest QIC to ensure robustness in the analysis. To reduce the impact of outliers, a 5% winsorization process was applied to all variables except for Effjt, which was excluded due to the binomial distribution assumed in the GEE model.

5. Results and Discussion

Table 3 presents the descriptive statistics for variables used to assess DSBM efficiency in waste management across the years 2013 through to 2022. However, the mean of OPEX in 2022 stands out, reflecting a year still impacted by COVID-19 and signaling both stability in productivity and a negative effect during the pandemic period.
The standard deviations shown in Table 3 tend to reject the assumption of a normal distribution for WORKjt, VEHjt, OPEXjt, SWCjt, and PROjt, which was confirmed by the Kolmogorov–Smirnov and Shapiro–Wilk tests, both yielding significance values of p < 0.01. In this context, Kendall’s tau-b nonparametric correlation should be applied to verify isotonicity protocol adherence. Table 4 presents the results of these correlations, all significant at the 0.01 level, with the lowest observed correlation between VEHjt and SWCjt (input versus output) at 0.707, confirming that a proportional increase in input results in a proportional rise in output, and thus meets isotonicity protocol requirements.
For choosing between CRS or VRS assumptions, efficiency was estimated under both returns. Table 5 displays the nonparametric Wilcoxon signed ranks tests, comparing DSBM efficiency scores estimated under each returns assumption year by year in the panel. The results support selecting VRS as all significance values were p < 0.01 across all years, leading to the rejection of the null hypothesis H0, indicating that efficiency estimates differ when calculated under different returns to scale assumptions and establishing VRS as the more robust choice, following the rule proposed by [68].
Regarding the specifications of the DSBM for estimating efficiency and productivity, the ‘input-oriented’ option is explained in Section 4.2, and Table 4 provides the results justifying the use of VRS. Consequently, the intertemporal dynamic efficiency and productivity model follow the parameters of being ‘input-oriented’ with ‘Variable Returns to Scale (VRS)’. Table 6 presents the descriptive statistics of efficiency and productivity results (by year and overall).
Analyzing the results in Table 6, the average intertemporal dynamic efficiency over the ten-year panel is 61.9%, with only 4% of MSWs achieving the efficiency frontier each year. In the year-by-year evaluation, 2020 registered the lowest average efficiency, while 2019 had the fewest MSWs reaching the efficiency zone. In contrast, 2014 showed the highest average efficiency and the most DMUs on the efficiency frontier.
From the productivity perspective, measured by the Malmquist score (Prodjt), the results indicate an accumulated average productivity loss near the stability zone over the ten years, with the largest loss occurring from 2021 to 2022 at −8.1% (0.919–1). This decline is attributed to a greater technological regression (Frontjt = frontier shift score) recorded in the same period [= −13% → (0.87–1)], where only 7.5% of MSWs experienced technological improvement. The Catchjt (catch-up score) showed minimal fluctuation throughout the years, with an accumulated average efficiency gain close to a no-movement condition.
Notably, 17.9% of MSWs reached the efficiency frontier at least once during the panel period (Table 7). The data also reveal a balance among DMUs in terms of productivity gains and losses, technological decline and improvement, as well as setbacks and advances toward the efficiency frontier.
Regarding the recovery rate of recyclable materials (Rrecjt), the categorization from Section 4.3.1 was distributed among MSWs as follows: zero recycling = 417 (21.0%); ‘Lower’ = 747 (37.5%); and ‘Higher’ = 748 (37.6%), indicating that over 20% of MSWs in the sample conduct indiscriminate collection. Data for the Rrecjt variable were unavailable for 78 observations (3.9%), which were excluded from the analyses.
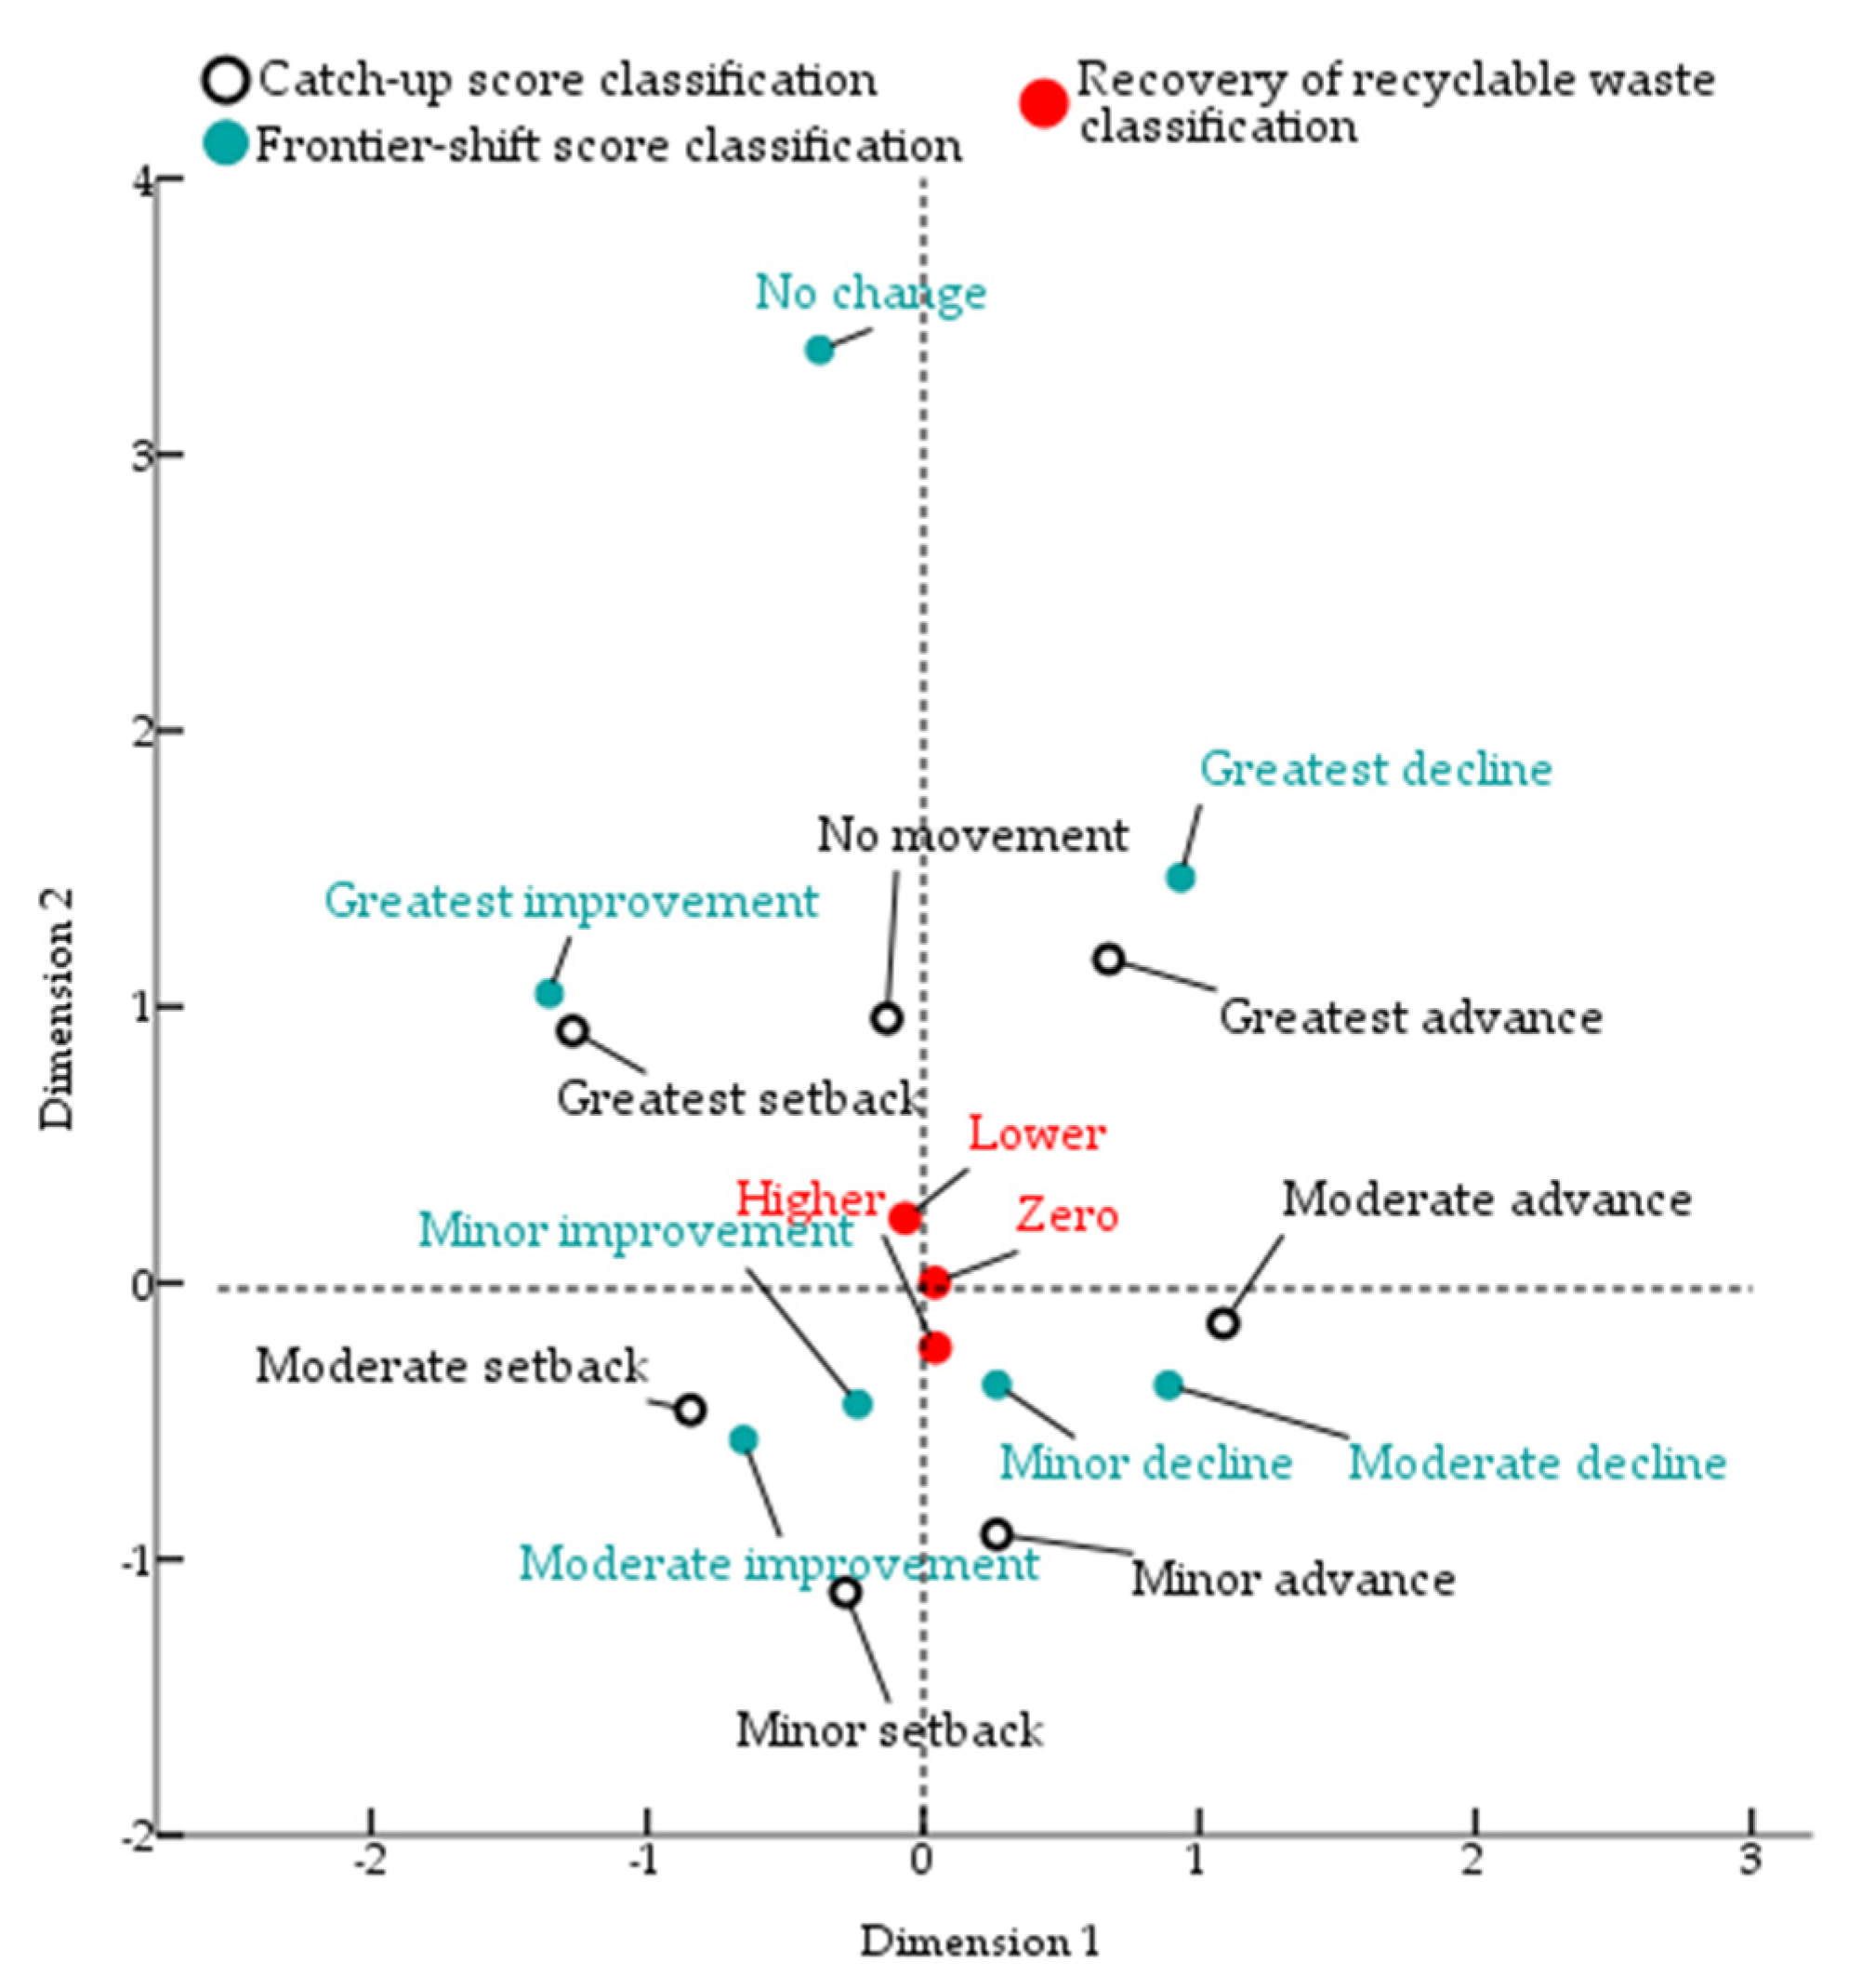
 Figure 3 and Figure 4 illustrate the perception charts generated by the multiple correspondence analysis technique, showing associations for (Effjt classification × Prodjt classification × Rrecjt classification) and (Frontjt classification × Catchjt classification × Rrecjt classification), respectively.
Figure 3 shows various interaction perceptions from MCA with stacked panel data. Notable patterns include higher levels of the recovery rate of recyclable materials (Rrec) located in the fourth quadrant, intersecting with the moderate inefficiency category, and ‘Lower’ Rrec levels positioned in the third quadrant, aligning closely with the lowest inefficiency levels. Efficient MSWs are situated in the second quadrant, at a somewhat greater distance from MSWs engaging in indiscriminate collection. These interactions yielded a chi-square of 75.358, which was significant at 1% for the association between Effjt classification and Rrecjt classification, indicating a certain alignment between selective collection and inefficiency.
Productivity, measured by the Malmquist score, follows a more distant trajectory from Rrec than efficiency, with moderate and high productivity gains in the third quadrant, aligning with low selective collection levels, though with some separation. MSWs practicing indiscriminate collection (zero) appear in the second quadrant, close to the lowest productivity gains. Productivity losses are found in quadrants separate from the three Rrecjt categories. These results suggest a lack of association between productivity and the recovery rate of recyclable materials, confirmed by a chi-square of 20.455 with a significance level > 5% for the association between Prodjt classification and Rrecjt classification.
Regarding the association between productivity and efficiency, productivity losses correlate in the first quadrant with the highest inefficiencies, while efficient MSWs are closer to modest productivity gains. This understanding is supported by a chi-square of 153.808, significant at 1%, for the association between Effjt classification and Prodjt classification.
In Figure 4, perceptions of interactions between selective collection and productivity components decomposed into frontier shift and catch-up are highlighted by two key findings: (1) the proximity between higher Rrec levels and smaller technological declines (in the fourth quadrant), with significant associations between category groups, as evidenced by chi-square values of 54.833 and 45.793, both with sig. < 0.01 for Frontjt classification × Rrecjt classification and Catchjt classification × Rrecjt classification, respectively; and (2) an inverse association regarding productivity contributions in the interactions between Frontier-shift and Catch-up, supported by a Chi-square of 429.396 with sig. < 0.01 for the association between Frontjt classification and Catchjt classification.
This suggests an inverse association related to benefits to productivity, where efficiency gains may reduce the technology frontier and vice versa, a phenomenon common due to the natural compensation between these productivity components, emphasizing the complexity of interactions between efficiency changes and technological advances.
Diving deeper into the analysis of interactions between efficiency, productivity, and recyclable material recovery, a non-parametric test approach for three independent recovery samples (zero or indiscriminate collection, lower, and higher) is presented in Table 8.
From this perspective, higher inefficiencies are associated with elevated levels of recyclable material recovery, as H0 was rejected in all tests conducted, aligning with the MCA visualizations shown in Figure 3. However, productivity measures—whether by Malmquist or decomposed—do not appear to have significant associations with recyclable material recovery. This is also consistent with the MCA results shown in Figure 3 yet diverges from the significant associations depicted in Figure 4.
More robust interactions are analyzed from an econometric perspective, using a longitudinal panel structure and incorporating exogenous control variables established in the previous literature. Table 9 presents the descriptive statistics of the explanatory econometric model variables, including dependent variable descriptions for the clusters that do not perform indiscriminate collection, which are not shown in Table 6. Table 10 and Table 11 display the results of the explanatory econometric models, covering all observations and specifically the cluster of MSWs engaged in recyclable material recovery, respectively.
Considering the broader econometric perspective presented in Table 10, which includes MSWs that perform only indiscriminate collections, recyclable material recovery does not significantly influence efficiency; however, it negatively interacts with technological progress (frontier shift). Population density has a positive impact on both efficiency and technological advancement. Regarding income, GDP is negatively related to efficiency and changes over time (catch-up), yet it supports improvements in technological progress.
The COVID-19 pandemic period (2020–2022) had a negative impact on the efficiency and productivity of MSW management services, as indicated by the Malmquist score and technological advancements. These years are considered atypical due to factors such as social isolation, changes in consumption and procurement patterns, and the increased demand for MSW management services. Although the impact was accounted for through the inclusion of a specific variable, it is acknowledged that the analysis of these effects can be explored in greater detail in future studies, particularly regarding the nature and magnitude of the observed changes.
Summarizing the results for all MSWs, the findings suggest a lack of interaction between efficiency and selective collection, as significant explanatory power at the 5% level is concentrated in the exogenous control variables. This understanding similarly extends to productivity, as measured by Malmquist and efficiency changes across periods. Advances toward the frontier are also well explained by the exogenous variables; however, the negative interaction with material recovery allows us to suggest that recyclable material recovery does not enhance the odds of MSWs becoming more efficient and productive.
Comparing only MSWs that recover recyclable materials, Table 11 shows a negative interaction between the recovery rate and intertemporal efficiency, results consistent with findings in Cruz et al. [25] but differing from those in Sharholy et al. [48], Araya-Córdova [46], lo Sorto [47], and Xiao et al. [49]. As highlighted in the literature, environmental (exogenous) variables proved relevant for comparing efficiency scores, all with the same directional influences (positive or negative) as reported for results involving all observations.
In terms of productivity, findings related to the Malmquist measure continued to show only the COVID-19 period’s relevance in degrading this productivity metric. Recyclable material recovery also interacts negatively with technological progress, contrary to [43], with density exerting a mild influence. Material recovery does not interact with efficiency change, which is negatively impacted by GDP and positively affected by the COVID-19 period—the only model with this directional outcome, explained by the natural compensation between productivity components.
These findings suggest that MSWs adopting recycling policies are less efficient as they deepen their commitment to such selective collection policies and are more prone to technological decline. They also suggest the effects of density, income, and COVID-19 on efficiency, with density being significant for technological advancement and COVID-19 linked to decline.

6. Conclusions

In many countries, including those in the BRICS, the primary method for managing solid waste involves sending it to landfills. Thus, it seems logical that the fewer solid waste materials disposed of in landfills, the lower the transportation, maintenance, and landfill creation costs, resulting in better efficiency and productivity for municipal solid waste services. In this regard, this study aimed to analyze the interactions between intertemporal efficiency, productivity, and the recovery of recyclable materials in the Brazilian MSWs.
What distinguished this work from the previous literature was the use of a dynamic intertemporal approach, with the premise that operational expenditures (OPEX) represent unwanted connections from one year to the next, as well as the analysis of the recovery of recyclable materials as an explanatory factor for the resulting efficiency and productivity.
The sector’s average inefficiency (39%) and accumulated productivity loss over ten years raise concerns about compliance with SDGs 12 and 6. Contrary to expectations, the study’s results suggest that the more solid waste recovery policies implemented by MSWs, the less efficient the management of solid waste becomes. Regarding productivity, the recovery policy appears to be causing technological regressions, despite advancements in Brazilian legal frameworks. Insights from these findings raise concerns about generating incentives to advance recycling policies, as they cast doubt on the economic efficiency and technological advancements concerning the dilemma between indiscriminate and selective collection, and whether the recovery of recyclable materials will prove economically viable.
Contextual factors played a significant role, with population density and income levels influencing efficiency, while the COVID-19 pandemic negatively impacted both efficiency and productivity, reinforcing their importance in shaping benchmarking policies for municipal solid waste services.
Policy and practical implications can be drawn from the results of this work, such as:
(a)
Coincidentally or not, the worst year for productivity was 2022, coinciding with the first full year under Law 14,260/2021 [30], enacted on 8 December 2021, aimed at generating incentives for the Brazilian recycling industry. Insights suggest that, as of 2022, we have not yet seen positive impacts from the law from a scientific perspective. Whether the newly issued regulatory decree for this law (Decree 12,106/2024 [31]) will provide sufficient incentives to change the undesirable trend remains uncertain.
(b)
Law 11,445/2007 [29], which established minimum regulatory requirements, including cost efficiency, is another framework that our results call into question. Insights reveal that our findings do not reflect practical improvements in the continued pursuit of increased efficiency, particularly given that 2033 is the deadline set by Law 14,026/2020 [27] for the universalization of basic sanitation services in Brazil, of which solid waste management is a part.
(c)
Regulatory agencies, municipal managers, and social control bodies can use these findings to delve deeper into the efficiency and productivity landscape of Brazilian solid waste services to organize effective public and regulatory policies.
This study focused on the consumption of resources aimed at managing specific volumes of solid waste and the households served, without exploring the dimension of municipal revenues associated with selective waste collection, such as industrial fees and carbon credit transactions, among others. This limitation highlights a significant gap for future research.
Therefore, it is recommended to conduct studies analyzing the relationship between revenue collection from urban solid waste services and the efficiency of service delivery, also considering their impacts and contributions to the recycling industries. Such research is particularly relevant for urban solid waste operators in emerging countries that are still in the early stages of implementing revenue collection mechanisms for these services. Additionally, the application of stochastic frontier analysis (SFA) to compare and validate the results obtained in this study emerges as another promising direction for future research.
In the political–institutional sphere, normative studies are suggested to evaluate strategies for strengthening incentives for recycling. In contexts similar to Brazil, it is crucial to deepen the debate on defining benchmarks for the sector. This includes, among other aspects, analyzing the allocation of public funds to recycling initiatives and the role of regulatory agencies in promoting service efficiency, topics that demand further attention and contributions.

Author Contributions

A.B.: conceptualization, validation, data curation, writing—original draft preparation, writing—review and editing; T.J.d.C.G.: conceptualization, validation, data curation, writing—original draft preparation, writing—review and editing; P.S.: conceptualization, validation, supervision, writing—review and editing. All authors have read and agreed to the published version of the manuscript.

Funding

This study was financed in part by the Coordenação de Aperfeiçoamento de Pessoal de Nível Superior-Brasil (CAPES)-Finance Code 001.

Institutional Review Board Statement

Not applicable.

Informed Consent Statement

Not applicable.

Data Availability Statement

Data are available in a publicly accessible repository that does not issue DOIs. Publicly available datasets were analyzed in this study. These data can be found here: [http://app4.mdr.gov.br/serieHistorica/, accessed on 6 November 2024].

Conflicts of Interest

The authors declare no conflicts of interest.

References

  1. Lino, F.A.M.; Ismail, K.A.R.; Castañeda-Ayarza, J.A. Municipal Solid Waste Treatment in Brazil: A Comprehensive Review. Energy Nexus 2023, 11, 100232. [Google Scholar] [CrossRef]
  2. Khan, M.A.; Khan, R.; Al-Zghoul, T.M.; Khan, A.; Hussain, A.; Baarimah, A.O.; Arshad, M.A. Optimizing Municipal Solid Waste Management in Urban Peshawar: A Linear Mathematical Modeling and GIS Approach for Efficiency and Sustainability. Case Stud. Chem. Environ. Eng. 2024, 9, 100704. [Google Scholar] [CrossRef]
  3. Llanquileo-Melgarejo, P.; Molinos-Senante, M. Assessing Eco-Productivity Change in Chilean Municipal Solid Waste Services. Util. Policy 2022, 78, 101410. [Google Scholar] [CrossRef]
  4. Eshete, A.; Haddis, A.; Mengistie, E. Investigation of Environmental and Health Impacts Solid Waste Management Problems and Associated Factors in Asella Town, Ethiopia. Heliyon 2024, 10, e28203. [Google Scholar] [CrossRef] [PubMed]
  5. Chen, C.; Zhai, M.; Wang, X.; Li, W.; Xu, Y.; Bao, Z. Analysis of the Dynamics of Common Industrial Solid Waste Based on Input–Output: A Case Study of Shanghai International Metropolis in China. Waste Manag. 2024, 177, 1–12. [Google Scholar] [CrossRef]
  6. Gonçalves, A.T.T.; Moraes, F.T.F.; Marques, G.L.; Lima, J.P.; Lima, R.D.S. Urban Solid Waste Challenges in the BRICS Countries: A Systematic Literature Review. Ambiente E Agua—Interdiscip. J. Appl. Sci. 2018, 13, 1. [Google Scholar] [CrossRef]
  7. Simões, P.; Marques, R.C. On the Economic Performance of the Waste Sector. A Literature Review. J. Environ. Manag. 2012, 106, 40–47. [Google Scholar] [CrossRef]
  8. Narbón-Perpiñá, I.; Witte, K. Local Governments’ Efficiency: A Systematic Literature Review—Part I. Int. Trans. Oper. Res. 2018, 25, 431–468. [Google Scholar] [CrossRef]
  9. Pereira, A.; Ribeiro, F.d.M.; Jeffrey, R.; Doron, A. Waste Policy Reforms in Developing Countries: A Comparative Study of India and Brazil. Waste Manag. Res. J. A Sustain. Circ. Econ. 2020, 38, 987–994. [Google Scholar] [CrossRef]
  10. Zhang, Z.; Chen, Z.; Zhang, J.; Liu, Y.; Chen, L.; Yang, M.; Osman, A.I.; Farghali, M.; Liu, E.; Hassan, D.; et al. Municipal Solid Waste Management Challenges in Developing Regions: A Comprehensive Review and Future Perspectives for Asia and Africa. Sci. Total Environ. 2024, 930, 172794. [Google Scholar] [CrossRef]
  11. Serrona, K.R.; Yu, J.; Che, J. Managing Wastes in Asia: Looking at the Perspectives of China, Mongolia and the Philippines. In Waste Management; InTech: Rijeka, Croatia, 2010. [Google Scholar]
  12. Molinos-Senante, M.; Maziotis, A.; Sala-Garrido, R. Estimating the Eco-Efficiency of Urban Waste Services towards Sustainable Waste Management. Sustain. Dev. 2024, 32, 5677–5691. [Google Scholar] [CrossRef]
  13. lo Storto, C. Measuring Ecoefficiency of Municipal Solid Waste Management in Apulia to Account for Governance Heterogeneities. Clean. Waste Syst. 2024, 7, 100131. [Google Scholar] [CrossRef]
  14. Tang, J.; Wang, Q.; Li, Z.; Gu, J.; Xu, J. Coupling Coordination Degree of Industrial Solid Waste Prevention and Treatment Efficiencies and Its Driving Factors in China. Ecol. Indic. 2024, 158, 111395. [Google Scholar] [CrossRef]
  15. Li, D.; Wang, M.-Q.; Lee, C. The Waste Treatment and Recycling Efficiency of Industrial Waste Processing Based on Two-Stage Data Envelopment Analysis with Undesirable Inputs. J. Clean. Prod. 2020, 242, 118279. [Google Scholar] [CrossRef]
  16. Zahrah, Y.; Yu, J.; Liu, X. How Indonesia’s Cities Are Grappling with Plastic Waste: An Integrated Approach towards Sustainable Plastic Waste Management. Sustainability 2024, 16, 3921. [Google Scholar] [CrossRef]
  17. Toshiki, K.; Giang, P.Q.; Serrona, K.R.B.; Sekikawa, T.; Yu, J.; Choijil, B.; Kunikane, S. Effects of Introducing Energy Recovery Processes to the Municipal Solid Waste Management System in Ulaanbaatar, Mongolia. J. Environ. Sci. 2015, 28, 178–186. [Google Scholar] [CrossRef]
  18. Struk, M.; Boďa, M. Factors Influencing Performance in Municipal Solid Waste Management—A Case Study of Czech Municipalities. Waste Manag. 2022, 139, 227–249. [Google Scholar] [CrossRef]
  19. Nur Syuhada, C.I.; Mahirah, K.; Roseliza, M.A. Dealing with Attributes in a Discrete Choice Experiment on Valuation of Water Services in East Peninsular Malaysia. Util. Policy 2020, 64, 101037. [Google Scholar] [CrossRef]
  20. Giannakitsidou, O.; Giannikos, I.; Chondrou, A. Ranking European Countries on the Basis of Their Environmental and Circular Economy Performance: A DEA Application in MSW. Waste Manag. 2020, 109, 181–191. [Google Scholar] [CrossRef]
  21. Pérez-López, G.; Prior, D.; Zafra-Gómez, J.L. Temporal Scale Efficiency in DEA Panel Data Estimations. An Application to the Solid Waste Disposal Service in Spain. Omega 2018, 76, 18–27. [Google Scholar] [CrossRef]
  22. Tone, K. A slacks-based measure of efficiency in data envelopment analysis. Eur. J. Oper. Res. 2001, 130, 498–509. [Google Scholar] [CrossRef]
  23. Tone, K.; Tsutsui, M. Dynamic DEA: A Slacks-Based Measure Approach. Omega 2010, 38, 145–156. [Google Scholar] [CrossRef]
  24. lo Storto, C. Measuring the Eco-Efficiency of Municipal Solid Waste Service: A Fuzzy DEA Model for Handling Missing Data. Util. Policy 2024, 86, 101706. [Google Scholar] [CrossRef]
  25. Da Cruz, N.F.; Simões, P.; Marques, R.C. Economic Cost Recovery in the Recycling of Packaging Waste: The Case of Portugal. J. Clean. Prod. 2012, 37, 8–18. [Google Scholar] [CrossRef]
  26. Molinos-Senante, M.; Maziotis, A.; Sala-Garrido, R.; Mocholí-Arce, M. Factors Influencing Eco-Efficiency of Municipal Solid Waste Management in Chile: A Double-Bootstrap Approach. Waste Manag. Res. 2023, 41, 457–466. [Google Scholar] [CrossRef]
  27. Diário Oficial da União. Brasil Lei no. 14.026, de 15 de Julho de 2020; Diário Oficial da União: Sede, Brasil, 2020; pp. 1–27. [Google Scholar]
  28. Diário Oficial da União. Brasil Lei no. 12.305, de 2 de Agosto de 2010; Diário Oficial da União: Sede, Brasil, 2010; pp. 1–19. [Google Scholar]
  29. Diário Oficial da União. Brasil Lei no. 11.445, de 5 de Janeiro de 2007; Diário Oficial da União: Sede, Brasil, 2007; pp. 1–52. [Google Scholar]
  30. Diário Oficial da União. Brasil Lei no. 14.260, de 8 de Dezembro de 2021; Diário Oficial da União: Sede, Brasil, 2021; pp. 1–5. [Google Scholar]
  31. Diário Oficial da União. Brasil Decreto no. 12.106, de 5 de Janeiro de 2007; Diário Oficial da União: Sede, Brasil, 2007; pp. 1–3. [Google Scholar]
  32. Kaza, S.; Yao, L.C.; Perinaz, B.-T.; Frank, V.W. What a Waste 2.0: A Global Snapshot of Solid Waste Management to 2050; World Bank Publications: Washington, DC, USA, 2018; ISBN 9781464813290. [Google Scholar]
  33. Associação Brasileira de Empresas de Limpeza Pública e Resíduos Especiais [ABRELPE]. Panorama Dos Resíduos Sólidos No Brasil 2022; ABRELPE: São Paulo, Brazil, 2022. [Google Scholar]
  34. Ministério do Desenvolvimento Regional. 18o Diagnóstico Do Manejo de Resíduos Sólidos Urbanos; Ministério do Desenvolvimento Regional: Brasília, Brazil, 2020. [Google Scholar]
  35. Campos, H.K.T. Recycling in Brazil: Challenges and Prospects. Resour. Conserv. Recycl. 2014, 85, 130–138. [Google Scholar] [CrossRef]
  36. Parte, L.; Alberca, P. Circular Economy and Business Models: Managing Efficiency in Waste Recycling Firms. Bus. Soc. 2024, 63, 1426–1461. [Google Scholar] [CrossRef]
  37. Hu, J.-L.; Honma, S.; Chang, T.-M. Recycling Efficiencies in Japan’s Administrative Regions: Findings from Network Data Envelopment Analysis. Circ. Econ. Sustain. 2024, 4, 1–21. [Google Scholar] [CrossRef]
  38. Rijal, S.; Huang, Y.-H.; Lin, H.-Y. An Integrated Approach to Municipal Solid Waste Recycling Performance Evaluation by Incorporating Local Demographic Features. Sustainability 2021, 13, 10446. [Google Scholar] [CrossRef]
  39. Pérez-López, G.; Prior, D.; Zafra-Gómez, J.L.; Plata-Díaz, A.M. Cost Efficiency in Municipal Solid Waste Service Delivery. Alternative Management Forms in Relation to Local Population Size. Eur. J. Oper. Res. 2016, 255, 583–592. [Google Scholar] [CrossRef]
  40. Benito, B.; Guillamón, M.D.; Martínez-Córdoba, P.J.; Ríos, A.M. Influence of Selected Aspects of Local Governance on the Efficiency of Waste Collection and Street Cleaning Services. Waste Manag. 2021, 126, 800–809. [Google Scholar] [CrossRef] [PubMed]
  41. Fan, X.; Yu, B.; Chu, Z.; Chu, X.; Huang, W.C.; Zhang, L. A Stochastic Frontier Analysis of the Efficiency of Municipal Solid Waste Collection Services in China. Sci. Total Environ. 2020, 743, 140707. [Google Scholar] [CrossRef]
  42. De Oliveira, M.C.V.; Klafke, R.; Chaerki, S.F. The Challenge of Urban Solid Waste Management in Brazil. Econ. Soc. Y Territ. 2022, 22, 177–206. [Google Scholar] [CrossRef]
  43. Cetrulo, T.B.; Marques, R.C.; Cetrulo, N.M.; Pinto, F.S.; Moreira, R.M.; Mendizábal-Cortés, A.D.; Malheiros, T.F. Effectiveness of Solid Waste Policies in Developing Countries: A Case Study in Brazil. J. Clean. Prod. 2018, 205, 179–187. [Google Scholar] [CrossRef]
  44. Franco, D.G.d.B.; Steiner, M.T.A.; Fernandes, R.P.; Nascimento, V.F. Modeling Municipal Solid Waste Disposal Consortia on a Regional Scale for Present and Future Scenarios. Socioecon. Plann Sci. 2022, 82, 101333. [Google Scholar] [CrossRef]
  45. Gonçalves, T.J.d.C.; Barbosa, A.; Simões, P.; Lima, S.C. de Political Factors and Efficiency in the Responsible Production of Municipal Solid Waste Services: A Dynamic DEA with a Network Structure Approach. Environ. Sci. Policy 2024, 162, 103914. [Google Scholar] [CrossRef]
  46. Araya-Córdova, P.J.; Dávila, S.; Valenzuela-Levi, N.; Vásquez, Ó.C. Income Inequality and Efficient Resources Allocation Policy for the Adoption of a Recycling Program by Municipalities in Developing Countries: The Case of Chile. J. Clean. Prod. 2021, 309, 127305. [Google Scholar] [CrossRef]
  47. lo Storto, C. Eco-Productivity Analysis of the Municipal Solid Waste Service in the Apulia Region from 2010 to 2017. Sustainability 2021, 13, 12008. [Google Scholar] [CrossRef]
  48. Sharholy, M.; Ahmad, K.; Mahmood, G.; Trivedi, R.C. Municipal Solid Waste Management in Indian Cities—A Review. Waste Manag. 2008, 28, 459–467. [Google Scholar] [CrossRef]
  49. Xiao, L.; Ye, H.; Xu, S.; Lin, T. Assessment of Waste Management Efficiency Using Subjective and Objective Indicators in 26 Major Chinese Cities. Ecosyst. Health Sustain. 2023, 9, 0024. [Google Scholar] [CrossRef]
  50. Rutkowski, J.E.; Rutkowski, E.W. Expanding Worldwide Urban Solid Waste Recycling: The Brazilian Social Technology in Waste Pickers Inclusion. Waste Manag. Res. J. Sustain. Circ. Econ. 2015, 33, 1084–1093. [Google Scholar] [CrossRef] [PubMed]
  51. Ministério das Cidades SNIS. Available online: https://www.gov.br/cidades/pt-br/acesso-a-informacao/acoes-e-programas/saneamento/snis/snis (accessed on 2 November 2024).
  52. Borges, M.C.P.; Abreu, S.B.; Lima, C.H.R.; Cardoso, T.; Yonamine, S.M.; Araujo, W.D.V.; Silva, P.R.S.; Machado, V.B.; Moraes, V.; Silva, T.J.B.; et al. The Brazilian National System for Water and Sanitation Data (SNIS): Providing Information on a Municipal Level on Water and Sanitation Services. J. Urban Manag. 2022, 11, 530–542. [Google Scholar] [CrossRef]
  53. Ministério do Meio Ambiente. Relatório Nacional de Gestão de Resíduos Sólidos 2019; Ministério do Meio Ambiente: Brasilia, Brazil, 2024. [Google Scholar]
  54. Barbosa, A.; de Lima, S.C.; Brusca, I. Governance and Efficiency in the Brazilian Water Utilities: A Dynamic Analysis in the Process of Universal Access. Util. Policy 2016, 43, 82–96. [Google Scholar] [CrossRef]
  55. Barbosa, A.; de Medeiros, F.A.S.; Simões, P. Governance and Efficiency in Brazilian Water Utilities: An Analysis Based on Revenue Collection Efficiency. Water 2024, 16, 2483. [Google Scholar] [CrossRef]
  56. Addae, E.A.; Sun, D.; Abban, O.J. Evaluating the Effect of Urbanization and Foreign Direct Investment on Water Use Efficiency in West Africa: Application of the Dynamic Slacks-Based Model and the Common Correlated Effects Mean Group Estimator. Environ. Dev. Sustain. 2023, 25, 5867–5897. [Google Scholar] [CrossRef]
  57. Lu, C.; Chen, X.; Hsieh, C.; Chou, K. Dynamic Energy Efficiency of Slack-based Measure in High-income Economies. Energy Sci. Eng. 2019, 7, 943–961. [Google Scholar] [CrossRef]
  58. Guo, X.; Lu, C.-C.; Lee, J.-H.; Chiu, Y.-H. Applying the Dynamic DEA Model to Evaluate the Energy Efficiency of OECD Countries and China. Energy 2017, 134, 392–399. [Google Scholar] [CrossRef]
  59. Hu, J.-L.; Honma, S.; Chang, S.-Y. Renewable Energy Generation Efficiency of Japan’s Administrative Regions: An Application of the Dynamic Slacks-Based Measure. Next Energy 2023, 1, 100029. [Google Scholar] [CrossRef]
  60. Hu, J.-L.; Huang, Y.-S.; You, C.-Y. Renewable Energy Generation Efficiency of Asian Economies: An Application of Dynamic Data Envelopment Analysis. Energies 2024, 17, 4682. [Google Scholar] [CrossRef]
  61. Gao, Y.; Lu, C.-C.; Wu, W.-S. Water-Energy-Food(WEF) Nexus Efficiency of Dynamic Slack-Based Measure in 31 Provinces and Regions in China. J. Clean. Prod. 2024, 460, 142433. [Google Scholar] [CrossRef]
  62. Gholian-Jouybari, F.; Khazaei, M.; Farzipoor Saen, R.; Kia, R.; Bonakdari, H.; Hajiaghaei-Keshteli, M.; Ramezani, M. Developing Environmental, Social and Governance (ESG) Strategies on Evaluation of Municipal Waste Disposal Centers: A Case of Mexico. Chemosphere 2024, 364, 142961. [Google Scholar] [CrossRef] [PubMed]
  63. Volsuuri, E.; Owusu-Sekyere, E.; Zarouk Imoro, A.; Napoleon Bellua, S. Assessing the Efficiency of Solid Waste Collection Services in Urban Ghana. Waste Manag. Bull. 2023, 1, 71–81. [Google Scholar] [CrossRef]
  64. Sarra, A.; Mazzocchitti, M.; Nissi, E. Optimal Regulatory Choices in the Organization of Solid Waste Management Systems: Empirical Evidence and Policy Implications. Environ. Sci. Policy 2020, 114, 436–444. [Google Scholar] [CrossRef]
  65. Cavalcanti, A.; Teixeira, A.; Pontes, K. Evaluation of the Efficiency of Basic Sanitation Integrated Management in Brazilian Municipalities. Int. J. Environ. Res. Public Health 2020, 17, 9244. [Google Scholar] [CrossRef] [PubMed]
  66. Pereira, M.A.; Marques, R.C. Sustainable Water and Sanitation for All: Are We There Yet? Water Res. 2021, 207, 117765. [Google Scholar] [CrossRef]
  67. Struk, M.; Matulová, M. The Application of Two-Stage Data Envelopment Analysis on Municipal Solid Waste Management in the Czech Republic. In Proceedings of the Quantitative Methods in Economics, Vrátna, Slovakia, 25–27 May 2016. [Google Scholar]
  68. Zhu, J. Multi-Factor Performance Measure Model with an Application to Fortune 500 Companies. Eur. J. Oper. Res. 2000, 123, 105–124. [Google Scholar] [CrossRef]
  69. Dyson, R.G.; Allen, R.; Camanho, A.S.; Podinovski, V.V.; Sarrico, C.S.; Shale, E.A. Pitfalls and Protocols in DEA. Eur. J. Oper. Res. 2001, 132, 245–259. [Google Scholar] [CrossRef]
  70. Molinos-Senante, M.; Maziotis, A.; Sala-Garrido, R.; Mocholi-Arce, M. The Eco-Efficiency of Municipalities in the Recycling of Solid Waste: A Stochastic Semi-Parametric Envelopment of Data Approach. Waste Manag. Res. 2023, 41, 1036–1045. [Google Scholar] [CrossRef]
  71. Llanquileo-Melgarejo, P.; Molinos-Senante, M. Evaluation of Economies of Scale in Eco-Efficiency of Municipal Waste Management: An Empirical Approach for Chile. Environ. Sci. Pollut. Res. 2021, 28, 28337–28348. [Google Scholar] [CrossRef]
  72. Romano, G.; Molinos-Senante, M. Factors Affecting Eco-Efficiency of Municipal Waste Services in Tuscan Municipalities: An Empirical Investigation of Different Management Models. Waste Manag. 2020, 105, 384–394. [Google Scholar] [CrossRef]
  73. Delgado-Antequera, L.; Gémar, G.; Molinos-Senante, M.; Gómez, T.; Caballero, R.; Sala-Garrido, R. Eco-Efficiency Assessment of Municipal Solid Waste Services: Influence of Exogenous Variables. Waste Manag. 2021, 130, 136–146. [Google Scholar] [CrossRef]
  74. Romano, G.; Rapposelli, A.; Marrucci, L. Improving Waste Production and Recycling through Zero-Waste Strategy and Privatization: An Empirical Investigation. Resour. Conserv. Recycl. 2019, 146, 256–263. [Google Scholar] [CrossRef]
  75. Expósito, A.; Velasco, F. Municipal Solid-Waste Recycling Market and the European 2020 Horizon Strategy: A Regional Efficiency Analysis in Spain. J. Clean. Prod. 2018, 172, 938–948. [Google Scholar] [CrossRef]
  76. Liang, K.-Y.; Zeger, S.L. Longitudinal Data Analysis Using Generalized Linear Models. Biometrika 1986, 73, 13–22. [Google Scholar] [CrossRef]
  77. Jalali Naini, S.G.; Nouralizadeh, H.R. A Two-Stage DEA to Analyze the Effect of Entrance Deregulation on Iranian Insurers: A Robust Approach. Math. Probl. Eng. 2012, 2012, 423524. [Google Scholar] [CrossRef]
  78. Dohmen, P.; van Ineveld, M.; Markus, A.; van der Hagen, L.; van de Klundert, J. Does Competition Improve Hospital Performance: A DEA Based Evaluation from the Netherlands. Eur. J. Health Econ. 2023, 24, 999–1017. [Google Scholar] [CrossRef]
  79. Barbosa, A.; Dantas, M.; Azevedo, Y.; Holanda, V. Fiscal Responsibility Strategy in Brazilian Football Clubs: A Dynamic Efficiency Analysis. Braz. Bus. Rev. 2017, 14, 45–66. [Google Scholar] [CrossRef]
  80. Dantas, M.G.d.S.; Gasparetto, T.; Barbosa, A.; Sampaio, L. Financial and Sporting Efficiency and Productivity in Brazilian Football Clubs. Manag. Financ. 2024; ahead-of-print. [Google Scholar] [CrossRef]
  81. Hardin, J.W.; Hilbe, J.M. Generalized Linear Models and Extensions, 2nd ed.; Stata Press: College Station, TX, USA, 2007. [Google Scholar]
Figure 1. Information on inadequate disposal of urban solid waste—SNIS.
Sustainability 17 02519 g001
Figure 2. DSBM structure for the efficiency and productivity.
Sustainability 17 02519 g002
Figure 3. MCA: Effjt classification × Prodjt classification × Rrecjt classification.
Sustainability 17 02519 g003
Figure 4. MCA: Frontjt classification × Catchjt classification × Rrecjt classification.
Sustainability 17 02519 g004
Table 1. Definition of DSBM efficiency variables.
AcronymsDescriptionDSBM
Specification
References
WORKjtTotal number of (paid) workers in SWS, at the end of the reference year + temporary workers. Unit: number of workers. Data source: SNIS code = TB015 + TB017 + TB018 + TB019.Input
= x 1 j t
[41,62,63]
VEHjtSum of vehicles (trucks, tractors, water vehicles, and animal traction) used in the SWS. Unit: number of vehicles. Data source: SNIS code = CO054 + CO081.Input
= x 2 j t
[41,63]
OPEXjtAnnual value of the result of the sum of all operational expenditures with SWS. Data source: SNIS code = FN214 + FN217 + FN218. Unit: BRL (Reais). Carry-over
Undesirable (bad)
= z 1 j t b a d
[39,40,64]
SWCjtAnnual value of the sum of the total quantities of household waste and urban cleaning public waste collected by all agents. Data source: SNIS code = CO119. Unit: tons.Output
= y 1 j t
[40,41,62]
PROjtNumber of active water consumption units, which were in full operation on the last day of the reference year (as a proxy for the total of the properties representing the set of: houses, apartments, businesses companies, public offices, and others within the area of SWS). Unit: consumption units. Data source: SINIS code = AG003.Output
= y 2 j t
[65,66,67]
Notes: j = MWS (DMU) and t = year (term); OPEX were deflated by the Índice Nacional de Preços ao Consumidor Amplo (IPCA); OPEX as an undesirable (bad) transfer because it indicates undesirable transfers, where undesirable links are treated as inputs and its value is restricted to be no greater than observed. The study by Gonçalves et al. [45] applies a similar approach to variables related to expenses with MSW.
Table 2. Definition of explanatory variables.
AcronymsDescriptionExpectationReferences
RrecjtRecovery rate of recyclable materials (excluding organic matter and waste) relative to the total amount collected. Data source: SNIS code = IN031. Unit: %.(+)Variable of interest
DenjtRelation between the total number of inhabitants and the area of the municipality in km2. Unit: inhabitants/km2. Data source: Instituto Brasileiro de Geografia e Estatística (IBGE).(+)[40,45,70,71,72,73,74]
GDPjtRatio of the municipality’s gross domestic product (GDP) divided by the municipal population. Unit: BRL/Inhabitants. Data source: IBGE.(+)[45,71,72,73,75]
COVID19jtProposal for controlling the impact of COVID− 19 during the years 2020 to 2022. Unit:Binary.(−)[45]
Notes: j = MWS (DMU) and t = year (term). GDP were deflated by the Índice Nacional de Preços ao Consumidor Amplo (IPCA).
Table 3. Descriptive statistics of DSBM efficiency variables.
YearWORKjVEHjOPEXj
MeanStd. Dev.Min.Max.MeanStd. Dev.Min.Max.MeanStd. Dev.Min.Max.
20134461784423,4382357151534,068,432138,099,52838,6581,762,331,354
20144491894425,1912673171936,681,773156,144,49789,2982,035,287,398
20154231735322,9572566173635,997,180153,567,001101,3842,027,128,388
20164311845324,5212670165236,045,939155,759,851115,9822,057,013,915
20174081701322,5862353053134,582,776151,484,92589,2682,011,724,120
20184141676422,3142453151236,594,046156,586,16368,4072,076,430,101
20194111672422,1712664159638,216,872164,477,90283,5002,173,975,757
20204261692322,1542664159638,377,389159,070,17280,0802,077,658,177
20214301650221,5712656155436,369,605142,727,42179,8721,838,305,487
20224461691222,0392655153342,543,158166,743,55992,6362,160,320,745
YearSWCj PROj
MeanStd. Dev.Min.Max. MeanStd. Dev.Min.Max.
201387,496310,3291683,465,187 72,824201,4752442,219,225
201488,972305,1251263,324,526 74,779204,5592562,234,347
201589,304294,5081483,273,256 77,064214,6352612,396,224
201683,370276,1941583,146,851 78,493217,2032472,423,676
201780,573261,8471093,016,556 79,722218,7002452,433,242
201883,665269,5331313,079,233 80,849220,4672782,450,920
201988,541284,2451553,223,437 82,813230,2422782,613,356
202092,362292,5961743,229,449 85,948237,65402,715,431
202190,685282,012842,985,664 88,082239,5702672,717,529
202284,130265,931853,133,457 85,957214,3992762,189,367
Table 4. Kendall’s tau-b correlations coefficients between DSBM efficiency variables.
WORKjtVEHjtOPEXjtSWCjt
WORKjtCoefficient 0.710 **0.808 **0.793 **
sig. (two-tailed) 0.0000.0000.000
VEHjtCoefficient0.710 ** 0.702 **0.707 **
sig. (two-tailed)0.000 0.0000.000
OPEXjtCoefficient0.808 **0.702 ** 0.823 **
sig. (two-tailed)0.0000.000 0.000
SWCjtCoefficient0.793 **0.707 **0.823 **
sig. (two-tailed)0.0000.0000.000
PROjtCoefficient0.786 **0.708 **0.827 **0.864 **
sig. (two-tailed)0.0000.0000.0000.000
Note: **. Correlation is significant at the 0.01 level (two-tailed).
Table 5. Nonparametric tests of differences between DSBM scores under CRS and VRS assumptions.
Wilcoxon Signed Ranks Test
2013201420152016201720182019202020212022
Z (Based on negative ranks.)−10.961−11.534−11.634−11.517−11.583−11.570−11.482−11.548−11.557−11.297
Asymp. sig. (two-tailed)0.0000.0000.0000.0000.0000.0000.0000.0000.0000.000
Table 6. Descriptive statistics of Effj, Prodj, Frontj, and Catchj by year and overall.
2013201420152016201720182019202020212022Overall
Effj Average
Mean0.6280.6590.6420.6370.6420.6280.5850.5820.5860.6020.619
Efficient (% MSW)18.1%20.6%19.6%16.6%15.6%19.1%14.1%19.1%17.6%19.1%4.0%
Prodj Geometric Mean
Mean1.0691.0251.0201.0271.0500.9851.0361.1321.0130.9190.997
Gain (% MWS)58.8%54.8%53.3%52.3%55.8%45.7%54.8%57.3%47.2%23.6%43.7%
Loss (% MWS)40.7%44.7%45.7%47.7%44.2%54.3%44.2%41.2%52.3%75.4%55.8%
Frontj
Mean0.9550.9761.0441.0091.0220.9981.1021.1040.9970.8700.995
Improv. (% MWS)30.7%35.2%73.9%66.3%55.8%53.3%63.3%68.8%49.2%7.5%33.2%
Decline (% MWS)68.8%64.3%25.6%33.2%44.2%46.7%35.7%29.6%50.3%91.5%66.8%
Catchj
Mean1.1221.0540.9851.0161.0330.9910.9561.0161.0311.0661.002
Advance (% MWS)60.3%49.7%34.2%44.2%46.2%42.2%35.7%40.2%46.2%55.8%47.7%
Setback (% MSW)26.1%33.7%50.3%43.2%43.7%44.7%52.8%47.7%40.2%29.6%44.2%
Table 7. Descriptive statistics of Effjt, Prodjt, Frontjt, and Catchjt classifications.
Effjt ClassificationProdjt ClassificationFrontjt ClassificationCatchjt Classification
Freq.% Freq.% Freq.% Freq.%
Largest inefficiencies40920.6Largest losses24412.3Greatest decline24412.3Greatest setback20510.3
Moderate inefficiencies81541.0Moderate losses48824.5Moderate decline48724.5Moderate setback41020.6
Smallest inefficiencies40920.6Small losses24412.3Minor decline24412.3Minor setback20510.3
Efficient35717.9Stability120.6No change120.6No movement26513.3
Small gains25112.6Minor improvement25212.7Minor advance22711.4
Moderate gains50025.1Moderate improvement50025.1Moderate advance45122.7
Largest gains25112.6Greatest improvement25112.6Greatest advance22711.4
Total1990100.0 1990100.0 1990100.0 1990100.0
Table 8. Nonparametric tests of Effjt, Prodjt, Frontjt, and Catchjt by Rrecjt classification.
Recovery of Recyclable Waste ClassificationTest—Asymp. Sig.
Classif.NMeanMean RankKruskal–WallisMedianJonckheere–Terpstra
Efficiency scoreZero4170.633456996.27
Lower7470.6639581067.830.0000.0000.000
Higher7480.559180823.15H0 rejected
Malmquist productivity scoreZero4171.035847978.26
Lower7471.027039954.110.6390.9320.393
Higher7481.019867946.76H0 retain
Frontier shift scoreZero4171.002799941.27
Lower7471.015845977.810.4000.7170.765
Higher7480.999977943.71H0 retain
Catch-up scoreZero4171.038830977.49
Lower7471.020588952.330.6750.5290.467
Higher7481.026247948.96H0 retain
Table 9. Descriptive statistics of econometric variables.
VariableObs.MeanStd. Dev.MinMax
All Observations
Rrecjt19904.66426.11350.000020.3500
Denjt1990578.14761118.93308.65794186.1910
GDPjt199035.149117.714111.293481.0735
COVID19jt19900.30000.45840.00001.0000
Cluster with recovery rate greater than 0
Effjt14950.61150.23930.12511.0000
Prodjt14951.01180.19640.66301.4664
Frontjt14951.00320.12580.76591.2708
Catchjt14951.01950.19970.66521.4669
Rrecjt14956.20856.33750.010020.3500
Denjt1495653.83141170.90208.65794186.1910
GDPjt149537.120817.838711.293481.0735
COVID19jt14950.32510.46860.00001.0000
Table 10. Results of the GEE regression models (all observations selective and indiscriminate).
Model 1 Model 2Model 3Model 4
EffProdFrontCatch
Rrec−0.001430−0.000502−0.0006300.000118
−1.07 (0.285)−0.98 (0.325)−2.57 (0.010) ***0.24 (0.813)
Den0.0000550.0000050.000007−0.000003
3.31 (0.001) ***1.8 (0.072) *4.96 (0.000) ***−1.14 (0.253)
GDP−0.001372−0.0001520.000254−0.000457
−2.31 (0.021) **−0.99 (0.321)3.28 (0.001) ***−2.97 (0.003) ***
COVID-19−0.031244−0.026441−0.0188290.005265
−2.41 (0.016) **−3.53 (0.000) ***−4.93 (0.000) ***0.63 (0.532)
ConsMarginal effects0.0294500.0057111.033675
4.55 (0.000) ***1.86 (0.063) *156.43 (0.000) ***
Robustness analysis
Wald chi2(9)27.9925.7274.0910.71
Prob > chi20.000 ***0.000 ***0.000 ***0.030 **
QIC (smallest)2611.23082.58733.24484.109
QICu2610.45088.03740.29589.678
CorrelationExchangeablear9ar3ar6
FamilyBinomialgaussiangaussiangaussian
LinkLogitLogLogIdentity
Number of observations: 1990
Number of groups: 199
Variance inflation factor (mean): 1.05
Note: *** significance at 1%; ** significance at 5%; * significance at 10%.
Table 11. Results of the GEE regression models (selective collections cluster).
Model 1Model 2Model 3Model 4
EffProdFrontCatch
Rrec−0.002895−0.000502−0.0010340.000807
−2.12 (0.034) **−0.98 (0.325)−3.36 (0.001) ***1.46 (0.145)
Den0.0000530.0000050.000006−0.0000002
3.08 (0.002) ***1.8 (0.072) *3.74 (0.000) ***−0.05 (0.959)
GDP−0.001501−0.000152−0.000012−0.000423
−2.35 (0.019) **−0.99 (0.321)−0.13 (0.894)−2.23 (0.026) **
COVID-19−0.035468−0.026441−0.0302930.020089
−2.28 (0.022) **−3.53 (0.000) ***−5.94 (0.000) ***2.26 (0.024)**
ConsMarginal effects0.0294501.0167790.023074
4.55 (0.000) ***217.38 (0.000) ***2.61 (0.009) ***
Robustness analysis
Wald chi2(9)30.3218.7586.3412.17
Prob > chi20.000 ***0.001 ***0.000 ***0.016 **
QIC (smallest)1971.54562.00926.73764.124
QICu1971.88767.33033.20969.417
CorrelationExchangeableExchangeableExchangeableExchangeable
FamilyBinomialGaussianGaussianGaussian
LinkLogitLogIdentityLog
Number of observations: 1495
Number of groups: 180
Variance inflation factor (mean): 1.09
Note: *** significance at 1%; ** significance at 5%; * significance at 10%.
Disclaimer/Publisher’s Note: The statements, opinions and data contained in all publications are solely those of the individual author(s) and contributor(s) and not of MDPI and/or the editor(s). MDPI and/or the editor(s) disclaim responsibility for any injury to people or property resulting from any ideas, methods, instructions or products referred to in the content.

