Abstract
In 2022, Korea became the first country to introduce a climate change impact assessment (CCIA) system that requires prior analysis and evaluation of climate impacts for major development projects, delivering a relevant analysis and management framework for such purposes. This study reviews Korea’s CCIA system from a policy perspective, organizing its structural components, assessment procedures, and reporting methods according to the domains of greenhouse gas (GHG) mitigation and climate crisis adaptation. The system’s characteristics and assessment procedures of this system are also analyzed via a case study review of urban development projects. In the GHG mitigation category, emissions and absorptions should be investigated at each project stage and quantitative reduction amounts and targets established based on scientific and statistical evidence. Regarding climate crisis adaptation, regional climate risks should be analyzed and adaptation strategies for priority management areas developed based on impact prediction results. CO2 concentrations recorded in Seoul’s central and background areas confirmed spatial differences in city-level GHG concentrations, proposing the CCIA’s potential practical use for enhancing future monitoring frameworks. To enhance the effectiveness of the CCIA and its consequences for future sustainability, the opinions of various stakeholders and linking the system with existing environmental impact (EIA) assessment frameworks are paramount.
1. Introduction
According to the International Energy Agency (IEA), global carbon dioxide emissions in 2023 reached a record high of 37.4 billion tons [1]. Furthermore, the IPCC Special Report [2] pointed out that the global average temperature rise is accelerating, warning that a 2 °C increase compared to the pre-industrial level can result in irrevocable climate damage. To prevent the temperature rises from exceeding 1.5 °C, it is advocated to convert the global CO2 emissions to net zero by 2050. In addition, the damage to biodiversity is exacerbated by climate change and global warming. The Intergovernmental Panel on Biodiversity and Ecosystems Services (IPBES) [3] warns that nearly 1 million species (12.5% of the total) face the risk of extinction within the next few decades. In the midst of such sense of crisis, the Paris Agreement was adopted at the global level during the 21st Conference of the Parties (COP21) to the United Nations Framework Convention on Climate Change [4], where all countries began participating in climate actions under a universal system to keep the average temperature rise “well below” 2 °C compared to the pre-industrial level and limit it to 1.5 °C [5].
Korea ratified the Paris Agreement in 2016 and enacted the Framework Act on Carbon Neutrality and Green Growth for Coping with Climate Crisis in 2021, formally establishing its goal of achieving carbon neutrality by 2050 [6]. Also, the 2030 Nationally Determined Contribution (NDC) was revised to “40% reduction compared to 2018” [7], while the Climate Change Impact Assessment (CCIA) system was implemented in September 2022. This system is based on Article 23 of the Act, which stipulates that major policy plans and development projects are to be assessed in advance in terms of greenhouse gas (GHG) emissions and impact on climate crisis adaptation, and establishing proper reduction or adaptation measures. In particular, CCIA consists of the following core assessment categories: (1) GHG mitigation assessment: calculating expected emissions per project and reviewing reduction measures, (2) climate adaptation assessment: climate crisis analysis and reviewing response strategies, and (3) urban GHG monitoring: measuring CO2 concentration in the urban atmosphere and evaluating emission source characteristics. CCIA in Korea concerns 10 areas, including energy development, industrial complexes, urban development, water resources, and mountain development. Urban development projects exceeding 1 million m2 or industrial complexes of 500,000 m2 or higher are subject to assessments centered around GHG mitigation and climate crisis adaptation. Specifically, a strategic environmental impact assessment (EIA) and an EIA encompass estimating GHG emissions, evaluating climate crisis adaptability, and conducting post-impact assessment, thus serving as essential mechanisms for the practical implementation of policies related to climate crisis. Existing international systems are mostly advisory and do not have legal enforceability; however, Korea’s system is distinctive in that it introduced the world’s first legally mandated CCIA in 2022, enabling the simultaneous assessment of GHG reduction and climate crisis adaptation.
Meanwhile, the GHG concentration monitoring level in the urban atmosphere varies by region across the globe. The United States pursues long-term urban CO2 observations, whereas Europe and Asia mainly take short-term measurements of less than a year, thus lacking sufficient observation-based data [8,9,10]. According to these studies, the CO2 concentration of major cities ranges from high 300 ppm to mid-400 ppm, with differences being observed depending on city layout and emission source characteristics. These international trends imply the necessity of a complementary approach based on monitoring for strengthening the accuracy and reliability of Korea’s CCIA system.
The purpose of this study was to provide policy implications through a comprehensive analysis of system structure, assessment procedures, and review cases of major project types of Korea’s CCIA, which is the first legislated system in the world. Accordingly, the study examines major issues and the current status of assessment regarding GHG mitigation and climate crisis adaptation, based on urban development cases. Furthermore, the current system estimates GHG emissions according to statistical data derived from energy consumption. However, considering a certain level of uncertainty, this study reviews the possibility of utilizing regional GHG observation data as a practical means of supplementing the monitoring system in the future. These reviews are not the primary aim of this study; rather, they serve as practical recommendations intended to improve the future accuracy and reliability of CCIA.
2. Research Methods
This study was conducted to analyze the structure and operational status of the CCIA system in Korea from the perspective of policy review, and to review practical application and monitoring-based complementary measures based on urban development cases.
2.1. Literature Review Protocol
The literature review was carried out according to the systematic review procedure.
2.1.1. Search Database and Data Type
The search databases included the Korean Law Information Center, Ministry of Environment laws and guidelines, as well as research reports from the National Institute of Environmental Research (NIER) and Korea Environment Institute (KEI), in addition to certain international databases such as Scopus, Web of Science, and Google Scholar. The data type included legislation, policy and guideline documents, research reports, and academic papers.
2.1.2. Search Keywords and Search Period
The keywords included “Climate Change Impact Assessment”, “GHG mitigation”, “Climate adaptation”, and “Urban CO2 monitoring”; the search period was from 2010 to 2023.
2.1.3. Inclusion and Exclusion Criteria
CCIA-related system documents, legislations and guidelines, assessment case reports, and urban greenhouse gas observation data were included, whereas general EIA reports and unreliable or unofficial reports were excluded.
2.1.4. Literature Selection Process
For the literature, 70 articles were identified through title and abstract screening of an initial 120 articles, followed by a full-text review to select the final 35 articles. The analysis items included system structure, assessment procedure, preparation method, application cases, and observation data.
2.2. CCIA Case Analysis
Among various urban development projects, this study analyzed the application status and procedure of CCIA, focusing on public housing district development projects. First, the GHG mitigation assessment comprised the current status of emission sources and sinks, GHG emission calculation and reduction measure review, establishment of quantitative reduction targets, and assessment opinions and suggestions. The climate adaptation assessment comprised the current status and prospects of regional climate change, climate change impact forecast and analysis, response strategy derivation, and assessment opinions and suggestions.
2.3. Urban GHG Observation
In this study, two locations in Seoul were selected to measure the CO2 concentration to evaluate the possibility of enhancing CCIA’s current emission calculation system. The first location is the Yongsan Building (YB), situated in the center of Seoul, while the second location is Seoul National University (SNU), located in the southern part of Seoul, both with an urban background. The measurement period was two months from 1 September to 31 October 2021. The measurements were taken through non-dispersive infrared (NDIR) and cavity photon depletion spectroscopy (CRDS) methods. The calibration and uncertainty evaluation of the equipment were performed based on the Global Atmosphere Watch Programme—Guidelines for Greenhouse Gas Measurement Techniques (WMO, 2016), Study on the Establishment of Urban Greenhouse Gas Monitoring System (NIER, 2021) as well as comparative verification data on GHG concentration observation equipment performance (Park et al., 2023) [11,12,13]. When both the LI-COR LI-850 (NDIR) (LI-COR, Inc., Lincoln, OR, USA) and Picarro G2301 (CRDS) (Picarro, Inc., Santa Clara, CA, USA) equipment were calibrated using the identical CO2 standard gas (400, 1000 ppm), the R2 of the calibration curve for each equipment was above 0.9999, demonstrating outstanding correlation. Additionally, pre- and post-measurements of each equipment were repeatedly taken, and the measurement uncertainty was below ±1 ppm for LI-COR LI-850 and ±0.1 ppm for Picarro G2301, which satisfied the manufacturers’ standards. The data collected at 1-min intervals were aggregated into hourly averages, and outliers of ±2σ or higher were considered missing. Data processing was performed using Excel. The locations of the two measurement points are shown in Figure 1, with the details presented in Table 1.
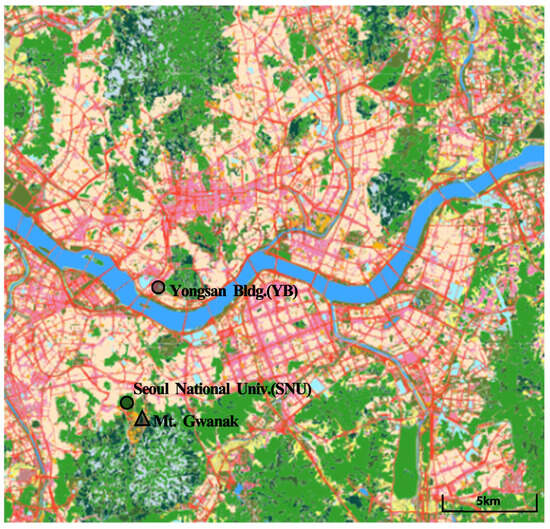
Figure 1.
Map of the GHG measurement sites.

Table 1.
Information on the GHG observation sites.
3. Results and Discussion
3.1. Current Status of CCIA System
According to Article 23 of South Korea’s Framework Act on Carbon Neutrality and Green Growth for Coping with the Climate Crisis (hereinafter referred to as the Carbon Neutrality Basic Act), CCIA is defined as “investigating, predicting, and evaluating the impact of climate change or the impact of being affected by climate change when conducting strategic EIA or EIA for policy and development plans or EIA for target projects, and based on this, reducing GHG emissions and preparing climate crisis adaptation measures.” This Act came into effect on 25 September 2022 [6]. Article 15 of the Enforcement Decree of the same Act specifies the plans and projects subject to CCIA, which are presented in Table 2. By implementing the CCIA system, the head of the planning agency or the project proponent must evaluate the impact of plans and development projects on climate change and the impact they will receive from climate change in advance; this will contribute to the establishment of proactive and practical measures and post-management plans for “GHG mitigation” and “climate crisis adaptation.” It also serves as a platform that can integrate and analyze data used individually by ministries, local governments, etc., or scattered across various fields, for “GHG mitigation” and “climate crisis adaptation” [14]. The climate change impact assessment procedure is presented in Figure 2.
Table 2.
Target plans and projects for CCIA [6].
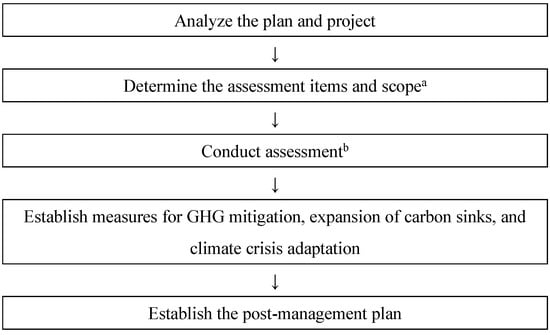
Figure 2.
Procedure for CCIA. a Determination of evaluation items, scope, and content (scoping) at the EIA Council stage. b This refers to the entire process of status investigation → impact prediction → evaluation in the GHG mitigation and climate crisis adaptation sector.
Table 3 compares South Korea’s environmental and climate change impact assessment systems. EIA comprehensively evaluates natural ecosystems, air, water, land, living, and socio-economic environments. In contrast, CCIA focuses on evaluating GHG mitigation and climate crisis adaptation. Furthermore, the direction for promoting climate change assessments is designed to guide and adjust from the preparation stage to ensure that planned projects are implemented in a manner suitable for carbon neutrality policies, rather than blocking their implementation [14].
Table 3.
Comparison of EIA and CCIA systems [14].
3.2. Preparing the CCIA
3.2.1. GHG Mitigation Field
The method for preparing a climate change impact assessment, which is subject to EIA, is explained. First, we survey emission sources and carbon sinks. The survey items reflect the target project’s type, scale, land use status, and environmental characteristics, allowing for an appropriate understanding of the GHG emission sources and carbon sinks. Table 4 and Table 5 present the GHG to be calculated by sector. The scope of the investigation is the spatial scope, which is the principle of the project site, and the temporal scope is based on the time of the evaluation report’s preparation. The research method involves collecting and analyzing existing data and similar cases. Currently, survey methods and emission factors are used to set GHG reduction targets or establish reduction plans by the national government, local governments, etc. Public institutions and other organizations also utilize classification systems and investigation methods related to investigating GHG emissions and absorption associated with their respective institutions [14]. The survey results present the findings of the GHG emission sources and carbon sinks in the target area in an easy-to-understand format, such as tables and figures, categorized into the transportation, public/commercial, industrial, residential, waste, agriculture, and LULUCF (Land Use, Land-Use Change and Forestry) sectors.
Table 4.
Target GHGs by sector (Emission sources) [14].
Table 5.
Target GHGs by sector (Carbon sinks) [14].
Second, GHG emissions are calculated. The items consider the characteristics of the business, land use plans, energy usage plans, and other relevant factors. By sector, transportation is categorized as traffic volume, public/commercial as public facilities and commercial facilities, industry as production facilities (factories), households as household energy facilities, waste as waste treatment or waste treatment facilities, agriculture as agricultural land use, and LULUCF as carbon sinks such as parks and green spaces. GHG emissions are calculated with reference to the 2006 IPCC Guidelines for National Greenhouse Gas Inventories (IPCC, 2006), the Guidelines for Local Government Greenhouse Gas Inventories (Ver. 4.1) (Korea Environment Corporation, 2017), and the Evaluation Guidelines for Greenhouse gas items of environmental impact assessment, etc. (Ministry of Environment, 2015) [15,16,17]. Figure 3 presents a summary of the calculation method for GHG emissions. As the number and types of emission factors are extensive, representative examples of fuel-specific emission factors are presented in Table 6.
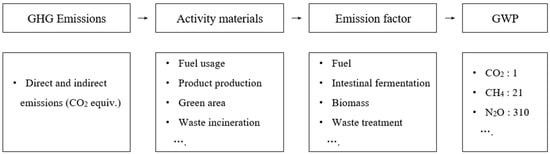
Figure 3.
Calculation method for emissions.
Table 6.
Example of GHG emission factors by fuel types. (Unit: kgGHG/TJ).
The spatial scope is primarily the business area. Suppose there are changes in land use, damage to green spaces, or changes in traffic volume in adjacent areas due to the implementation of the project. In that case, those adjacent areas are also included. The temporal scope is calculated separately for the construction and operational phases.
For the operational phase, the timeline is determined based on the target year for national carbon neutrality or the GHG reduction targets set during the strategic environmental impact assessment. The calculation of GHG emission projections involves selecting emission unit standards for each sector of the GHG inventory, establishing the basis for projecting emissions by GHG inventory sector, and calculating GHG emission projections for the project site in the target year. Next, GHG inventory sector-specific emission projections are calculated using sector-specific GHG emission intensity, project site area, land use plans, and estimated population and number of households. These projections are categorized as current, near future (10–20 years), and beyond (30+ years into the future) [6]. Figure 4 presents the procedure for calculating GHG emission projections. During construction, emissions are primarily generated by the operation of construction equipment. During operation, emissions are categorized into transportation, public/commercial, industrial, residential, waste, agriculture, and LULUCF sectors, considering the land use plan. Emission and absorption sources are established, and energy consumption is determined based on the energy use plan for each sector. When calculating GHG emissions and absorption by sector, national GHG emission factors (sectoral GHG emission and absorption factors) are used. The prediction results are analyzed and organized in conjunction with the findings of the status survey for each GHG inventory. They are presented together with tables and figures.
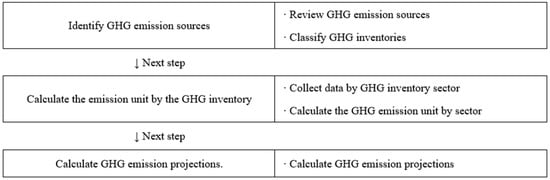
Figure 4.
Procedure for calculating the GHG emission projections.
Third, reduction targets for evaluating GHG emissions should be set. Operational GHG reduction targets should be established to maintain consistency and linkage with national strategies, higher-level plans, and related plans. GHG reduction targets applicable to the project are set and written, comprehensively considering reduction strategies established during the strategic environmental impact assessment phase. Next, to achieve the reduction target, the most effective reduction strategy that the project operator can implement is established, taking into comprehensive consideration (1) the national GHG reduction strategy (2050 carbon neutrality scenario, 2030 NDC, etc.), (2) the local government’s carbon neutrality and climate change response plans and strategies, (3) examples of similar plans and projects, and (4) the extent of damage to existing carbon sinks. The establishment of reduction strategies and measures will be linked to the reduction strategies established in the strategic environmental impact assessment stage to formulate reduction measures. Next, in establishing the countermeasures, we actively reflect the government’s GHG reduction measures, such as carbon neutrality, renewable energy expansion, and increased waste resource recycling. In addition to the reduction strategies expected to be implemented by the national and local governments in the project area, the project operator separately establishes reduction strategies that they will directly and additionally implement. Additionally, based on the prediction and evaluation results for each sector, including energy, industry, transportation, buildings, and waste, specific measures are established to reduce GHG emissions resulting from the implementation of the project. Plans are devised to expand carbon sinks, such as preserving well-vegetated areas in their original state and creating green spaces. We comprehensively review the GHG reduction plan for the project implementation, considering factors such as consistency with GHG reduction-related goals and plans, the appropriateness of setting reduction targets and establishing reduction strategies and measures, and consistency with related goals and plans [18]. Finally, we establish a post-environmental impact survey plan to verify whether the GHG reduction measures developed due to the climate change impact assessment consultation are being implemented appropriately.
3.2.2. Climate Crisis Adaptation Field
This section summarizes how to prepare a climate change impact assessment subject to environmental impact assessment. First, the climate change status section analyzes local governments’ meteorological and climate conditions, which include the areas subject to climate change impact assessment. The climate change outlook section investigates and analyzes the outlook for climate elements, air quality, and extreme climate indices for the relevant local governments (si, gun, gu) and project areas (eup, myeon, dong). The local CCIA investigates disaster and accident cases in local governments and project areas, including the target areas for CCIA [14].
Second, the impacts of climate change are predicted and analyzed. In the context of climate change, “Risk” refers to the potential for adverse outcomes under conditions of uncertainty when certain values are threatened [19]. The IPCC Fifth Assessment Report [20] defines climate risk as a concept that integrates the potential damages arising from climate change and their associated socio-economic impacts. Risk is determined by the interaction of hazard, exposure, and vulnerability, as expressed in Equation (1). Within the scope of predictive analysis, applicable codes of climate factors are presented in Table 7. The spatial scope is the local government in charge of the target area (or the project area if necessary). The temporal scope is set as the present (10–30 years average from the past to the present), the near future (10–20 years), and the distant future (30 years or more).
Risk = f(hazard, exposure, vulnerability)
Table 7.
Code of climate factors.
Next, in the risk analysis and prioritization of managed risks, vulnerability assessments are conducted by citing the VESTAP (Vulnerability Assessment Tool to Build Climate Change Adaptation Plan; climate change vulnerability assessment tool) [20] results from the latest “Detailed Implementation Plan for Climate Change Adaptation Measures” of the relevant local government and the metropolitan government that includes the relevant local government. Climate change impact analysis is then performed using tools like MOTIVE (Model of Integrated Impact and Vulnerability Evaluation of Climate Change; a climate change impact analysis tool) [21]. Additionally, the assessment will comprehensively evaluate the current and projected weather and climate conditions in the target area, the results of investigations into disaster and hazard cases, the results of qualitative impact analysis by climate crisis adaptation factors, the results of vulnerability assessments, and the extent of the impact of future climate change. Using the national climate risk and the preliminary climate risk list of the relevant local government and referring to the probability of occurrence based on a scale of possibility, priority management risks are derived, and the results are presented [6]. Examples of risk assessments that incorporate project linkage and probability of occurrence are shown in Table 8, and a risk analysis checklist is presented in Table 9.
Table 8.
Example of risk assessments that incorporate project linkage and probability of occurrence.
Table 9.
Example of a risk analysis checklist.
Third, the impacts of climate change are assessed, and adaptation measures are developed. When establishing adaptation strategies and plans, we analyze the adaptation measures outlined in the latest “Detailed Implementation Plan for Climate Change Adaptation Measures” of the relevant local government or metropolitan government and record the results. Additionally, the business operator of the relevant project establishes adaptation measures that they can implement and presents the results. Next, we review the consistency and linkage with climate crisis adaptation-related plans, comprehensively consider the appropriateness of the identified risks, the suitability of the adaptation strategy development, and consistency with climate crisis adaptation-related plans, and comprehensively review the climate crisis adaptation measures associated with project implementation [14]. Figure 5 presents the climate risk assessment procedure. Finally, a post-environmental impact survey plan is established to verify whether the climate crisis adaptation measures developed based on the CCIA consultation results are being implemented appropriately.
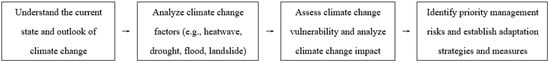
Figure 5.
Climate risk assessment procedure.
3.3. Analysis of CCIAment Review Cases
This study analyzes a review case for the “Gwangmyeong-Siheung Public Housing District Development Project [22],” accounting for the highest proportion of urban development projects, the most common CCIA project in South Korea. The business district is in the southwestern lower part of Seoul, in parts of Gwangmyeong City, Gyeonggi Province (Gwangmyeong-dong, Okgil-dong, Noeunsa-dong, and Gahak-dong), and parts of Siheung City, Gyeonggi Province (Gwarim-dong, Mujinae-dong, and Geumi-dong). The area of the business district is 12,714,465 m2; the population it can accommodate is 167,500; the number of households is 67,000; the developers are Gyeonggi Province, Korea Land & Housing Corporation, and Gyeonggi Housing & Urban Development Corporation; and the approving authority is the Ministry of Land, Infrastructure, and Transport. The basis for the consultation is Article 23 of the Carbon Neutrality Basic Act and Article 15, Paragraph 1 of the Enforcement Decree of the same Act [6]. The general overview map of the project area is shown in Figure 6. Table 10 presents the land use plan (draft).
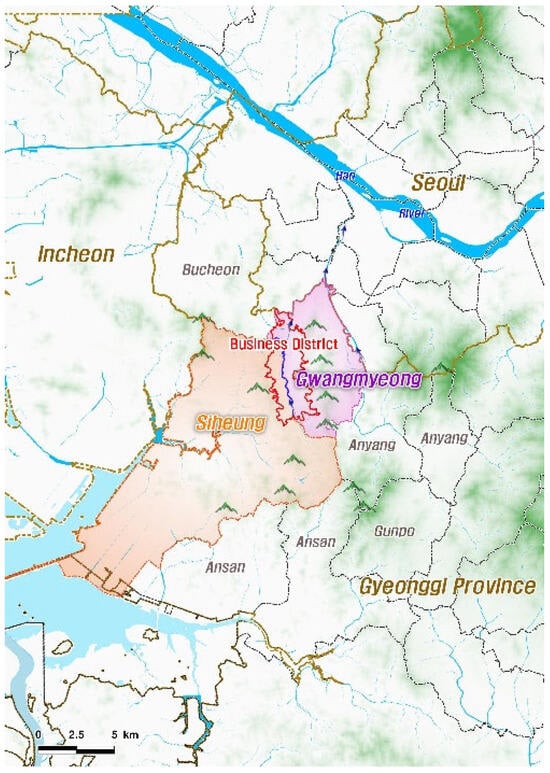
Figure 6.
General overview map of the Project District.
Table 10.
Land use plan (draft) of the project district.
First, the GHG mitigation sector was reviewed. According to the Guidance on Climate Change Impact Assessment Methods [14], GHG emission sources and carbon sinks within the project area should be identified, and the GHG emissions to be calculated for each sector should be accurately documented. The stage (pre-construction, construction, and operation) should also present GHG emission projections. A plan for a district heating facility (combined heat and power plant) within the public facility land in the business site has been proposed. Therefore, the district heating facility’s direct and indirect GHG emissions should be calculated separately. Direct emissions are GHG emissions generated from burning fuel in heat supply facilities, while indirect emissions refer to GHG emissions generated from using the heat supplied by heat supply facilities. When calculating GHG emissions from the waste sector during operation, the operational scope of waste and wastewater treatment facilities (whether waste and sewage are received from outside the project area) should be confirmed, and the GHG emissions from the operation of those facilities should be calculated and presented. The reduction measures proposed during construction and operation include using low-carbon construction equipment, low-carbon materials, environmentally certified products, and introducing energy efficiency improvement facilities. However, a reduction strategy and targets for specific years (e.g., 2030, 2050) must be presented, including content, scale, and method details. Approximately 86.1% of the project area is designated as natural green space, and specific plans should be established to expand carbon sinks within the project area. Furthermore, planting plans should be established when creating green spaces considering the introduced species’ carbon absorption capacity and environmental adaptability.
Next, we reviewed the area of climate crisis adaptation. The existing vulnerability and risk assessment results of the national and local governments (Gwangmyeong city, Siheung city) are cited and presented. However, the project should comprehensively evaluate the current and projected weather and climate conditions in the target area, the results of investigations into disaster and hazard cases, the results of qualitative impact analysis and vulnerability assessment by climate crisis adaptation factors, and the impacts of future climate change to select the risks that require priority management in this project and propose measures to mitigate them [14]. Siheung and Gwangmyeong cities have shown high vulnerability to heatwaves, typhoons, wildfires, landslides, floods, and droughts. Therefore, they should establish climate crisis response strategies based on climate change vulnerability assessments and risk analysis results. The north side of the business site shows high vulnerability of forest roads to landslides, and there are areas with landslide risk levels 1 and 2 in the eastern part of the site. Therefore, appropriate adaptation measures should be established to address the risks of landslides and slope failures on artificial slopes caused by this project, such as reviewing the stability of cut slopes and reducing slope gradients. Additionally, since the risk assessment presented risks related to heatwaves, such as the intensification of the urban heat island effect and heat stress in residential areas, adaptation measures for heatwaves, such as the installation of cooling shelters, the creation of parks, securing wind corridors, and cooling forks, should be proposed.
3.4. Analysis of GHG Observation Data and Their Linkage with CCIA
In this study, we analyzed spatial variations in urban CO2 concentrations using direct measurement data and explored strategies to integrate such observations into GHG emission estimation within the CCIA framework. Figure 7 and Figure 8 show the CO2 concentration measurements recorded from 1 September to 31 October 2021, at the Yongsan Building (representing the urban center) and Seoul National University near Mt. Gwanak (representing the urban background area). An average CO2 concentration of 451.92 ± 15.43 ppm was recorded at Yongsan Building, which was approximately 23.4 ppm higher than the 428.50 ± 10.54 ppm measured at Seoul National University (Figure 7). The urban site also exhibited larger diurnal variations, which could be attributed to increased emissions from mobile sources; however, further analysis (e.g., traffic and meteorological data) is needed to confirm this hypothesis. Similar patterns have been observed in other overseas studies. For example, in Oakland (California), USA, CO2 concentrations in urban areas were higher and showed greater daily variability than those in suburban locations [23]. Similarly, in London, UK, maximum CO2 concentrations in the city center reached 440 ppm, approximately 10 ppm higher than those in suburban areas [24]. These findings suggest that GHG concentrations and their variability within cities differ according to location and emission source density.
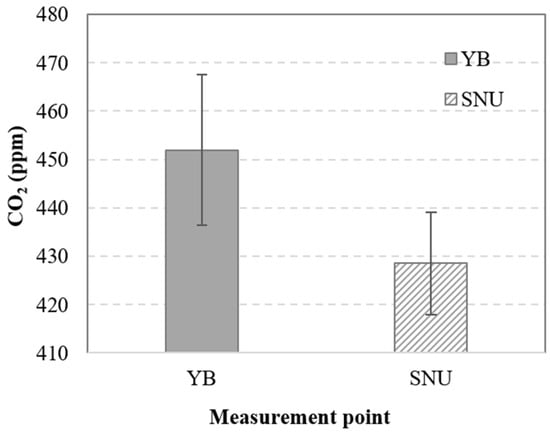
Figure 7.
Analysis of daily average CO2 concentrations. YB, Yongsan Building; SNU, Seoul National University (error bar: standard deviation).
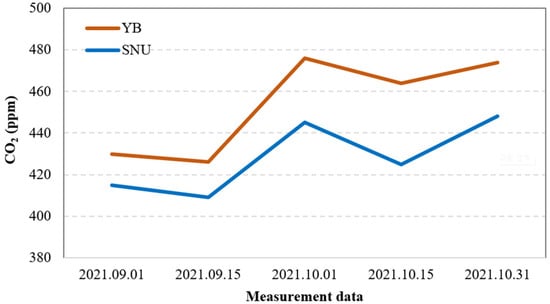
Figure 8.
Time-series trends in daily average CO2 concentrations. YB, Yongsan Building; SNU, Seoul National University.
In current CCIA for urban development projects, identical estimation criteria are commonly applied for both the pre-development (urban background areas) and operational (urbanized areas) stages. However, this approach relies primarily on energy consumption-based estimation methods and has limitations in accurately reflecting actual emission characteristics. Therefore, emissions need to be estimated using observation data obtained from direct measurements that account for spatial characteristics. They may provide foundational data for examining the potential application of locally calibrated correction factors or verification steps in future emission calculation and reduction-target-setting processes.
4. Conclusions
Growing climate risks are expected to intensify global demands for GHG reduction. As the seventh largest energy consumer in the world, Korea has responded to such calls by enacting the Framework Act on Carbon Neutrality and Green Growth for Coping with the Climate Crisis in 2021 and becoming the first country in the world to implement a CCIA system in 2022. In this study, we examined the structure and methodology of this system and analyzed assessment items related to GHG mitigation and climate crisis adaptation through a case study of an urban development project. In the GHG mitigation category, emissions and absorptions must be surveyed at each project stage and reduction targets should be established through quantitative estimation. In the climate crisis adaptation category, regional climate risks should be analyzed and adaptation strategies for priority management areas should be developed.
Furthermore, CO2 measurements in central and background areas of Seoul revealed spatial variations in GHG concentrations, indicating the limitations of current estimation methods that are based solely on energy consumption data. Therefore, emissions should be estimated using observation-based data while applying differentiated criteria that reflect spatial characteristics, and GHG observations should be integrated into the climate change impact assessment system. While the observational analysis serves as a complementary policy reference rather than a direct assessment requirement, it indicates potential long-term opportunities to enhance verification steps and spatial representativeness in GHG estimation. Overall, this study provides foundational insights for the future refinement of Korea’s CCIA system by analyzing its structural characteristics and current implementation practices. Additionally, the effectiveness of CCIA and its consequences for future sustainability can be enhanced by incorporating stakeholder perspectives and linking the system with the existing EIA frameworks to support the development of practical, evidence-based mitigation and adaptation measures. The findings of this study are expected to contribute to improving the accuracy and effectiveness of CCIA and to support climate crisis response efforts across various fields, including urban development.
Author Contributions
Conceptualization, methodology, software, validation, formal analysis, investigation, resources, data curation, writing—original draft preparation, S.J.; writing—review and editing, visualization, supervision, project administration, funding acquisition, J.L. All authors have read and agreed to the published version of the manuscript.
Funding
This wok was supported by a grant from the National Institute of Environmental Research (NIER), funded by the Ministry of Climate, Energy, Environment (MCEE) of the Republic of Korea (ex: NIER-2024-01-01-083).
Data Availability Statement
Restrictions apply to the availability of these data. Data were obtained from Seoul National University and are available from the authors with the permission of Seoul National University.
Acknowledgments
Also, the authors would like to thank Sujong Jeong and his research team at Seoul National University for providing the field measurement data used in this study.
Conflicts of Interest
The authors declare no conflict of interest.
References
- International Energy Agency (IEA). CO2 Emissions in 2023—A New Record High, but Is There Light at the End of the Tunnel? International Energy Agency: Paris, France, 2024. [Google Scholar]
- Intergovernmental Panel on Climate Change (IPCC). Global Warming of 1.5 °C—An IPCC Special Report; Cambridge University Press: Cambridge, UK; New York, NY, USA, 2019. [Google Scholar]
- Intergovernmental Science-Policy Platform on Biodiversity and Ecosystem Services (IPBES). The Global Assessment Report on Biodiversity and Ecosystem Services; IPBES: Bonn, Germany, 2019.
- Ministry of Foreign Affairs (MOFA). Overview of the Adoption of the Paris Agreement; Ministry of Foreign Affairs: Seoul, Republic of Korea, 2025. Available online: https://www.mofa.go.kr/www/wpge/m_20150/contents.do (accessed on 22 November 2025).
- Ministry of Environment (MOE). See Also the Paris Agreement; Ministry of Environment: Sejong, Republic of Korea, 2022. [Google Scholar]
- Ministry of Environment (MOE). Framework Act on Carbon Neutrality and Green Growth to Respond to the Climate Crisis; Ministry of Environment: Sejong, Republic of Korea, 2021. [Google Scholar]
- Ministry of Foreign Affairs (MFA); Ministry of Environment (MOE). Submission of the Increased 2030 Nationally Determined Contribution (NDC) to the UN Framework Convention on Climate Change Secretariat; MFA and MOE Joint Press Release: Seoul, Republic of Korea, 2021. Available online: https://www.mofa.go.kr/www/brd/4080/view.do?seq=371966 (accessed on 28 August 2025).
- Logan, E.M.; John, C.L.; David, R.B.; Diane, E.P.; Courtenay, S.; Andrew, J.S.; Ryan, B.; Susan, E.B.; Britton, B.S.; Daniel, M.; et al. Long-term urban carbon dioxide observations reveal spatial and temporal dynamics related to urban characteristics and growth. Proc. Natl. Acad. Sci. USA 2018, 115, 2912–2917. [Google Scholar]
- Irene, X.-R.; Elsa, D.; Cyrille, V.; Morgan, L.; Christine, L.; Martina, S.; Marc, D.; Frederic, C.; Francois, R.; Olivier, P.; et al. Diurnal, synoptic and seasonal variability of atmospheric CO2 in the Paris megacity area. Atmos. Chem. Phys. 2018, 18, 3335–3362. [Google Scholar]
- Gao, Y.; Lee, X.; Shoudong, L.; Ning, H.; Xiao, W.; Cheng, H.; Cheng, L.; Zhen, Z.; Yichen, Y. Spatiotemporal variability of the near-surface CO2 concentration across an industrial-urban-rural transect, Nanjing, China. Sci. Total Environ. 2018, 631–632, 1192–1200. [Google Scholar] [CrossRef] [PubMed]
- World Meteorological Organization (WMO). GAW Report No. 229: The Global Atmosphere Watch Programme—Guidelines for Greenhouse Gas Measurement Techniques; World Meteorological Organization: Geneva, Switzerland, 2016. [Google Scholar]
- National Institute of Environmental Research (NIER). A Study on Establishment of a Monitoring System for Greenhouse Gases in Urban Area; National Institute of Environmental Research: Incheon, Republic of Korea, 2021. [Google Scholar]
- Park, C.; Jeong, S.; Jeong, S.; Lee, J.; Kim, I.; Lim, C. Assessment of Atmospheric Greenhouse Gas Concentration Equipment Performance. Atmos. Korean Meteorol. Soc. 2023, 33, 549–560. [Google Scholar]
- Ministry of Environment (MOE). Guideline for Climate Change Impact Assessment Methods; Ministry of Environment: Sejong, Republic of Korea, 2023. [Google Scholar]
- IPCC. 2006 IPCC Guidelines for National Greenhouse Gas Inventories; IPCC: Geneva, Switzerland, 2006. [Google Scholar]
- Korea Environment Corporation (KEC). Guidelines for Local Government Greenhouse Gas Inventories (Ver.4.1); Korea Environment Corporation: Incheon, Republic of Korea, 2017. [Google Scholar]
- Ministry of Environment (MOE). Evaluation Guidelines for Greenhouse Gas Items of Environmental Impact Assessment, etc.; Ministry of Environment: Sejong: Republic of Korea, 2015. [Google Scholar]
- Korea Environment Institute (KEI). Climate Change Impact Assessment Guideline Series C. Ver.1.0; Korea Environment Institute: Sejong, Republic of Korea, 2023. [Google Scholar]
- IPCC. Fifth Assessment Report of the IPCC; IPCC: Geneva, Switzerland, 2014. [Google Scholar]
- Oh, K.-Y.; Lee, M.-J.; Jeon, S.-W. Development of the Korean climate change vulnerability assessment tool (VESTAP)—Centered on health vulnerability to heat waves. Sustainability 2017, 9, 1103. [Google Scholar] [CrossRef]
- Korea Environment Institute (KEI); Korea Adaptation Center for Climate Change (KACC). Model of Integrated Impact and Vulnerability Evaluation of Climate Change (MOTIVE); KEI/KACC: Sejong, Korea, 2021. [Google Scholar]
- National Institute of Environment Research (NIER). Environmental Impact Assessment Support System (EIASS). Available online: https://www.eiass.go.kr (accessed on 28 August 2025).
- Alexis, A.S.; Virginia, E.T.; Alexander, J.T.; Catherine, N.; Jinsol, K.; Ronald, C.C. The BErkeley Atmospheric CO2 Observation Network: Initial evaluation. Atmos. Chem. Phys. 2016, 16, 13449–13463. [Google Scholar]
- Alex, B.; Gregoire, B.; Deborah, J.C.; Frederic, C.; David, M.B.; Isabelle, P.; Michel, R.; Jean-Daniel, P.; Philippe, C. Analysis of the potential of near-ground measurements of CO2 and CH4 in London, UK, for the monitoring of city-scale emissions using an atmospheric transport model. Atmos. Chem. Phys. 2016, 16, 6735–6756. [Google Scholar]


Disclaimer/Publisher’s Note: The statements, opinions and data contained in all publications are solely those of the individual author(s) and contributor(s) and not of MDPI and/or the editor(s). MDPI and/or the editor(s) disclaim responsibility for any injury to people or property resulting from any ideas, methods, instructions or products referred to in the content. |
© 2025 by the authors. Licensee MDPI, Basel, Switzerland. This article is an open access article distributed under the terms and conditions of the Creative Commons Attribution (CC BY) license (https://creativecommons.org/licenses/by/4.0/).