Abstract
Ecological stoichiometry offers a powerful framework for linking the elemental composition of ecosystems to their biogeochemical functions. However, whether soil stoichiometry directly controls greenhouse gas (GHG) emission ratios remains largely unexplored. This study provides a case study investigating the link between the soil carbon-to-nitrogen (C:N) mass ratio and the gaseous C:N molar emission ratio in three distinct temperate island-like forests (Larix gmelinii forest, LGF; Betula platyphylla forest, BPF; and a Populus-Betula mixed forest, PBMF) in the Qixing River Wetland. Using the static chamber–gas chromatography method, we measured soil fluxes of CO2, CH4, and N2O throughout the growing season. Our results revealed a strong, significant positive linear relationship (R2 = 0.99, p < 0.001) between the soil C:N ratio and the gaseous C:N emission ratio across all forest types. The LGF, possessing the highest soil C:N ratio, exhibited the highest gaseous C:N emission ratio, driven by substantial CO2 emissions (mean flux of 512.45 mg·m−2·h−1). Furthermore, the Larix gmelinii forest (LGF) exhibited the highest total Global Warming Potential (GWP), primarily driven by its significant CO2 emissions. In contrast, the PBMF was the strongest CH4 sink (−25.82 μg·m−2·h−1) and a N2O emission hotspot (15.24 μg·m−2·h−1), corresponding to its low soil C:N ratio. These findings provide strong evidence that soil elemental stoichiometry is a key driver regulating the functional signature of GHG emissions. This case study highlights the potential of using stoichiometric theory to develop predictive tools for assessing ecosystem sustainability and informing sustainable forest management strategies under climate change.
1. Introduction
Wetland ecosystems play a pivotal role in global carbon and nitrogen biogeochemical cycles, with their soil greenhouse gas (GHG) fluxes representing a significant factor in the dynamics of climate change [1]. The Qixing River Wetland, located in China’s Sanjiang Plain, stands as one of the world’s most extensive freshwater wetland systems and is thus a crucial contributor to these global processes [2]. Given that this region has undergone profound land-use changes in recent decades, the scientific investigation of its remaining natural ecosystems has become both urgent and important [3]. While considerable research has focused on soil GHG emissions in the Sanjiang Plain, these studies have overwhelmingly concentrated on herbaceous marshes, leaving the embedded forest ecosystems largely overlooked. As a result, a notable knowledge gap persists concerning the GHG flux dynamics within the unique “island-like forests” of these wetlands [4,5,6].
The island-like forests are distinct ecosystems that develop on elevated, better-drained mounds within the broader wetland matrix. This unique geomorphology results in an ecological setting starkly different from both the surrounding marshes and contiguous upland forests [5]. Their elevated topography creates a sharp hydrological gradient, fostering well-aerated soils that can potentially function as methane sinks, in sharp contrast to the methanogenic conditions of the adjacent wetlands [1]. Furthermore, the development of a mature forest canopy and a thick litter layer significantly alters soil temperature, moisture, and substrate inputs, all of which suggests that their GHG functional signatures diverge fundamentally from those of non-forested ecosystems.
The theory of ecological stoichiometry offers a lens to understand the balance of chemical elements as they shape ecosystem-level processes. In the context of soil biogeochemistry, the carbon-to-nitrogen (C:N) ratio of soil organic matter is recognized as a key stoichiometric constraint on microbial metabolism, which in turn governs the ecosystem function of nutrient cycling. While some studies in agricultural and grassland systems have connected soil C:N ratios to N2O emissions, it remains largely unclear whether these stoichiometric controls extend to regulate the C:N ratio of the total gaseous emissions (i.e., the ratio of CO2-C to N2O-N fluxes), particularly within complex forest ecosystems. Therefore, exploring this link is crucial to developing a predictive, theory-based understanding of GHG dynamics. Such stoichiometric constraints are expected to regulate key microbial processes including nitrification, denitrification, and methanotrophy, which ultimately shape CO2, N2O, and CH4 fluxes.
Given this context, we designed a case study to test the hypothesis that soil C:N stoichiometry is a primary driver controlling the stoichiometric signature of soil GHG emissions. To achieve this, our study pursued three primary objectives: first, to quantify and compare the seasonal dynamics of soil CO2, CH4, and N2O fluxes from three representative island-like forests—the Larix gmelinii forest (LGF), the Betula platyphylla forest (BPF), and the Populus davidiana–Betula platyphylla mixed forest (PBMF); second, to determine the soil C:N ratio in each forest type and calculate the corresponding gaseous C:N molar emission ratio; and finally, to explicitly test for a relationship between the soil C:N stoichiometry and the gaseous C:N emission ratio, thereby providing foundational data and new theoretical insights for the GHG budget of this critical wetland region.
2. Materials and Methods
2.1. Site Description
This research was conducted within the Qixing River National Nature Reserve, a protected area situated in the hinterland of the Sanjiang Plain (Figure 1). The geographical coordinates of the site range from 46°45′ to 46°55′ N and 132°5′ to 132°26′ E [6]. The region is characterized by a temperate continental monsoon climate, featuring a mean annual temperature of approximately 1.8 °C and mean annual precipitation of about 600 mm. The rainy season, accounting for over 60% of annual rainfall, is concentrated from July to September, and the frost-free period lasts for approximately 120–145 days.
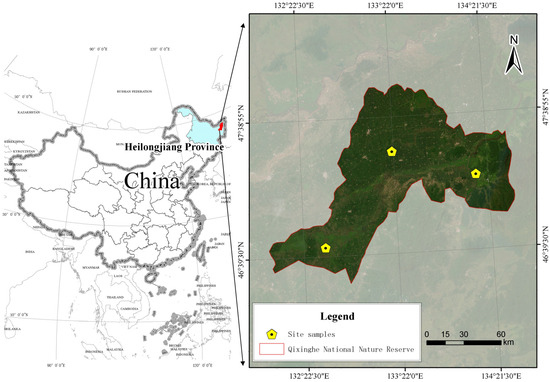
Figure 1.
Geographic location of the study site.
Within the reserve, three typical types of island-like forests are predominantly found [5]: the Larix gmelinii forest (LGF), the Populus davidiana–Betula platyphylla mixed forest (PBMF), and the Betula platyphylla forest (BPF). The specific characteristics of these vegetation communities have been documented in prior studies of the reserve [6]. Topographically, the LGF and PBMF are mainly located on the higher, well-drained central areas of the forest islands. In contrast, the BPF typically occupies the lower, more humid edges, creating a transitional zone to the surrounding marsh. A summary of the community composition and soil properties for these three forest types is provided in Table 1 and Table 2, respectively. In each, a representative 20 m × 20 m plot was established, within which the five sampling points (replicates) were located following a randomized design to minimize the effects of spatial autocorrelation. The soil types were classified according to the World Reference Base for Soil Resources (WRB).

Table 1.
Community composition of the three forest types.
Table 2.
Main soil physicochemical properties of the three forest types.
Main soil physicochemical properties of the three forest types. Values represent observed ranges, with mean values shown in parentheses (n = 5). Soil types were classified according to the World Reference Base for Soil Resources. Significance tests were not included in this table, as differences among forest types are presented in Section 3.
2.2. Gas Sampling and Flux Measurement
Between May and September 2024, the fluxes of CO2, CH4, and N2O from the soils of the three island-like forests were quantified using the static chamber–gas chromatography method [7]. The static chamber method was chosen for its suitability in capturing flux differences across distinct, spatially replicated ecosystem types, which was the primary goal of this study. We acknowledge that the static chamber approach has limitations in capturing fine-scale temporal variability compared with automated chambers or eddy covariance methods; however, it remains a widely used and robust method for comparative ecosystem studies. The sampling apparatus consisted of a stainless-steel top chamber (50 cm × 50 cm × 50 cm) and a corresponding base (50 cm × 50 cm × 20 cm), with the exterior covered in reflective paper. To ensure an airtight seal during gas collection, the top chamber was fitted into a groove on the base, which was then filled with water. The chamber bases were left undisturbed throughout the growing season to minimize any impact on the soil and vegetation. A small internal fan was operated during sampling to prevent gas stratification within the chamber.
For each forest type, five replicate sampling points were randomly established. Gas samples were collected from these points mid-month between 9:00 and 12:00 on days with clear weather, over a continuous 3–5-day period. Gas sampling was conducted.to minimize the influence of large diurnal temperature fluctuations and to capture a flux rate representative of the daily average. Sampling was generally avoided during and immediately after heavy rainfall events to ensure comparability, except where noted for specific CH4 dynamics. Using a 60 mL syringe, four gas samples were collected from each chamber over a 30 min interval (one sample every 10 min) and stored in 100 mL gas bags made of aluminum foil. The samples were kept in a dark, insulated box and transported to the laboratory for analysis within 24 h to ensure sample integrity. The concentrations of CO2, CH4, and N2O in the collected samples were subsequently analyzed using an HP4890 gas chromatograph. Gas flux (F) was estimated by ordinary least squares linear regression of concentration versus time over the 30 min enclosure. Only time series with linear fits (e.g., R2 ≥ 0.95) were retained, and chamber mixing by the internal fan minimized non-linearity over the short deployment. The flux was then calculated as:
where F is the measured gas flux; dc/dt represents the rate of change in gas concentration over time; M is the molar mass of the gas; P and T are the ambient atmospheric pressure and temperature; H is the chamber height; and V0, P0, and T0 are the gas molar volume, atmospheric pressure, and absolute temperature under standard conditions, respectively.
2.3. Soil Sampling and Measurement
Soil parameters were measured concurrently with gas sampling. A portable thermometer (JM624, Jinming Instrument Co., Ltd., Tianjin, China) was used to measure soil temperature (T, °C) at a 10 cm depth. At the same depth, a time-domain reflectometer (TDR-100, Spectrum Technologies, Inc., Aurora, IL, USA) was used to determine the soil volumetric moisture content (V, %). Soil temperature and moisture were measured at a 10 cm depth as this represents a key zone of microbial activity and GHG flux origination, while soil chemical properties were analyzed from the 0–15 cm layer to provide an integrated characterization of the topsoil horizon where the majority of fine roots and organic matter are concentrated. Although deeper soil layers (>15 cm) may also contribute to GHG production and consumption, particularly for CH4, our study focused on the topsoil horizon due to its dominant role in root activity and rapid biogeochemical cycling. Mixed soil samples from the 0–15 cm depth layer were collected from five randomly selected points within each forest type using soil drills for the analysis of chemical properties. In the laboratory, soil samples were air-dried, manually cleared of roots and debris and sieved through a 2 mm mesh before chemical analysis. Soil organic carbon (SOC, g·kg−1) was quantified Via the K2Cr2O7 oxidation method. A C/N analyzer (Vario MAX CN, Elementar, Langenselbold, Germany) was used to measure total nitrogen (TN, g·kg−1). Available nitrogen (AN, g·kg−1) was determined using the alkaline hydrolysis micro-diffusion technique. Soil pH was measured in a 1:5 soil/water supernatant using a pH meter (PHS-3C, Hach Company, Loveland, CO, USA).
2.4. Data Analysis
All data processing and statistical analyses were performed using R (version 4.3.1). Prior to conducting ANOVA, data were tested for normality using the Shapiro–Wilk test and for homogeneity of variances using Levene’s test; variables that did not meet these assumptions were log-transformed where necessary. To identify significant differences in GHG fluxes and soil indicators among the forest types, a one-way analysis of variance (ANOVA) followed by a least significant difference (LSD) test was employed. Although fluxes were measured monthly, each campaign (3–5 consecutive clear days per month) was treated as an independent sampling event; we acknowledge this as a limitation and note that future studies should apply mixed-effect models to explicitly account for repeated measures. The primary differences in soil properties across the forest types were evaluated using principal component analysis (PCA). The Mantel test was specifically employed to assess the correlation between soil property dissimilarity and GHG flux dissimilarity, thereby linking environmental gradients to ecological processes. By testing correlations between distance matrices, the Mantel test provides ecological insights into how similarities (or dissimilarities) in soil stoichiometry and moisture regimes correspond to observed GHG flux patterns. The influence of environmental factors on GHG fluxes was assessed through redundancy analysis (RDA) and Mantel tests. Finally, Pearson correlation analysis and multivariate stepwise linear regression were used to identify the most significant environmental factors affecting GHG fluxes within each of the three forest types.
2.5. Stoichiometric Analysis
To test the hypothesis of stoichiometric control, we calculated the carbon-to-nitrogen (C:N) ratio for both the soil substrate and the gaseous fluxes. The soil C:N ratio was calculated on a mass basis (g C/g N) for each soil sample using the measured soil organic carbon (SOC) and total nitrogen (TN) data. The gaseous C:N molar emission ratio was calculated for each forest type based on the mean fluxes of CO2 and N2O. This ratio was calculated using only CO2-C and N2O-N fluxes because these gases represent the primary aerobic and anaerobic outputs of microbial C and N metabolism, respectively, which are fundamentally linked by microbial C:N stoichiometry. CH4 fluxes, being primarily controlled by the unique balance between methanogenesis and methanotrophy under specific redox conditions, represent a distinct biogeochemical pathway and were thus analyzed separately. First, the mass fluxes of CO2 (mg·m−2·h−1) and N2O (μg·m−2·h−1) were converted to molar fluxes of C and N (mol·m−2·h−1), respectively, using their molar masses (C: 12.01 g·mol−1; N: 14.01 g·mol−1; CO2: 44.01 g·mol−1; N2O: 44.02 g·mol−1). The final gaseous C:N molar ratio was then calculated as the molar flux of C divided by the molar flux of N.
2.6. Global Warming Potential (GWP) Calculation
To evaluate the net climatic impact of each forest type, the cumulative emissions over the growing season (May–September) were converted to a total global warming potential (GWP) on a 100-year timescale. The GWP was calculated using the following equation, with coefficients of 25 for CH4 and 298 for N2O relative to CO2:
GWP (kg CO2-eq·ha−1) = (Cumulative CO2 flux kg·ha−1) +
(Cumulative CH4 flux kg·ha−1 × 25) + (Cumulative N2O flux kg·ha−1 × 298)
(Cumulative CH4 flux kg·ha−1 × 25) + (Cumulative N2O flux kg·ha−1 × 298)
3. Results and Analysis
3.1. Characteristics of CO2, CH4, and N2O Fluxes
Throughout the growing season (May to September), soils across all three forest types—LGF, PBMF, and BPF—were consistent sources of CO2 emissions. Mean emission rates were recorded at 512.45, 445.88, and 360.21 mg·m−2·h−1 for LGF, PBMF, and BPF, respectively. Notably, CO2 emission from the Larix gmelinii forest (LGF) was significantly greater than that from the other two sites (p < 0.05). All three forest types exhibited a similar seasonal pattern in CO2 dynamics, with fluxes reaching their maximum in July (Figure 2).
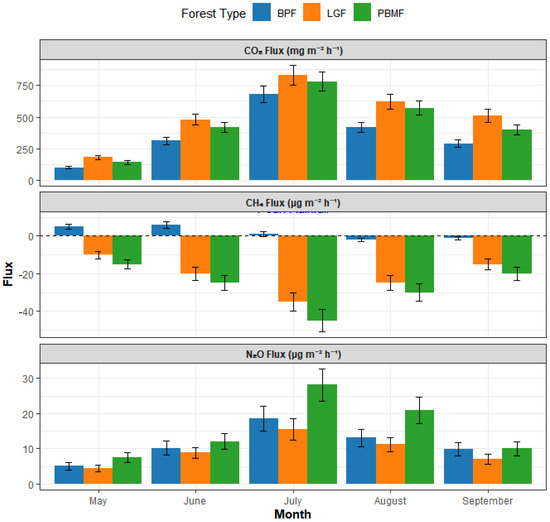
Figure 2.
Seasonal dynamics of soil greenhouse gas fluxes across three island-like forests in the Sanjiang Plain from May to September 2024. Colors denote forest types: BPF = Betula platyphylla forest (green), LGF = Larix gmelinii forest (orange), PBMF = Populus davidiana–Betula platyphylla mixed forest (blue). Bars show monthly means based on mid-month campaigns (3–5 consecutive clear days, 09:00–12:00); error bars indicate ±SE (n = 5 plots per forest type). Positive values represent net emission to the atmosphere and negative values denote uptake (for CH4, negative indicates a sink).
Regarding atmospheric CH4, all three forest soils functioned as net sinks over the growing season. The mean flux values were −18.54 (LGF), −25.82 (PBMF), and −1.55 μg·m−2·h−1 (BPF). The most potent sink for atmospheric CH4 was observed in the Populus davidiana–Betula platyphylla mixed forest (PBMF). In stark contrast, the Betula platyphylla forest (BPF) demonstrated the lowest absorption capacity and, notably, became a transient CH4 source following peak rainfall events in July, a unique behavior that distinguished it significantly from the other two consistently CH4-absorbing forest types (p < 0.01) (Figure 2).
For N2O, all three sites were net emission sources. The average fluxes were 8.95, 15.24, and 11.05 μg·m−2·h−1 for LGF, PBMF, and BPF, respectively. The N2O flux from PBMF was significantly higher than the other forest types (p < 0.05). A consistent seasonal trend was also observed for N2O, with all three forest types showing a clear emission peak in July (Figure 2).
3.2. PCA of Soil Properties
To elucidate the primary differences in soil characteristics among the forest types, a principal component analysis (PCA) was performed. The first two principal components (PC1 and PC2) collectively accounted for 73.5% of the total variance in the soil data (Figure 3). The variation along PC1, which explained 45.2% of the variance, was predominantly driven by soil organic carbon (SOC) and pH. Meanwhile, PC2 accounted for an additional 28.3% of the variance and was mainly influenced by available nitrogen (AN) and total nitrogen (TN). The PCA ordination plot demonstrated a distinct separation of the forest types, reflecting their underlying ecological characteristics. The LGF samples grouped separately along the PC1 axis, a pattern attributed to this coniferous forest’s unique combination of high SOC accumulation from recalcitrant litter and lower soil pH. In contrast, the PBMF and BPF samples were more influenced by the PC2 axis, indicating their higher soil nutrient status (AN, TN).
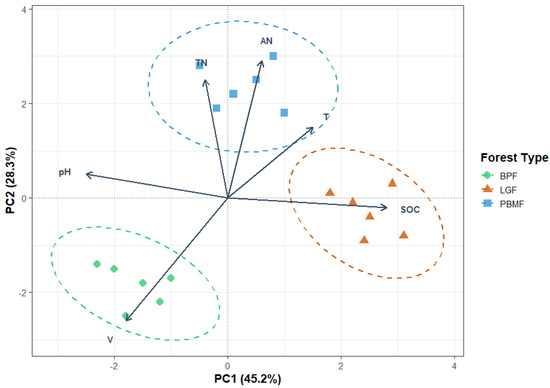
Figure 3.
Principal Component Analysis (PCA) of standardized soil properties across island-like forests (BPF, LGF, PBMF). Points are plot-level observations (n = 5 per forest type) with dashed 95% confidence ellipses around group centroids. Arrows denote variable loadings (SOC, TN, AN, pH, volumetric water content V, soil temperature T); arrow length approximates contribution to the ordination and angles approximate correlations among variables. Axes are labeled with the proportion of variance explained (PC1 = 45.2%, PC2 = 28.3%). Scaling = 2 (correlation biplot). Group separation indicates that soil stoichiometry (SOC, C:N, N availability) together with moisture and temperature structure the environmental space occupied by the three forest types (LGF aligned with SOC; PBMF with T/TN/AN; BPF with higher V and pH).
3.3. RDA of Soil Properties and Greenhouse Gas Flux
The relationships between the measured soil properties and GHG fluxes were explored Via redundancy analysis (RDA), as visualized in Figure 4. The initial two axes of the RDA model successfully explained a cumulative 65.5% of the total variance observed in the GHG flux data. Among the environmental variables, soil temperature (T) and available nitrogen (AN) emerged as the most significant drivers with positive impacts on CO2 and N2O fluxes, respectively. Soil moisture (V) and pH were identified as key explanatory factors for CH4 fluxes, while SOC was strongly associated with the LGF samples.
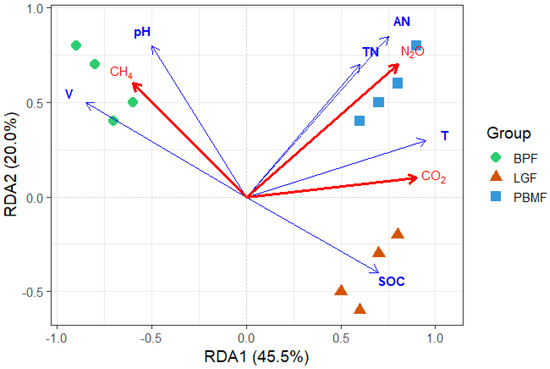
Figure 4.
Redundancy Analysis (RDA) triplot relating greenhouse gas fluxes (red arrows: CO2, CH4, N2O) to soil properties (blue arrows: SOC, TN, AN, pH, volumetric water content V, soil temperature T). Points are plots colored by forest type (BPF, LGF, PBMF). Arrow length indicates the strength of association with the canonical axes; the angle between arrows approximates correlation. Axes show the percentage of constrained variance explained (RDA1 = 45.5%, RDA2 = 20.0%). CO2 aligns with temperature (T), N2O aligns with nitrogen availability (TN/AN), whereas CH4 opposes T and TN/AN and aligns with V/pH, consistent with transient CH4 emissions under wetter conditions in BPF. Overall model and axis significance were assessed by permutation tests (reported in the text).
3.4. Correlation Analysis and Linear Fitting
To dissect the drivers specific to each ecosystem, Pearson correlation analysis was conducted, with the resulting key relationships visualized for each forest type in Figure 5. Furthermore, these relationships were quantified using multivariate stepwise linear regression models, presented in Table 3. A universally significant positive correlation with soil temperature (T) was confirmed for both CO2 and N2O fluxes across all forest types. Beyond this general trend, distinct primary drivers were identified for each ecosystem. In the case of LGF, CO2 emissions were also strongly correlated with SOC (r = 0.78), whereas CH4 uptake showed significant correlations with both T (r = −0.75) and pH (r = 0.71) (Figure 5). For the PBMF, N2O emissions were most powerfully driven by AN (r = 0.91) and TN (r = 0.88) (Figure 5). In the BPF, soil moisture (V) was identified as the core factor positively correlated with CH4 flux (r = 0.78), which explains this ecosystem’s tendency to become a source in wetter conditions (Figure 5).
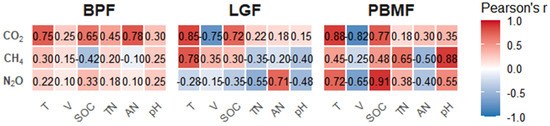
Figure 5.
Relationship between environmental dissimilarity and greenhouse gas (GHG) flux dissimilarity among three island-like forests in the Sanjiang Plain. Each point represents a pairwise comparison between plots (n = 5 plots per forest type). The Mantel test (r = 0.68, p < 0.001) indicates a strong correlation, with the red line showing the fitted regression and shaded area denoting the 95% confidence interval.
Table 3.
Multiple linear regression models for GHG fluxes and environmental factors.
3.5. Mantel Test: Overall Relationship Between Environment and GHG Fluxes
A Mantel test was employed to assess the holistic relationship between the complete environmental matrix (encompassing all soil physicochemical properties) and the GHG flux matrix (all three gases). This analysis revealed a highly significant positive correlation between the two matrices (Mantel r = 0.68, p < 0.001), as depicted in Figure 6. This result provides robust statistical confirmation for the overarching hypothesis that the environment is a primary driver of GHG emission patterns, indicating that greater dissimilarity in the overall “environmental fingerprint” between any two sites corresponds to greater dissimilarity in their “GHG functional fingerprint”.
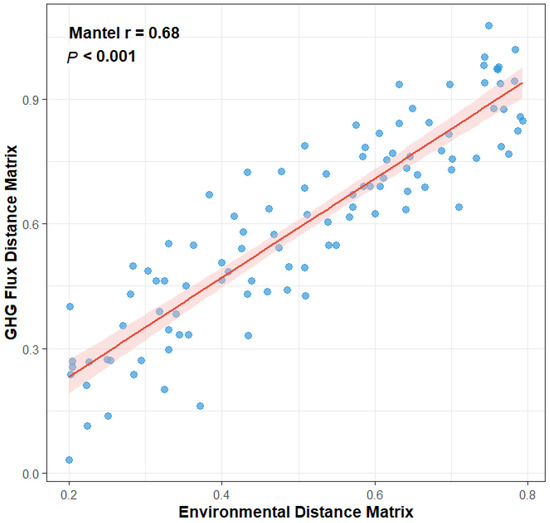
Figure 6.
Linear relationship between soil C:N ratio (mass basis) and the gaseous C:N molar emission ratio (CO2-C/N2O-N) across the three forest types Data points represent mean values ± SE (n = 5 plots per forest type). The regression equation, coefficient of determination (R2 = 0.99), and significance level (p < 0.001) are shown.
3.6. Greenhouse Gas Emissions and Global Warming Potential (GWP)
To evaluate the net climatic impact of each forest type, the cumulative emissions over the growing season were converted to a total global warming potential (GWP). The total GWP for the three forest types was calculated to be 18,527.2, 16,192.8, and 13,085.3 kg CO2-eq·ha−1 for LGF, PBMF, and BPF, respectively. The LGF exhibited the highest overall GWP, a result of its substantial CO2 emissions. Across all forest types, CO2 was the predominant contributor to the total GWP, accounting for over 99% of the climatic impact.
3.7. Stoichiometric Controls on GHG Emissions
The soil C:N ratio varied significantly among the three forest types, with the LGF exhibiting a significantly higher C:N ratio (14.1 ± 0.44) compared to the BPF (9.0 ± 0.51) and PBMF (8.9 ± 0.45). Correspondingly, the molar ratio of gaseous C to N emissions was also highest in the LGF (1297.8) and lowest in the PBMF (664.1). A linear regression analysis across all samples revealed a strong, significant positive relationship between the soil C:N ratio and the gaseous C:N emission ratio (Figure 7). The soil C:N ratio alone explained 99% of the variation in the gaseous C:N emission ratio (R2 = 0.99, p < 0.001), providing strong support for the hypothesis that soil stoichiometry is a key driver of the elemental composition of GHG emissions. Because the gaseous C:N ratio was computed at the forest-type level (n = 3), this regression should be interpreted as descriptive; the high R2 likely reflects small sample size, clear between-type separation, and collinearity among soil variables.
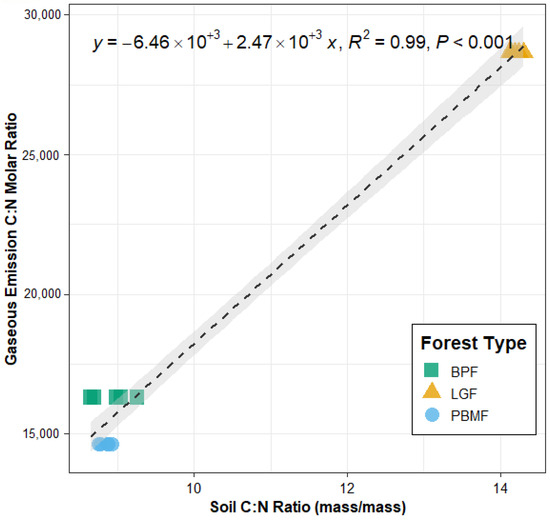
Figure 7.
Pearson correlation coefficients (r) between greenhouse gas fluxes (CO2, CH4, N2O) and soil/environmental variables for each forest type (BPF, LGF, PBMF). Values in boxes indicate correlation coefficients based on n = 5 plots per forest type.
4. Discussion
A central goal in ecosystem science is to identify fundamental principles that govern the flow of energy and materials. Our research provides strong evidence that ecological stoichiometry, a theory that links the elemental composition of resources to ecological processes, is a key predictor of a critical ecosystem function: soil greenhouse gas emissions. The central finding of this study is the strong, positive linear relationship between the soil C:N ratio and the molar ratio of gaseous C:N emissions (Figure 6). This suggests that the stoichiometric signature of the soil substrate directly controls the stoichiometric signature of biogeochemical fluxes to the atmosphere. To our knowledge, this is one of the first studies to explicitly extend the principles of ecological stoichiometry from the realm of biomass and nutrient cycling to the regulation of greenhouse gas emission ratios in forest ecosystems. Beyond their theoretical significance, our findings also have practical applications. Understanding how soil stoichiometry regulates GHG fluxes can inform land management strategies by identifying forest types with higher potential for carbon sequestration and lower non-CO2 emissions. Moreover, integrating stoichiometric controls into ecosystem and Earth system models may improve predictions of regional GHG budgets, providing valuable guidance for climate change mitigation policies.
The observed differences in soil C:N ratio among the three forest types are the foundational drivers of this pattern. The Larix gmelinii forest (LGF) exhibited the highest soil C:N ratio, a finding consistent with the known characteristics of coniferous forests, which produce poor-quality litter (e.g., high C:N and lignin content) that decomposes slowly and leads to the accumulation of carbon-rich organic matter [7,8,9,10]. In contrast, the broadleaf-dominated PBMFs and BPFs have more nutrient-rich litter, resulting in soil organic matter with a lower C:N ratio.
This difference in substrate stoichiometry appears to impose a direct constraint on the net activities of the microbial communities responsible for GHG fluxes. Based on the principles of microbial stoichiometry, microbes must maintain a relatively stable internal elemental balance. Therefore, when faced with high C:N substrates like in the LGF, microbial growth becomes nitrogen-limited. This leads to two consequences: first, microbes respire the excess carbon as CO2, leading to high carbon loss; second, nitrogen-cycling processes like nitrification and denitrification, which produce N2O, are constrained by low nitrogen availability. This results in a high C:N emission ratio. Conversely, in the low C:N soils of the PBMF, nitrogen is more readily available, which can stimulate N-cycling microbial guilds [10,11,12], leading to proportionally higher N2O fluxes relative to CO2 fluxes and thus a lower gaseous C:N ratio.
While soil stoichiometry sets the baseline for the relative C and N fluxes, our results also confirm that other factors act as universal rate-limiters controlling the overall magnitude of these fluxes. Soil temperature, for instance, was a universally significant driver of the seasonal dynamics for both CO2 and N2O (Table 3), reaffirming its role as the primary climatic regulator of soil microbial activity in this region [2,9,13]. Soil temperature, while widely recognized as a universal driver of GHG fluxes, may also interact with stoichiometric controls. Higher temperatures accelerate decomposition and nutrient mineralization, thereby amplifying nitrogen limitation in high C:N soils and potentially enhancing N2O fluxes. Conversely, in low C:N soils, warming may increase CO2 release by stimulating microbial carbon use efficiency. These interactions suggest that climate warming could alter the relative importance of stoichiometric constraints in controlling forest GHG dynamics. The dynamics of CH4, which are not directly part of the C:N stoichiometric relationship, were governed by different factors. The strong CH4 uptake in the well-drained PBMF and LGF soils is consistent with oxic conditions that favor methanotrophic activity [12]. The observed CH4 uptake rates are comparable to those reported in other well-drained temperate and boreal forest soils globally, confirming their role as important sinks for atmospheric methane. In contrast, the BPF’s tendency to become a CH4 source was clearly linked to high soil moisture creating anaerobic microsites [13,14]. The consistently negative CH4 fluxes observed in LGF and PBMF reflect the oxic soil conditions typical of well-drained forest sites. Under such conditions, methanotrophic bacteria dominate over methanogens, leading to a net uptake of atmospheric CH4. This pattern is consistent with global findings from other temperate and boreal upland forests, which generally function as net CH4 sinks. Our results therefore confirm the broader role of forested ecosystems with well-aerated soils in mitigating atmospheric CH4 concentrations, while also highlighting the contrasting dynamics in BPF, where episodic rainfall events can temporarily disrupt this balance.
4.1. Implications for Sustainable Management and Climate Change
The stoichiometric framework developed in this study has significant practical applications for sustainable forest management and climate change mitigation. Our findings suggest that the soil C:N ratio can serve as a simple, integrative indicator for predicting the functional GHG signature of an ecosystem. For instance, land-use changes common in the Sanjiang Plain, such as the afforestation of drained wetlands, could lead to different climate feedback depending on the tree species chosen. Planting coniferous species like Larix on organic-rich soils may result in a high long-term GWP due to sustained CO2 emissions, whereas managing for mixed broadleaf forests could maintain a better balance. Furthermore, the interaction between stoichiometry and climate change is a critical area for future research. Rising temperatures are expected to accelerate microbial metabolism [15,16], but our results imply that the outcome of this acceleration on the net GHG balance will be stoichiometrically constrained. In N-limited, high C:N systems, warming may primarily boost CO2 emissions, while in N-rich, low C:N systems, it could disproportionately increase N2O emissions, a much more potent greenhouse gas [17,18,19]. Microbial adaptation to stoichiometric imbalance has been discussed in depth by Mooshammer et al., who highlighted mechanisms such as adjustments in enzyme production, biomass composition, and element use efficiencies under variable resource C:N. We build on that framework by linking these processes with field-measured GHG flux ratios [20].
4.2. Limitations and Future Research Directions
The primary limitation of this case study is the absence of direct microbial measurements; consequently, our proposed link between soil stoichiometry and microbial metabolism remains hypothetical. Future research should explicitly validate this link using specific microbial analyses, such as quantifying the abundance of functional genes for nitrification and denitrification (e.g., amoA, nirK, nosZ) Via qPCR, or through metagenomic sequencing and enzyme activity assays [20]. Furthermore, while we focused on C and N, a more complete stoichiometric analysis including phosphoRecent work by Roothansrus (P) could provide deeper insights, as P is often a co-limiting nutrient in terrestrial ecosystems [21,22,23,24]. Recent work by Roothans et al. showed that heterotrophic denitrification under oxic conditions can be a non-negligible source of N2O in microbiomes undergoing frequent redox transitions, a finding that underscores the complexity of N2O pathways in variable moisture environments and supports our interpretation of nitrogen flux responses [25]. This study is also based on data from a single growing season; long-term monitoring is essential to verify if the observed stoichiometric controls are consistent across years with varying climatic conditions (e.g., drought, heavy rainfall). Finally, the inherent spatial heterogeneity of soils [24,26] and the acknowledged limitations of the static chamber method [27,28] present challenges for upscaling. Integrating our stoichiometric framework into process-based biogeochemical models could be a promising approach to improve regional GHG budget estimations [29,30,31].
5. Conclusions
This study demonstrates that soil C:N stoichiometry can serve as a straightforward yet integrative indicator for predicting the C:N ratio of greenhouse gas emissions (CO2-C vs. N2O-N) in the island-like forests of the Sanjiang Plain. In the LGF and PBMF, CH4 fluxes remained consistently negative, indicating strong sink functions under oxic soil conditions; by contrast, the BPF exhibited transient CH4 emissions during peak rainfall events, highlighting the high sensitivity of methane exchange to short-term hydrological fluctuations. Taken together, these findings reveal that stoichiometric controls and event-scale hydrology jointly act as complementary determinants of forest GHG dynamics.
Beyond their theoretical implications, the results also carry practical significance. Understanding how soil C:N constrains emission ratios can inform forest management and conservation by identifying stands with higher carbon retention and lower non-CO2 emissions, thereby guiding afforestation or restoration strategies and prioritizing the protection of island-like forests with favorable stoichiometric profiles. Furthermore, integrating stoichiometric constraints into ecosystem and Earth system models can enhance the accuracy of regional GHG budgets, as such constraints can serve as prior parameters that, when combined with temperature and soil moisture scalars, better capture variations in emission ratios.
It is worth noting that land-use changes in the Sanjiang Plain—such as drainage, conversion, or shifts in tree species composition—may alter litter quality, rooting patterns, and soil moisture regimes, which in turn modify soil C:N stoichiometry and trigger cascading effects on CO2, N2O, and CH4 fluxes. Incorporating scenario analyses that vary soil C:N and hydrology within process-based models could therefore provide valuable insights into the climatic consequences of ongoing and anticipated land-use transitions.
Finally, this study emphasizes the importance of long-term monitoring across both wet and dry years, with higher-frequency sampling during rainfall events, to test the temporal stability of the stoichiometric controls identified here and to capture short-lived CH4 dynamics. Future research should pair flux observations with microbial indicators—such as the abundance and activity of functional genes, metagenomic approaches, and extracellular enzyme assays—to mechanistically validate the linkage between soil stoichiometry and gas emissions, and to expand the framework toward multi-element stoichiometry, including phosphorus.
Author Contributions
Conceptualization, N.X. and S.Y.; methodology, N.X.; formal analysis, J.D. and Y.W.; resources, S.Y.; writing—original draft, N.X. and S.Y.; writing—review and editing, B.D., N.X. and S.Y. All authors have read and agreed to the published version of the manuscript.
Funding
This research was supported by the Heilongjiang Province Natural Science Foundation (LH2022C053), Natural Science Foundation of Heilongjiang Province of China (No. YQ2022C027); Harbin University Young Doctor Scientific Research Foundation (No. HUDF2024205); Harbin University Special Fund for Rural Revitalization Doctoral Scientific Research (HXC2023003); the National Natural Science Foundation of China (31500323; 32101396), the Heilongjiang Province postdoctoral research start-up Foundation project (2022106).
Data Availability Statement
The original contributions presented in the study are included in the article, further inquiries can be directed to the corresponding author.
Conflicts of Interest
The authors declare no conflicts of interest.
References
- Singh, B.K.; Bardgett, R.D.; Smith, P.; Reay, D.S. Microorganisms and climate change: Terrestrial feedbacks and mitigation options. Nat. Rev. Microbiol. 2010, 8, 779–790. [Google Scholar] [CrossRef] [PubMed]
- Song, C.; Sun, L.; Huang, Y.; Wang, Y.; Wan, Z. Carbon exchange in a freshwater marsh in the Sanjiang Plain, northeastern China. Agric. For. Meteorol. 2011, 151, 1131–1138. [Google Scholar] [CrossRef]
- Liu, J.; Kuang, W.; Zhang, Z.; Xu, X.; Qin, Y.; Ning, J.; Zhou, W.; Zhang, S.; Li, R.; Yan, C.; et al. Spatiotemporal characteristics, patterns, and causes of land-use changes in China since the late 1980s. J. Geogr. Sci. 2014, 24, 195–210. [Google Scholar] [CrossRef]
- Liu, X.; Zhang, Y.; Han, W.; Tang, A.; Shen, J.; Cui, Z.; Vitousek, P.; Erisman, J.W.; Goulding, K.; Christie, P.; et al. Enhanced nitrogen deposition over China. Nature 2013, 494, 459–462. [Google Scholar] [CrossRef]
- Zhang, L.; Xing, F.; Yu, L.L.; Xu, K.; Sun, Z.L.; La, X.G. Plant species diversity of the island forest in a marsh in the Sanjiang Plain, China. J. Plant Ecol. 2008, 32, 582–590. [Google Scholar]
- Wang, J.; Liu, H.; Wang, X.; Zhang, L.; Wang, X.; Zhang, H. Vegetation and environmental interpretation of the Qixing River National Nature Reserve wetland in Heilongjiang Province. Wetl. Sci. 2018, 16, 481–487. [Google Scholar]
- Pumpanen, J.; Kolari, P.; Ilvesniemi, H.; Minkkinen, K.; Vesala, T.; Niinisto, S.; Lohila, A.; Larmola, T.; Morero, M.; Pihlatie, M.; et al. Comparison of different chamber techniques for measuring soil CO2 efflux. Agric. For. Meteorol. 2004, 123, 159–176. [Google Scholar] [CrossRef]
- IPCC. Climate Change 2013: The Physical Science Basis. Contribution of Working Group I to the Fifth Assessment Report of the Intergovernmental Panel on Climate Change; Cambridge University Press: Cambridge, UK, 2013. [Google Scholar]
- Yan, W.; Zhong, Y.; Yang, J.; Shangguan, Z.; Torn, M.S. Response of soil greenhouse gas fluxes to warming: A global meta-analysis of field studies. Geoderma 2022, 419, 115865. [Google Scholar] [CrossRef]
- Manzoni, S.; Trofymow, J.A.; Jackson, R.B.; Porporato, A. Stoichiometric controls on carbon, nitrogen, and phos-phorus dynamics in decomposing litter. Ecol. Monogr. 2010, 80, 89–106. [Google Scholar] [CrossRef]
- Zhou, Y.; Boutton, T.W.; Wu, X.B.; Liu, S.; Hu, G. Soil carbon and nitrogen dynamics along a natural grass-land-to-forest successional gradient in southern China. For. Ecol. Manag. 2019, 437, 86–95. [Google Scholar] [CrossRef]
- Lladó, S.; Větrovský, T.; Baldrian, P. Tracking of the activity of individual bacteria in temperate forest soils shows guild-specific responses to seasonality. Soil Biol. Biochem. 2019, 135, 275–282. [Google Scholar] [CrossRef]
- Xu, M.; Qi, Y. Soil-surface CO2 efflux and its spatial and temporal variations in a young ponderosa pine plantation in northern California. Glob. Change Biol. 2001, 7, 667–677. [Google Scholar] [CrossRef]
- Le Mer, J.; Roger, P. Production, oxidation, emission and consumption of methane by soils: A review. Eur. J. Soil Biol. 2001, 37, 25–50. [Google Scholar] [CrossRef]
- Köster, K.; Aurela, M.; Laurila, T.; Tuovinen, J.-P.; Lohila, A. Methane exchange in a drained and forested peatland: An analysis of the net ecosystem balance. Biogeosciences 2011, 8, 2625–2639. [Google Scholar]
- Lai, D.Y.F. Methane dynamics in northern peatlands: A review. Pedosphere 2009, 19, 409–421. [Google Scholar] [CrossRef]
- Bodelier, P.L.; Laanbroek, H.J. Nitrogen as a regulatory factor of methane oxidation in soils and sediments. FEMS Microbiol. Ecol. 2004, 47, 265–277. [Google Scholar] [CrossRef]
- Butterbach-Bahl, K.; Baggs, E.M.; Dannenmann, M.; Kiese, R.; Zechmeister-Boltenstern, S. Nitrous oxide emissions from soils: How well do we understand the processes and their controls? Philos. Trans. R. Soc. Lond. B Biol. Sci. 2013, 368, 20130122. [Google Scholar] [CrossRef] [PubMed]
- Shcherbak, I.; Millar, N.; Robertson, G.P. Global metaanalysis of the nonlinear response of soil N2O emissions to fertilizer nitrogen. Proc. Natl. Acad. Sci. USA 2014, 111, 9199–9204. [Google Scholar] [CrossRef] [PubMed]
- Mooshammer, M.; Wanek, W.; Zechmeister-Boltenstern, S.; Richter, A. Stoichiometric imbalances between terrestrial decomposer communities and their resources: Mechanisms and implications of microbial adaptations to their resources. Front. Microbiol. 2014, 5, 22. [Google Scholar] [CrossRef] [PubMed]
- Levy-Booth, D.J.; Prescott, C.E.; Grayston, S.J. Microbial functional genes involved in nitrogen fixation, nitrification and denitrification in forest ecosystems. Soil Biol. Biochem. 2014, 75, 11–25. [Google Scholar] [CrossRef]
- Philippot, L.; Spor, A.; Hénault, C.; Bru, D.; Bizouard, F.; Jones, C.M.; Sarr, A.; Maron, P.A. Loss in microbial diversity affects nitrogen cycling in soil. ISME J. 2013, 7, 1609–1619. [Google Scholar] [CrossRef]
- Cleveland, C.C.; Liptzin, D. C:N:P stoichiometry in soil: Is there a “Redfield ratio” for the microbial biomass? Biogeochemistry 2007, 85, 235–252. [Google Scholar] [CrossRef]
- Zhou, Z.; Wang, C.; Luo, Y. Meta-analysis of the impacts of global change factors on soil microbial diversity and functionality. Nat. Commun. 2020, 11, 3072. [Google Scholar] [CrossRef]
- Roothans, N.; Gabriëls, M.; Abeel, T.; Pabst, M.; van Loosdrecht, M.C.M.; Laureni, M. Aerobic denitrification as an N2O source from microbial communities. ISME J. 2024, 18, wrae116. [Google Scholar] [CrossRef] [PubMed]
- Melillo, J.M.; Frey, S.D.; DeAngelis, K.M.; Werner, W.J.; Bernard, M.J.; Bowles, F.P.; Pold, G.; Knorr, M.A.; Grandy, A.S. Long-term pattern and magnitude of soil carbon feedback to the climate system in a warming world. Science 2017, 358, 101–105. [Google Scholar] [CrossRef]
- Knief, C. Diversity and habitat preferences of methanotrophic bacteria. Environ. Microbiol. Rep. 2015, 7, 169–183. [Google Scholar]
- R Core Team. R: A Language and Environment for Statistical Computing; R Foundation for Statistical Computing: Vienna, Austria, 2023. [Google Scholar]
- Legendre, P.; Gallagher, E.D. Ecologically meaningful transformations for ordination of species data. Oecologia 2001, 129, 271–280. [Google Scholar] [CrossRef] [PubMed]
- Sterner, R.W.; Elser, J.J. Ecological Stoichiometry: The Biology of Elements from Molecules to the Biosphere; Princeton University Press: Princeton, NJ, USA, 2002. [Google Scholar]
- Dutaur, L.; Verchot, L.V. A global inventory of the soil CH4 sink. Glob. Biogeochem. Cycles 2007, 21, GB4013. [Google Scholar] [CrossRef]


Disclaimer/Publisher’s Note: The statements, opinions and data contained in all publications are solely those of the individual author(s) and contributor(s) and not of MDPI and/or the editor(s). MDPI and/or the editor(s) disclaim responsibility for any injury to people or property resulting from any ideas, methods, instructions or products referred to in the content. |
© 2025 by the authors. Licensee MDPI, Basel, Switzerland. This article is an open access article distributed under the terms and conditions of the Creative Commons Attribution (CC BY) license (https://creativecommons.org/licenses/by/4.0/).