Abstract
Data quality is known as the fitting degree of data content and formats to functions and it plays a crucial role in firms’ digital transformation. This study focuses on Industry 5.0, draws on Deming’s Profound Knowledge System on quality, and identifies four key influencing factors on data quality that align with Industry 5.0 concepts, i.e., data variation, employee resilience, system integration, and digital variation knowledge management. A structural model among these factors was established to support the digital transformation. An empirical study with a 301-participant questionnaire survey was adopted to test the model using SEM. The results show the following: (1) employee resilience and system integration each exert a positive effect on data variation and digital variation knowledge management; (2) data variation and digital variation knowledge management both positively affect digital transformation; and (3) employee resilience mediates system integration’s effects on data variation and digital variation knowledge management. Based on the results, this paper proposes a novel approach to enhancing data quality in digital transformation with a sustainable view: (1) employee resilience and system integration should be bundled, and emphasis should be put on the mediating role of employee resilience, forming a resilient firm capability and (2) digital variation knowledge management safeguards data variation, can prevent and respond to data quality variation risks, and helps firms form a better decision-making capacity. The proposed model can convert resource identification into capabilities generation and then to value creation with the resource orchestration view. It can help firms achieve more sustainable development during digital transformation.
1. Introduction
Quality has often been known as product quality, service quality, or engineering quality. For example, in 2023, China mapped out an outline to boost its quality strength and set the quality development targets in the above three types [1]. Since Industry 4.0 was proposed [2], digital transformation has become an important industry strategy. Data has also become a new asset in economics besides money, land, technology, etc. With the advancement of Industry 4.0 and progress in digital technology, data has become indispensable in every aspect of corporate operations. The development of quality management is also shifting toward a data-centric approach, which places heightened demands on firms’ data quality management. Data quality refers to the degree to which a set of data fulfills the requirements of its intended use [3]. How to improve data quality becomes a new challenge to advance firms’ digital transformation—while data quality is a universal issue, its management demands evolve with industrial eras. Given this, the traditional quality management theory needs to be reexamined. Since Industry 4.0 laid the technical foundation for digitalization, Industry 5.0 was proposed in 2021, challenging the traditional quality management theory from the human-centricity, sustainability, and resilience view [4]. In this context, data quality has become a critical enabler for sustainable digital transformation, yet existing literature lacks the data quality perspective aligned with Industry 5.0 concepts. This study thus aims to develop a new quality management paradigm for firms’ digital transformation in Industry 5.0 by enhancing data quality. Referring to Deming’s quality management theory, the key influencing factors on data quality were discussed. A framework based on these factors was established to improve data quality and support digital transformation. An empirical study with a questionnaire and SEM analysis was employed to verify the framework.
The remainder of this paper is organized as follows. Section 2 reviews literature on digital transformation and data quality management and proposes a framework for data quality improvement and digital transformation with relevant hypotheses. Section 3 introduces research methodology and data analysis. Section 4 discusses the analysis results. Section 5 concludes the study and presents its limitations and future work.
2. Literature Review
2.1. Digital Transformation
Digital transformation is the basic component of industry strategies in different countries, including Industry 4.0 in Europe, Made in China 2025, etc. Industry 4.0 introduced the generic concepts of cyber-physical systems (CPS) and Industrial Internet of Things (IoT) to industrial production systems. Made in China 2025 introduced the integration of informatization and industrialization. Greater emphasis has been placed on establishing and implementing digital-related technical architecture. For example, references [5] and [6] define and classify digital twins, explore their connections with other technologies or innovation management, and outline implementation processes. Reference [7] examines the implementation of marketing automation technology in optimizing customer journey touchpoints within e-commerce environments. Reference [8] analyzes how two key drivers—cloud services and resource virtualization—accelerate digital transformation in manufacturing to facilitate the implementation of cyber-physical production systems and the Industrial Internet of Things. Reference [9] proposes a digital transformation framework for implementing cloud computing and IoT, encompassing a three-phase process covering business, technology, and innovation that can be iterated to drive product and business development. The drivers of firms’ digital transformation have also been examined from the management and organizational behavior perspectives, as shown in Table 1.

Table 1.
Literature review on drivers of enterprise digital transformation.
From a management perspective, the allocation of resources and capabilities, along with strategic choices, is crucial for digital transformation. Digital transformation is not only about building information systems but also about generating a new digital ecology based on new resources, i.e., data. The resource-based view (RBV) emphasizes that corporate resources constitute the source of competitive advantage, with human capital and digital capabilities serving as vital resources for advancing digital transformation [10,11]. The dynamic capability view (DCV) and resource orchestration theory (ROT) further address the static limitations of the RBV. DCV emphasizes the continuous adaptation of enterprises to their environment, where an organization’s sensing capabilities, integration capabilities, and reconfiguration capabilities can trigger digital transformation [12,13,14,15]. ROT highlights the coordinated allocation and value transformation of resources, with the orchestration process comprising three stages: building resource portfolios, bundling resources, and leveraging resources [16,17,18]. Upper echelons theory emphasizes that senior executives serve as the decision-making agents for corporate actions and are pivotal in determining organizational direction [19,20]. Overall organizational capabilities and institutional norms also significantly influence digital transformation. The organizational cognitive perspective highlights that an organization’s sense of urgency and manageability serve as a diagnostic method for managers to address external stakeholder demands, significantly promoting digital transformation [21]. Organizational learning theory underscores that an organization’s learning capacity plays a vital role in digital transformation [10]. Regarding institutional norms, institutional theory highlights that institutional pressures—including regulatory, cognitive, and normative pressures—arise from the influence of multiple external institutional factors on enterprises, thereby impacting digital transformation [21]. Organizational routine theory emphasizes the continuous updating or innovation of organizational routines such as rules, procedures, and paradigms to adapt to digital change [13].
From an organizational behavior perspective, significant emphasis has been placed on the role of individual or team behaviors and organizational culture in digital transformation. Social cognitive theory posits that individuals’ perceptions or states of mind—such as psychological safety and self-efficacy—mediate the relationship between the social environment and observed behaviors (outcomes), thereby facilitating corporate digital transformation [22,23]. The Stimulus-Organism-Response (SOR) framework posits that organizational culture, as an external stimulus, influences employees’ perceptions and attitudes, thereby shaping their behaviors and driving digital transformation [24]. Transformational leadership theory posits that transformational leadership styles can promote enterprise digital transformation by motivating and empowering employees [24]. Imprinting theory emphasizes that executives’ educational and professional backgrounds create cognitive imprints, shaping their life values and subsequently influencing digital transformation decisions [11,19].
The digital transformation degree measurement has been validated in existing literature [25,26,27]. Drawing on dimensions from the prior studies, its measurement scales on digital transformation can be established based on strategy, business model, technology, organization and processes, culture, customer interface, etc. While digital transformation research spans multiple perspectives (e.g., management, engineering, organizational behavior), limited attention has been paid to quality, especially data quality. Defined as the degree to which data meets its intended use requirements [3], data quality is particularly crucial for digital transformation today. Poor quality, outdated, or incomplete data can result in poor decisions [28,29], while high-quality data significantly reduces costs [29]. For example, optimizing processing and operations (processes highly dependent on input data) can achieve 15% to 25% cost savings related to energy efficiency [30]. With the growing emphasis on corporate sustainability, data quality also plays an increasingly vital role in enterprises’ ESG (environmental, social, and governance) development. Poor data quality impairs social welfare levels and supply chain profitability [31]. Meanwhile, quality management is shifting toward a data-centric approach. However, current quality management faces new challenges: traditional methods are ill-suited for today’s more flexible, rapid production processes, and they fail to meet complex data management requirements [28] and struggle to adapt to the growing closeness between producers and consumers. Thus, amid enterprise digital transformation, whether a new quality management paradigm exists merits consideration.
2.2. Data Quality Management
2.2.1. Quality Management and Data
The concept of quality has evolved alongside industrial revolutions, driving distinct changes to production systems, quality systems, and product types from the pre-industrialization era to Industry 5.0 [3]. This evolution is summarized in Table 2. In Industry 3.0 (1970s–2010s), marked by automation, computers, and sensors, the production system integrated flexible manufacturing and lean production, yielding customized products. Its quality system was Quality 3.0, built upon TQM (total quality management), lean Six Sigma, and SPC (statistical process control), incorporating customer-centric design and sophisticated data analysis. Data management adopted a reactive, elaborate data analysis approach. Notably, quality management pioneer William Edwards Deming’s work laid the foundation for TQM and its successor, quality management systems (American Society for Quality) [32]. His quality management system was regarded as the representative quality management theory and was summarized in 14 points and four principles of profound knowledge [33].
Table 2.
Evolution of the quality concept in step with the different industrial revolutions.
In Industry 4.0 (circa 2010–present), driven by artificial intelligence, IoT, and big data, the production system transformed into a smart business ecosystem. This ecosystem produced smart products via cyber-physical systems. The quality system advanced to Quality 4.0, leveraging big data and AI checks, with data management shifting to proactive life-cycle data tracking. The definition of traditional quality has evolved from “degree of excellence” to include defect-free, standardization, or personalization. The focus of quality management has evolved from controlling quality throughout the production process to preempting and addressing quality variation risks [3].
Since Industry 5.0 was proposed in 2023, production aims to deliver sustainable products through human-centricity and resilience systems while also creating jobs. The organizational behavior view becomes more important in Industry 5.0. The quality system is Quality 5.0, rooted in sustainable quality management, with data management adopting proactive social network analysis. Quality 5.0 cares not only about cost reduction but also about sustainability and resilience. High-quality products and services are expected to deliver exceptional user experiences, enhanced through digital interfaces and artificial intelligence, while also being sustainable and making positive contributions to society. The quality concept is also redefined by circular economy principles, emphasizing waste reduction and minimal environmental impact [34]. To achieve these goals, digital technology and traditional quality methods are integrated in Quality 5.0 [34], including real-time monitoring, predictive analytics, AI-driven process optimization, and human–machine collaboration [35].
Quality management, founded as a new discipline by Bell Laboratories in the 1920s, has long focused on data. Two basic support technologies, i.e., offline quality control (inspection) and SPC (statistical process control), are inherently data-dependent. Data quality management (DQM) falls into two distinct approaches: reactive (addressing issues after they occur) and proactive (preventing issues upfront). The proactive approach requires an understanding of data quality dimensions, potential error sources, and a sustained commitment to maintaining and enhancing data quality. Most organizations prefer the proactive DQM approach for long-term benefits, such as cost reduction (via prevention over cure) and more effective, reliable data usage across the organization [3].
2.2.2. Deming’s Profound Knowledge System
Referring to Deming’s Profound Knowledge System (DPKS) in Industry 3.0 and the new characteristics in Industry 4.0 and Industry 5.0, the impacting factors on data quality management were proposed. Four interrelated components of Deming’s System of Profound Knowledge were adapted and discussed in the context of data quality management, as shown in Table 3. Measurement scales were developed with reference to the research on DPKS.
Table 3.
Four interrelated components in DPKS are adapted for data quality management.
- Appreciation for a System: System integration (SI)
Organizations are interconnected systems whose purpose is to let all stakeholders benefit sustainably. A system dynamics tool can be useful to understand how to facilitate system thinking [36]. Data comes from different locations of a system and server, with the intention of maintaining the system. System integration (SI) in data quality management is the process of integrating all needed data in a system to support the system’s purpose. The data may be generated by employees, departments, companies, external stakeholders, etc. By integrating all related resources inside and outside firms, firms can form a resilient capability to better cope with disruptions and systemic crises [4].
System integration may include information technology integration, human–machine integration, business integration, human-organization integration, and internal and external firm integration. System integration can be measured through the degree of interaction among these components and thus can be categorized in another way: inbound integration (interaction between information/technologies, between employees and machines/organizations, and between interconnected departments) and outbound integration (interaction between the organization and external stakeholders). For example, system integration can be measured by human–machine interaction, which can support the data input processes in quality management. The detailed questions can be found in the questionnaire (see Appendix A.4).
- 2.
- Understanding Variation: Data Variation (DV)
Variation is impossible to avoid and can cause quality problems. Variation can be reduced with statistical tools. With more automated business processes, poor data quality’s impact on operations/decision-making grows [3]. Low data variation in technologies such as AI and additive manufacturing can support firms’ resilient production [4]. Data quality management focuses on managing the data variation.
Data variation (DV) in this study refers to deviations between actual data and the required standards for its intended use, including deviations in accuracy (whether data reflects real events), completeness (whether all necessary information is included), consistency (whether data is uniform across systems), timeliness (whether data is collected in a timely manner), and validity (whether data conforms to specified formats and scopes). These dimensions have been studied in data quality management, but most studies may be limited by the known metadata and domain knowledge of the data semantics. With open data widely applied, data variation is facing new challenges [37]. Referring to the literature [3,38,39,40,41,42], questions on data variation can be developed as shown in the questionnaire (see Appendix A.4).
- 3.
- Theory of Knowledge: Digital variation knowledge management (DVKM)
Theory is helpful for understanding cause-and-effect relationships, which can be used for forecasting and rational decisions. In data quality management, digital variation knowledge management (DVKM) refers to the construction, accumulation, and application of knowledge related to digital data variation—specifically, knowledge about the causes, patterns, and control methods of data variation in digital environments—to support systematic variation control. All related actions are executed by individuals, emphasizing human-centricity [4].
Digital variation knowledge management includes knowledge exploration and knowledge exploitation [43]. Knowledge exploration focuses on how employees apply digital variation-related knowledge and skills to drive incremental improvement (e.g., using data analysis skills to identify hidden variation in digital workflows) and solve practical problems (e.g., leveraging digital tools to address data consistency issues across systems). It also involves collecting employee feedback on digital variation control to optimize processes. Knowledge exploitation refers to how organizations acquire or generate knowledge related to digital variation, such as partnering with external institutions to access cutting-edge technologies for digital variation detection, investing in R&D to develop innovative digital tools to manage data variation, and seamlessly integrating these technologies into existing workflows.
- 4.
- Psychology: Employee Resilience (ER)
Psychology is helpful for understanding the relationships among humans and between humans and the environment, which is the basis of human motivation in quality management. Besides employee motivation, employee resilience becomes a critical capability for data quality management in the digital and turbulent era. Employee resilience is an employee’s capacity to respond effectively to change and recover, such as using resources to adapt and thrive at work amid challenges [44]. In Industry 5.0, resilience is a core concept and better arms industrial production against disruptions and crises, and the human-centric view of putting core human needs and interests at the heart of the production process requires an emphasis on employee psychology, such as employee resilience [4].
The measurement scale of employee resilience was adapted from a previous empirical study and has been validated [44]. Employee resilience can be measured through how quickly employees adapt to new ways of working or new tasks; how employees can easily shift their work focus; how easily employees adapt to changing circumstances; how employees can quickly shift their work focus and activities in response to changing organizational priorities; how much employees enjoy experimenting and trying new things; and how quickly employees bounce back according to feedback.
2.3. A Framework on Data Quality Improvement and Digital Transformation
2.3.1. A Research Model
Since Deming’s Profound Knowledge System (DPKS) was proposed, extensive research has explored its measurement and applications [33,45,46,47]. However, few studies can be found on the structure of the four interrelated parts. To address this gap, an exploratory theoretical model on how to improve data quality and support digital transformation was proposed, as shown in Figure 1. This model includes the possible paths among the four parts and the digital transformation. Hypotheses on the paths are proposed as follows and will be tested in the next section.
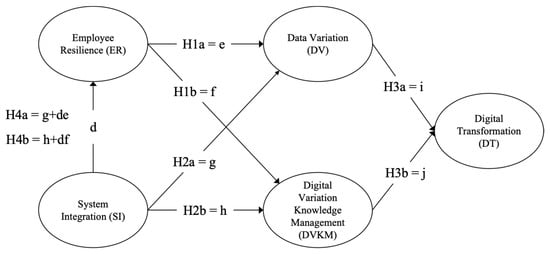
Figure 1.
A research model on data quality improvement supporting digital transformation.
2.3.2. The Driving Force of Human and System
Economic activity can be driven by the forces, i.e., human, technology, and equipment. Referring to the four parts of DPKS in data quality management, employee resilience is the key factor of human driving force, and system integration can be understood as the technology driving force. Employee resilience (ER) and system integration (SI), to some extent, can reflect an organization’s human resources, technology, and processes. These two forces may have positive effects on the rest of the parts [43] and may function as parallel partners safeguarding data variation, continuously and cyclically enhancing data variation risk prevention and decision-making.
System integration (SI) connects internal and external corporate elements into a cohesive whole, thereby enhancing resilience against complex systemic risks, and can reduce data variation through fragmentation reduction [48]. With the emergence of new technologies such as artificial intelligence and the advent of new quality management paradigms, data quality can now be monitored and adjusted in real time, achieving a high degree of stability through system integration. Aided by technologies such as artificial intelligence, knowledge acquisition and application have become more straightforward, relying inherently on technological foundations. Amidst big data and vast quantities of information where authenticity is difficult to discern, the effective identification, selection, and management of knowledge concerning data variation control (i.e., digital variation knowledge management (DVKM))—rather than knowledge itself—emerges as a critical challenge in the AI era.
Human factors have been emphasized by Mr. Deming in traditional quality management. In Deming’s 14 points, over 10 points are related to humans. With the fast development of technology, the human factor in quality management has been strengthened. In Industry 5.0, DPKS needs to be revised to fit with human complex adaptive systems [47]. Capabilities related to risk prevention thus become particularly crucial, such as employee resilience [3]. It enables staff to better perform data quality monitoring and knowledge management during organizational transformations or external environmental shifts.
Accordingly, the following hypotheses are proposed:
H1a.
Employee resilience has a positive effect on data variation.
H1b.
Employee resilience has a positive effect on digital variation knowledge management.
H2a.
System integration has a positive effect on data variation.
H2b.
System integration has a positive effect on digital variation knowledge management.
2.3.3. The Direct Impact of Data and Interrelationships
Variation is the core component of quality. The basic concepts in quality management, such as tolerance, Six Sigma, and process capability, are caused by variation. Variation can be everywhere. Controlling data variation could be the target of data quality management. As data permeates every facet of business operations and daily life, superior-quality data lays a robust foundation for processes and systems, proving data quality’s crucial role in enterprise digital transformation [3].
Knowledge management is the process of analyzing the cause-and-effect relationships among data and can be used to explain and control the data variation. Low data variation with constant data variation knowledge management helps enterprises mitigate risks, improve decisions, and boost digital transformation. Supported by new technologies, preventing and responding to risks associated with data variation has become a more paramount task than mere control.
A successful transformation to AI- and machine learning-driven industrial operations and supply chain management requires effective data quality management and governance [36]. Data variation and knowledge management are the core components of data quality management. Two hypotheses are proposed to support digital transformation:
H3a.
Data variation has a positive effect on digital transformation.
H3b.
Digital variation knowledge management has a positive effect on digital transformation.
2.3.4. The Mediating Effect of Employee Resilience
In the Quality 4.0 and 5.0 era, the focus of quality management shifts from control to risk prevention and response. As all related actions are executed by individuals, each person requires appropriate quality training and must assume responsibility for risk prevention and response. Moreover, during Quality 5.0, human performance is central and essential [3]. Corporate practitioners also emphasize the vital role of people in enhancing data quality and driving organizational transformation [39]. Employee resilience enables staff to recover work capabilities more effectively in volatile environments, thereby optimizing the utilization of other organizational resources and capabilities. In Deming’s Profound Knowledge System (DPKS), employee driving force plays a much more important role than technology. Similarly, in data quality management, employee resilience may impact system integration.
From the resource orchestration perspective, effective bundling of human and technical resources drives value creation [16]. System integration (including technical resources) reduces data fragmentation, while employee resilience (a core human capability) optimizes system integration utilization by resolving unanticipated human frictions—such as helping employees adapt to new data processes or cross-system conflicts that technical systems alone cannot fix. This aligns with social cognitive theory, which holds that individual perceptions or states of mind (e.g., resilience) mediate the link between contextual factors (e.g., system support) and work outcomes [22,23].
Specifically, system integration establishes standardized data flows but cannot pre-empt all dynamic variations; employee resilience enables quick recovery and adjustment of data management behaviors (e.g., addressing sudden data format inconsistencies) to improve data variation control. For digital variation knowledge management, employee resilience fosters knowledge sharing—resilient employees are more willing to document variation patterns and collaborate to refine repositories, turning system integration’s technical connectivity into actionable knowledge assets. Thus, two hypotheses are proposed:
H4a.
Employee resilience mediates the effects of system integration on data variation.
H4b.
Employee resilience mediates the effects of system integration on digital variation knowledge management.
3. Methodology and Data Analysis
3.1. Questionnaire and Data Collection
A questionnaire was developed for data collection (see Appendix A). All variables were measured using a 5-point Likert Scale, with items ranging from 1 (Strongly Disagree) to 5 (Strongly Agree). Employee resilience was measured by six items adapted from [44]. Digital transformation was measured by six items (six dimensions: strategy, business model, technology, organization and processes, culture, and customer interface) developed based on [25,26,27]. Data variation was measured using five items (five dimensions: accuracy, completeness, consistency, timeliness, and validity) developed based on [3,38,39,40,41,42]. System integration was measured by five items (five dimensions: information technology integration, human–machine integration, business integration, human-organization integration, and internal and external firm integration) developed based on a literature review and expert consultation. Digital variation knowledge management was measured by six items adapted from [43], which have been validated in knowledge management research. The average values of the SI and DVKM scales were used as observed variables in SEM for three reasons: (1) Observability: Based on enterprise interviews and expert suggestions, the items of the SI and DVKM scales are consistent in measuring their respective constructs and can directly reflect the actual situation of the variables. They are observable and do not require treatment as latent variables. (2) Good construct validity and measurement reliability of both SI and DVKM scales: Their exploratory factor analysis (EFA) and reliability analysis results were satisfactory—each scale yielded a single factor (all item loadings > 0.65; KMO > 0.8; cumulative variance explained > 50%) and demonstrated good internal consistency (CTIC > 0.4; item-deleted Cronbach’s α < overall Cronbach’s α; overall Cronbach’s α > 0.75). (3) Reduction in SEM measurement noise: Average values offset random errors of individual items, reduce parameters to estimate, and improve model fit [49].
The questionnaire targeted the manufacturing industry in China, a sector that is at the forefront of Industry 5.0 practice and has intensive demand for data quality management—manufacturing enterprises rely heavily on data in production, supply chain, and operational processes, making them a critical context for studying data quality in digital transformation [8,13]. The focus on manufacturing ensures the research addresses a key industry with urgent practical needs. However, this focus also limits the generalizability of the conclusions to other industries, which is acknowledged as a research limitation.
Data was collected through two channels. In total, 102 questionnaires were distributed through email based on our research team’s contact lists (with 95 valid responses). The contact list mainly consists of part-time students with no less than 3 years of industrial experience. These students have either chosen not to pursue or are currently pursuing a master’s degree in engineering management. Others are enterprise employees with a master’s degree. Additional 319 questionnaires were collected through the sample service of the WJX platform (with 206 valid responses). Based on our research objectives, we have defined the target group as follows: (1) Education: no less than a Bachelor’s degree; (2) Industry: manufacturing; (3) Work experience: no less than 3 years; (4) Employment status: company employee; and (5) Current position: manager. The surveys began in April 2025 and concluded in May 2025. We finally received 301 valid questionnaires. The characteristics of the respondents (n = 301) are provided in Table 4.
Table 4.
Respondents’ characteristics (n = 301).
To examine the feasibility of combining samples from WJX and email, chi-squared tests were conducted to compare the channel variable (WJX = 1, email = 0) with demographic variables (e.g., gender, age, manufacturing sector, company location, and company nature). All test results yielded p-values > 0.05, indicating no significant differences in demographic characteristics between the two sample groups. Thus, the samples from the two channels can be combined. The variance inflation factors (VIFs) for all five variables range from 1.379 to 3.549, indicating the absence of collinearity issues [15].
During data analysis, there are three steps. Firstly, three factors (i.e., employee resilience, data variation, and digital transformation) were extracted with the exploratory factor analysis (EFA). Then, further reliability and validity tests of the three constructs were conducted. At last, a structural model was proposed with structural equation modeling (SEM), and the hypotheses were tested based on the model. AMOS 27 software was used for the SEM.
3.2. Exploratory Factor Analysis
An exploratory factor analysis (EFA) was conducted to examine employee resilience, data variation, and digital transformation. For each latent variable, a single factor emerged (all item loadings > 0.7 except DV1 = 0.6; KMO > 0.8; cumulative variance explained > 55%); across all latent variables, three factors emerged (all item loadings > 0.5; KMO > 0.9), as shown in Table 5. These factors explain 58.52% of the total variance. The item and dimension divisions in the EFA results are completely consistent with the original design of the scales. Both results indicate that factor analysis was possible.
Table 5.
Factors loadings in exploratory factor analysis.
3.3. Reliability Tests
Reliability tests were conducted after EFA. The results are shown in Table 6. CTIC for all items is more than 0.4. Item-deleted Cronbach’s α is no more than overall Cronbach’s α (except for DV1). Overall, Cronbach’s α for all constructs is no less than 0.8. The reliability results are acceptable.
Table 6.
CTIC and Cronbach’s α in reliability tests.
For DV1, item-deleted Cronbach’s α (0.805) exceeded overall Cronbach’s α (0.800). After removing DV1, DV4 showed the same pattern: item-deleted Cronbach’s α (0.807) > overall Cronbach’s α (0.805), suggesting DV4 should also be removed. Removing both DV1 and DV4 increased the overall Cronbach’s α of the remaining three items to 0.807 (slightly higher than the original five-item scale’s 0.800). This shows only a marginal difference in internal consistency α between the reduced and original scales. Notably, both reliability indices remained satisfactory. Thus, DV1 and DV4 were retained. The internal consistency reliability of the five-item data variation (DV) scale is deemed satisfactory [50].
3.4. Validity Tests
For content validity, a solid foundation for questionnaire design was laid through extensive literature review and consultation with experienced professors in related fields. The final questionnaire was recognized by experts as having high content validity, as it covers all dimensions of relevant research subjects.
For construct validity, the results of convergent validity tests are reported in Table 7, and discriminant validity tests in Table 8. All item loadings are more than 0.6 except DV1 = 0.463; AVE of data variation, employee resilience, and digital transformation are 0.458, 0.498, and 0.520, respectively; C.R. for all constructs is more than 0.8. The square root of AVE is larger than the absolute correlation value among the constructs in each row and column, except between data variation and digital transformation (AVE square root = 0.677 < absolute correlation = 0.685).
Table 7.
Convergent validity tests.
Table 8.
Discriminant validity tests.
For the factor loading of DV1 (0.463) < 0.5, reference [51] indicates that if a factor has four or more loadings greater than 0.6, it is reliable regardless of sample size. In this study, the factor loadings of the rest of four items (DV2 to DV5) all exceed 0.6. The retention of DV1 is also based on a comprehensive assessment of multiple indicators, including content validity and the overall reliability and validity of the scale. First, DV1 (Accuracy dimension) constitutes a core dimension of data variation [3,38,39,40,41,42], so its removal would diminish the scale’s content validity. Second, the overall reliability of the DV scale has already reached 0.8, and removing DV1 would yield only marginal improvement to the scale’s overall reliability (see Section 3.3). Third, the DV scale’s C.R. exceeds 0.8, indicating sufficient internal consistency and construct validity. Thus, retaining DV1 ensures the DV scale is both comprehensive (covering core data variation dimensions) and statistically reliable.
While the AVE of DV and ER is slightly below the commonly cited 0.5 threshold, reference [52] notes that AVE is a more conservative measure than C.R. On the basis of C.R. alone, the researcher may conclude that the convergent validity of the construct is adequate, even though more than 50% of the variance is due to measurement error (i.e., AVE < 0.5). In this study, the C.R. of all constructs is above 0.8 (DV = 0.804, ER = 0.856, DT = 0.866), indicating sufficient internal consistency and construct validity. As in [53], even if the AVE of the SDC scale is 0.45, the paper still concluded that the model had good convergent validity, with satisfactory internal consistency and stability of the items. Thus, the AVE values do not undermine the interpretability of the research results.
For the square root of AVE slightly deviating from the threshold, first, this minor deviation does not weaken discriminant validity, as data variation (DV) and digital transformation (DT) differ inherently in definition, measurement, and theory. DV refers to data’s deviation from standards (focusing on intrinsic quality like accuracy [3,38,39,40,41,42]), while DT means enterprise digital-driven transformation (covering strategy, business models [25,26,27]). Measured via distinct dimensions, their theoretical boundaries are clear. The slight correlation reflects practical “data-input vs. digital-output” links, not construct overlap. Second, additional exploratory factor analysis (EFA) and confirmatory factor analysis (CFA) confirm the model’s factor structure remains stable: in EFA, three factors emerged (all item loadings > 0.5; KMO > 0.9) (see Section 3.2); in CFA, all factor loadings exceed 0.6 (except DV1 = 0.463), and C.R. is more than 0.8. The model fit indices are also satisfactory (CMIDF = 1.934, RMSEA = 0.056, CFI = 0.952). These indicate that the discriminant validity of the constructs is theoretically and statistically meaningful for interpreting the research results.
3.5. Structural Model and Hypotheses Testing
The standardized path coefficients among the variables and the model hypothesis results are shown in Figure 2 and Table 9. Figure 2 presents the final model with standardized estimates. The results show that the model has good fit indices (CMIN = 284.24 at p = 0.000, DF = 147, RMSEA = 0.056, GFI = 0.906, AGFI = 0.878, CFI = 0.952, CMIDF = 1.934).
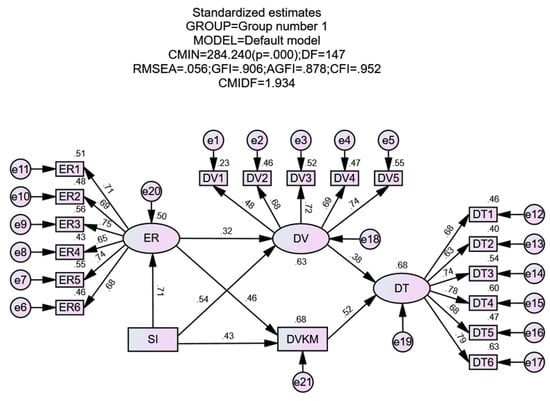
Figure 2.
The structural model (standardized).
Table 9.
Hypothesis testing.
Results in Table 9 support all the hypotheses: employee resilience has a positive effect on data variation/digital variation knowledge management, supporting hypothesis 1a/1b (H1a = 0.316, H1b = 0.459, p = 0.000); system integration has a positive effect on data variation/digital variation knowledge management, supporting hypothesis 2a/2b (H2a = 0.537, H2b = 0.432, p = 0.000); data variation/digital variation knowledge management has a positive effect on digital transformation, supporting hypothesis 3a/3b (H3a = 0.383, H3b = 0.525, p = 0.000); employee resilience mediates the effects of system integration on data variation/digital variation knowledge management, supporting hypothesis 4a/4b (H4a = 0.117, p = 0.000; H4b = 0.390, p = 0.001). Both the mediation effect of employee resilience on data variation and digital variation knowledge management are partial.
3.6. Multiple-Group Analysis
To examine whether the model proposed in this paper possesses cross-context validity, a multiple-group analysis was conducted across firm size and firm nature, for both the measurement model and structural model. All multiple-group analysis results indicate that both the measurement model and structural model in this paper demonstrate cross-context validity.
3.6.1. Multiple-Group Analysis of Firm Size
Firm size is divided into two groups to ensure the number of samples in each group is no less than 50: firms with fewer than 500 employees belong to group 0 “SMEs” (134 samples), and the others belong to group 1 “LEs” (167 samples). The results are shown in Table 10, Table 11, Table 12 and Table 13.
Table 10.
Multiple-group analysis of firm size for the measurement model: model fit.
Table 11.
Multiple-group analysis of firm size for measurement model: invariance testing.
Table 12.
Multiple-group analysis of firm size for the structural model: model fit.
Table 13.
Multiple-group analysis of firm size for structural model: invariance testing.
In Table 10 and Table 12, all fit indices meet the model fit criteria. In Table 11 and Table 13, although some p-values are lower than 0.05, all value-added fit indicators (i.e., ΔNFI, ΔIFI, ΔRFI, and ΔTLI) are lower than 0.05. The results indicate that for both the measurement model and structural model, there is no significant difference between the two groups. Thus, the model in this study possesses overall validity across small-and-medium enterprises and large-and-medium enterprises [54].
3.6.2. Multiple-Group Analysis of Firm Nature
Firm nature is divided into two groups to ensure the number of samples in each group is no less than 50: firms that are state-owned or foreign-funded belong to group 0 “State/Foreign” (99 samples), and the others belong to group 1 “Private and Others” (202 samples). The results are shown in Table 14, Table 15, Table 16 and Table 17.
Table 14.
Multiple-group analysis of firm nature for measurement model: model fit.
Table 15.
Multiple-group analysis of firm nature for measurement model: invariance testing.
Table 16.
Multiple-group analysis of firm nature for the structural model: model fit.
Table 17.
Multiple-group analysis of firm nature for structural model: invariance testing.
In Table 14 and Table 16, all fit indices meet the model fit criteria. In Table 15 and Table 17, although some p-values are lower than 0.05, all value-added fit indicators (i.e., ΔNFI, ΔIFI, ΔRFI, and ΔTLI) are lower than 0.05. The results indicate that for both the measurement model and structural model, there is no significant difference between the two groups. Thus, the model in this study possesses overall validity across state-owned/foreign-funded enterprises and private and other enterprises [54].
4. Discussion
4.1. ER as a Core Driver of DV/DVKM
Research findings indicate that employee resilience (ER) has a positive effect on data variation (DV) (β = 0.316, p < 0.001) and digital variation knowledge management (DVKM) (β = 0.459, p < 0.001) (see Table 9). This aligns with [44], which emphasizes employee resilience in helping employees adapt to organizational change. This paper extends this logic to the domain of data variation and knowledge management. While [44] validates employee resilience as a predictor of change readiness, this study is the first to reveal its association with data-specific outcomes: more resilient employees prioritize data accuracy (DV1, factor loading = 0.463) and recover faster from data processing setbacks such as rectifying invalid data (DV5, factor loading = 0.777), directly addressing the “human-centric gap” in data quality management [3].
This result also concurs with [39], which argues that people, not just technology, determine data quality. Reference [39]’s qualitative observations of AI-driven firms are empirically supported here: Employee resilience explains 10.0% of the variance in data variation (β2 = 0.3162 ≈ 0.100) and 21.1% of the variance in digital variation knowledge management (β2 = 0.4592 ≈ 0.211) (see Table 9). This demonstrates that during digital transformation, employee resilience is not merely a contributing factor to data quality but a core driver. This core driving role lays the foundation for its mediating role in the relationships between system integration (SI) and data variation (DV)/digital variation knowledge management (DVKM).
4.2. SI as a Driver for DV/DVKM
System integration (SI) positively influences both data variation (DV) (β = 0.537, p < 0.001) and digital variation knowledge management (DVKM) (β = 0.432, p < 0.001) (see Table 9). This is in line with [48], who emphasizes that system integration, as a core driver of digital transformation, eliminates organizational barriers and enhances cross-domain collaboration. This paper extends system integration in data quality management. While [48] focuses on system integration breaking rigid hierarchies to boost agility and collaboration, this study defines system integration as a holistic construct, encompassing both internal coordination (e.g., human and technical resources) and external collaboration (e.g., suppliers and customers). This definition is more consistent with Deming’s “appreciation of a system” [33], and the results further support this principle. For example, system integration’s strong effect on data variation is largely driven by cross-system data consistency (DV3, factor loading = 0.750)—reflecting [48]’s finding that internal integration reduces data fragmentation and Deming’s view that local optimization causes systemic waste [33].
The results also support [43]’s findings, which show that integrative resources such as collaborative leadership, IT systems, and human resource management contribute to knowledge management. System integration in this paper bundles technical resources (e.g., cloud computing, additive manufacturing) and organizational resources (e.g., cross-department teams) to reduce data variation, explaining 28.8% of the variance in data variation (β2 = 0.5372) and 18.7% of the variance in digital variation knowledge management (β2 = 0.4322) (see Table 9). This quantifies [16]’s qualitative claim that systemic resource alignment is key to digital transformation, providing a measurable link between system integration and data variation/digital variation knowledge management.
4.3. DV and DVKM as Dual Pathways to DT
Data variation (DV) (β = 0.383, p < 0.001) and digital variation knowledge management (DVKM) (β = 0.525, p < 0.001) have positive effects on digital transformation (DT) (see Table 9). This supports [3]’s argument that Quality 4.0 requires both data control and risk prevention, though it innovatively treats data variation and digital variation knowledge management as equally critical, complementary mechanisms. Previous research has either focused on the direct role of data quality in digital transformation (e.g., reference [28] linking data accuracy to ESG performance) or emphasized the role of knowledge management (e.g., reference [15] highlighting knowledge agility), yet no study has integrated both dimensions.
This study shows digital variation knowledge management explains 27.5% of digital transformation’s variance (β2 = 0.5252)—more than data variation’s 14.7% (β2 = 0.3832) (see Table 9). This underscores that “managing knowledge about data variation” is as important as “controlling variation itself.” It also highlights the safeguarding role of digital variation knowledge management on data variation. For example, the impact of digital variation knowledge management is strongest in digital transformation’s strategy dimension (DT6, factor loading = 0.798): firms that actively pursue digital variation knowledge acquisition, development, application, and exploration (a DVKM practice) demonstrate greater capacity to align digital strategies with quality goals. This corroborates [31]’s observation that poor data quality undermines supply chain sustainability by providing a knowledge-based solution.
4.4. The Mediating Effect of ER on SI and DV/DVKM
The results show that employee resilience (ER) partially mediates system integration (SI)’s effects on both data variation (DV) (indirect β = 0.117, p < 0.001) and digital variation knowledge management (DVKM) (indirect β = 0.390, p < 0.001) (see Table 9). This resolves the “technology vs. people” debate and supports [39], which stresses people’s priority in data quality management and concurs with Industry 5.0’s “human-centricity” view [4]. The results show that system integration provides a systemic foundation (e.g., unified data platforms), and employee resilience acts as a bridge to resolve unanticipated data conflicts (e.g., inconsistent shift yield data) and complex knowledge management that system integration cannot address.
This mediating role validates the theoretically derived “SI→ER→DV/DVKM” mechanism, which integrates resource orchestration theory (ROT), social cognitive theory, and organizational behavior insights—addressing the internal logic of how human capability bridges technical resources and data quality outcomes.
Consistent with ROT, ER optimizes the utilization of SI (a technical resource): SI provides a systemic foundation to reduce data fragmentation, while ER resolves human-related bottlenecks (e.g., employee resistance to new data systems) that would otherwise render SI ineffective. This aligns with social cognitive theory and empirical organizational behavior findings, which confirm that individual resilience acts as a transmission channel between contextual support (e.g., SI) and work performance. For instance, ER enables employees to adapt to SI-driven process changes, maintaining consistent data monitoring (enhancing DV) and actively contributing to variation knowledge sharing (strengthening DVKM)—a dynamic supported by studies showing resilience mediates technical system impacts on operational outcomes.
Consistent with Deming’s Profound Knowledge System, where human driving force outweighs technology, ER’s mediating effect extends traditional quality theory to digital contexts. Additionally, ER’s stronger mediating effect on the SI→DVKM path (indirect β = 0.390 vs. SI→DV’s 0.117) correlates with its stronger direct impact on DVKM (β = 0.459 vs. DV’s 0.316) (see Table 9), confirming the mechanism’s consistency across paths.
4.5. Research Contribution
This study introduces three theoretical innovations. Firstly, this study maps Deming’s Profound Knowledge System onto digital contexts (e.g., systems thinking → system integration, theory of variation → data variation), thereby filling the digital void in traditional quality theory. Second, this study reveals the partial mediating role of employee resilience as a human–machine intermediary to reconcile the academic debate over “technology versus humans” and expand resource orchestration theory. Third, this study constructs the “Resources (SI + ER)–Capabilities (DV + DVKM)–Value (DT)” chain, explaining 42.2% of digital transformation variance (β2 = 0.3832 + β2 = 0.5252 ≈ 0.422) (see Table 9), bridging the resource-capability-value gap in research on digital transformation while aligning with Industry 5.0 objectives.
Derived from this theoretical framework, we propose both a novel management logic and practical guidelines for manufacturing managers. The management logic focuses on resource orchestration: (1) Employee resilience, system integration, data variation, and digital variation knowledge management constitute vital assets and capabilities for corporate digital transformation. (2) Employee resilience and system integration should be bundled, and emphasis should be put on the mediating role of employee resilience, forming a resilient firm capability. (3) Data variation and digital variation knowledge management should be regarded as equally important partners, with digital variation knowledge management safeguarding data variation, forming a capability for preventing and responding to data quality variation risks, as well as decision-making capacity, further transforming into the firm’s digital capabilities. Corresponding practical operations include: (1) developing employee resilience via change adaptation workshops and a failure-tolerant culture; (2) optimizing system integration by unifying internal data platforms and building external stakeholder data-sharing mechanisms; and (3) enhancing digital variation knowledge management through dedicated knowledge repositories and cross-departmental training on data quality tools. These measures translate the theoretical “resources-capabilities-value” chain into actionable steps, supporting firms’ sustainable digital transformation.
5. Conclusions
This study advances research on digital transformation and quality management and data by integrating Deming’s theory, resource orchestration, and digital variation dynamics in the context of Industry 5.0. Referring to Deming’s quality management theory, four key influencing factors on data quality were discussed. An empirical study with a 301-participant questionnaire and SEM analysis was employed to verify the framework. The core contributions include adapting key factors in DPKS to data quality management, validating employee resilience/system integration as dual drivers of data variation/digital variation knowledge management, confirming the parallel roles of data variation/digital variation knowledge management on digital transformation, uncovering employee resilience’s mediating role, and proposing a “resources-capabilities-value” chain data quality management in digital transformation. These contributions address key gaps in the literature while providing practical tools for managers. By showing that data quality is not just a technical issue but a systemic one (involving systems, people, and knowledge), this study paves the way for a more sustainable, human-centric digital transformation, which aligns with the goals of Industry 5.0 [4].
However, this study has some limitations. On one hand, system integration and digital variation knowledge management were used as observed variables instead of latent variables, and there was a lack of sensitivity tests. On the other hand, the sample was limited to Chinese manufacturing enterprises, and the conclusions may have regional and industry boundaries. Future research should improve the measurement scales of SI and DVKM, conduct sensitivity analyses, and expand the sample to other industries and countries to verify the model’s universality.
Author Contributions
Conceptualization, J.W.; Methodology, J.W.; Resources, J.W.; Validation, J.W.; Writing—review and editing, J.W.; Supervision, J.W.; Project administration, J.W.; Funding acquisition, J.W.; Methodology, Z.W.; Software, Z.W.; Formal analysis, Z.W.; Data curation, Z.W.; Writing—original draft preparation, Z.W.; Visualization, Z.W.; Investigation, T.W.; Writing—review and editing, T.W.; Funding acquisition, T.W. All authors have read and agreed to the published version of the manuscript.
Funding
This research was funded by the research Project of Humanities and Social Sciences of the Ministry of Education, China (22YJA630082).
Institutional Review Board Statement
The research, titled Data Quality Improvement Supports Digital Transformation in Industry 5.0, adopts a questionnaire-based approach to conduct empirical research among enterprises. Throughout the entire process of data collection and processing, strict measures have been implemented to ensure the anonymity of participating enterprises. No identifiable corporate information, sensitive business data, or commercial interests are disclosed or involved in the research. Since the questionnaire is targeted exclusively at enterprises, the study does not touch upon issues related to personal privacy. Additionally, this research does not involve any human or animal biological experiments, nor does it utilize relevant experimental data. Pursuant to Article 32(2) of Chapter III of the Measures for Ethical Review of Life Science and Medical Research Involving Human Beings, ethical review and approval were waived for this study because the research involves the use of anonymized information and data (For details, refer to https://www.gov.cn/zhengce/zhengceku/2023-02/28/content_5743658.htm). Following the researcher’s formal commitment and the verification of relevant facts by the affiliated college, it has been confirmed that this study is not subject to the requirement of ethical approval.
Informed Consent Statement
Informed consent was obtained from all subjects involved in the study.
Data Availability Statement
The original contributions presented in this study are included in the article. Further inquiries can be directed to the corresponding author.
Conflicts of Interest
The authors declare no conflicts of interest.
Appendix A. Questionnaire
Appendix A.1. Title
Research on Enhancing Data Quality to Support Digital Transformation.
Appendix A.2. Instructions
Dear Sir/Madam,
This questionnaire aims to support corporate digital transformation by investigating the factors influencing data quality improvement and identifying pathways for enhancement. The survey results will be used solely for scientific research purposes and do not involve any commercial objectives. Rest assured that no information relating to individual enterprises will be disclosed without your consent. Thank you for your support and cooperation, and wish you good health and success.
This questionnaire comprises 20 questions and is expected to take 4–6 min to complete.
Note: Data quality refers to the extent to which a set of data meets the requirements for its intended use, including whether the data is accurate, complete, valid, etc.
Data permeates every industry and facet of life, ranging from personal information in daily existence—such as step counts, mobile top-up records, student ID/national ID numbers, and web login credentials—to operational data across all stages of business production: inventory levels, business performance metrics, machinery operating hours, and output rates.
Appendix A.3. Basic Information Questions
- Your industry sector [Multiple choice] * (* Denotes a mandatory question; same below.)
- □
- Manufacturing
- □
- Construction
- □
- Logistics and Transport
- □
- Education/Training
- □
- Internet
- □
- Computer/Software
- □
- Wholesale and Retail
- □
- Accommodation and Catering
- □
- Finance
- □
- Real Estate
- □
- Rental/Leasing
- □
- Professional Services (e.g., Legal/Consultancy)
- □
- Scientific Research
- □
- Lifestyle Services (e.g., Domestic/Hairdressing)
- □
- Healthcare/Social Security
- □
- Culture and Entertainment
- □
- Agriculture, Forestry, Animal Husbandry, and Fisheries
- □
- Water Conservancy, Environment, and Public Facilities Management
- □
- Electricity and Gas
- □
- Mining
- □
- Other _________________*
- 2.
- Your manufacturing sector [Fill-in-the-blank] *_________________________________Depends on the first option selected in Question 3
- 3.
- The geographical location of your company [Fill-in-the-blank] *_________________________________
- 4.
- Nature of your company [Single-choice question] *
- ○
- State-owned
- ○
- Collective
- ○
- Private
- ○
- Foreign-funded
- ○
- Other
- 5.
- Size of your company [Single choice] *
- ○
- <100 employees
- ○
- 100–499 employees
- ○
- 500–1499 employees
- ○
- 1500–4999 employees
- ○
- >5000 employees
- 6.
- Age of your company [Single-choice question] *Company age = 2025–Year of company establishment
- ○
- <10 years
- ○
- 10–19 years
- ○
- 20–29 years
- ○
- >30 years
- 7.
- Your company’s annual revenue [Single-choice question] *
- ○
- <500,000 yuan
- ○
- 500,000–10,000,000 yuan
- ○
- 10,000,000–50,000,000 yuan
- ○
- 50,000,000–100,000,000 yuan
- ○
- >100,000,000 yuan
- 8.
- Length of service at your current company [Single choice] *
- ○
- <1 year
- ○
- 1–5 years
- ○
- 6–10 years
- ○
- >10 years
- 9.
- Your business area [Multiple choice] *
- □
- Logistics
- □
- Finance
- □
- Human Resources
- □
- Operations
- □
- Sales
- □
- Procurement
- □
- Production
- □
- Quality
- □
- Research and Development
- □
- Technology
- □
- Administration
- □
- Other
Appendix A.4. Variable Questions
- 10.
- Digital Transformation [Matrix Scale Question] *
Please respond according to the extent to which the statements align with your company’s actual circumstances.
| Strongly Disagree | Somewhat Disagree | Undecided | Somewhat Agree | Strongly Agree | |
| The company possesses advanced information technologies such as embedded systems, cloud computing, simulation, and additive manufacturing. | ○ | ○ | ○ | ○ | ○ |
| The company has digitized its business processes and established digital-related positions or departments. | ○ | ○ | ○ | ○ | ○ |
| The company employs intelligent online platforms to interact with customers or service recipients, utilizing these platforms to collect and analyze customer or service recipient information. | ○ | ○ | ○ | ○ | ○ |
| The company’s business model is closely tied to digital operations or technologies, with digitalization driving significant performance growth. | ○ | ○ | ○ | ○ | ○ |
| The company regards digitalization as pivotal to its competitive strategy, with its digital vision widely embraced throughout the organization. | ○ | ○ | ○ | ○ | ○ |
| The company has established a digital transformation strategy and set clear, quantifiable objectives. | ○ | ○ | ○ | ○ | ○ |
- 11.
- Data Anomalies [Matrix Rating Scale Question] *
Please respond based on the extent to which the scenario aligns with actual data conditions within your operational domain.
| Strongly Disagree | Somewhat Disagree | Undecided | Somewhat Agree | Strongly Agree | |
| Data accurately reflects the real events or objects it represents. | ○ | ○ | ○ | ○ | ○ |
| The dataset contains all necessary data with no missing values. | ○ | ○ | ○ | ○ | ○ |
| Data for the same event or object is consistent across all systems in terms of values, formats, etc., with no conflicts. | ○ | ○ | ○ | ○ | ○ |
| Data collection is highly timely, typically completed shortly after the event occurs. | ○ | ○ | ○ | ○ | ○ |
| Data conforms to specified formats, types, and scopes, with no invalid data. | ○ | ○ | ○ | ○ | ○ |
- 12.
- Internal and External Integration of the Firm [Matrix Rating Scale Item] *
Please rate the extent to which the statements align with the actual circumstances of your company.
| Strongly Disagree | Somewhat Disagree | Undecided | Somewhat Agree | Strongly Agree | |
| The company has effectively integrated information technology and equipment, forming interconnected and efficiently operating systems. | ○ | ○ | ○ | ○ | ○ |
| Employees are proficient in operating, managing, and training intelligent devices, fostering a favorable human–machine interaction environment. | ○ | ○ | ○ | ○ | ○ |
| Departments collaborate closely with frequent communication, establishing an interconnected organizational structure. | ○ | ○ | ○ | ○ | ○ |
| Employee development is closely aligned with organizational growth, fostering a mutually dependent and reinforcing relationship. | ○ | ○ | ○ | ○ | ○ |
| The company maintains strong collaborative relationships with external stakeholders, cultivating a healthy business ecosystem. | ○ | ○ | ○ | ○ | ○ |
- 13.
- Employee Knowledge Application and Exploration [Matrix Scale Item] *
Please rate the extent to which the statements align with the actual situation at your company.
| Strongly Disagree | Somewhat Disagree | Undecided | Somewhat Agree | Strongly Agree | |
| Employees use their knowledge and skills in controlling data anomalies to drive incremental improvement activities. | ○ | ○ | ○ | ○ | ○ |
| Employees can apply knowledge and skills in controlling data anomalies to solve problems. | ○ | ○ | ○ | ○ | ○ |
| The company solicits employee feedback and suggestions regarding data anomaly control to drive incremental process enhancements. | ○ | ○ | ○ | ○ | ○ |
- 14.
- Knowledge Acquisition and Development in the Firm [Matrix Rating Scale Item] *
Please rate the extent to which the statements align with the actual situation at your company.
| Strongly Disagree | Somewhat Disagree | Undecided | Somewhat Agree | Strongly Agree | |
| The company can easily access new technologies for controlling data anomalies through partnerships with other companies, universities, consulting offices, etc. | ○ | ○ | ○ | ○ | ○ |
| The company invests in research and development (R&D) of new technologies for controlling data anomalies to improve or develop products/processes. | ○ | ○ | ○ | ○ | ○ |
| The company can easily introduce new technologies for controlling data anomalies in its processes or products without any great resistance to change. | ○ | ○ | ○ | ○ | ○ |
- 15.
- Employee Resilience [Matrix Scale Item] *
Please rate the extent to which the statement aligns with the actual situation at your company.
| Strongly Disagree | Somewhat Disagree | Undecided | Somewhat Agree | Strongly Agree | |
| Our employees quickly adapt to new ways of working or new tasks. | ○ | ○ | ○ | ○ | ○ |
| When necessary, our employees can easily shift their work focus. | ○ | ○ | ○ | ○ | ○ |
| Our employees adapt easily to changing circumstances. | ○ | ○ | ○ | ○ | ○ |
| Our employees are able to quickly shift their work focus and activities in response to changing organizational priorities. | ○ | ○ | ○ | ○ | ○ |
| Our employees enjoy experimenting and trying new things. | ○ | ○ | ○ | ○ | ○ |
| When faced with setbacks, our employees bounce back quickly. | ○ | ○ | ○ | ○ | ○ |
- 16.
- Employee Psychological Safety [Matrix Scale Item] *
Please rate the extent to which the statement aligns with the actual situation at your company.
| Strongly Disagree | Somewhat Disagree | Undecided | Somewhat Agree | Strongly Agree | |
| Our employees are unafraid to raise questions and tackle difficult problems. | ○ | ○ | ○ | ○ | ○ |
| When unsure how to proceed with a matter, our employees feel confident in asking one another for clarification. | ○ | ○ | ○ | ○ | ○ |
| Our employees find it difficult to approach other members of staff within the company for assistance. | ○ | ○ | ○ | ○ | ○ |
| Within our company, employees’ unique skills and talents are valued and utilized. | ○ | ○ | ○ | ○ | ○ |
| If our employees make mistakes, they are often blamed. | ○ | ○ | ○ | ○ | ○ |
- 17.
- Investment in Information Technology and Facilities [Matrix Rating Scale Question] *
Please rate the extent to which the statements align with the actual situation at your company.
| Strongly Disagree | Somewhat Disagree | Undecided | Somewhat Agree | Strongly Agree | |
| Over the past three years, the company’s capital expenditure on information technology has increased annually. | ○ | ○ | ○ | ○ | ○ |
| Over the past three years, the company’s information technology facilities have been progressively enhanced. | ○ | ○ | ○ | ○ | ○ |
| Over the past three years, the company’s investment in information technology and facilities has exceeded the industry average. | ○ | ○ | ○ | ○ | ○ |
| Over the past three years, the company’s information technology and facilities have been fully capable of meeting operational requirements. | ○ | ○ | ○ | ○ | ○ |
References
- Central Committee of the Communist Party of China, the Chinese State Council. An Outline to Boost Quality Strength. Available online: https://www.gov.cn/zhengce/2023-02/06/content_5740407.htm (accessed on 24 November 2025).
- Bitkom, V.Z. Survey Report on Platform Industry 4.0: The Industry 4.0 Implementation Strategy; J.E.T.R.O., Translator; Platform Industry 4.0 Office: Berlin, Germany, 2015. (In Japanese) [Google Scholar]
- Kai, Y. Quality in the Era of Industry 4. 0 Integrating Tradition and Innovation in the Age of Data and AI, 1st ed.; John Wiley & Sons, Inc.: Hoboken, NJ, USA, 2024. [Google Scholar]
- Maija, B.; Lars, D.N.; Athanasios, P. Industry 5.0: Towards a Sustainable, Human-Centric and Resilient European Industry; European Commission: Brussels, Belgium, 2021. [Google Scholar]
- VanDerHorn, E.; Mahadevan, S. Digital Twin: Generalization, characterization and implementation. Decis. Support Syst. 2021, 145, 113524. [Google Scholar] [CrossRef]
- Fukawa, N.; Rindfleisch, A. Enhancing innovation via the digital twin. J. Prod. Innov. Manag. 2023, 40, 391–406. [Google Scholar] [CrossRef]
- Rolando, B. Marketing Automation in E-Commerce: Optimizing Customer Journey, Revenue Generation, and Customer Retention Through Digital Innovation. J. Ilm. Manaj. Dan Kewirausahaan (JUMANAGE) 2025, 4, 566–580. [Google Scholar] [CrossRef]
- Borangiu, T.; Trentesaux, D.; Thomas, A.; Leitão, P.; Barata, J. Digital transformation of manufacturing through cloud services and resource virtualization. Comput. Ind. 2019, 108, 150–162. [Google Scholar] [CrossRef]
- Liu, Y.; Ni, Z.; Karlsson, M.; Gong, S. Methodology for digital transformation with internet of things and cloud computing: A practical guideline for innovation in small-and medium-sized enterprises. Sensors 2021, 21, 5355. [Google Scholar] [CrossRef] [PubMed]
- Lü, C.; Peng, C.; Cao, D. Ambidextrous Learning, Innovation-Driven Process, and Digital Transformation: The Moderating Role of Digital Capability. J. Syst. Manag. 2023, 32, 379. [Google Scholar]
- Zhang, H.; Huang, Q. Can Returnee Executives Promote the Digital Transformation of enterprises? Stud. Sci. Sci. 2024, 42, 778. [Google Scholar]
- Niu, L.; Chen, Z.; Liu, Z. Research on the digital transformation of small and medium-sized enterprises under the matching of resources and capabilities. Stud. Sci. Sci. 2023, 42, 766. [Google Scholar] [CrossRef]
- Ma, H.; Wang, Y. Research on the Impact of Big Data Resources on the Digital Transformation Performance of Manufacturing Enterprises. Stud. Sci. Sci. 2024, 42, 146–157. [Google Scholar]
- Dubey, R.; Bryde, D.J.; Blome, C.; Dwivedi, Y.K.; Childe, S.J.; Foropon, C. Alliances and digital transformation are crucial for benefiting from dynamic supply chain capabilities during times of crisis: A multi-method study. Int. J. Prod. Econ. 2024, 269, 109166. [Google Scholar] [CrossRef]
- Cubillas-Para, C.; Cegarra-Navarro, J.G.; Vătămănescu, E.M. Gliding from regenerative unlearning toward digital transformation via collaboration with customers and organisational agility. J. Bus. Res. 2024, 177, 114637. [Google Scholar] [CrossRef]
- Zhu, X.; Li, Y. The use of data-driven insight in ambidextrous digital transformation: How do resource orchestration, organizational strategic decision-making, and organizational agility matter? Technol. Forecast. Soc. Change 2023, 196, 122851. [Google Scholar] [CrossRef]
- Li, L.; Chen, L.; Yan, J.; Xu, C.; Jiang, N. How does technological opportunism affect firm performance? The mediating role of resource orchestration. J. Bus. Res. 2023, 166, 114093. [Google Scholar] [CrossRef]
- Chen, H.; Tian, Z. Environmental uncertainty, resource orchestration and digital transformation: A fuzzy-set QCA approach. J. Bus. Res. 2022, 139, 184–193. [Google Scholar] [CrossRef]
- Liu, X.; Chen, Z.; Ma, P. CEO with information technology background and enterprise digital transformation. China Soft Sci. 2023, 10, 121–130. [Google Scholar]
- Tang, X.; Gao, X.; Zhao, T.; Ding, S. Executive team heterogeneity and corporate digital transformation. China Soft Sci. 2022, 10, 83–98. [Google Scholar]
- Yang, S.; Song, T.; Wu, X. The institutional motivation and process of digital transformation of enterprises. Sci. Res. Manag. 2023, 44, 39–46. [Google Scholar]
- Malik, M.; Andargoli, A.; Ali, I.; Chavez, R. A socio-cognitive theorisation of how data-driven digital transformation affects operational productivity? Int. J. Prod. Econ. 2024, 277, 109403. [Google Scholar] [CrossRef]
- Liu, Q.; Kamioka, T. The effects of employees’ digital growth mindset and supervisors’ coaching behaviour on digital self-efficacy. Technol. Soc. 2025, 81, 102875. [Google Scholar] [CrossRef]
- Alabdali, M.A.; Yaqub, M.Z.; Agarwal, R.; Alofaysan, H.; Mohapatra, A.K. Unveiling green digital transformational leadership: Nexus between green digital culture, green digital mindset, and green digital transformation. J. Clean. Prod. 2024, 450, 141670. [Google Scholar] [CrossRef]
- Nasiri, M.; Ukko, J.; Saunila, M.; Rantala, T. Managing the digital supply chain: The role of smart technologies. Technovation 2020, 96, 102121. [Google Scholar] [CrossRef]
- Leino, S.P.; Kuusisto, O.; Paasi, J.; Tihinen, M. 3.3 VTT model of digimaturity. Towards A N. Era Manuf. 2017, 7, 41–46. [Google Scholar]
- Gill, M.; VanBoskirk, S. The digital maturity model 4.0. Benchmarks Digit. Transform. Playb. 2016, 22, 1–17. [Google Scholar]
- Alahmadi, M. Optimizing Data Quality for Sustainable Development: An Integration of Green Finance with Financial Market Regulations. Sustainability 2024, 16, 10418. [Google Scholar] [CrossRef]
- Redman, T.C. People and Data: Uniting to Transform Your Business, 1st ed.; Kogan Page Limited: New York, NY, USA, 2023. [Google Scholar]
- Pawanr, S.; Gupta, K. A Review of Recent Advances in the Energy Efficiency of Machining Processes for Sustainability. Energies 2024, 17, 3659. [Google Scholar] [CrossRef]
- Choi, T.M.; Luo, S. Data quality challenges for sustainable fashion supply chain operations in emerging markets: Roles of blockchain, government sponsors and environment taxes. Transp. Res. Part E Logist. Transp. Rev. 2019, 131, 139–152. [Google Scholar] [CrossRef]
- ASQ (American Society of Quality). W. Edwards Deming’s 14 Points for Management. Available online: https://asq.org/quality-resources/tqm/deming-points (accessed on 25 October 2025).
- Chiarini, A. Deming’s System of Profound Knowledge. In From Total Quality Control to Lean Six Sigma: Evolution of the Most Important Management Systems for the Excellence; Springer Science & Business Media: Milano, Italy, 2012. [Google Scholar]
- Frick, J.; Grudowski, P. Quality 5.0: A paradigm shift towards proactive quality control in industry 5.0. Asia-Pac. J. Bus. Adm. 2023, 14, 51–56. [Google Scholar] [CrossRef]
- Arsovski, S. Social oriented quality: From Quality 4.0 towards Quality 5.0. In Proceedings of the 13th International Quality Conference, Kragujevac, Serbia, 29 May–1 June 2019; Volume 13, pp. 397–404. [Google Scholar]
- Sharma, A.; Garg, C.P.; Kashav, V. Breaking the bottlenecks: A fuzzy SWARA approach to AI-ML implementation barriers in B2B industrial operations and supply chain management. J. Bus. Ind. Mark. 2025, 48, 1572–1592. [Google Scholar] [CrossRef]
- Sadiq, S.; Indulska, M. Open data: Quality over quantity. Int. J. Inf. Manag. 2017, 37, 150–154. [Google Scholar] [CrossRef]
- Miller, R.; Whelan, H.; Chrubasik, M.; Whittaker, D.; Duncan, P. A Framework for Current and New Data Quality Dimensions: An Overview. Data 2024, 9, 151. [Google Scholar] [CrossRef]
- Redman, T.C. Ensure High-Quality Data Powers Your AI. Harv. Bus. Rev. 2024. Available online: https://hbr.org/2024/08/ensure-high-quality-data-powers-your-ai (accessed on 25 October 2025).
- ISO 8000-8:2015; Data Quality—Part 8: Information and Data Quality: Concepts and Measuring. ISO: Geneva, Switzerland, 2015.
- ISO/IEC 5259-2:2024; Artificial Intelligence—Data Quality for Analytics and Machine Learning (ML)—Part 2: Data Quality Measures. 1st ed. ISO/IEC 2024: Geneva, Switzerland, 2024.
- DAMA UK Working Group. The Six Primary Dimensions for Data Quality Assessment: Defining Data Quality Dimensions. 2013. Available online: https://www.dama-uk.org/resources/the-six-primary-dimensions-for-data-quality-assessment (accessed on 25 October 2025).
- Gonzalez, R.V.D.; de Melo, D.M. The effects of organization context on knowledge exploration and exploitation. J. Bus. Res. 2018, 90, 215–225. [Google Scholar] [CrossRef]
- Braun, T.J.; Hayes, B.C.; DeMuth, R.L.F.; Taran, O.A. The Development, Validation, and Practical Application of an Employee Agility and Resilience Measure to Facilitate Organizational Change. Ind. Organ. Psychol. 2017, 10, 703–723. [Google Scholar] [CrossRef]
- Scholtes, P.R. Communities as systems. Qual. Prog. 1997, 30, 49–53. [Google Scholar]
- Kennedy, B. A 21st century appreciation for: Quality, excellence and complex human adaptive systems. TQM J. 2020, 32, 2–20. [Google Scholar] [CrossRef]
- Edgeman, R.L.; Fraley, L.A. A System of Profound Consciousness: Building beyond Deming. Total Qual. Manag. Bus. Excell. 2008, 19, 683–707. [Google Scholar] [CrossRef]
- Imran, F.; Shahzad, K.; Butt, A.; Kantola, J. Digital transformation of industrial organizations: Toward an integrated framework. J. Change Manag. 2021, 21, 451–479. [Google Scholar] [CrossRef]
- Kline, R.B. Principles and Practice of Structural Equation Modeling, 5th ed.; The Guilford Press: New York, UK, USA, 2023. [Google Scholar]
- Wu, M. Chapter 7: Scale Reliability. In Practical Questionnaire Statistical Analysis—SPSS Operation and Application, 1st ed.; Chongqing University Press: Chongqing, China, 2010; pp. 237–265. (In Chinese) [Google Scholar]
- Field, A. Discovering Statistics Using IBM SPSS Statistics, 6th ed.; Sage Publications Limited: London, UK, 2024. [Google Scholar]
- Fornell, C.; Larcker, D.F. Evaluating structural equation models with unobservable variables and measurement error. J. Mark. Res. 1981, 18, 39–50. [Google Scholar] [CrossRef]
- Gu, R.; Hu, G. Path analysis of the impact of e-government strategic management on service capability. E-Government 2012, 14, 46–60. [Google Scholar] [CrossRef]
- Wu, M. Chapter 7: Multiple-Group Analysis. In Structural Equation Modeling: Advanced AMOS Applications, 1st ed.; Chongqing University Press: Chongqing, China, 2013; pp. 250–309. (In Chinese) [Google Scholar]
Disclaimer/Publisher’s Note: The statements, opinions and data contained in all publications are solely those of the individual author(s) and contributor(s) and not of MDPI and/or the editor(s). MDPI and/or the editor(s) disclaim responsibility for any injury to people or property resulting from any ideas, methods, instructions or products referred to in the content. |
© 2025 by the authors. Licensee MDPI, Basel, Switzerland. This article is an open access article distributed under the terms and conditions of the Creative Commons Attribution (CC BY) license (https://creativecommons.org/licenses/by/4.0/).