Abstract
Evaluating transit-oriented development (TOD) efficiency in metro station areas remains challenging, as the traditional “Node–Place” model gives limited consideration to guiding factors and struggles to account for inter-regional flows under spatial heterogeneity. To address these limitations, this study develops an enhanced “Node–Place–Accessibility” model by introducing an accessibility dimension to better capture station-level connectivity and walkability. DepthmapX and a convex space approach were applied to quantify station-area accessibility, reflecting passengers’ perceived spatial distance during transfers. The model establishes a TOD measurement framework based on spatial coupling and functional connectivity, enabling the identification of factors influencing metro ridership across different spatial scales. Moran’s I was employed to describe spatial agglomeration and a local spatial clustering method integrating both passenger flow and built-environment (BE) characteristics was constructed to reveal differentiated spatial patterns. The Multiscale Geographically Weighted Regression (MGWR) model was further employed to quantify the spatially varying impacts of BE factors on ridership. Results indicate that the improved model provides stronger discriminative power in identifying “balanced stations,” and that BE conditions exert significant impact on metro ridership, particularly in areas with strong coordination among TOD components. Among the BE dimensions, design granularity exerts a more substantial impact on ridership than connectivity, density, and accessibility. This methodology provides large cities with a reliable tool for formulating targeted strategies that promote positive interactions between transportation and land use, thereby supporting sustainable urban development.
1. Introduction
With the rapid advancement of globalization and urbanization, cities worldwide confront both unprecedented opportunities and growing challenges. While urbanization has driven economic and social progress, it has simultaneously intensified problems such as traffic congestion, inefficient land use, and environmental degradation, thereby posing significant threats to sustainable urban development. To mitigate these issues, urban rail transit has increasingly been recognized as a strategic pathway toward sustainable urban transformation. This pattern appears worldwide: rail systems, for both passenger and freight transport, are expanding in many countries as a cornerstone of sustainable mobility policies, a trend documented in diverse international contexts [1]. As an efficient, low-carbon, and high-capacity public transport system, it plays a critical role in reducing congestion, optimizing spatial organization, and promoting regional integration [2,3]. Nonetheless, despite rapid network expansion, urban rail systems still encounter limitations in China, including restricted station coverage, uneven service quality, and weak coordination between transport infrastructure and land use [3,4]. The concept of Transit-Oriented Development (TOD), which integrates transport planning with land use optimization, has thus emerged as a critical strategy for promoting sustainable, compact, and resilient urban development [5,6]. TOD provides a practical framework for alleviating congestion, minimizing environmental impacts, thereby enhancing accessibility within rail-based transport systems [7,8,9,10,11,12,13].
Building on this foundation, recent research has expanded the TOD framework by incorporating dimensions of urban renewal and economic performance. For instance, Lu [14] introduced the Node–Place–Revenue (NPR) model, which integrates economic indicators into the classical node–place framework to design differentiated renewal strategies that enhance both station vitality and the efficiency of surrounding land-use. The built environment (BE) surrounding rail transit stations c represents a complex spatial system composed of buildings, infrastructure, and functional land-use configurations shaped by human activities [15]. A high-quality BE not only supports efficient socio-economic activities but also promotes user satisfaction, urban vibrancy, and overall livability [16,17,18,19,20,21]. Critical components—including accessibility, pedestrian networks, green spaces, and public facilities—play a decisive role in determining the sustainability and attractiveness of transit-oriented areas. Accordingly, understanding how BE characteristics influence metro passenger flows is crucial for achieving the objectives of sustainable and transit-oriented development [22,23].
Empirical studies demonstrate that even modest improvements in BE elements— like improved pedestrian connectivity or increased crosswalk visibility, can significantly increase transit ridership and encourage behavioral shifts [21]. Moreover, the vibrancy around metro stations varies substantially in both space and time, influenced by variations in land-use intensity, commercial activities, and network connectivity [24]. These findings highlight the need for conducting integrated analyses that consider both spatial and temporal variations in TOD performance and urban mobility patterns.
The remainder of this paper is organized as follows. Section 2 presents the literature review. Section 3 describes the study area and data. Section 4 outlines the data and methods used to analyze the spatial synergy among TOD composite index and metro ridership. Section 5 reports the main results. Section 6 discusses the key findings, limitations, and conclusions.
2. Literature Review
Examining BE characteristics surrounding rail transit stations can illuminate spatial disparities in passenger flow and land-use patterns, thereby informing differentiated, evidence-based planning strategies [25,26]. Recent research highlights that passenger flows are influenced not only by BE features but also by the spatial configuration of transit networks and broader urban morphology [15,23,27,28]. For example, Chen [18] demonstrated that integrating multi-source urban big data significantly improves TOD performance evaluations, a conclusion further supported by case studies in Nanjing and Guangzhou [23,26].
Concurrently, data-driven methodologies have garnered growing attention in TOD research. Pan [29] employed an interpretable machine learning framework to investigate the nonlinear effects of BE factors on station vibrancy in Nanjing, revealing threshold effects and heterogeneity across station types. Similarly, Li [30] applied a motif-based approach to analyze metro travel diversity in Shenzhen, demonstrating that variables such as land-use mix and residential density have significant yet spatially varying impacts on metro ridership. Collectively, these studies signal a transition toward nonlinear, multi-scale, and interpretable analytical approaches in urban mobility analysis.
International experiences provide instructive benchmarks for TOD implementation. In Europe, cities such as Copenhagen and Oslo have shifted from car-dependent urban planning to transit-oriented strategies by effectively integrating mobility and land-use policies. In Asia, Hong Kong’s High-rise Buildings and Transit-Oriented Development (TB-TOD) model concentrates high-density developments around transit hubs, thereby enhancing land-use efficiency and urban vitality—a framework that has subsequently informed similar approaches in Seoul and Guangzhou [13,21]. Despite these advancements, ensuring equitable accessibility and robust land–transport coordination continues to pose a critical challenge for sustainable urban governance [31].
Recent research has expanded the TOD discourse to encompass social and behavioral dimensions. For instance, Patnala [32] investigated gender-differentiated travel patterns in Delhi’s TOD neighborhoods, demonstrating that BE attributes and residential preferences differentially affect men’s and women’s modal choices. These findings underscore the critical importance of incorporating social equity and inclusivity considerations into TOD evaluation frameworks.
The interactions between urban rail transit and the BE have become a central focus of contemporary urban studies. Empirical evidence indicates that BE factors exert nonlinear, synergistic effects on passenger flows that vary considerably across space. For instance, Yang [33] investigated nonlinear relationships among metro corridors, land use, and urban vitality in Shenzhen, while Gan [23] and Jun [34] emphasized heterogeneous BE effects factors on passenger flows in Nanjing and Seoul. Traditional methods—such as multiple regression, structural equation modeling (SEM), and geographically weighted regression (GWR)—often fail to capture these nonlinear, multiscale interactions [15,27,35,36]. For example, Chen [37] employed an OLS model reported a higher correlation between road intersection density and station passenger flow. By contrast, advanced approaches like Multiscale Geographically Weighted Regression (MGWR) and interpretable machine—learning models have enhanced the ability to uncover spatial nonstationarity and complex relationships [38,39,40,41,42,43].
Researchers have developed advanced analytical frameworks that incorporate big data analytics and spatial clustering to improve TOD evaluation and planning [12,13,21,22,23,44,45,46]. Ding [38] and Lei [39] refined these frameworks to quantify the dynamic interactions between TOD-BE factors and station passenger flow, revealing temporal, spatial, and multidimensional characteristics. Recent studies have expanded TOD research to include economic and social dimensions. For instance, Shi [40] demonstrated that rail transit promotes spatial differentiation in housing prices, underscoring the interdependence of TOD, land use, and real estate markets. Zhang [41] built predictive models of bus stop passenger flow from surrounding land-use elements, emphasizing the need or integrated land–transport planning in TOD practice. Gao [42] utilized social media data to quantify public perceptions of metro station areas, linking objective BE attributes with subjective user experience. Similarly, Ma [19] evaluated user satisfaction in central metro stations using a combined SEM–IPA approach and identified field environment and urban aesthetics as primary determinants of satisfaction.
In assessing TOD levels, both domestic and international researchers have adopted diverse models and expanded indicator systems. Zhao [47] introduced the Node–Place–People (NPP) framework by incorporating social dimensions, whereas Wang [48] and Ibraeva [25] provided complementary econometric and review-based perspectives to evaluate the global implementation and challenges of TOD. Additionally, Lu [14] and Chen [18] refined evaluation frameworks by integrating revenue and performance indices, reflecting a growing trend toward combining economic and operational dimensions in TOD assessment. Building upon these advances, recent studies have increasingly focused on metro station classification and the identification of factors influencing passenger flows through quantitative evaluation of built environment development levels. Lu [14] proposed the Node–Place–Revenue (NPR) model, which incorporates economic value into the traditional node–place structure, and employed K-means clustering to identify differentiated renewal strategies for various station types. Chen [44] utilized six built environment indicators to classify stations and examined their relationships with passenger flows, identifying targeted directions for environmental optimization. Jiang [45] extended this research by linking multidimensional land-use parameters with passenger flow clustering outcomes using the K-Means++ algorithm, thereby developed a weighted model characterizing distinct metro station types. Similarly, Gao [46] leveraged multi-source geographic big data and an MGWR model to capture the spatial non-stationarity of built environment influences on early-morning peak passenger flows in Beijing.
Beyond the substantial body of research on the Node–Place model and its extensions, an increasing number of studies have sought to enhance TOD evaluation frameworks by improving indicator weighting methods. Traditionally, objective weighting methods such as the entropy method and principal component analysis (PCA), alongside subjective approaches like the Analytic Hierarchy Process (AHP), have been employed to quantify the relative importance of built environment indicators. Although these methods are valuable for data reduction and ensuring consistency, they often neglect spatial autocorrelation—a critical factor in understanding how built environment features cluster or disperse across urban space. Overlooking this spatial dependence may lead to biased or incomplete interpretations of TOD performance.
To overcome these limitations, the present study introduces Moran’s I as a spatially dependent weighting mechanism, allowing spatial autocorrelation to be incorporated directly into the indicator weighting process. By capturing the clustering and dispersion patterns of built environment factors, the Moran’s I–based approach provides a more spatially grounded and interpretable evaluation of TOD levels. This methodological enhancement not only bridges the gap between spatial analysis and TOD assessment but also enhances the precision and realism of station-level classification frameworks.
Recent studies on TOD and the BE around metro stations has refined both conceptual frameworks and analytical methods. Extending the classical Node–Place model, researchers have added dimensions such as economic performance and spatial accessibility to capture station-area functions more comprehensively. Methodologically, studies have moved beyond global models to approaches that account forspatial heterogeneity and nonlinear effects, including MGWR, interpretable machine learning, and spatial clustering. At the same time, growing access to the increasing multi-source urban data has enabled finer-grained assessments of station performance, transport–land-use coordination, and passenger-perceived spatial experience. Overall, the literature increasingly integrates spatial dependence, functional connectivity, and user experience into TOD evaluation, laying a firmer foundation for further methodological advances and mechanism exploration.
Despite these advances, critical research gaps remain. First, most existing studies relying on classical Node–Place frameworks fail to full capture the complex interactions among station typology, passenger flow characteristics, and land-use dynamics, which limits analytical precision. Second, spatial heterogeneity and the synergistic effects among built environment, transport service, and socio-economic dimensions are often underexplored. These shortcomings point to the need for integrated, multi-dimensional analytical frameworks that can systematically reveal the mechanisms linking metro ridership performance with its built environment.
To address these gaps, this study develops an Node–Place–Accessibility (NPA) evaluation framework and applies Multiscale Geographically Weighted Regression (MGWR) to explicitly account for spatial heterogeneity and to clarify the locally varying relationships between built-environment factors and station-level ridership. The primary innovations and contributions of this study are as follows:
(1) Introduction of the NPA model: Building on the classical Node–Place paradigm, we incorporate an accessibility dimension to refine evaluation indicators and capture the spatiotemporal dynamics of station areas, thereby enabling a more precise classification of TOD levels.
(2) Enhanced clustering and spatial functional connectivity analysis: By incorporating spatial attributes and multi-factor coupling effects, this study moves beyond traditional single-factor clustering and establishes an analytical framework that more accurately reflects the interdependent, multi-scalar character of rail transit station areas.
(3) Exploration of spatial heterogeneity using MGWR: We employ the MGWR model to identify how built-environment factors exert spatially varying influences on passenger flows, thereby revealing mechanisms behind station-level differences.
3. Study Area and Data Description
3.1. Research Area
This study focuses on Xiamen City, which operates three urban rail transit lines comprising 66 stations as of June 2023. According to the Standards for the Planning of Urban Integrated Transport Systems (GH/T51328-2018 [49]), the service radius of a rail transit station is set at 800 m [50]. To delineate the area of influence for each station (hereinafter referred to as “station areas”) while ensuring non-overlapping boundaries consistent with station-level AFC data, the Thiessen polygon method, widely used in geographical and meteorological analysis, was employed. Although this method is relatively simple, it provides a reasonable approximation of station service areas when high-resolution individual travel path data are unavailable. We acknowledge that the choice of spatial delineation may influence subsequent calculations of built environment (BE) indicators. Sensitivity analysis using more precise network-based buffers will be considered in future research when detailed travel data become accessible.
Subsequently, the measurement scales of the relevant influencing factors were computed based on these delineated areas, as illustrated in Figure 1.
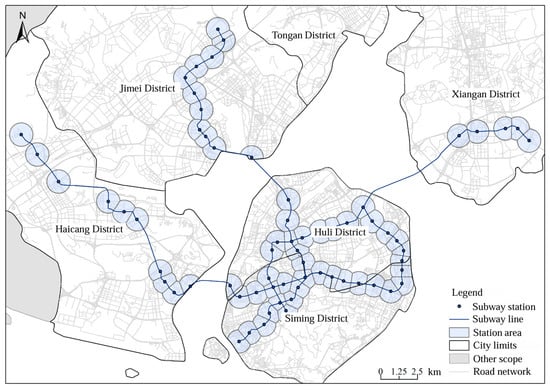
Figure 1.
Distribution of Xiamen rail transit stations and station impact areas.
3.2. Sensitivity Analysis of Spatial Delineation Methods
To scientifically determine appropriate spatial analysis units for the study area, this research first adopted an 800 m radius as the reference buffer, consistent with the 15 min walking accessibility threshold defined in the “Urban Comprehensive Transportation System Planning Standard” (GH/T51328-2018) [49] and the average station spacing in Xiamen. It is important to emphasize that this initial 800 m delineation is grounded in established walking-behavior principles rather than derived from statistical indicators. The Gini coefficient, Theil index, and standard deviation were employed only to assess the sensitivity of built-environment indicators to the Modifiable Areal Unit Problem (MAUP) under alternative spatial units, not to replace behavior-based delineation. Thus, the statistical results only verify that 800 m scale exhibits the highest stability within this study’s data structure, rather than determining the theoretically “optimal” catchment boundary.
To examine the MAUP scale effect comprehensively, five additional spatial scales—1200 m, 1400 m, 1600 m, 1800 m, and 2000 m—were introduced, yielding six spatial scale-unit groups. A three-dimensional index system covering fairness (Gini coefficient, Theil index), dispersion (standard deviation, coefficient of variation), and spatiality (Moran’s I) was constructed (Table 1). Subsequently, Principal Component Analysis (PCA) was used to integrate the multi-dimensional indicators at different scales with weights, obtained comprehensive scores and selected the optimal scale based on the analysis of the MAUP scale effect. The results indicate that the 800 m spatial scale exhibits the best balance in fairness, dispersion, and spatiality indicators, with the minimum volatility of the indicators. Therefore, this study adopts 800 m as the optimal spatial scale for subsequent analyses, while recognizing that its theoretical basis lies in walking-behavior research rather than statistical optimization.

Table 1.
Evaluation of multi-scale indicators.
3.3. Data Description
This study utilizes Automatic Fare Collection (AFC) records from the rail transit system as of June 2023, together with data on Points of Interest (POI), road network, and building characteristic datasets. Detailed data sources are outlined in Table 2. The AFC dataset provides high-resolution information on travel times, station locations, and passenger trajectories, allowing detailed analysis of passenger flows across temporal and spatial dimensions. The POI, road network, and building datasets offer essential contextual information about the urban environment and the support examination of the spatial distribution and structural patterns surrounding metro stations. By integrating these multi-source datasets, the study establishes a comprehensive basis for analyzing transit demand, travel behavior, and the spatial associations between the built environment and passenger flows.
Table 2.
Research data explanation.
4. Methodology
4.1. Principles and Enhancements of the “Node–Place” Model
Bertolini’s “Node–Place “model offers a comprehensive framework for analyzing the development intensity and coordination of TOD areas. This model systematically links transportation functions with land-use characteristics in station areas, aiding decision-makers in reaching consensus on TOD strategies. Utilizing a two-dimensional coordinate system to represent the correspondence between Node value and Place value (Figure 2), the model uses these dimensions as indicators to evaluate the spatial development performance of station areas.
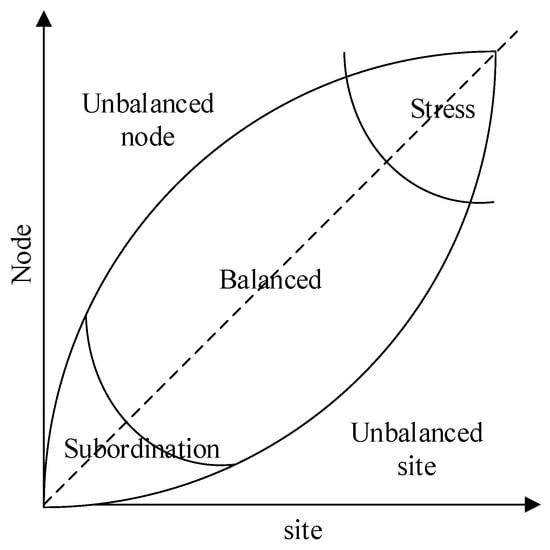
Figure 2.
Schematic diagram of the Node–Place model.
Bertolini’s classification categorizes existing stations into five types [51]:
(1) Pressure Type, located above the diagonal, where both node and place values have reached saturation, leading to resource strain caused by overdevelopment;
(2) Balanced Type, positioned along the diagonal, indicating a synergistic and well-coordinated development between transportation and land-use functions;
(3) Dependent Type, situated below the diagonal, reflecting substantial untapped potential integrating transportation and land use;
(4) Imbalanced Node Type, where transportation performance significantly exceeds land-use efficiency;
(5) Imbalanced Place Type, where land-use intensity surpasses transportation capacity, resulting in unsustainable development dynamics.
While the traditional “Node–Place” model has been widely applied to investigate TOD spatial patterns, it still encounters significant limitations in urban transportation research. Specifically, it inadequately captures ridership directionality or accounts for spatiotemporal heterogeneity across regions. These oversimplifications can lead to inaccuracies in travel demand forecasting, policy misjudgments, inequitable allocation of public transportation resources, and reduced travel convenience for residents—ultimately constraining the overall efficiency and sustainability of urban transport systems. Currently, public transport priority and complete street design have gained widespread attention, offering residents greater travel choices. Rail transit not only carries urban construction and development but also provides spaces for mobility and human activities of residents along rail corridors. Accessibility of land use around stations links isolated “nodes” and “places” through “connections” centered on human activities. However, existing models rarely simultaneously incorporate walkability and accessibility levels in modeling optimization, posing challenges in identifying balanced TOD stations.
In response to these limitations, this study incorporates an “Accessibility” dimension to the traditional framework, drawing upon the 5D principles—density, diversity, design quality, transit transfer distance, and destination accessibility. The inclusion of accessibility enables the model to better capture how spatial connectivity and travel convenience shape the functioning of metro stations within urban networks. Compared with the two-dimensional “Node–Place” model, the enhanced “Node–Place–Accessibility (N–P–A)” model expands the analytical framework into three dimensions, thereby allowing for a more comprehensive interpretation of the interplay between transportation supply, land-use development, and spatial accessibility.
As illustrated in Figure 3, the “Accessibility” dimension is conceptualized as a third axis representing orientation and mobility potential, which together describe the dynamic linkage between built environment elements and passenger flow patterns. This enhancement refines the evaluation metrics across all three dimensions by integrating the spatiotemporal dynamics of multiple influencing factors, enabling a more precise classification of station types and a more nuanced understanding of TOD coordination performance.
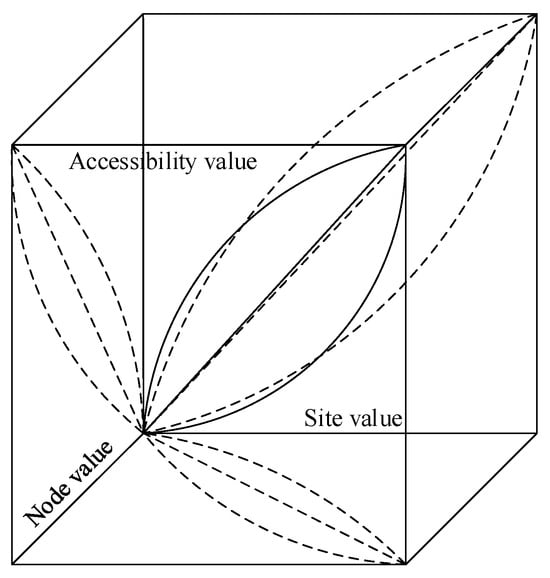
Figure 3.
Schematic diagram of the “Node–Place–Accessibility” model.
To comprehensively quantify TOD performance, Moran’s I is employed to evaluate the overall spatial autocorrelation of the composite TOD index, while Geographically Weighted Regression (GWR) is used to quantitatively assess the spatially varying effects of individual indicators on TOD patterns.
Based on comprehensive reviews of domestic and international studies [18,47,48] and considering the unique development characteristics of Xiamen ‘s metro system alongside the availability of multi-source spatial data, this study establishes a hierarchical indicator framework This framework includes eight sub-indicators and twenty-four fundamental indicators, distributed across the three dimensions of Node, Place, and Accessibility. Accessibility-related measures, including global integration, local integration, and depth values, are calculated using space syntax analysis using DepthmapX0.8.0 software. In this process, a convex space approach was employed within DepthmapX0.8.0 to construct the station-area road network and capture the connectivity and walkability of station influence zones, which also reflects the perceived spatial distance for passengers during transfers.
Spatial syntax—a method created by British Professor Bill Hillier for analyzing urban fine-scale spatial morphology and structure is adopted for calculating accessibility and walkability indicators. Its greatest advantage lies in treating urban transportation as an integrated system where changes in any local space affect other local spaces and even the city’s overall structure. Compared to other accessibility measurement methods, spatial syntax is suitable for accessibility quantification in urban rail transit lines, intra-urban blocks, and building interiors. Presently, numerous scholars have applied spatial syntax to evaluate various urban rail transit lines, validating its unique advantages in rail transit spatial accessibility research [50,52]. However, these studies predominantly use traditional axial line segmentation to describe rail transit distribution patterns, i.e., dividing each metro line into minimal connection units to study station accessibility. This method only considers accessibility of origin and transfer stations while ignoring spatial variation effects of accessibility between various line stations, often leading to imprecise evaluation results. Figure 4. illustrates the connectivity diagram generated using traditional axial segmentation for areas around Xiamen Metro; this process does not account for transfer frequency or the number of intermediate stations.
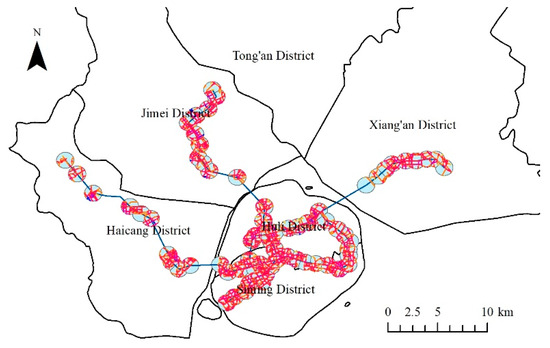
Figure 4.
Xiamen metro connectivity relationship derived from the traditional segmentation method.
Convex space segmentation (Convex Map) employs minimal and maximal convex spaces to cover the entire rail transit network space, with each convex space representing a station, analyzing spatial connection relationships between convex space stations. During transfers, passengers’ spatiotemporal distance perceptions of metro lines change across different platforms. Therefore, it is necessary to extend the original station’s convex segmentation-i.e., segmenting an additional convex space at platform B1. The connection between transfer station B’s convex space and extended convex space B1 constitutes the transfer passage. As shown in Figure 5, when no transfer is required, the extended convex space remains independent from the transfer station’s convex space. Thus, the extended convex segmentation method is reasonable from a travel perspective.
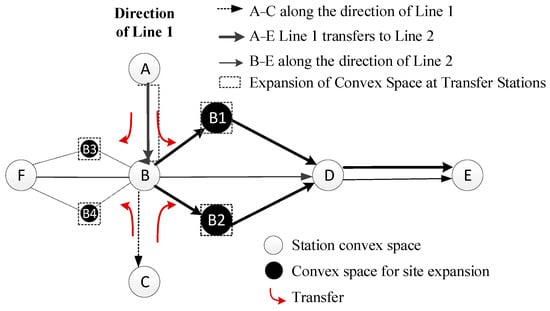
Figure 5.
Convex spatial segmentation of rail station expansion.
According to the evaluation index calculation method, the secondary indicator values the development level of cities around the rail station. The data statistics are shown in Table 3.
Table 3.
Evaluation indicators for TOD-BE development level in the impact zone of the metro stations.
4.2. Evaluation Method of the TOD Composite Index
Due to the spatial heterogeneity of urban rail transit stations, categorizing stations by their spatial and functional characteristics is crucial [53]. Traditional methods for calculating the TOD composite index and its sub-indicators, including the Analytic Hierarchy Process (AHP) and Network Analysis, frequently involve subjective determination of indicator weights. Conversely, methods like Principal Component Analysis (PCA) and the Entropy Weight Method often overlook the impact of spatial and temporal dependencies [38,39].
To overcome these limitations, the determination of indicator weights in this study relies on the Global Moran’s I (GMI) index. This approach allows the assessment of the spatial coupling relationships among indicators, thereby supporting a more objective and spatially coherent classification of stations. It is essential to clarify that the aim of this approach is not to equate the statistical “importance” of an indicator with its level of spatial autocorrelation. It is important to note that using Moran’s I as the weighting basis does not imply that spatial autocorrelation is equivalent to indicator importance. Instead, Moran’s I only reflects the degree to which each indicator exhibits spatially structured variability. Therefore, although GMI-based weighting helps capture spatial patterns, it does not replace causal inference, and this assumption may introduce certain limitations. Rather, this method assigns higher weights to indicators exhibiting strong, structured spatial patterns. Our rationale is that such spatially clustered indicators, characterized by high absolute GMI values, are more effective in revealing systematic, region-wide patterns of transit-oriented development (TOD). These patterns delineate contiguous “hot spots” or “cold spots”, which are crucial for informing coordinated spatial planning policies and infrastructure investments throughout the region. In contrast, indicators exhibiting a random spatial distribution may reflect localized, site-specific characteristics, and thus are assigned lower weights within the spatial-analytical framework.
To evaluate the sensitivity of our composite TOD scores to the weighting scheme used, we conducted a robustness check. We recalculated the composite scores using an equal-weighting scheme, where each indicator was given the same weight, and compared these results with those obtained from the GMI-based weighting method. A Pearson correlation analysis showed a very strong positive correlation (r = 0.92, p < 0.001) between station rankings under both weighting schemes. This high agreement indicates that comparative station assessment is robust, not overly dependent on the GMI-based weighting scheme.
Since the indicators vary in magnitude and unit, data standardization is first performed. For positive indicators, the normalization process is expressed as Equation (1), while negative indicators are standardized according to Equation (2):
where = standardized result, = value of the j-th station in the i-th indicator, = minimum value in the i-th indicator, and = minimum value in the j-th indicator. After standardization, the correlations among the indicators are quantified using the Global Moran’s I statistic, and its calculation formula is given as follows:
where and = values of indicators for station i and j, respectively, = mean value of the indicator for all stations, = total number of stations, and = spatial weight matrix. For the Global Moran’s I statistic, I ranges from −1 to 1. When , it indicates a positive spatial correlation. When , it shows a negative spatial correlation, and when , it indicates no spatial correlation.
Based on the magnitude of the Global Moran’s I value, the weights of the basic and secondary indicators are determined as follows:
where = weight of the j-th basic indicator in the u-th sub indicator and = weight of the u-th sub-indicator. The TOD comprehensive index for the i-th station is calculated as:
This methodology effectively integrates spatial correlation into the weighting process, ensuring that the resulting TOD composite index reflects both the magnitude of each indicator and its spatial dependence structure. This approach enhances the robustness and interpretability of station classification results. It is important to note that while GMI-based weighting captures spatially structured patterns, it may not fully reflect the significance of indicators that are critical but spatially scattered.
4.3. Site Classification Method and Correlation Analysis
4.3.1. Spatial Autocorrelation and Multicollinearity Test Methods
- (1)
- Multicollinearity Test
To mitigate the impact of excessive multicollinearity among the characteristics of the TOD built environment, this study employs two comprehensive methods: the Pearson correlation coefficient and the variance inflation factor (VIF).
① Pearson Correlation Coefficient
The Pearson correlation coefficient, denoted as r, quantifies the degree of correlation among the hypothesized independent variables, with a value ranging from −1 to 1. In the research data, a value of r ≥ 0.8 among the candidate independent variables indicates a high positive correlation. The calculation model is as follows:
0 < r < 1, indicates linear correlation relationships of different degrees:
② Variance Inflation Factor (VIF). This widely used metric assesses the severity of multicollinearity among hypothesized independent variables. A higher VIF value indicates a greater likelihood of collinearity among these variables. Specifically, when VIF is 5 or greater, it signifies a strong multicollinearity relationship among the candidate independent variables. The calculation model is:
Among them, represents the negative correlation coefficient of an independent variable with the remaining independent variables in regression analysis; represents the regression fitted value, represents the mean value of the dependent variable in the regression model; VIF represents the ratio of the variance of the estimated regression coefficients of the model to the variance when there is no linear correlation among the candidate independent variables.
Table 4 displays the results of the multicollinearity test for the characteristic variables of the TOD built environment. The findings reveal no multicollinearity among the candidate independent variables. Consequently, several key factors influencing the TOD built environment can thus be directly included in the regression model.
Table 4.
Results of multicollinearity test.
- (2)
- Spatial autocorrelation estimation
Bivariate spatial autocorrelation is frequently employed to assess the spatial correlation between two variables, typically using Moran’s I index. In this chapter, the bivariate Moran’s I extends the univariate Moran’s I, as presented in Formulas (11) and (12). Depending on its capacity to reveal regional spatial differences, it is classified into global bivariate Moran’s I and local bivariate Moran’s I. The expression for the global bivariate Moran’s index is:
In the formula, denotes the global bivariate autocorrelation index between the TOD built-environment efficiency index y and the morning peak passenger flow attribute f The variable n indicates the number of rail transit stations. signifies the value of the TOD built-environment efficiency index y for rail transit station i, while denotes the value of the morning peak passenger flow f for rail transit station. and stand for the average values of the TOD built-environment efficiency index y and the morning peak passenger flow f, respectively. Additionally, and represent the standard deviations of these two attributes. Finally, indicates the spatial weight matrix in its standardized form.
To further elucidate the spatial coupling and synergy between the operational characteristics of metro stations and the surrounding land use, this study employs the Local Moran’s I index (Anselin Local Moran’s I) to identify spatial clustering patterns and measure local spatial autocorrelation. The calculation is defined as follows:
where , , , is the Kendall index of the i-th station, taking values from −1 to 1.
4.3.2. Local Varying-Parameter Regression Model
To capture the spatial heterogeneity in the factors influencing passenger flow, the study further applies the MGWR model [38,39,40,41,42]. Unlike OLS [37] or GWR models, MGWR allows each explanatory variable to operate at its own spatial scale by using variable-specific bandwidths. This feature enhances the model’s ability to reveal the spatially varying effects of built environment factors across different stations.
The MGWR model can be expressed as follows:
where is the independent variable at location , is the regression coefficient of bandwidth , is a random error. Kernel Function: We employed an adaptive Gaussian kernel. Bandwidth Selection Method: The optimal bandwidth for each variable was determined by minimizing the corrected Akaike Information Criterion (AICc). The maximum bandwidth is set to the total sample size (n = 66), indicating that variables with larger bandwidths (e.g., “Station Area Accessibility”) function as global-scale variables. The minimum bandwidth is automatically determined by the software to ensure local calibration stability, while the initial bandwidth for each variable is obtained through AICc minimization. These bandwidth values represent the number of nearest neighboring stations used for each local regression, ensuring a consistent observation count regardless of spatial density.
The study compares the spatial patterns of Local Moran’s I clustering results with MGWR coefficient distributions to identify the degree and direction of spatial coupling between station functionality, built environment features, and passenger flow intensity. This analysis offers a foundation for refined station classification and policy formulation.
5. Empirical Research
5.1. Distribution of the Comprehensive TOD Index for Xiamen’s Rail Transit
After calculating the indicators across the three dimensions—node, place, and accessibility—the natural breaks (Jenks) classification method was applied to group stations according to their composite scores (Figure 6a). Stations with higher node index values are primarily concentrated around major transit hubs such as the Sports Center Station, Torch Hi-tech Park Station, and Lücuo Station. These locations occupy strategic positions within the rail network and exhibit strong connectivity, reflecting their importance in facilitating inter-line transfers and serving high passenger volumes. Connectivity gradually decreases from the central urban area toward the suburban and terminal sections, where stations show the weakest node characteristics. A significant contrast is observed between the island and mainland areas of Xiamen, particularly along Line 3, where the classification drops sharply from second-tier to fifth-tier stations. This pattern indicates that transportation infrastructure in Xiang’an District is relatively underdeveloped compared with the city’s overall network structure.
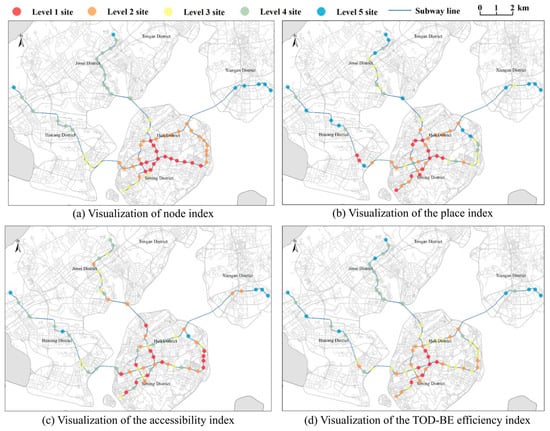
Figure 6.
Spatial characteristics of TOD composite index.
As shown in Figure 6b,c, the accessibility index and the place indices exhibit a clustered spatial distribution, with higher values concentrated in the central urban area. The spatial patterns of these indices largely overlap, particularly in Huli and Siming Districts, where the place index sometimes surpasses the accessibility index. This suggests that these districts possess a mature built environment and a well-established functional mix, effectively supporting TOD and fostering land–transport synergy. In contrast, stations located in Xiang’an, Jimei, and Haicang Districts generally exhibit lower place index values compared to accessibility scores, with several stations classified in the lowest classification tier. This discrepancy indicates that the built environments in these areas do not effectively complement transportation accessibility, underscoring the need to strengthen land development intensity, enhance functional diversity, and improve the integration of land use and transport infrastructure.
The composite TOD index (Figure 6d) reveals a clear spatial gradient extending from the central urban core to peripheral and suburban zones, illustrating the progressive attenuation of TOD levels with distance from the urban center. A comparative analysis of the composite index with the three sub-dimensions yields two key observations:
(1) Regionally, the central urban area’s limited potential for further TOD enhancement is mainly due to poor coordination between road network integration and improvements in the surrounding built environment. Conversely, peripheral areas face slower built environment, mainly constrained by low population inflow, which limits the expansion of TOD practices.
(2) From the line perspective of rail lines, Line 3 consistently has lower node and accessibility indices compared to Lines 1 and 2. This disparity underscores the need to improve station service capacity, enhance multimodal connectivity, and optimize integration with surrounding transport infrastructure to ensure balanced TOD advancement across the network.
Acknowledging the significant spatial heterogeneity among metro stations, this study employed spatial autocorrelation and high–low clustering analyses to evaluate the clustering patterns of TOD levels across different stations. As illustrated in Table 5, all three dimensions exhibit statistically significant spatial clustering, primarily marked by high-value concentrations. The strong spatial dependence observed in the comprehensive TOD index confirms its effectiveness in analyzing spatial disparities in station development levels.
Table 5.
Moran’s I and high-low clustering estimation results for each dimensional index.
5.2. Spatial Correlation Estimation
Using GeoDa1.14 software, we applied the global Moran’s I to assess spatial autocorrelation in the morning peak passenger flow at rail transit stations and various factors of the TOD built environment. To improve the robustness of the results, a Monte Carlo simulation was conducted, as detailed in Table 6. The Moran’s I values were positive and met the 5% significance threshold, suggesting significant positive spatial autocorrelation and clustering of high and low values among the study subjects. This finding implies that passenger flow at rail transit stations and the surrounding TOD built environment factors are likely influenced by neighboring stations.
Table 6.
Spatial autocorrelation estimation of ridership at metro stations and the characteristic variables of the TOD built environment.
5.3. Station Classification
This study investigates the synergy between the TOD levels of individual metro stations and their operational efficiency by incorporating empirical passenger flow data. Specifically, it calculates the mean passenger flow during morning peak hours (07:00–10:00) over a 28-day period. Traditional clustering methods like K-means, hierarchical clustering, and DBSCAN frequently neglect spatial attributes, which often neglect spatial attributes, despite their critical importance due to the high degree of spatial coupling among metro stations [45]. To address this limitation, the Local Moran’s I index was employed in ArcGIS10.8.2 to detect spatial clusters and outliers. The LISA results identify statistically significant High–High (HH) and Low–Low (LL) clusters, as well as Not Significant areas. In this study, HH and LL denote the spatial clustering of passenger flow, whereas the TOD index may be either clustered or not clustered (Not Significant). By combining these two spatial patterns, we reveal the spatial synergy (or mismatch) between operational efficiency and TOD. The results are visualized in Figure 7 and Figure 8.
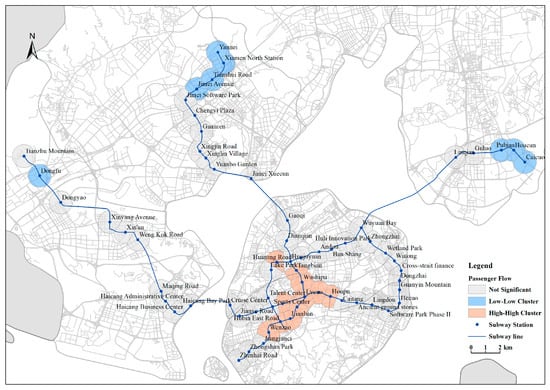
Figure 7.
Spatial aggregation characteristics of passenger flow at metro stations.
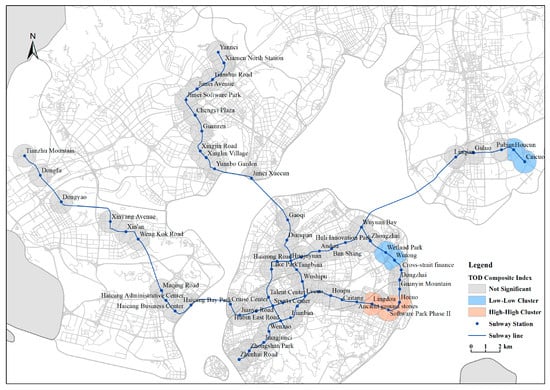
Figure 8.
Spatial aggregation characteristics of the TOD-BE efficiency index.
The synergy between station TOD levels and passenger flow led to the classification of stations into five distinct levels, as shown in Figure 9. The hierarchy of synergy is defined as Level 1 > Level 2 > Level 3 > Level 4 > Level 5.
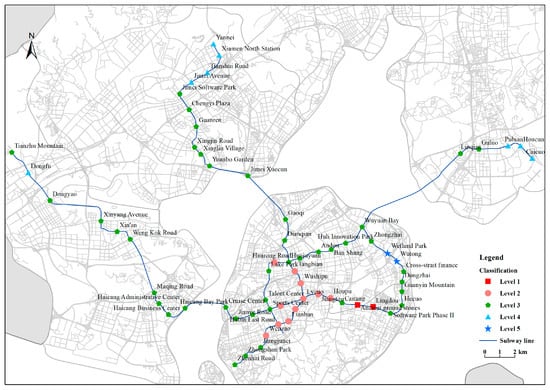
Figure 9.
Classification results of Xiamen metro stations.
Level 1 Stations characterized by high passenger flow but not significant synergy (HH/Not Significant) include three stations: Lingdou Station and Software Park Phase II Station. These stations are primarily oriented towards commercial offices and employment activities. However, they exhibit relatively low land use diversity. To improve functionality and user convenience, it is recommended to increase the provision of public facilities in the surrounding areas.
Level 2 Stations (characterized by a high TOD Index but lacking significant passenger flow and residential development, encompassing 11 stations, primarily in the city center. These stations focus more on shopping and entertainment than residential development. To enhance these areas, increasing the supply and accessibility of public transportation is recommended.
Level 3 Stations are neither significant in passenger flow nor residential development, consist of 42 stations mainly located in peripheral urban areas. Although urban development and transportation are relatively balanced here, their overall lags behind that of central stations. To boost their effectiveness, strengthening employment-oriented urban construction and improving infrastructure is suggested.
Level 4 Stations, with a low TOD Index and weak passenger flow, include 8 stations, situated at metro line terminals. These stations are primarily residential and lack strong public facility services. Enhancing land use diversity and establishing parking facilities are advisable strategies for these locations.
Level 5 Stations, identified by low passenger flow and a non-significant TOD Index (LL/Not Significant), include 2 stations situated in areas with scenic recreational spaces and upscale residential developments. These stations demonstrate limited capacity to draw in surrounding passenger traffic, so it is advisable to enhance land-use diversity in these locations.
5.4. Analysis of Variations in the Impact of the TOD Index on Station Passenger Flow
This examines study evaluated how various built environment factors influence passenger flow by comparing the fitting performance of three regression models, as presented in Table 7. The MGWR model demonstrated superior performance, achieving an R2 value of 0.545, which surpasses that of the OLS model (0.499) and the GWR model (0.445). Additionally, its AICc value of 175.790 was lower than those of the OLS (181.324) and GWR (178.483) models. Furthermore, the MGWR model’s sum of squared residuals was 30.016, less than that for the OLS (36.657) and GWR (33.092) models. These metrics collectively indicate that the MGWR model provides the best fit and effectively captures spatial heterogeneity in the dataset.
Table 7.
Comparison of model fit regression results.
The analytical results from the MGWR model are summarized in Table 8, reveal that improvements in the built environment positively influence passenger flow at rail stations. Specifically, a one-unit increase in density and design granularity results in a 43.3% and 32.4% rise in morning peak passenger flow, respectively. Additionally, a 50% enhancement in walkability and accessibility leads to increases of 14.8% and 14.4%, respectively. Furthermore, a 50% enhancement in service capacity and mixedness results in increases of 6.4% and 5.7%, respectively. Conversely, connectivity and bearing capacity show significant negative correlations with passenger flow: a 50% reduction in these factors results in increases of 15.3% and 11.4% in passenger flow, respectively. In addition, the MGWR analysis highlights the distinct spatial scales at which built-environment factors impact ridership through their varying bandwidths. Bandwidths, automatically selected by MGWR 2.2 using the Golden Section Search to minimize AICc, indicate the number of nearest stations used for local coefficient estimation. Smaller bandwidths represent more localized effects, while larger bandwidths indicate broader spatial influence. A large bandwidth for “Density” (65) suggests a global-scale influence, indicating a consistent relationship with ridership across extensive urban areas. Conversely, the much smaller bandwidth for “Mixedness” (43) points to a hyper-localized effect. This implies that the impact of land-use mix is restricted to the immediate vicinity of the station, emphasizing that its advantages are highly context-specific and necessitate precise, station-level planning interventions. The bandwidth for “Bearing Capacity” (62) suggests a regional-scale influence, indicating a more uniform effect than land-use mix but slightly more variable than density.
Table 8.
MGWR model parameter estimation results.
In particular, the bandwidth of 65 for Station Area Accessibility—nearly equal to the total sample size—indicates that this variable operates at a global scale in the MGWR model. This result is consistent with the nature of convex-space-derived accessibility, which captures the overall structural coherence of Xiamen’s road network, especially within the continuous built-up area. Consequently, its influence on ridership tends to be spatially homogeneous, leading the adaptive bandwidth procedure to treat it as a global variable.
Comparison of β values across station levels (Figure 10) indicates that the design granularity factor exerts the strongest influence on passenger flow among all examined variables. The overall ranking of influence is as follows: Design granularity > Connectivity > Density > Accessibility > Mixedness > Bearing Capacity > Service Capability > Walkability. The significant association between “design granularity” (such as building and public facility density) and ridership is supported by established urban design theory. Finer-grained, compact development enhances transit patronage through three interlinked mechanisms: by shortening walkable distances and improving station accessibility, by concentrating trip origins and destinations within the catchment area, and by creating pedestrian-oriented street environments that incentivize transit use. This aligns with prior empirical findings on the role of compact, mixed-use form in driving rail patronage [54,55]. The robustness of this relationship in our analysis underscores design granularity as a critical, actionable dimension for TOD planning.
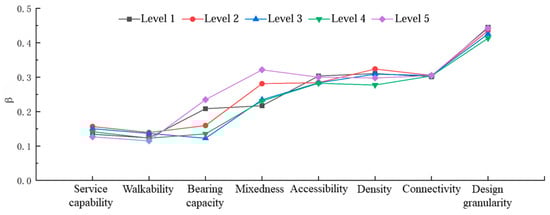
Figure 10.
Comparison of environmental factors affecting TOD construction of metro classification stations.
From a regional standpoint, the association of various factors on passenger flow is more significant in Level 5 and Level 2 stations than in other station areas, highlighting the need to strengthen capacity and mixed-use development in these areas. In contrast, Level 1 stations should prioritize improving enhancing passenger service capabilities to effectively manage high passenger volumes. The consistently dominant impact of the design granularity factor across all station levels underscores that in Xiamen’s rail transit system, promoting urban functional diversity and optimizing the surrounding built environment have a greater association on passenger flow than simply increasing station attributes or surrounding road density.
6. Discussion and Conclusions
6.1. Summary and Interpretation of Major Findings
This study utilized the MGWR model to examine the non-stationary relationships between built-environment factors and station-level passenger flow in Xiamen. The key findings highlight significant spatial heterogeneity in these relationships, emphasizing the need to move beyond global averaging models. Several major patterns emerged:
Firstly, the positive associations between the Built Environment and ridership across most stations align with established TOD theory and previous literature [56,57], underscoring the universal importance of functional diversity in promoting transit use. Secondly, and more critically, our model revealed localized, counterintuitive relationships that represent the most significant finding of this research. Specifically, the indicators of “Connectivity” and “Bearing Capacity” showed significant negative correlations with ridership in certain areas of the city.
6.2. Interpreting Counter-Intuitive Relationships: Connectivity and Bearing Capacity
The MGWR results reveal a notable and seemingly counter-intuitive negative correlation between key Node-dimension indicators—specifically “Connectivity” and “Bearing Capacity”—and station-level passenger flow. This counterintuitive finding suggests the need for a nuanced interpretation that goes beyond linear causality. We propose two plausible explanations based on the local context of Xiamen’s transit system.
First, the negative associations may indicate intra-network spatial competition, or a localized “siphoning effect” within the mature rail network. Stations with exceptionally high connectivity may generate additional trips while also drawing riders away from adjacent, less-connected stations. Consequently, increased ridership at these high-connectivity hubs could coincide with decreased ridership at their neighbors—a redistribution pattern detectable by MGWR due to its localized bandwidths, whereas a global model would obscure such variations.
Second, the finding may reflect a structural mismatch between supply-side infrastructure and actual travel demand. The “Bearing Capacity” indicator reflects the design-level supply of entrances, exits, and circulation space. Its negative correlation with ridership suggests strategic overbuilding in anticipation of future urban development, leading to temporarily underutilized capacity in emerging districts such as Xiang’an.
These mechanisms are further clarified when situated within Xiamen’s well-known spatial structure. The island districts, Siming and Huli, represent the mature urban core, with dense and diverse land use that supports strong Place attributes. In contrast, the off-island districts—Xiang’an, Jimei, and Haicang—are newly expanding areas. Their metro stations were constructed to high design standards, resulting in strong Node attributes, but surrounding land-use development lags behind. This “high-Node, low-Place, low-ridership” configuration explains the negative MGWR coefficients and reflects a lack of spatial synergy.
Importantly, the local significance of walkability and accessibility indicators varies across districts. In mature urban cores, these variables often appear significant due to well-developed street networks and pedestrian infrastructure, whereas in off-island expansion areas, their effects may be weaker or statistically insignificant due to lower street connectivity and underdeveloped land use. Similarly, the influence of mixed land use manifests at a neighborhood scale, highlighting sharp contrasts in functional diversity. Negative associations for connectivity and bearing capacity emerge where station infrastructure exceeds local travel demand.
Collectively, these findings illustrate how spatial context, network structure, and development timing shape MGWR outcomes. They do not suggest that connectivity or capacity inherently reduce ridership; rather, they reveal the context-dependent, spatially heterogeneous mechanisms governing transit performance.
6.3. Study Limitations and Future Research
Despite these insights, this study has several limitations. Data are limited to associations between station-level ridership and TOD indicators using AFC and BE data, without micro-level trip details an origin-destination context. Future studies should integrate individual surveys, mobile phone records, and subjective assessments to better capture travel behavior.
Methodologically, while the spatial-autocorrelation-based weighting offers a unique perspective, it may undervalue important but spatially dispersed indicators. Future studies could integrate expert-led subjective weighting (e.g., AHP) to complement this objective approach for a more balanced framework. MGWR and spatial clustering address spatial heterogeneity but are constrained by local linear assumptions, sensitivity to spatial scales, kernel bandwidth selection, and multicollinearity. They cannot detect non-monotonic responses, thresholds, or higher-order interactions. Advanced machine-learning models such as XGBoost, especially combined with SHAP analysis, could capture nonlinear, interaction-driven effects, identify saturation or threshold effects and assess station-specific responses. Future research will apply this method to identify the non-linear saturation effects between TOD-BE and ridership, as well as the complex interactions among BE attributes and the sensitivities across various station types. Variations in urban layout and rail infrastructure may affect results across different studies. Our research on Shenzhen Metro, akin to research on Xiamen, underscored these discrepancies. Consequently, future work will compare different cities to formulate tailored integrated development strategies for metro systems and land use.
When interpreting these findings and their policy implications, several critical limitations must be considered. The cross-sectional design of this study means that the identified relationships are merely associations and do not imply causation. Unobserved confounders, such as employment density, CBD attractiveness, or the historical sequence of station construction, may introduce endogeneity. Therefore, policy recommendations based on these correlations, like promoting “functional Design granularity” or “connectivity,” should be approached with caution. Their applicability is likely to vary significantly across different station types, urban contexts, and temporal conditions. Although the data from June 2023 generally reflects typical ridership in Xiamen, future validation with multi-seasonal data is necessary to assess temporal robustness. Additionally, applying this analytical framework to cities with differing network scales may require recalibration.
To address these limitations, future research should prioritize longitudinal or quasi-experimental designs to better identify causal mechanisms. There is also a compelling need to further explore the potential nonlinear and interactive relationship of built-environment factors on transit ridership.
6.4. Conclusions
This study uses Xiamen, China, as a case study to examine the relationship between metro station classification, passenger flow determinants, and the built environment within a TOD framework. Utilizing multi-source data collected in June 2023—including AFC data, POIs, road networks, and building footprints—an enhanced “Node–Place–Accessibility” model was developed, incorporating Global Moran’s I and the MGWR model. By adding an “Accessibility“ dimension, the proposed framework improves the traditional “Node–Place” model, offering a more accurate representation of the spatiotemporal heterogeneity of TOD characteristics. Global Moran’s I was applied to identify indicator weights and support station classification, while MGWR assessed the spatially varying relationship of the built environment on ridership.
(1) This study extends the traditional “Node–Place” model by incorporating accessibility offering a more thorough assessment of station-level TOD performance. The findings indicate a distinct spatial gradient in TOD, decreasing from the central districts to the suburbs. The urban core, characterized by dense public facilities, well-connected transport systems, and diverse functions, exhibits significantly higher TOD performance compared to peripheral areas. This gradient underscores the uneven distribution of urban infrastructure and emphasizes the necessity for coordinated regional development to foster equitable and sustainable urban growth.
(2) When stations are classified based on TOD–ridership synergy, there is a noticeable decline in both TOD performance and passenger volume across the top four station levels as one moves outward from the city center, aligning with trends seen in other major cities. However, Level 5 stations, which are mainly situated in scenic or upscale residential areas, show relatively low ridership despite their central locations. This pattern highlights Xiamen’s unique spatial characteristics and underscores the importance of context-sensitive planning strategies to enhance service provision and development potential in these areas.
(3) Comparative analysis demonstrates that the MGWR model outperforms the OLS and GWR models, providing the best explanatory capacity. The relative association of built environment factors with morning-peak ridership follows the order: Design granularity > Connectivity > Density > Accessibility > Mixedness > Bearing Capacity > Service Capacity > Walkability. Among these, design granularity shows the strongest association, suggesting that higher urban functional diversity and improved surrounding BE are linked to higher ridership, rather than implying direct causation. Hence, promoting design granularity and connectivity—particularly through integrated station design and functional layout optimization—may be considered a key strategy for sustainable rail transit development, but the effectiveness of such measures may vary across station types and spatial contexts.
Author Contributions
Conceptualization, L.J., Y.C. and S.L. (Shiyun Luo); methodology, L.J.; formal analysis, Y.C. and S.L. (Shiyun Luo); data curation, Y.C.; writing—original draft, L.J., Y.C. and S.L. (Shiyun Luo); writing—review and editing, L.J. and S.L. (Shiyun Luo); visualization, L.J. and L.Y.; supervision, Y.Z.; project administration, X.L. and S.L. (Sen Lin); funding acquisition, L.J. and Y.C. All authors have read and agreed to the published version of the manuscript.
Funding
This research was supported by grants from the Natural Science Foundation of Fujian Province (Grant No. 2024J01311872), the Philosophy and Social Science Foundation of Fujian Province (Grant No. FJ2023C038), the Philosophy and Social Science Research Project of the Education Department of Fujian Province (Grant No. JAS23030), and the Scientific Research Projects of the Fujian Provincial Department of Transportation (Grant No. ZD202506).
Institutional Review Board Statement
Not applicable.
Informed Consent Statement
Not applicable.
Data Availability Statement
Data are contained within the article.
Conflicts of Interest
The authors declare no conflicts of interest.
References
- Macioszek, E. Analysis of the rail cargo transport volume in Poland in 2010–2021. Sci. J. Silesian Univ. Technol. Ser. Transp. 2023, 119, 125–140. [Google Scholar] [CrossRef]
- Borghetti, F.; Colombo, C.G.; Longo, M.; Mazzoncini, R.; Cesarini, L.; Contestabile, L.; Somaschini, C. 15-Min Station: A Case Study in a Northern Italy City to Evaluate the Livability of an Area. Sustainability 2021, 13, 10246. [Google Scholar] [CrossRef]
- Pang, L.; Jiang, Y.; Wang, J.; Qiu, N.; Xu, X.; Ren, L.; Han, X. Research of Metro Stations with Varying Patterns of Ridership and Their Relationship with Built Environment, on the Example of Tianjin, China. Sustainability 2023, 15, 9533. [Google Scholar] [CrossRef]
- Guo, Y.; Zhu, Z.; Jiang, X.; Chen, T.; Li, Q. Analyzing the Impacts of Land Use and Network Features on Passenger Flow Distribution at Urban Rail Stations from a Classification Perspective. Sustainability 2024, 16, 3568. [Google Scholar] [CrossRef]
- Nadeem, M.; Azam, M.; Asim, M.; Al-Rashid, M.A.; Puan, O.C.; Campisi, T. Does Bus Rapid Transit System (BRTS) Meet the Citizens’ Mobility Needs? Evaluating Performance for the Case of Multan, Pakistan. Sustainability 2021, 13, 7314. [Google Scholar] [CrossRef]
- Yin, X.; Chen, J.; Li, Y. Simulation-Based Resilience Evaluation for Urban Rail Transit Transfer Stations. Sustainability 2024, 16, 3790. [Google Scholar] [CrossRef]
- Calthrope, P. The Next American Metropolis: Ecology, Community, and the American Dream; Princeton Architectural Press: Princeton, NJ, USA, 1993. [Google Scholar]
- Cervero, R. The Transit Metropolis: A Global Inquiry; Island Press: Washington, DC, USA, 1998. [Google Scholar]
- Cervero, R.; Ferrell, C.; Murphy, S. Transit-Oriented Development and Joint Development in the United States: A Literature Review; TCRP Research Results Digest; Transportation Research Board: Washington, DC, USA, 2002; Volume 52. [Google Scholar]
- Bertolini, L.; Curtis, C.; Renne, J. Station Area Projects in Europe and Beyond: Towards Transit Oriented Development? Built Environ. 2012, 38, 31–50. [Google Scholar] [CrossRef]
- Nasri, A.; Zhang, L. The Analysis of Transit-Oriented Development (TOD) in Washington, D.C. and Baltimore Metropolitan Areas. Transp. Policy 2014, 32, 172–179. [Google Scholar] [CrossRef]
- Hasibuan, H.S.; Mulyani, M. Transit-Oriented Development: Towards Achieving Sustainable Transport and Urban Development in Jakarta Metropolitan, Indonesia. Sustainability 2022, 14, 5244. [Google Scholar] [CrossRef]
- Woo, J.H. Classification of TOD Typologies Based on Pedestrian Behavior for Sustainable and Active Urban Growth in Seoul. Sustainability 2021, 13, 3047. [Google Scholar] [CrossRef]
- Lu, X.; Zhu, M.; Li, Z.; Li, Q.; Huang, S. Urban Renewal Strategy Guided by Rail Transit Development Based on the “Node–Place–Revenue” Model: Case Study of Shenyang Metro Line 1. Land 2025, 14, 1214. [Google Scholar] [CrossRef]
- Li, X.; Yan, Q.; Ma, Y.; Luo, C. Spatially Varying Impacts of Built Environment on Transfer Ridership of Metro and Bus Systems. Sustainability 2023, 15, 7891. [Google Scholar] [CrossRef]
- Liu, L.; Wang, Y.; Hickman, R. How Rail Transit Makes a Difference in People’s Multimodal Travel Behaviours: An Analysis with the XGBoost Method. Land 2023, 12, 675. [Google Scholar] [CrossRef]
- Kwon, J.H.; Cho, G.H. The Long-Lasting Impact of Past Mobility Dependence on Travel Mode Share in a New Neighborhood: The Case of the Seoul Metropolitan Area, South Korea. Land 2023, 12, 1922. [Google Scholar] [CrossRef]
- Chen, H.; Zhao, K.; Zhang, Z.; Zhang, H.; Lu, L. Methods for the Performance Evaluation and Design Optimization of Metro Transit-Oriented Development Sites Based on Urban Big Data. Land 2024, 13, 1233. [Google Scholar] [CrossRef]
- Ma, J.; Shen, Z.; Liang, P.; Zhao, Y.; Song, W. Assessing Users’ Satisfaction with the Urban Central Metro Station Area in Chengdu: An SEM-IPA Approach. Land 2025, 14, 1023. [Google Scholar] [CrossRef]
- Kim, J.; Shin, N. Planning for Railway Station Network Sustainability Based on Node–Place Analysis of Local Stations. Sustainability 2021, 13, 4778. [Google Scholar] [CrossRef]
- Huang, J.; Chen, S.; Xu, Q.; Chen, Y.; Hu, J. Relationship between Built Environment Characteristics of TOD and Subway Ridership: A Causal Inference and Regression Analysis of the Beijing Subway. J. Rail Transp. Plan. Manag. 2022, 24, 100341. [Google Scholar] [CrossRef]
- Hong, Y.; He, Y.; Zhou, J.; Li, Y.; Cui, X.; Shen, Z. Research on Compactness Ratio Model of Urban Underground Space and Compact Development Mechanism of Rail Transit Station Affected Area. Sustain. Cities Soc. 2020, 55, 102043. [Google Scholar] [CrossRef]
- Gan, Z.; Yang, M.; Feng, T.; Timmermans, H.J.P. Examining the Relationship between Built Environment and Metro Ridership at Station-to-Station Level. Transp. Res. Part D 2020, 82, 102332. [Google Scholar] [CrossRef]
- Yu, B.; Cui, X.; Li, H.; Luo, P.; Liu, R.; Yang, T. TOD and Vibrancy: The Spatio-Temporal Impacts of the Built Environment on Vibrancy. Front. Environ. Sci. 2022, 10, 1009094. [Google Scholar] [CrossRef]
- Ibraeva, A.; de Almeida Correia, G.H.; Silva, C.; Antunes, A.P. Transit-Oriented Development: A Review of Research Achievements and Challenges. Transp. Res. Part A 2020, 132, 110–130. [Google Scholar] [CrossRef]
- Li, S.; Lyu, D.; Huang, G.; Zhang, X.; Gao, F.; Chen, Y.; Liu, X. Spatially varying impacts of built environment factors on rail transit ridership at station level: A case study in Guangzhou, China. J. Transp. Geogr. 2020, 82, 102631. [Google Scholar] [CrossRef]
- Wang, J.; Wan, F.; Dong, C.; Yin, C.; Chen, X. Spatiotemporal Effects of Built Environment Factors on Varying Rail Transit Station Ridership Patterns. J. Transp. Geogr. 2023, 109, 103597. [Google Scholar] [CrossRef]
- Peng, B.; Zhang, Y.; Li, C.; Wang, T.; Yuan, S. Nonlinear, Threshold and Synergistic Effects of First/Last-Mile Facilities on Metro Ridership. Transp. Res. Part D 2023, 121, 103856. [Google Scholar] [CrossRef]
- Pan, H.; Huang, Y. TOD Typology and Station Area Vibrancy: An Interpretable Machine Learning Approach. Transp. Res. Part A 2024, 186, 104150. [Google Scholar] [CrossRef]
- Li, Z.; Tang, J.; Ji, Y.; Liang, X.; Hu, L.; Hu, C. Relationship between the Built Environment and Metro Usage Patterns: A Motif-Based Perspective. Tunn. Undergr. Space Technol. 2025, 159, 106488. [Google Scholar] [CrossRef]
- Liang, Y.; Song, W.; Dong, X. Evaluating the Space Use of Large Railway Hub Station Areas in Beijing toward Integrated Station-City Development. Land 2021, 10, 1267. [Google Scholar] [CrossRef]
- Patnala, P.K.; Parida, M.; Chalumuri, R.S. Gender Differentials in Travel Behavior among TOD Neighborhoods: Contributions of Built Environment and Residential Self-Selection. Travel Behav. Soc. 2023, 31, 333–348. [Google Scholar] [CrossRef]
- Yang, J.; Cao, J.; Zhou, Y. Elaborating Non-Linear Associations and Synergies of Subway Access and Land Uses with Urban Vitality in Shenzhen. Transp. Res. Part A 2021, 144, 74–88. [Google Scholar] [CrossRef]
- Jun, M.-J.; Choi, K.; Jeong, J.-E.; Kwon, K.-H.; Kim, H.-J. Land Use Characteristics of Subway Catchment Areas and Their Influence on Subway Ridership in Seoul. J. Transp. Geogr. 2015, 48, 30–40. [Google Scholar] [CrossRef]
- Shao, Q.; Zhang, W.; Cao, X.; Yang, J. Nonlinear and Interaction Effects of Land Use and Motorcycles/E-Bikes on Car Ownership. Transp. Res. Part D 2022, 102, 103115. [Google Scholar] [CrossRef]
- Caset, F.; Blainey, S.; Derudder, B.; Boussauw, K.; Witlox, F. Integrating Node-Place and Trip End Models to Explore Drivers of Rail Ridership in Flanders, Belgium. J. Transp. Geogr. 2020, 87, 102796. [Google Scholar] [CrossRef]
- Chen, C.; Feng, T.; Ding, C.; Yu, B.; Yao, B. Examining the Spatial-Temporal Relationship between Urban Built Environment and Taxi Ridership: Results of a Semi-Parametric GWPR Model. J. Transp. Geogr. 2021, 96, 103172. [Google Scholar] [CrossRef]
- Ding, C.; Cao, X.; Liu, C. How Does the Station-Area Built Environment Influence Metrorail Ridership? Using Gradient Boosting Decision Trees to Identify Non-Linear Thresholds. J. Transp. Geogr. 2019, 77, 70–78. [Google Scholar] [CrossRef]
- Lei, K.; Hou, Q.; Li, W.; Zhao, M.; Zhou, J.; Zhang, L.; Duan, Y. The Impact of Land Use on Time-Varying Passenger Flow Based on Site Classification. Land 2022, 11, 2189. [Google Scholar] [CrossRef]
- Shi, D.; Fu, M. How Does Rail Transit Affect the Spatial Differentiation of Urban Residential Prices? A Case Study of Beijing Subway. Land 2022, 11, 1729. [Google Scholar] [CrossRef]
- Zhang, J.; Cai, J.; Wang, M.; Zhang, W. An Estimation Method for Passenger Flow Volumes from and to Bus Stops Based on Land Use Elements: An Experimental Study. Land 2024, 13, 971. [Google Scholar] [CrossRef]
- Gao, W.; Sun, X.; Zhao, M.; Gao, Y.; Ding, H. Evaluate Human Perception of the Built Environment in the Metro Station Area. Land 2024, 13, 90. [Google Scholar] [CrossRef]
- Xu, L.; Lu, J.; Zhang, S.; Ren, G.; He, K. Subway Multi-Station Coordinated Dynamic Control Method Considering Transfer Inbound Passenger Flow. Sustainability 2024, 16, 11292. [Google Scholar] [CrossRef]
- Chen, L.; Chen, Y.; Wang, Y.; Li, Y. Research on the Classification of Rail Transit Stations and Passenger Flow Patterns—A Case from Xi’an, China. Buildings 2024, 14, 1068. [Google Scholar] [CrossRef]
- Jiang, Y.S.; Yu, G.S.; Hu, L.; Li, Y. Refined classification of urban rail transit stations based on clustered station’s passenger traffic flow features. J. Transp. Syst. Eng. Inf. Technol. 2022, 22, 106–112. [Google Scholar] [CrossRef]
- Gao, D.; Xu, Q.; Chen, P.; Hu, J.; Zhu, Y. Spatial characteristics of urban rail transit passenger flows and fine-scale built environment. J. Transp. Syst. Eng. Inf. Technol. 2021, 21, 25–32. [Google Scholar] [CrossRef]
- Zhao, Y.; Hu, S.; Zhang, M. Evaluating Equitable Transit-Oriented Development (TOD) via the Node-Place-People Model. Transp. Res. Part A 2024, 185, 104116. [Google Scholar] [CrossRef]
- Wang, X.; Xie, Y.; Xia, L.; He, J.; Lin, B. Investigating the Effect of Transit-Oriented Development (TOD) on Social Equity—Examining the Displacement of Footscray, Melbourne. Buildings 2024, 14, 824. [Google Scholar] [CrossRef]
- GH/T 51328-2018; Standards for the Planning of Urban Comprehensive Transportation Systems. China Architecture & Building Press: Beijing, China, 2018.
- Koohsari, M.J.; Kaczynski, A.T.; Mcormack, G.R.; Sugiyama, T. Using Space Syntax to Assess the Built Environment for Physical Activity: Applications to Research on Parks and Public Open Spaces. Leis. Sci. 2014, 36, 206–216. [Google Scholar] [CrossRef]
- Liao, C.; Scheuer, B. Evaluating the Performance of Transit-Oriented Development in Beijing Metro Station Areas: Integrating Morphology and Demand into the Node–Place Model. J. Transp. Geogr. 2022, 100, 103333. [Google Scholar] [CrossRef]
- Yamu, C.; van Nes, A.; Garau, C. Bill Hillier’s Legacy: Space Syntax—A Synopsis of Basic Concepts, Measures, and Empirical Application. Sustainability 2021, 13, 3394. [Google Scholar] [CrossRef]
- Sun, H.; Jiang, Y. Spatial heterogeneity of the impact of the built environment on urban vitality: A case study of Nanjing city center. Geogr. Res. 2024, 43, 1700–1714. [Google Scholar] [CrossRef]
- Bai, T.Z.; Cai, L.; Zhu, J.Z.; Lin, X. Spatial differentiation of rail transit and urban development coordination. J. Transp. Syst. Eng. Inf. Technol. 2020, 20, 18–23. [Google Scholar] [CrossRef]
- Liu, X.; Chen, X.; Tian, M.; De Vos, J. Effects of buffer size on associations between the built environment and metro ridership: A machine learning-based sensitive analysis. J. Transp. Geogr. 2023, 113, 103730. [Google Scholar] [CrossRef]
- Jiao, H.Z.; Huang, S.B.; Zhou, Y. Understanding the land use function of station areas based on spatiotemporal similarity in rail transit ridership: A case study in Shanghai, China. J. Transp. Geogr. 2023, 109, 103568. [Google Scholar] [CrossRef]
- Peng, S.Y.; Chen, S.K.; Xu, Q.; Niu, J. Spatial characteristics of land use based on POI and urban rail transit passenger flow. Acta Geogr. Sin. 2021, 76, 459–470. [Google Scholar] [CrossRef]
Disclaimer/Publisher’s Note: The statements, opinions and data contained in all publications are solely those of the individual author(s) and contributor(s) and not of MDPI and/or the editor(s). MDPI and/or the editor(s) disclaim responsibility for any injury to people or property resulting from any ideas, methods, instructions or products referred to in the content. |
© 2025 by the authors. Licensee MDPI, Basel, Switzerland. This article is an open access article distributed under the terms and conditions of the Creative Commons Attribution (CC BY) license (https://creativecommons.org/licenses/by/4.0/).