Abstract
Sustainable urban transport planning requires inclusive, high-quality mobility systems that address both user needs and broader environmental objectives. This study examines the service quality and user satisfaction of Chiang Mai University Transit using the SERVQUAL framework and structural equation modeling, based on survey data from 384 student respondents. Seven service quality dimensions—Tangibles, Reliability, Responsiveness, Assurance, Empathy, Environmental Performance, and Respiratory Disease Prevention—were systematically analyzed. The results indicate that Responsiveness has the strongest positive influence on perceived service quality, while Tangibles most significantly shape user expectations. Overall, higher service quality is found to enhance user satisfaction substantially. Nevertheless, a measurable service quality gap persists, especially in the areas of Responsiveness (gap = −0.34) and Respiratory Disease Prevention (gap = −0.26), which are identified as priority areas for targeted improvement. In contrast, Environmental Performance surpasses user expectations (gap = +0.12). These empirical insights underscore the importance of strategically investing in university transit systems to encourage modal shift away from private vehicles, reduce congestion, and improve air quality. The study provides an evidence-based foundation for policymakers and planners seeking to implement integrated and environmentally sustainable mobility strategies within both university and broader urban contexts.
1. Introduction
Public transportation plays a crucial role in enhancing teaching and learning efficiency and contributing to a healthier, more sustainable academic environment within large universities worldwide [1,2]. An efficient transit system helps reduce travel expenses, minimizes delays, and enables users to access various facilities across the campus with ease [2,3,4]. Conversely, the absence of a reliable public transportation system—particularly during peak hours between classes—can result in students missing classes or being unable to participate in diverse academic activities. Furthermore, inconvenience in service usage and safety concerns, especially in transit areas with low ridership, are significant factors that prompt most students to choose independent travel modes [5].
Although studies examining factors influencing service quality and satisfaction in the context of university public transportation serve as important indicators in many countries, research into the perceptions and expectations of public transport service quality within large Thai universities remains relatively limited. This knowledge gap is especially evident in dimensions related to environmental factors and disease prevention [3,6,7]. The prevalence of poor air quality—originating from sources such as open burning and traffic congestion—is on the rise. In March and April, Chiang Mai, Thailand, is frequently ranked among the most polluted cities in the world. Chiang Mai University, a top-tier university in Northern Thailand, has consistently been impacted by the world’s highest levels of poor air quality during the dry season for several consecutive years [8]. This widespread environmental issue significantly affects health, underscoring the critical need for research on air quality management. It also emphasizes the need to promote public transport use for intra-university travel. Given the persistently high private vehicle usage at Chiang Mai University [9], understanding students’ perceptions and expectations of CMU Transit service quality is crucial for guiding effective policy interventions.
Therefore, the primary objective of this research is to examine CMU Transit’s service quality from users’ perspectives using the SERVQUAL model. The study aims to identify factors influencing expectations and perceptions of service quality and their impact on user satisfaction, focusing on key dimensions: Tangibles, Reliability, Responsiveness, Assurance, Empathy, Environmental Performance, and Respiratory Disease Prevention.
2. Literature Review
2.1. SERVQUAL Model
The SERVQUAL (Service Quality) model, introduced by Parasuraman, Zeithaml, and Berry in 1985 [10], offers a standardized and systematic framework for the measurement and management of service quality across a wide range of industries and contexts. This model has been extensively employed to evaluate service quality in sectors such as hospitality and tourism, healthcare, banking and financial services, food and restaurant businesses, and public transportation. The model is founded on the core concept of the “gap” between users’ expectations prior to receiving a service and their perceptions after the service has been delivered. Satisfaction is achieved when perceptions meet or exceed expectations; conversely, dissatisfaction arises when perceptions fall short of expectations. By systematically assessing this gap, the SERVQUAL model has played a crucial role not only in advancing academic research on service quality but also in informing practical improvements in service delivery across diverse fields. Initially, the SERVQUAL model comprised ten dimensions of service quality. However, it was subsequently refined to five core dimensions to enhance practical applicability: Tangibles (physical facilities and equipment), Reliability (the ability to perform the promised service dependably and accurately), Responsiveness (willingness to help customers and provide prompt service), Assurance (knowledge, courtesy, and ability of employees to inspire trust and confidence), and Empathy (providing caring, individualized attention to customers) [11,12]. The SERVQUAL model has since been widely adopted across various industries to understand and improve service quality. In this study, SERVQUAL provides the theoretical foundation for evaluating service quality and user satisfaction.
2.2. SERVQUAL Model in Public Transport
The SERVQUAL model, originally developed for the business sector, has since been adapted to assess the quality of public transport services across a variety of global contexts. Luke and Heyns [5] examined public transport service quality in Johannesburg, South Africa, and identified significant issues related to safety and vehicle maintenance. Their comprehensive study revealed that safety concerns—primarily protection from crime—and inadequate vehicle maintenance, which severely undermines reliability, constituted the most critical and prevalent service gaps across all transport modes analyzed, irrespective of vehicle type. Similarly, Taran [2] assessed university shuttle services at Al al-Bayt University in Jordan and reported moderate to low levels of student satisfaction. The most pronounced negative service quality gap was observed in the tangibility dimension, referring to the physical condition and cleanliness of vehicles, closely followed by the responsiveness of the drivers. The study explicitly recommended immediate action to enhance the physical condition, comfort, and aesthetics of the shuttle buses, in tandem with driver training initiatives to improve both their willingness to assist students and their capacity to provide prompt service. Furthermore, Atombo and Wemegah [13] investigated public bus satisfaction and usage in six major Ghanaian cities, revealing substantial gaps between passenger expectations and actual service perceptions. Affordability and availability emerged as the primary determinants correlated with overall satisfaction. Consequently, the study proposed that public transport operators should focus on fare adjustments to align with passenger expectations and on expanding network coverage to enhance accessibility, thereby emphasizing that in developing regions, economic considerations and transport accessibility are often the decisive determinants of perceived service quality.
Yaya et al. [14] assessed customers’ perceived service quality in urban public transport in Girona, Spain, and confirmed that perceived service quality in bus transport comprises three principal dimensions: Functional Quality (encompassing staff friendliness, assistance, visual appeal, and the security of personal belongings), Physical Environment Quality (including on-board safety and security, temperature, space availability, and the modernity of vehicles), and Convenience Quality (pertaining to bus frequency, adequacy of routes, and schedule suitability to passenger needs). The influence of demographic factors on perceived service quality appears consistent across regions. Both Spanish and Thai studies indicate that age and possession of a driver’s license are positively associated with perceived service quality, whereas higher levels of education have a negative association. Notably, younger passengers (aged 17–24) tend to report lower perceptions of service quality compared to adults.
Additionally, a study in Thailand employing a modified SERVQUAL model—which substitutes the Empathy dimension with Access (encompassing ease of connection and appropriateness of fare)—found that the Assurance dimension yielded the largest negative gap score, indicating the highest level of dissatisfaction. This dissatisfaction was primarily attributed to significant deficiencies in on-board safety and security. Nonetheless, the Tangibility dimension was identified as the most influential factor impacting overall perceived service quality [15].
In the context of public health, a case study in England suggested that recent use of public transportation (bus/tram) may increase the risk of acquiring an acute respiratory infection requiring medical consultation, although regular users were found to face lower risks. This finding underscores the necessity for rigorous hygiene and disease prevention measures [16]. In the United States, the emphasis on maintaining good hygiene within public transport is considered vital not only for disease mitigation but also for restoring passenger confidence and encouraging ridership, given that public transit environments are frequently perceived by users as high-risk settings for viral transmission [17].
In the Asian context, studies often focus on specific transport modes and factors influencing service quality, while exhibiting diverse model modifications [18]. For example, evaluations in Malaysia indicated that Reliability was the most critical issue contributing to passenger dissatisfaction. This area exhibited the largest negative service quality gap, primarily driven by severe unpunctuality and buses failing to adhere to scheduled timetables. Compounding this operational concern, the Environment dimension was also recognized as a significant factor influencing user dissatisfaction. The negative perception in this dimension stemmed from two main issues: bothersome noise pollution and air pollution (such as CO2 emissions) from the exhaust of older bus models, both of which reduce passenger comfort and pollute the surrounding environment [19]. During the COVID-19 pandemic, disease prevention measures became an integral component of service quality. Chuenyindee et al. [6] analyzed public utility vehicle (PUV) service quality in the Philippines during COVID-19 using the SERVQUAL model with a latent variable for COVID-19 measures. They found that COVID-19 prevention measures, tangible factors, and assurances significantly affected service quality and customer satisfaction, with mask-wearing notably increasing passenger satisfaction [6]. Lai and Chen [20], though their research is situated within the context of the Kaohsiung Mass Rapid Transit (KMRT) system, provide a methodological and empirical foundation that is vital to the present study. Their work is especially relevant as it directly addresses the reviewer’s concerns regarding quantification by employing Structural Equation Modeling (SEM) to rigorously examine causal relationships. By accurately measuring path coefficients, their findings confirm that service quality has a positive effect on passenger satisfaction, thereby validating the fundamental assumptions underpinning our model. Furthermore, their inclusion of the psychological factor of involvement—which influences passengers’ behavioral intentions—offers valuable insights into user behavior in specialized transit environments, such as university campus networks.
In Thailand, Ngaosorn et al. [21] applied the SERVQUAL model to identify factors influencing perceived service quality and user satisfaction in the context of bus transportation. They found that reliability, assurance, and perceived environmental performance were key determinants positively associated with perceived service quality, subsequently affecting user satisfaction. Among these, reliability emerged as the most significant factor shaping perceptions of service quality. The findings suggest that enhancements in bus punctuality, accessibility of timetable information, quality of facilities at bus stops, driving behavior and skills, and the transition to electric buses (reflecting environmental performance) are likely to lead to improvements in both perceived service quality and overall user satisfaction.
Expanding on this, additional Thai studies have identified varied determinants across different public transport contexts. For instance, research on the Bangkok Mass Transit Authority (BMTA) public transportation system found that personal demographics (including gender, education, and occupation), along with service quality dimensions such as reliability, understanding and knowing the customer (KYC), and responsiveness, were key factors influencing overall satisfaction [22]. Furthermore, investigations into the propensity to use electric public bus services in Bangkok indicated that marketing mix factors—specifically price and the service environment (physical evidence)—were statistically significant in shaping consumer decision-making, aligning with the perception that electric vehicles can reduce air pollution [23]. These varied findings underscore the importance of addressing both core operational quality (reliability and responsiveness) and contemporary factors, such as environmental performance and specific health measures, in the context of Thai urban transport.
Although the SERVQUAL model has been widely utilized worldwide to assess service quality across various domains, prior studies highlight the diverse factors influencing the quality of public transport services and emphasize the growing significance of air pollution as a contemporary challenge—particularly in large cities with persistently poor air quality. The impact of air quality on public transport services is a significant international concern, affecting satisfaction and perceived service quality. Research indicates that travel patterns and vehicle types influence personal dust exposure levels. For instance, enclosed travel by air-conditioned buses and the use of low-emission vehicles contribute to lower indoor dust concentrations due to effective filtration systems [24,25]. Dust concentrations at bus stops are also significant, often exceeding those in surrounding areas [26]. These findings align with research highlighting vehicle exhaust as a primary source of poor air quality and the effects of exposure to these particulates on respiratory health [24].
Nevertheless, existing research on public transportation in Thailand has yet to systematically evaluate service quality with respect to the impacts of air pollution and respiratory infectious diseases, nor has it examined preventive measures aimed at mitigating such risks for public transport users, which may significantly influence user satisfaction. To address this gap, the present study is the first in Thailand to extend the SERVQUAL model by incorporating dimensions related to air pollution and respiratory infectious diseases. This approach is applied specifically to Chiang Mai, the country’s second largest city, where severe air pollution is a recurring concern and is expected to profoundly affect users’ perceptions and satisfaction.
2.3. Air Pollution in Northern Thailand
Air pollution resulting from persistently poor air quality constitutes a severe and ongoing environmental and public health crisis in northern Thailand. This issue is particularly pronounced in Chiang Mai, where concentrations of key pollutants frequently surpass the safety thresholds established by the World Health Organization (WHO), placing the population at considerable risk for adverse health outcomes [8]. The severity of this crisis is regularly communicated to the public through the Air Quality Index (AQI), as reported by the Pollution Control Department. The AQI, which is based on the concentrations of six major pollutants—PM2.5, PM10, carbon monoxide (CO), ozone (O3), nitrogen dioxide (NO2), and sulfur dioxide (SO2)—serves as an essential tool for assessing health risks associated with air quality. Elevated AQI levels commonly signal hazardous conditions that necessitate the use of protective measures and limitation of outdoor activities, especially among vulnerable populations [27]. In Chiang Mai province, primary sources of air pollution stem from the open burning of agricultural residues, both within the country and from neighboring countries, as a means to prepare land for subsequent cultivation cycles. This practice is widely adopted by farmers due to its convenience and low cost; however, it has significant detrimental impacts on air quality, contributing to increased levels of air pollution, particulate matter, and toxic gases. For example, during the dry season (February–April), agricultural burning and transboundary pollution from neighboring countries such as Myanmar and Laos are the main contributors [28,29]. Outside the dry season (May–October), vehicle and urban emissions predominate [28,30]. Such exposure has significant health consequences, with studies confirming a direct link between increased PM2.5 concentrations and higher hospitalization rates for respiratory and cardiovascular diseases [31].
Recognizing this escalating crisis, Thailand has begun developing policy and legal mechanisms to systematically address the issue, drawing on international principles such as the U.S. Clean Air Act [32]. The government is actively pursuing revisions to ambient air quality standards for key pollutants to make them consistently stricter [33]. To strengthen pollution control, any area where air quality exceeds standards, and the AQI reaches hazardous levels, is designated a “Nonattainment Area” and is subject to strict control measures. These measures include requiring industrial plants and vehicles to implement emission control plans and restricting dust-generating activities [34].
Ongoing efforts also involve advocating for a “Draft Clean Air Act for Health” [35] to establish a comprehensive legal framework for integrated air pollution management, tightening the country’s air quality standards [36], and implementing source-control measures, such as a “no burning” policy during the haze season. However, the enforcement of these measures continues to face challenges, including persistent gaps in the legal framework and the complexity of transboundary air pollution, which requires regional cooperation under the ASEAN Agreement on Transboundary Haze Pollution [37]. These enduring air pollution problems directly affect the campus environment and public transportation users in Chiang Mai, highlighting the urgent need for effective mitigation measures.
2.4. The Research Hypotheses
This study proposes a research framework with nine interconnected dimensions, as illustrated in Figure 1. The conceptual framework integrates the five SERVQUAL dimensions with environmental performance and respiratory disease prevention. These seven factors are hypothesized to directly influence perceived service quality, which, in turn, affects user satisfaction. This framework reflects both traditional service quality attributes and the growing importance of environmental and health considerations in public transportation.
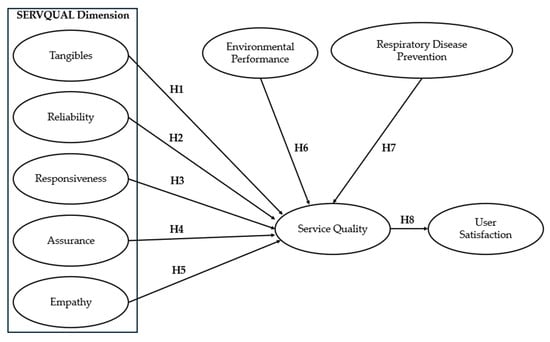
Figure 1.
Conceptual Framework.
H1.
Tangibles have a significant direct effect on Service Quality.
Tangibles represent the dimension of service quality assessed through perceptible physical attributes, such as facilities and equipment [12]. In public transportation, this includes cleanliness, vehicle condition, seat comfort, and station aesthetics [38]. Previous studies have found that Tangibles positively correlate with perceived service quality [6,7]. Specifically, in-vehicle factors such as space and cleanliness significantly impact overall service quality [6] and, in turn, lead to higher user satisfaction [7].
H2.
Reliability has a significant direct effect on Service Quality.
Reliability measures the service provider’s ability to deliver promised services, including punctuality and consistency [11]. A reliable public transportation system is crucial for overall efficiency [1,2]. It has been found that Reliability positively affects perceived service quality [21,38,39] and is a key determinant influencing overall service quality [21]. Furthermore, Reliability also indirectly impacts user satisfaction [39].
H3.
Responsiveness has a significant direct effect on Service Quality.
Responsiveness evaluates staff’s willingness and readiness to provide prompt, efficient service to passengers [11]. Staff responsiveness positively impacts perceived service quality [40], particularly when passengers require assistance or have questions, thereby fostering a positive impression and satisfaction. Moreover, Responsiveness can indirectly influence user loyalty, making passengers more likely to reuse the service and recommend it to others [41].
H4.
Assurance has a significant direct effect on Service Quality.
Assurance assesses the knowledge, capabilities, and professionalism of service providers to build passenger trust [11]. In public transportation, this includes drivers’ competence and staff knowledge of routes and schedules [21]. Safety concerns, such as protection from crime, are also crucial factors [5]. Previous studies have shown that Assurance positively impacts perceived service quality [21,38,39].
H5.
Empathy has a significant direct effect on Service Quality.
Empathy measures the extent to which service providers offer care and individualized attention to each passenger, including providing assistance and understanding specific needs [11]. Empathy affects perceived service quality [38,39]. When passengers feel that providers are attentive and understanding, it generally leads to a positive impression and overall satisfaction.
H6.
Environmental Performance has a significant direct effect on Service Quality.
Environmental Performance is an increasingly important factor in the perceived quality of public transportation services, especially as the public becomes more environmentally conscious. The use of eco-friendly systems, such as electric buses, helps reduce pollution and has positive health impacts on local communities [7]. Research has demonstrated a positive relationship between Environmental Performance and perceived service quality [7,21]. Environmentally aware users are more likely to prioritize eco-friendly public transportation services and rate their quality higher compared to fossil fuel-based systems.
H7.
Respiratory Disease Prevention has a significant direct effect on Service Quality.
Preventing respiratory disease is crucial to maintaining public transport service quality. Implementing robust preventive measures helps reduce adverse health impacts and builds passenger confidence, both of which are key factors in perceived service quality. For example, the use of face masks is considered an important measure that enhances passenger satisfaction [6,17]. In addition, improvements in air quality management, such as reducing poor air quality levels, significantly contribute to passenger satisfaction. Traveling in air-conditioned buses may expose passengers to lower concentrations of dust particles due to filtration systems [24], and the use of low-emission vehicles also helps reduce air pollution [25]. In summary, such measures enhance service quality by fostering passenger confidence and satisfaction [24,42].
H8.
Service Quality has a significant direct effect on User Satisfaction.
User satisfaction and service quality are closely related, with higher service quality leading to greater satisfaction [21,39,43]. An efficient public transportation system helps reduce costs and travel time and increases accessibility to services, all of which contribute to overall user satisfaction [2,3].
3. Materials and Methods
3.1. Sampling and Data Collection
This study was conducted at Chiang Mai University and covered all 12 service routes of the Chiang Mai University Transit (CMU Transit), as illustrated in Figure 2a. These routes comprised nine in the Suan Sak area (Suthep sub-district), totaling 31.3 km; two in the Suan Dok area (Sri Phum sub-district), totaling 11 km; and one in the Mae Hia area (Mae Hia sub-district), totaling 16 km. All routes are located within Mueang Chiang Mai District, Chiang Mai Province.
CMU Transit operates as an electric mini-bus system, as shown in Figure 2b. Each bus is equipped with fans for passengers and can accommodate up to 16 people. The average travel time per round trip ranges from 10 to 30 min [9]. The target population for this study comprised students utilizing the CMU Transit service.
A pilot survey was conducted with 60 student users of the CMU Transit system to assess the clarity and reliability of the questionnaire, the estimated completion time, and respondents’ comprehension of the survey items. Based on feedback from the pilot participants, minor revisions were implemented to enhance clarity, particularly for items identified as ambiguous, prior to the main data collection.
Subsequently, the main survey was administered to a screened sample consisting exclusively of actual CMU Transit users. Following data collection, a validation process was conducted to identify and eliminate careless or contradictory responses. Specifically, cases were detected in which highly correlated items, such as “Res2: The travel time by CMU Transit is satisfactory” and “SQ5: Overall, the CMU Transit can deliver passengers to their destination on time,” showed substantially divergent answers from the same respondent. Responses displaying this type of inconsistency were excluded from the final dataset.
Afterwards, the dataset was examined for normality and multicollinearity. The results indicated an approximately normal distribution. Variables exhibiting excessively high correlations (greater than 0.8) were excluded to address multicollinearity concerns. Sampling adequacy was confirmed by a Kaiser-Meyer-Olkin (KMO) value of 0.918. The final version of the questionnaire demonstrated acceptable internal consistency, with a Cronbach’s alpha of 0.82.
After all these procedures, a total of 384 valid responses remained for analysis. This sample size exceeds the commonly recommended minimum threshold of 200 for Structural Equation Modeling (SEM) [44,45,46] and also exceeds the criterion for significant factor loadings (n ≥ 350) as recommended by Hair et al. [45], which is particularly important given the complexity of the models in this study. The SEM framework employed included nine latent variables across two separate models: a Perception Model and an Expectation Model.
Data collection was primarily conducted at the main stations, T1 and T2, as depicted in Figure 2a. As major transportation hubs, stations T1 and T2 are conveniently located within the student dormitory area, ensuring easy access. Students can reach these hubs by walking, cycling, motorbike, or private car. With available parking, these stations facilitate quick and seamless connections to the CMU Transit electric bus service.

Figure 2.
CMU Transit System Components. (a) CMU Transit Map showing the 12 service routes and the main stations (T1: Central Station, T2: CMU Public Transportation Center), which were used as the data collection points [47]; (b) CMU Transit, an electric mini-bus operating within Chiang Mai University [48].
3.2. Measurement Instrument
The questionnaire was divided into two main sections. Part 1 comprised questions about users’ general information, such as gender, age, education level, private vehicle ownership, frequency of CMU Transit use, and purpose of use. Part 2 contained items designed to measure service quality and satisfaction, assessed from both pre-service expectations and post-service perceptions among CMU Transit student users. The questionnaire consisted of 65 items across nine latent dimensions: Tangibles (13 items), Reliability (10 items), Responsiveness (5 items), Assurance (9 items), Empathy (5 items), Environmental Performance (5 items), Respiratory Disease Prevention (7 items), Service Quality (8 items), and User Satisfaction (3 items). All items were rated using a 5-point Likert scale (1 = strongly disagree; 5 = strongly agree). To ensure reliability, Cronbach’s Alpha coefficient (α) was calculated for each scale. Generally, a Cronbach’s Alpha value greater than 0.7 is considered acceptable [49].
3.3. Data Analysis
To achieve the research objectives, both Confirmatory Factor Analysis (CFA) and Structural Equation Modeling (SEM) were employed. This analytical framework was adopted to examine relationships among service quality dimensions and to determine the influence of service quality on the satisfaction of CMU Transit student users. The analysis utilized data from both the Perception Model and the Expectation Model of service users.
3.4. Factor Analysis
Confirmatory Factor Analysis (CFA) was conducted to assess the validity of the measurement model for both perceptions and expectations of service quality among CMU Transit student users. The primary objective was to verify that the questionnaire items reliably represented the latent constructs within the adapted SERVQUAL framework, which includes Environmental Performance and Respiratory Disease Prevention as additional dimensions. This analysis is a crucial step to confirm that the specific survey items (observed variables) collected are accurately grouped under the seven hypothesized service quality dimensions (Tangibles, Reliability, Responsiveness, Assurance, Empathy, Environmental Performance, and Respiratory Disease Prevention) as intended by the conceptual framework. Establishing the construct validity of the measurement instrument through CFA is an essential prerequisite before assessing structural relationships using SEM. By validating the measurement tool, we ensure that the causal relationships analyzed in the subsequent step are based on reliable and accurate measures.
Subsequently, Structural Equation Modeling (SEM) was applied to investigate the structural relationships among the seven core service quality dimensions (Tangibles, Reliability, Responsiveness, Assurance, Empathy, Environmental Performance, and Respiratory Disease Prevention) and their effects on overall service quality. The analysis then examined how overall service quality influences the satisfaction of CMU Transit student users. Both the Perception Model and the Expectation Model were analyzed to provide comprehensive insights into how these factors affect users’ perceived quality and satisfaction.
4. Results
4.1. Participants
Analysis of data from the 384 CMU Transit users revealed that the majority of respondents were female (71.09%), while male students accounted for 28.91% of the sample. The most common age groups were 19 years (32.03%), 20 years (26.56%), and 18 years (13.80%). Most participants were undergraduates (97.14%), with only 2.86% pursuing a Master’s degree. First-year students made up the largest group (43.23%), followed by second-year students (32.29%).
Regarding vehicle ownership, most participants (53.39%) owned a motorbike. Students without a personal vehicle accounted for 28.39%, followed by bicycle owners (7.29%), car owners (6.77%), and those with both a motorbike and a car (4.17%). Regarding the primary mode of transportation, 62.24% reported using a motorbike, while 25.26% used CMU Transit. The main reason for using CMU Transit was for academic-related purposes (87.76%). The primary motivations for choosing CMU Transit were “wanting to try” (28.9%) and “not having a personal vehicle” (26.0%), followed by “insufficient parking” (19.3%).
4.2. CMU Transit Service Quality Gap
The Service Quality Gap (Q) assesses the discrepancy between what students expect from CMU Transit and what they actually receive. This measurement is critical for identifying areas requiring improvement to enhance overall service quality. The gap is calculated as the difference between the mean perception score (Ei) and the mean expectation score (Xi) for each item and latent factor (Q = Ei − Xi), as presented in Table 1.

Table 1.
CMU Transits Service Quality Gap.
For CMU Transit, the overall service quality gap across dimensions is −0.18, indicating that students’ expectations are generally slightly higher than their perceptions of the service received. This negative gap highlights the importance of understanding and addressing discrepancies between anticipated and actual service experiences. The detailed results in Table 1 reveal specific strengths and weaknesses of each service attribute.
The Responsiveness factor exhibits the largest negative gap (−0.34), indicating a significant area for improvement. Notably, items such as “There are enough CMU Transit vehicles available during rush hours” (Q = −0.53) and “The driver can stop at a location I request (other than the designated stops)” (Q = −0.36) show particularly large gaps, emphasizing a critical structural bottleneck (vehicle shortage) and substantial unmet demand for increased vehicle availability and more flexible pick-up/drop-off options. The Respiratory Disease Prevention factor also shows a notable negative gap of −0.26. For example, “There is an air purifier inside the CMU Transit” (Q = −0.34) and “Alcohol gel is available for hand cleaning inside the CMU Transit and at the stops” (Q = −0.32) reflect a strategic failure to address the local air quality and hygiene concerns, indicating a clear need to strengthen health and hygiene measures related to air quality and sanitation within the shuttle service.
Additionally, the Reliability factor shows a notable negative gap (−0.14), suggesting a shortfall in the service’s ability to deliver the promised service accurately and dependably. The item “The CMU Transit is punctual and arrives at the stop as scheduled” (Q = −0.25) is the primary driver of this gap, indicating that untimely arrivals/departures erode user trust. The lack of real-time communication is also a contributor: “Notifications of schedule changes or service issues are provided via the mobile application” (Q = −0.18) reflects the need to strengthen communication systems to enhance perceived reliability.
Although the overall gap for the Tangibles factor is −0.12, this dimension is crucial as it most significantly shapes users’ expectations. Some items reveal significant negative gaps, such as “The CMU Transit is equipped with air conditioning” (Q = −0.52), representing a severe mismatch with the expectation for basic physical comfort, “Wi-Fi is available inside the CMU Transit,” and “There is space for carrying personal bags or heavy luggage” (Q = −0.30). These results suggest that the in-vehicle environment and technology are not meeting student expectations.
Conversely, Environmental Performance demonstrates a positive gap of +0.12. Items such as “The driver does not ‘rev the engine’ while parked” (Q = +0.16), “While driving, the driver does not accelerate harshly or drive too fast,” and “CMU Transit electric vehicles can reduce noise pollution more than gasoline or gas vehicles” (Q = +0.13) are clear evidence that the adoption of electric vehicles is actively recognized and valued by users, confirming CMU Transit’s strong Environmental Performance. The Assurance factor exhibits the smallest positive gap at +0.09, with items such as “The driver waits until passengers have safely boarded or alighted before departing” (Q = +0.14) and “The driver follows traffic rules, such as obeying speed limits and yielding at roundabouts” (Q = +0.11), reflecting students’ confidence in the drivers’ knowledge and courtesy.
Overall, while CMU Transit generally meets student expectations regarding Environmental Performance and Assurance, there is an urgent need for improvements in responsiveness, certain tangible facilities, and measures to prevent respiratory diseases and improve air quality. Addressing these areas is crucial for reducing service quality gaps and enhancing overall student user satisfaction.
4.3. Construct Reliability and Validity
A Confirmatory Factor Analysis (CFA) was conducted to validate the measurement models for both the Perception Model and the Expectation Model. This analysis confirmed that the latent factors were measured reliably and consistently, in alignment with the enhanced SERVQUAL model that incorporates Environmental Performance and Respiratory Disease Prevention.
Convergent validity was assessed using Composite Reliability (CR) and Average Variance Extracted (AVE), with recommended thresholds of CR ≥ 0.70 and AVE ≥ 0.50 [45,50]. These criteria are used to confirm that the multiple items intended to measure the same latent dimension are highly correlated and truly measure the intended concept (convergent validity). As shown in Table 2, Alpha, CR, and AVE values for both models were within acceptable ranges. Specifically, for the Perception Model, Alpha ranged from 0.71 to 0.85, CR from 0.71 to 0.86, and AVE from 0.52 to 0.75. For the Expectation Model, Alpha ranged from 0.72 to 0.89, CR from 0.74 to 0.89, and AVE from 0.58 to 0.80. These results confirm that the questionnaire items effectively measured their intended constructs. Additionally, most standardized factor loadings for the observed variables exceeded 0.40 (see Table 2), indicating a strong relationship with their respective latent factors [45]. This value demonstrates that each survey item is sufficiently related to the underlying construct it was designed to measure. Both proposed models demonstrated statistically significant fit with the empirical data, and their factor structures were consistent with the collected data (p-value < 0.05) [51].
Table 2.
Standardized factor loadings, composite reliability, and average variance extracted results for perception and expectation measurement models.
Model fit was further evaluated using goodness-of-fit indices. According to standard criteria, a good model fit is indicated by Chi-Square/DF < 3 [46], GFI ≥ 0.90 [46], RMSEA < 0.08, and CFI, NFI, TLI > 0.90 [52]. The results showed that both models fit the data well. The Perception Model exhibited a good fit (Chi-Square = 498.540, DF = 221, Chi-Square/DF = 2.256, GFI = 0.901, RMSEA = 0.057, CFI = 0.943, NFI = 0.902, TLI = 0.928), as did the Expectation Model (Chi-Square = 553.713, DF = 265, Chi-Square/DF = 2.089, GFI = 0.900, RMSEA = 0.053, CFI = 0.956, NFI = 0.920, TLI = 0.946). All indices were within acceptable ranges [46,52].
4.4. Structural Model and Hypothesis Testing
A Structural Equation Model (SEM) was constructed to examine the structural relationships and direct effects of seven latent factors within the service quality construct on the Service Quality factor, as well as the influence of Service Quality on User Satisfaction. The results, presented in Table 3, display the standardized path coefficients for each structural relationship.
Table 3.
Standardized Factor Loadings for Structural Relationships in Perception and Expectation Models.
The analysis revealed that service quality had a direct and substantial effect on user satisfaction in both models. The standardized coefficients were 0.79 in the Perception Model and 0.81 in the Expectation Model, indicating a strong relationship in both cases.
A key insight from the analysis is that the factors influencing users’ perceptions of service quality differ from those affecting their expectations. In the Perception Model, Responsiveness exhibited the most significant direct positive effect on service quality (standardized coefficient = 0.34). In contrast, in the Expectation Model, Tangibles was the most influential factor shaping user expectations (standardized coefficient = 0.43). This finding highlights a clear distinction between the determinants of perception and expectation: Responsiveness plays a crucial role in shaping users’ actual perceptions of service quality, whereas Tangibles primarily determine user expectations. This suggests that, in actual service experience, speed and efficiency are most crucial for achieving satisfaction. At the same time, expectations are shaped mainly by the physical facilities and overall quality of the transportation system.
5. Discussion
This research aimed to assess CMU Transit’s service quality from the perspective of student users. An adapted SERVQUAL model was applied to identify factors influencing both perceptions and expectations of service quality, which, in turn, affect user satisfaction. The study’s findings provide valuable insights for improving CMU Transit services and promoting sustainable transportation within the university.
The initial analysis indicates that students’ overall expectations for CMU Transit service exceeded their actual perceptions by an average of 0.18. This highlights clear potential for improvement, with the Service Quality construct revealing structural issues contributing to this gap, such as seating adequacy, timeliness, and the management of air quality measures for users. A closer look at the quality gap in each dimension reveals several critical areas requiring immediate improvement. The Responsiveness dimension exhibited the most significant negative gap (−0.34), particularly regarding the sufficiency of vehicles during peak hours and the flexibility of CMU Transit stops to accommodate passenger needs. This emphasizes that the core operational speed and efficiency are severely compromised by resource bottlenecks, aligning with other public transportation research that emphasizes the importance of responsiveness to user needs [13,40].
Furthermore, the Respiratory Disease Prevention dimension also showed a notable negative gap (−0.26), particularly regarding the availability of air purifiers and alcohol gel in vehicles. This gap signals a strategic failure to proactively address contextual threats posed by poor air quality and hygiene concerns, reflecting users’ increased awareness of current hygiene and environmental issues [6,24]. The Tangibles dimension showed a negative gap (−0.12), related to factors such as the lack of air conditioning, in-vehicle Wi-Fi, luggage space, and insufficient seating at CMU Transit stops, suggesting a severe mismatch between basic comfort expectations (such as air conditioning) and service delivery. Additionally, the Empathy dimension demonstrated a small negative gap (−0.01), primarily due to users seeking greater driver flexibility for pick-ups and drop-offs at non-designated locations, as well as greater staff attentiveness in resolving reported issues. This supports existing research showing that individualized care and attentiveness directly impact perceived service quality [38,39]. Similarly, the Reliability dimension had a minimal negative gap (−0.14), suggesting opportunities to build greater user trust by improving punctuality and communication. The primary drivers of this deficit are the failure to deliver consistent service (timeliness) and the lack of real-time communication, such as updates via the application. This finding is consistent with previous studies that identify reliability as key to service quality and overall system efficiency [1,2,21].
In contrast, the Environmental Performance dimension showed a positive gap (+0.12), indicating that CMU Transit performs well in terms of environmentally friendly qualities that users both value and recognize [7,21]. This positive perception is strongly linked to CMU Transit’s use of electric vehicles (EVs), which users notice due to their quieter operation and absence of exhaust fumes. The adoption of EVs helps improve the campus environment and mitigate poor air quality. Similarly, the Assurance dimension shows a slight positive gap (+0.09), reflecting users’ confidence in drivers’ knowledge and courtesy [39]. This trust may result from Chiang Mai University’s implementation of service standards and driver training, emphasizing strict adherence to traffic laws and prioritizing student safety during boarding and alighting.
The results from the Confirmatory Factor Analysis (CFA) confirm the validity and reliability of the SERVQUAL model, including the additional dimensions of Environmental Performance and Respiratory Disease Prevention. This finding is consistent with previous research that has adapted SERVQUAL to various contexts [14,53]. The good model fit indices (e.g., χ2, χ2/df, GFI, RMSEA, CFI, TLI, NFI) and high standardized factor loadings demonstrate that the observed variables accurately reflect the intended latent factors.
The Structural Equation Modeling (SEM) analysis provided further insights into the relationships between service quality dimensions and user satisfaction. The results support hypothesis H8, which posits that service quality directly impacts user satisfaction [39,43]. For the Perception Model, the Responsiveness dimension had the most substantial direct positive impact (standardized coefficient = 0.34), indicating that, in practice, service speed and efficiency are critical for student satisfaction. Conversely, in the Expectation Model, the Tangibles dimension exerted the most decisive influence (standardized coefficient = 0.43), suggesting that most students primarily expect high-quality physical facilities and a pleasant environment from the transportation system [13]. This distinction underscores the importance of both establishing positive expectations through tangible improvements and delivering real-world service experiences that promptly address user needs.
Nevertheless, a notable inconsistency arises at the item level within the Tangibles dimension. Although the overall Tangibles factor exhibits a significant positive influence on user expectations (Standardized Coefficient = 0.43), certain individual items presenting pronounced service quality gaps—such as air conditioning (Q = −0.52)—display weak or non-significant factor loadings in the measurement model of the confirmatory factor analysis (CFA). This statistical anomaly may be attributable to the phenomenon of service habituation among student users. When deficiencies in fundamental facilities, such as air conditioning, persist and become normalized, respondents may assign less weight to these deficits when evaluating overall perceived service quality in SERVQUAL assessments. Consequently, the association between these specific observable items and the latent construct is attenuated. It is important to recognize that, despite the absence of strong item-level relationships in the SEM, these substantial practical deficiencies constitute persistent challenges that warrant prompt attention and targeted intervention to address habitual behaviors and foster a sustainable modal shift.
To address the challenge of service habituation and enhance the effectiveness of public transit service quality, several practical strategies can be implemented. First, increasing user awareness regarding expected standards is essential, enabling users to recognize and accurately report service deficiencies. Second, survey instruments should be refined by incorporating open-ended and comparative questions to encourage users to reflect more deeply on their experiences and reveal latent dissatisfaction. Third, benchmarking the quality of CMU Transit against comparable systems, both domestically and internationally, provides valuable comparative data and drives ongoing improvements. Fourth, establishing effective feedback channels—such as digital platforms or periodic focus groups—facilitates the collection of user input and collaborative problem-solving. Fifth, clearly communicating service improvements and progress to users can help reduce entrenched patterns of service habituation. When implemented comprehensively, these strategies can alleviate deep-rooted habituation, improve the precision of service quality assessments, and promote sustainable use of public transit services.
6. Conclusions
In summary, these research findings provide valuable empirical evidence to guide Chiang Mai University’s public transportation administrators in planning and implementing targeted service improvements. In the short term, prioritizing enhancements in Responsiveness (with the service quality gap = −0.34), the most substantial factor driving user satisfaction, and making strategic investments in Reliability (gap = −0.14), alongside advancing measures for Respiratory Disease Prevention, will effectively help reduce the quality gap and enhance user satisfaction. These actions can build upon the existing strength in Environmental Performance (gap = +0.12) and are fundamental for promoting a sustainable transportation system within the university.
The Structural Equation Modeling (SEM) analysis revealed a critical distinction between factors influencing user Perception and Expectation. While the Responsiveness factor had the most substantial direct positive influence on satisfaction (standardized coefficient = 0.34), it also exhibited the most significant negative quality gap, indicating an urgent need for corrective action. Crucially, the Tangibles factor exerted the most decisive influence on expectation (standardized coefficient = 0.43), underscoring the conflict between high expectations for facilities and poor current provision. This urgency is particularly driven by operational issues such as insufficient vehicles during peak hours (gap = −0.53) and inadequate real-time tracking. Accordingly, key recommendations include increasing vehicle frequency and improving the information system to strengthen the Reliability dimension.
Furthermore, to effectively meet user Expectations, strategic investment in Tangibles and Respiratory Disease Prevention is essential. Policy should urgently prioritize upgrading in-vehicle air quality by installing efficient air conditioning and air purification systems (with gaps = −0.52 and −0.34, respectively) to mitigate serious health risks associated with poor air quality exposure. Efforts to provide basic hygiene amenities, such as alcohol gel, will further strengthen perceptions of safety and sanitation, thereby leveraging CMU Transit’s established strength in Environmental Performance to promote more sustainable and health-conscious travel behaviors among the university community.
While this research offers important insights, several limitations should be acknowledged. The study focused exclusively on the student population within a single university, and explicitly excluded staff and faculty users, potentially limiting the generalizability to other public transport user groups or institutional contexts. Future research should broaden the user base, include multiple institutions, and employ comparative or longitudinal study designs to validate and further generalize the model’s applicability across different settings.
Author Contributions
Conceptualization, S.K. and A.U.; methodology, S.K. and A.U.; software, S.K.; validation, S.K.; formal analysis, S.K.; investigation, S.K. and A.U.; resources, S.K.; data curation, S.K.; writing—original draft preparation, S.K.; writing—review and editing, S.K. and A.U. All authors have read and agreed to the published version of the manuscript.
Funding
This research received no external funding.
Institutional Review Board Statement
The study was conducted in accordance with the Declaration of Helsinki, and was granted an exemption by the Chiang Mai University Research Ethics Committee (CMUREC) (Protocol Code: CMUREC No. 67/366, Date of Exemption: 20 November 2024). The exemption adheres to international guidelines (ICH-GCP and The Belmont Report) for studies involving humans.
Informed Consent Statement
Informed consent was obtained from all subjects involved in the study.
Data Availability Statement
The data that support the findings of this study are available from the corresponding author upon reasonable request.
Acknowledgments
The authors gratefully acknowledge the financial support for the publication fee provided by Chiang Mai University.
Conflicts of Interest
The authors declare no conflicts of interest.
Abbreviations
The following abbreviations are used in this manuscript:
| CMU | Chiang Mai University |
| CMU Transit | Chiang Mai University Transit |
| SERVQUAL | Service Quality Model |
| CFA | Confirmatory Factor Analysis |
| SEM | Structural Equation Modeling |
| Std. Loading | Standardized Factor Loading |
| CR | Composite Reliability |
| AVE | Average Variance Extracted |
| WHO | World Health Organization |
| PM2.5 | Fine Particulate Matter (particles with aerodynamic diameter ≤ 2.5 μm) |
| KMRT | Kaohsiung Mass Rapid Transit |
| PUV | Public Utility Vehicle |
| COVID-19 | Coronavirus Disease 2019 (as contextual disease reference) |
| KKU | Khon Kaen University |
| KST-EV | Khon Kaen University Smart Transit Electric Vehicle |
| EPA | U.S. Environmental Protection Agency |
| ASEAN | Association of Southeast Asian Nations |
| DF | Degrees of freedom |
| GFI | Goodness of Fit Index |
| RMSEA | Root Mean Square Error of Approximation |
| CFI | Comparative Fit Index |
| NFI | Normed Fit Index |
| TLI | Tucker-Lewis Index |
| Tan | Tangibles |
| Rel | Reliability |
| Res | Responsiveness |
| Ass | Assurance |
| Emp | Empathy |
| Env | Environmental Performance |
| RDP | Respiratory Disease Prevention |
| SQ | Service Quality |
| US | User Satisfaction |
References
- Nadimi, N.; Zamzam, A.; Litman, T. University Bus Services: Responding to Students’ Travel Demands? Sustainability 2023, 15, 8921. [Google Scholar] [CrossRef]
- Taran, A.M. Evaluating the Level of the Shuttle Service Quality at Al al-Bayt University Campus Using the SERVQUAL Model. Int. J. Sustain. Dev. Plan. 2022, 17, 1905–1915. [Google Scholar] [CrossRef]
- Sann, R.; Siripipattaworn, S. University public transportation logistics service quality and student satisfaction: Empirical evidence from Thailand. Cogent Bus. Manag. 2024, 11, 2331628. [Google Scholar] [CrossRef]
- Shaaban, K.; Khalil, R.F. Investigating the Customer Satisfaction of the Bus Service in Qatar. Procedia-Soc. Behav. Sci. 2013, 104, 865–874. [Google Scholar] [CrossRef]
- Luke, R.; Heyns, G.J. An analysis of the quality of public transport in Johannesburg, South Africa using an adapted SERVQUAL model. Transp. Res. Procedia 2020, 48, 3562–3576. [Google Scholar] [CrossRef]
- Chuenyindee, T.; Ong, A.K.S.; Ramos, J.P.; Prasetyo, Y.T.; Nadlifatin, R.; Kurata, Y.B.; Sittiwatethanasiri, T. Public utility vehicle service quality and customer satisfaction in the Philippines during the COVID-19 pandemic. Util. Policy 2022, 75, 101336. [Google Scholar] [CrossRef] [PubMed]
- Munim, Z.H.; Noor, T. Young people’s perceived service quality and environmental performance of hybrid electric bus service. Travel. Behav. Soc. 2020, 20, 133–143. [Google Scholar] [CrossRef]
- IQAir. 2023 World Air Quality Report. Available online: https://www.iqair.com/newsroom/waqr-2023-pr (accessed on 20 September 2025).
- Smart Campus Management Center (Chiang Mai University, Chiang Mai, Thailand). Personal communication, 2025.
- Parasuraman, A.; Zeithaml, V.A.; Berry, L.L. A conceptual model of service quality and its implications for future research. J. Mark. 1985, 49, 41–50. [Google Scholar] [CrossRef]
- Parasuraman, A.; Zeithaml, V.A.; Berry, L.L. SERVQUAL: A multiple-Item Scale for measuring consumer perceptions of service quality. J. Retail. 1988, 64, 12–40. [Google Scholar]
- Zeithaml, V.A.; Parasuraman, A.; Berry, L.L. Delivering Quality Service: Balancing Customer Perceptions and Expectations; The Free Press: New York, NY, USA, 1990. [Google Scholar]
- Atombo, C.; Wemegah, T.D. Indicators for commuter’s satisfaction and usage of high occupancy public bus transport service in Ghana. Transp. Res. Interdiscip. Perspect. 2021, 11, 100458. [Google Scholar] [CrossRef]
- Yaya, L.H.P.; Fortià, M.F.; Canals, C.S.; Marimon, F. Service quality assessment of public transport and the implication role of demographic characteristics. Public Transp. 2015, 7, 409–428. [Google Scholar] [CrossRef]
- Ueasangkomsate, P. Service quality of public road passenger transport in Thailand. Kasetsart J. Soc. Sci. 2019, 40, 74–81. [Google Scholar]
- Troko, J.; Myles, P.; Gibson, J.; Hashim, A.; Enstone, J.; Kingdon, S.; Packham, C.; Amin, S.; Hayward, A.; Van-Tam, J.N. Is public transport a risk factor for acute respiratory infection? BMC Infect. Dis. 2011, 11, 16. [Google Scholar] [CrossRef]
- Howland, R.E.; Cowan, N.R.; Wang, S.S.; Moss, M.L.; Glied, S. Public transportation and transmission of viral respiratory disease: Evidence from influenza deaths in 121 cities in the United States. PLoS ONE 2020, 15, e0242990. [Google Scholar] [CrossRef] [PubMed]
- Bakar, M.F.; Norhisham, S.; Katman, H.Y.; Fai, C.M.; Azlan, N.N.; Samsudin, N.S. Service Quality of Bus Performance in Asia: A Systematic Literature Review and Conceptual Framework. Sustainability 2022, 14, 7998. [Google Scholar] [CrossRef]
- Baharum, S.; Haron, S.; Ismail, I.; Md Diah, J. Urban Bus Service Quality through Sustainable Assessment Model. Int. J. Supply Chain Manag. 2019, 8, 576–585. [Google Scholar]
- Lai, W.-T.; Chen, C.-F. Behavioral intentions of public transit passengers—The roles of service quality, perceived value, satisfaction and involvement. Transp. Policy 2011, 18, 318–325. [Google Scholar] [CrossRef]
- Ngosorn, P.; Satiennam, T.; Satiennam, W. Factors Influencing Perceived Service Quality and Satisfaction in Electric Bus Service in Khon Kaen University. In Proceedings of the 28th National Convention on Civil Engineering, Phuket, Thailand, 24–26 May 2023; p. pp. TRL59-1–TRL59-10. [Google Scholar]
- Samithtiphechawong, S.; Srising, P. The Quality of Services affecting the satisfaction towards the Bangkok Mass Transit Authority Public Transportation in Bangkok, Thailand. J. Assoc. Res. 2020, 25, 186–199. [Google Scholar]
- Nantasit, P.; Nilsuwan, D.; Kijamornchai, P.; Sirikasemsuk, S.; Muenpho, S.; Thaworn, D. Factors Affecting Decision Making on Using Electrical Public Bus Services. SAU J. Soc. Sci. Humanit. 2018, 2, 55–66. [Google Scholar]
- Singh, V.; Meena, K.K.; Agarwal, A. Travellers’ exposure to air pollution: A systematic review and future directions. Urban Clim. 2021, 38, 100901. [Google Scholar] [CrossRef]
- Zuurbier, M.; Hoek, G.; Oldenwening, M.; Lenters, V.; Meliefste, K.; van den Hazel, P.; Brunekreef, B. Commuters’ Exposure to Particulate Matter Air Pollution Is Affected by Mode of Transport, Fuel Type, and Route. Environ. Health Perspect. 2010, 118, 783–789. [Google Scholar] [CrossRef]
- Murray, W.; Wu, Q.; Balanay, J.A.G.; Sousan, S. Assessment of PM2.5 Concentration at University Transit Bus Stops Using Low-Cost Aerosol Monitors by Student Commuters. Sensors 2024, 24, 4520. [Google Scholar] [CrossRef]
- Pollution Control Department. Announcement of Thailand’s Air Quality Index B.E.2566. Available online: https://www.pcd.go.th/laws/30035/ (accessed on 23 November 2025).
- Chansuebsri, S.; Kolar, P.; Kraisitnitikul, P.; Kantarawilawan, N.; Yabueng, N.; Wiriya, W.; Thepnuan, D.; Chantara, S. Chemical composition and origins of PM2.5 in Chiang Mai (Thailand) by integrated source apportionment and potential source areas. Atmos. Environ. 2024, 327, 120517. [Google Scholar] [CrossRef]
- Inlaung, K.; Chotamonsak, C.; Macatangay, R.; Surapipith, V. Assessment of Transboundary PM2.5 from Biomass Burning in Northern Thailand Using the WRF-Chem Model. Toxics 2024, 12, 462. [Google Scholar] [CrossRef]
- IQAir. 2024 World Air Quality Report. Available online: https://www.iqair.com/world-air-quality-report (accessed on 20 September 2025).
- World Health Organization (WHO). WHO Global Air Quality Guidelines: Particulate Matter (PM2.5 and PM10), Ozone, Nitrogen Dioxide, Sulfur Dioxide and Carbon Monoxide. Available online: https://www.who.int/publications/i/item/9789240034228 (accessed on 20 September 2025).
- Clean Air Act Overview. Available online: https://www.epa.gov/clean-air-act-overview (accessed on 20 September 2025).
- Pollution Control Department. Draft Revision of Ambient Air Quality Standards. Available online: https://www.pcd.go.th/laws/35792/ (accessed on 23 November 2025).
- Hammad, O.M. Air Quality: EPA’s 2023 Proposed Changes to the Particulate Matter (PM) Standard; CRS Product: Washington, DC, USA, 2023. [Google Scholar]
- Clean Air Network. Draft Clean Air Management for Health and Integration Act. Available online: https://shorturl.asia/1DaTR (accessed on 20 September 2025).
- National Environment Board. Announcement of the National Environment Board: Determination of the Ambient Air Quality Standard for PM2.5. Available online: https://www.pcd.go.th/laws/26439/ (accessed on 20 September 2025).
- Association of Southeast Asian Nations (ASEAN). ASEAN Agreement on Transboundary Haze Pollution; Association of Southeast Asian Nations (ASEAN): Kuala Lumpur, Malaysia, 2002; pp. 1–24. [Google Scholar]
- Eboli, L.; Mazzulla, G. Willingness-to-pay of public transport users for improvement in service quality. Eur. Transp. Trasp. Eur. 2008, 38, 107–118. [Google Scholar]
- De Oña, J.; De Oña, R.; Eboli, L.; Mazzulla, G. Perceived service quality in bus transit service: A structural equation approach. Transp. Policy 2013, 29, 219–226. [Google Scholar] [CrossRef]
- Dell’Olio, L.; Ibeas, A.; Cecín, P. Modelling user perception of bus transit quality. Transp. Policy 2010, 17, 388–397. [Google Scholar] [CrossRef]
- Carreira, R.; Patrício, L.; Jorge, R.N.; Magee, C. Understanding the travel experience and its impact on attitudes, emotions and loyalty towards the transportation provider–A quantitative study with mid-distance bus trips. Transp. Policy 2014, 31, 35–46. [Google Scholar] [CrossRef]
- Meansin, K. The Inhalation Exposure of PM2.5 in the Bus Stops Phitsanulok Municipality. Master’s Thesis, Naresuan University, Phitsanulok, Thailand, 2021. [Google Scholar]
- Cronin, J.J., Jr.; Brady, M.K.; Hult, G.T.M. Assessing the effects of quality, value, and customer satisfaction on consumer behavioral intentions in service environments. J. Retail. 2000, 76, 193–218. [Google Scholar] [CrossRef]
- Cochran, W.G. Sampling Techniques, 3rd ed.; John Wiley & Sons: New York, NY, USA, 1977. [Google Scholar]
- Hair, J.; Black, W.; Babin, B.; Anderson, R. Multivariate Data Analysis: A Global Perspective, 7th ed.; Pearson Education: London, UK; Upper Saddle River, NJ, USA, 2010. [Google Scholar]
- Kline, R.B. Principles and Practice of Structural Equation Modeling, 4th ed.; The Guilford Press: New York, NY, USA, 2016. [Google Scholar]
- Chiang Mai University Transit. CMU Transit Service Timetable. Available online: https://listwr.com/xZaEtB (accessed on 18 August 2025).
- Corporate Communication and Alumni Relations Center (CCARC). CMU Electric Shuttle Cars Prove Commitment to Clean Energy and the Smart City Model. Available online: https://listwr.com/l7Nyt5 (accessed on 18 August 2025).
- Nunnally, J.C. Psychometric Theory, 2nd ed.; McGraw-Hill: New York, NY, USA, 1978. [Google Scholar]
- Fornell, C.; Larcker, D.F. Evaluating structural equation models with unobservable variables and measurement error. J. Mark. Res. 1981, 18, 39–50. [Google Scholar] [CrossRef]
- Bollen, K.A. Structural Equations with Latent Variables; John Wiley & Sons: New York, NY, USA, 1989. [Google Scholar] [CrossRef]
- Schumacker, R.E.; Lomax, R.G. A Beginner’s Guide to Structural Equation Modeling, 3rd ed.; Routledge/Taylor & Francis Group: New York, NY, USA, 2010. [Google Scholar]
- Sum, S. Investigating the City Bus Service Quality Based on Users’ Perceptions and Users’ Expectations. Master’s Thesis, Suranaree University of Technology, Nakhon Ratchasima, Thailand, 2019. [Google Scholar]
Disclaimer/Publisher’s Note: The statements, opinions and data contained in all publications are solely those of the individual author(s) and contributor(s) and not of MDPI and/or the editor(s). MDPI and/or the editor(s) disclaim responsibility for any injury to people or property resulting from any ideas, methods, instructions or products referred to in the content. |
© 2025 by the authors. Licensee MDPI, Basel, Switzerland. This article is an open access article distributed under the terms and conditions of the Creative Commons Attribution (CC BY) license (https://creativecommons.org/licenses/by/4.0/).