Abstract
Urban densification in post-socialist cities has drastically reduced open and green spaces in high-rise housing areas (HRHAs), intensifying heat stress and degrading outdoor thermal comfort (OTC). These neighborhoods—shaped by socialist-era planning and, later, market-led infill—combine high built density, low greenery, and limited ventilation, making them critical testbeds for climate-adaptive regeneration. This study presents the first empirically validated ENVI-met assessment of blue–green infrastructure (BGI) performance in a post-socialist HRHA, using a representative courtyard in Niš, Serbia, during the 14 August 2024 heatwave. A 24 h field campaign (air temperature, humidity, wind speed, and mean radiant temperature) validated the model with high accuracy (R2 = 0.92, RMSE = 1.1 °C for air temperature; R2 = 0.88, RMSE = 3.5 K for Physiological Equivalent Temperature (PET). Four retrofit scenarios were simulated: S0 (existing), S1 (grass), S2 (grass + trees), and S3 (S2 + shallow pool). Across all scenarios, daytime PET indicated strong–extreme heat stress, peaking at 61.9 °C (16:00 h). The best configuration (S3) reduced PET by 2.68 °C (10:00 h) but <1 °C at peak hours, with acceptable comfort limited to 04:00–07:00 h. The results confirm that small-scale surface-level greening provides negligible thermal relief under a dense HRHA morphology. Urban morphological reform—optimizing height, spacing, ventilation, and integrated greening—is more effective for heat mitigation. Future work should include multi-seasonal field monitoring and human thermal-perception surveys to link microclimate improvement with exposure and health risk.
1. Introduction
The world is experiencing accelerated urbanization: cities currently accommodate 56% of the global population, a share projected to reach approximately 68% by 2050 [1]. Such rapid growth intensifies pressure on urban systems, increasing housing demand and expanding densely built environments. These trends amplify both global warming and the urban heat island (UHI) effect, with well-documented implications for outdoor thermal comfort (OTC) [2,3,4,5,6,7]. The UHI effect—defined as systematically higher temperatures in urban areas relative to their surroundings [8]—has emerged as a critical environmental challenge of the 21st century [9]. Prolonged heat events, driven by the combined influence of climate change and the UHI effect, increasingly threaten public health across Europe [10,11,12].
Serbia, as well as other southeastern European countries, exemplifies this pattern, with markedly warmer summer conditions recorded during 2024 [13,14]. In Serbia’s lowland cities, summer air temperatures rose by 4–6 °C above the 1991–2020 norm during the record-breaking 2024 European heatwave, while national projections indicate a rise in mean summer maximum temperature of approximately 4–5 °C by 2100 under high-emission pathways [15,16]. On 14 August 2024, the city of Niš registered 41 °C—the highest temperature in Serbia that day [17]. Ensuring favorable OTC in residential environments has therefore become a pressing public health and planning imperative.
As in other post-socialist countries, Serbia has experienced a pronounced contraction of open spaces (OSs) within high-rise housing areas (HRHAs) [18,19]. The key characteristics of post-socialist countries include the following:
- First, intensifying urbanization and densification have replaced permeable, shaded ground with hard, impervious surfaces, increasing runoff, suppressing evapotranspiration, and exacerbating the UHI effect [20]. The result is heightened exposure to heat stress and reduced opportunities for recreation and physical activity—impacts expected to worsen under climate change [21,22].
- Second, the transition from state-planned to market-oriented development after 1990 replaced long-range urban strategies with opportunity-led densification and privatization of formerly public land [23,24]. In the city of Niš, green areas within HRHAs have frequently been converted into construction land, while post-2000 General Regulation Plans stipulated a minimum of only 10% on-plot greenery [25]. Consequently, many post-socialist HRHAs have become predominantly “gray”, with green-space provision dropping to ~1.2 m2 per inhabitant—far below both the ~38.6% share recorded in socialist-era HRHAs and international norms of 20–40 m2 per resident [26].
- Third, fragmented development amid prolonged political and economic crises disrupted comprehensive planning reform. Developers often pursued plot-by-plot infill construction, maximizing yield while neglecting public interest and omitting OSs [27,28,29,30,31]. In the Municipality of Medijana (Niš), new residential blocks provide only ~0.34 m2 of green space per inhabitant (≈8.66% of the ground area), falling short of the prescribed 10% minimum [32]. The HRHA on Romanijska Street in Niš—an infill development within the Krivi Vir neighborhood—illustrates this pattern, with most surfaces paved and green coverage limited to ≈4.3% of the plot (~0.27 m2 per resident). Such conditions create a microclimatic environment conducive to strong UHI expression and thermal stress.
Thus, the city of Niš typifies the broader post-socialist urban pattern of the Western Balkans—characterized by inherited HRHAs from the socialist period, post-1990 land-privatization, and uncontrolled infill that replaced communal greenery with impervious surfaces. Similar morphological and planning trajectories have been documented in other post-socialist cities in the region, including those in neighboring countries, positioning Niš as a representative case of the region’s dense, heat-prone residential environments [23,33].
The reduction and fragmentation of vegetation suppress evapotranspiration and latent heat fluxes, elevating air temperature and degrading environmental quality [34,35,36]. Post-socialist HRHAs are especially vulnerable: tall slab buildings, narrow courtyards, and extensive paving reduce the sky-view factor, hinder ventilation, and trap heat. Studies indicate that such morphologies can increase the mean radiant temperature (Tmrt) by 6–10 °C and push the Physiological Equivalent Temperature (PET) into “very hot” (>41 °C) or “extreme heat-stress” (>46 °C) categories on typical summer afternoons [37,38,39,40,41]. Because OTC strongly affects outdoor stay duration, social interaction, and perceived neighborhood quality [42], mitigating heat stress in OSs is essential for sustainable housing strategies in post-socialist cities.
Rapid urban transformation after 1990—marked by deindustrialization, suburbanization, illegal construction, and the loss of green space—has further intensified ecological pressures, including increased air and noise pollution, stormwater runoff, and UHI intensity [43,44]. Despite substantial Serbian research on these issues, practical frameworks for climate-adaptive OS design in inherited HRHAs remain underdeveloped.
International evidence, mainly from Mediterranean, East Asian, and arid North American contexts, suggests that small-scale Blue–Green Infrastructure (BGI) measures (e.g., lawns, tree canopies, and shallow water surfaces) can reduce the PET by approximately 1–4 °C, even where air-temperature effects are modest [45,46,47,48]. The three-dimensional ENVI-met model is widely applied for such analyses, with mean absolute errors typically ≤2 °C for PET and ≤0.7 °C for air temperature following a 48 h spin-up. However, field-validated ENVI-met applications in post-socialist infill blocks in the continental Balkans—particularly in Serbia—remain scarce. Consequently, Serbian planning regulations lack microclimate-relevant numerical thresholds for shifting the PET from “extreme” to “strong heat-stress” levels in HRHA courtyards.
To address this gap, this study combines a 24 h field campaign conducted on 14 August 2024—the peak day of the 2024 heatwave—with a validated ENVI-met model of an infill HRHA courtyard on Romanijska Street, Niš. The research aims to achieve the following:
- Quantify air temperature (Ta), mean radiant temperature (Tmrt), wind speed, relative humidity, and PET under heatwave conditions;
- Test the cooling performance of four incremental surface-cover scenarios—S0 (concrete baseline), S1 (grass), S2 (grass plus deciduous trees), and S3 (S2 plus a ~40 m2 shallow reflecting pool);
- Formulate context-specific, cost-effective design recommendations for improving OTC in OSs in post-socialist HRHAs.
This study represents, to the best of our knowledge, the first field-validated ENVI-met analysis of a post-2000 Serbian OS in an HRHA conducted during an actual record heatwave. By situating Niš within the broader climatic and morphological context of the Western Balkans, the research establishes a regional benchmark for assessing heat stress and BGI effectiveness in post-socialist urban forms. The findings provide planners and designers with regionally transferable, evidence-based guidance for the embedding of microclimate-responsive regeneration strategies into HRHAs in post-socialist cities.
2. Literature Review
In this paper, the term post-socialist refers to the central, eastern, and southeastern European countries that underwent a systemic transition after the dissolution of socialist governance between 1989 and the early 2000s [23,49]. These contexts are characterized by rapid political and economic transformation—from centrally planned to market-oriented economies—accompanied by the restitution and privatization of urban land, deregulation of housing production, and the weakening of public-sector planning capacity [50]. In urban development terms, these processes have reshaped residential morphologies: extensive infill construction replaced communal OSs in HRHAs, while maintenance of inherited green infrastructure declined [51]. Such conditions are particularly relevant to OTC and the performance of BGI, as the reduction in vegetation, high imperviousness, and fragmented land ownership exacerbate urban heat stress and constrain the feasibility of nature-based retrofitting.
2.1. Outdoor Thermal Comfort Indices
OTC in compact OSs is determined by the interaction of environmental variables such as air temperature, wind speed, humidity, and solar radiation [52]. Numerous indices have been developed to evaluate OTC in dense urban settings, integrating meteorological, physiological, and environmental factors—most commonly, the Predicted Mean Vote (PMV), Universal Thermal Climate Index (UTCI), Standard Effective Temperature (SET), Physiological Equivalent Temperature (PET), and Perceived Temperature (PT) [53,54,55]. Among these, PET is widely regarded as the most suitable for urban applications, as demonstrated across extensive OTC research [40,48,52,53,54,55,56,57].
PET is frequently adopted because it (i) uses the intuitive unit of degrees Celsius; (ii) is valid over a broad temperature range (−10 °C to +50 °C); (iii) requires only standard meteorological inputs; (iv) aligns with perceptible changes in thermal sensation at approximately 2 °C increments; and (v) is grounded in the Munich Energy Balance Model for Individuals, incorporating air temperature, wind, humidity, and radiation while treating personal factors (activity, clothing, and age) as constants [40]. Following Höppe [38], PET is defined as “the air temperature at which, in a typical indoor setting (without wind and solar radiation), the heat budget of the human body is balanced with the same core and skin temperature as under the complex outdoor environment”.
PET became a standard metric for thermal perception studies after 2003 and has been predominant since around 2012. Consistent with Matzarakis’ classification [40], this study interprets PET values above 46 °C as indicating extreme heat stress (Table 1). Previous research further demonstrates that modifying landscape cover—such as increasing grass or tree canopy—can substantially improve OTC in high-rise urban environments, even during the hottest summer periods.

Table 1.
Ranges of the PET for different grades of thermal perception by human beings and physiological stress on human beings [40].
Building on this empirical evidence, numerous studies have employed microclimate simulation tools, particularly ENVI-met, to quantify the cooling potential of BGI in dense urban settings.
2.2. Microclimate Simulation of OSs in HRHAs and the Cooling Performance of BGI
In HRHAs, OTC is shaped by a combination of morphological, material, and climatic factors. The compact urban form typical of post-socialist HRHAs—characterized by tall slab buildings, narrow courtyards, and limited vegetation—creates microclimatic conditions distinct from those of low-rise or suburban environments. These geometries constrain ventilation, reduce the sky-view factor (SVF), and trap longwave radiation, which intensifies heat accumulation during summer periods. Consequently, HRHAs in post-socialist cities represent a particularly challenging context for both field monitoring and simulation of OTC, yet they remain under-represented in the microclimate literature.
A large proportion of OTC assessments in HRHAs employ ENVI-met, a three-dimensional microclimate model used to simulate the influence of BGI on thermal conditions [58,59]. ENVI-met resolves building–vegetation–atmosphere interactions at high spatial and temporal resolutions, enabling detailed analyses of how urban configuration and environmental modifications (e.g., radiation environment, wind flow, and surface properties) affect OTC in OSs.
ENVI-met has demonstrated robustness across diverse climatic contexts [60,61,62,63]. Courtyard validations in mid-latitude settings commonly report RMSE ≤ 0.7 °C for air temperature (Ta) and ≤2 °C for PET after a 48 h spin-up [60]. Recent model developments include refined tree-physiology algorithms and reflective-water modules. For biothermal assessment, the BioMet module computes comfort indices such as PMV, PET, and UTCI; in this study, BioMet was employed to calculate PET following field measurements.
Numerous ENVI-met studies have evaluated strategies for mitigating thermal stress in dense urban morphologies. Mahmoud et al. [64] demonstrated that scenarios combining vegetation and shading (e.g., grass, trees, and semi-shaded surfaces) can reduce PET by 13.6–19.1 °C. Vegetation—through canopy shade and evapotranspiration—consistently lowers surface and near-surface temperatures, improving OTC; these benefits have been reported for both tree planting and green roofs [65]. Using ENVI-met, Aydin et al. [66] found that increasing green space and optimizing building layouts can reduce thermal discomfort in high-rise environments. Additional research indicates that reflective materials and expanded tree coverage near tall buildings can decrease local air temperatures and enhance OTC [67]. Tan et al. [67] concluded that tree planting—especially when coordinated with urban form—effectively mitigates daytime UHI effects, with air-temperature reductions of up to 1.5 °C. Similarly, Jin et al. [68] reported that tripling tree numbers relative to advisory guidelines lowered the average Ta by 0.87 °C, mean radiant temperature (Tmrt) by 11.00 °C, and PET by 4.50 °C.
Designing OSs in HRHAs is inherently challenging because tall buildings alter shading regimes, modify wind patterns, and trap longwave radiation, collectively intensifying heat stress. ENVI-met facilitates ex ante testing of interventions such as strategic vegetation placement, surface material selection, and adjustments in building orientation or spacing. Despite its demonstrated utility, a regional research gap remains: no validated ENVI-met applications have yet been documented for Serbian infill HRHAs, leaving uncertainties about model calibration, parameterization, and scenario design in this specific urban context.
Beyond modeling evidence, the thermal effects of vegetation are well established: urban greenery improves microclimate and mitigates the UHI effect by reducing summer temperatures [69], with effectiveness confirmed across multiple regions [70,71,72]. Recent studies underscore the role of BGI in climate adaptation and OTC improvement [73,74,75], alongside co-benefits such as air purification, urban agriculture, and overall microclimate regulation. While large urban parks are approximately 1 °C cooler than surrounding built-up areas, on average, and larger parks exhibit stronger cooling [76], small-scale interventions (lawns, green roofs, urban gardens, and street trees) can also deliver meaningful cooling benefits where land for large parks is limited. Such measures are particularly relevant for HRHAs, where high density restricts boundary-layer airflow and ventilation, intensifying heat stress and reducing opportunities for outdoor activity [77,78].
Specific findings on the cooling performance of BGI include the following:
- Vegetation: Meta-analyses suggest that every 10% increase in canopy cover can reduce Tmrt by 4–6 °C and PET by 1–2 °C during mid-afternoon [79]. Even modest green areas can cool by 1–3 °C relative to paved surfaces; tree planting consistently reduces maximum air and surface temperatures, achieving average PET reductions of approximately 13% compared with existing vegetation [69].
- Water features: During summer, water elements rank among the most effective cooling strategies. Shallow pools (<100 m2) and mist fountains typically provide 0.5–1.2 °C PET relief, while improvements exceeding 2 °C are reported when water areas surpass ~20 m2 or include active misting [80,81].
- Albedo and permeability: Bright, permeable pavements operate 8–12 °C cooler than asphalt under direct sun; however, their PET impact is secondary when the sky-view factor (SVF) falls below ~0.35. Impervious pavements may reach 12–15 °C higher surface temperatures than adjacent grassed or tree-shaded zones, particularly under dense summer conditions [82].
In addition, building shading can substantially improve OTC in OSs by reducing radiant exposure during peak hours [83,84]. Despite these global insights, empirical research remains unevenly distributed, with limited evidence from post-socialist and western Balkan contexts, where rapid densification and weak OS regulation amplify thermal vulnerability.
2.3. The Western Balkan Evidence Gap
Since 2000, urban densification in post-socialist cities has markedly reduced OS per resident, resulting in overcrowding, declining environmental quality, and limited access to green infrastructure [51,85]. In the western Balkans, densification policies have promoted infill construction in formerly communal OSs, producing courtyards that are approximately 85–90% impervious and largely treeless. Unlike socialist-era estates—characterized by generous greenery—many new developments leave minimal space for conventional residential OS or for the integration of BGI. Empirical OTC studies, however, remain concentrated in Mediterranean and Asian contexts or focus on public squares in post-socialist cities [86]. To the best of the authors’ knowledge, only one study [87] has examined inherited socialist blocks, and new-build infill courtyards remain empirically unexplored. Notably, no study has yet combined field measurements with ENVI-met simulations for post-socialist infill HRHAs in Serbia.
This lack of region-specific data has practical consequences: Serbian planners and designers currently lack locally grounded microclimate design thresholds—such as minimum canopy coverage, water-surface ratios, or wind-corridor dimensions—that would support evidence-based climate adaptation in HRHAs. Consequently, urban regeneration strategies across post-socialist countries often rely on general guidelines developed for Western or coastal cities, which may not reflect the climatic, morphological, or institutional realities of the Balkans.
The present study addresses this knowledge gap by providing the first field-validated ENVI-met assessment of incremental BGI retrofit scenarios in a Serbian HRHA infill courtyard. By empirically quantifying the effects of vegetation, water, and surface modifications on microclimatic performance, this research contributes critical evidence for the development of context-specific design principles for climate-adaptive neighborhood planning in the post-socialist Balkans.
3. Materials and Methods
This study combines field measurements, OTC assessment, and microclimate modeling to examine the effects of BGI strategies on OTC in OSs within an infill HRHA in the city of Niš, Serbia. The overarching aim is to identify configurations that improve the summer microclimate for residents. The workflow comprised four stages: (1) scoping the study area, (2) conducting a 24 h field campaign to collect meteorological data, (3) constructing a base ENVI-met model (BM), and (4) simulating alternative BGI scenarios. Field measurements were complemented with data from the Meteorological Monthly Bulletin for Serbia: August 2024 [88].
3.1. Climate Conditions and Study Area
The city of Niš is located in the southeastern part of the Republic of Serbia (43°19′ N, 21°54′ E), as shown in Figure 1a [89]. According to the 2022 census, the administrative district (596.73 km2) has a population of 250,648. Niš functions as the macro-regional center of South and East Serbia and serves as the seat of the Nišava Administrative District. The Nišava River traverses the city, while its last major left-bank tributary, the Gabrovačka River, flows through the Krivi Vir and Krive Livade residential areas.
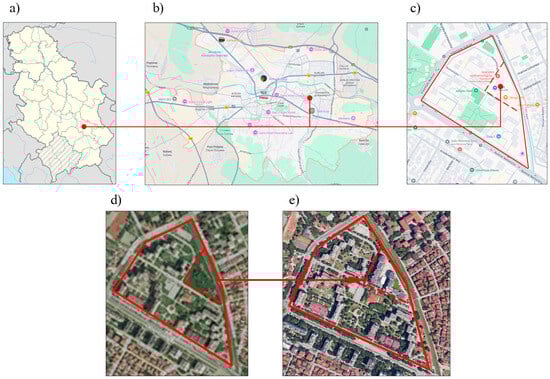
Figure 1.
Study-area HRHA on Romanijska street, Niš, Serbia. (a) Geographical location of the city of Niš in Serbia; (b) location of the Krivi Vir neighborhood in Niš; (c) location of the Romanijska Street HRHA in the Krivi Vir neightborhood; (d) location in 2006; (e) location in 2025 [89,90,91].
Climatically, the city of Niš exhibits a humid subtropical regime (Köppen classification) influenced by both Mediterranean and continental conditions, resulting in pronounced seasonal variation. The mean annual air temperature is 12.4 °C. Analysis of recent summers (June–August) indicates that the highest temperatures typically occur in July and August [92]. In August 2024, the average daily temperature was approximately 29 °C, which is nearly 3 °C above the long-term norm, indicating substantial summer heat stress. Serbia experienced five heatwaves during the summer of 2024 [88]; the fourth affected the entire country and persisted for eight days in Niš (11–18 August). While average summer temperatures are moderate, extreme daytime maxima reached 41 °C in August 2024, making Niš the hottest city in Serbia on that date. The field campaign for this study was conducted on 14 August 2024, a characteristically extreme-heat day in Niš.
Selection of HRHA for Case Study
A critically important yet under-researched typology in Serbia and across post-socialist Europe is the infill HRHAs that proliferated during late socialism, especially after 2000. Unlike many modernist predecessors, numerous post-2000 blocks in Serbia replaced communal green zones with underground garages and paved courtyards. The HRHA on Romanijska Street (Figure 1b,c), situated within the Krivi Vir neighborhood in the city of Niš, was selected to illustrate these conditions.
Krivi Vir, initially developed on the urban fringe in the early 1980s, forms part of the Bulevar Nemanjića residential zone, the city’s largest HRHA. The study parcel, bounded by Romanijska Street and the Gabrovačka River, was constructed as an infill development on previously vacant green land between 2007 and 2010 by private investors, substantially reducing greenery within an already dense urban fabric (Figure 1d,e). This makes the site a representative post-socialist infill development in Niš (and in other Serbian cities) and a suitable platform for investigating summertime OTC.
The study area is semi-open and comprises two eight-story residential buildings (R1 and R2; ~27 m in height), two one-story commercial buildings (C1 and C2; ~5 m in height), and two underground garages (Figure 2). The original plan envisioned six-story residential buildings with ground-floor commercial facilities and a central communal courtyard featuring playgrounds, gathering areas, and greenery, particularly along the Gabrovačka River frontage. These provisions were not implemented. Instead, eight-story residential buildings were constructed with ground-floor apartments facing the inner courtyard, and two commercial buildings were added within the central OS toward Romanijska Street, partly occupying the previously planned small green zone. Consequently, greenery is extremely scarce, limited to a few planter boxes and a small green patch in the northeastern part of the site (Figure 2).
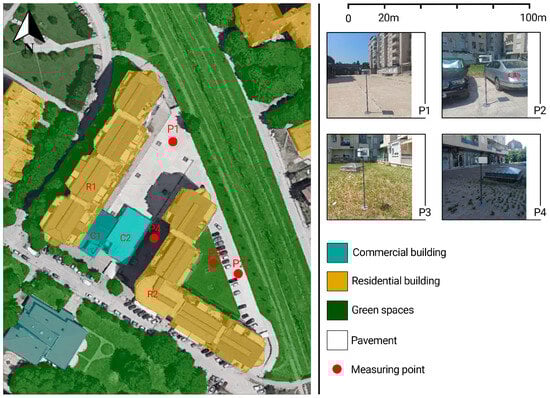
Figure 2.
Detailed view of the study area [89] and disposition of observation points P1–P4—measurement instrument locations.
Based on the courtyard geometry (building height ≈ 27 m; courtyard widths of 2–14 m), the estimated sky-view factor (SVF) at the four observation points is very low: approximately 0.28–0.35 at P1, 0.35–0.45 at P2, 0.22–0.28 at P3, and only 0.10–0.18 at P4. These SVF values confirm the highly enclosed radiative geometry of the courtyard and its limited potential for daytime longwave cooling.
The total green area measures approximately 500 m2, representing about 4.3% of the building plot—well below the minimum 10% required by the General Regulation Plan (PGR) of the Municipality of Medijana for this location [25]. The remaining 95% of the OS is paved with concrete blocks and asphalt, rendering the courtyard predominantly impermeable.
Key urban-form parameters underscore the extremity of conditions:
- Site coverage index: 0.43 (buildings occupy 43% of the parcel);
- Floor-area ratio (FAR): 3.27 (very high built intensity);
- Population density: extremely high (site-specific figures withheld for confidentiality).
Per capita OS is approximately 3.45 m2/inhabitant, and per-capita green area is ~0.27 m2/inhabitant—far below the already low average of ~1.2 m2/inhabitant reported for the Municipality of Medijana and even farther below the commonly cited minimum of 9 m2 of urban green space per capita in WHO-linked studies [29].
The loss and fragmentation of OSs have degraded environmental quality and eliminated a vital buffer against extreme heat, creating a courtyard morphology that fosters strong UHI expression and poor OTC due to low vegetation, high surface albedo, and limited airflow.
3.2. Field Study, Measurement Indicators, and Instruments
A continuous 24 h on-site campaign was carried out on 14 August 2024, selected based on official meteorological reports [92] identifying August 2024 as the warmest on record at most main stations in Serbia. In Niš, the average monthly air temperature in August 2024 was 26.0 °C, with an anomaly of +2.9 °C and 28 tropical days, marking the warmest August since instrumental records began in 1925. The date of 14 August 2024 was an extremely hot, clear-sky day—the peak of the 2024 Serbian heatwave—with a synoptic Tmax = 40.5 °C at the Niš Fortress Station (WMO 13270).
The field survey comprised two components: (i) outdoor microclimate measurements and (ii) built-environment documentation.
3.2.1. Outdoor Microclimate Measurements
Meteorological variables—air temperature (Ta, °C), relative humidity (RH, %), and wind speed (W, m s−1)—were recorded using a mobile array of HOBO U23 data loggers mounted 1.5 m above ground level at representative OS locations. The sensors met the ISO 7726 [93]. requirements for thermal-environment measurement and were connected to an Almemo® Portable Data Logger produced by Ahlborn Mess- und Regelungstechnik GmbH, Holzkirchen, Germany. The sampling interval was set to 2 min to capture short-term variability.
Wind speed was additionally measured with a Lutron AM-4215SD hot-wire anemometer (accuracy ±5% + 0.1 m s−1, per product manual). Parallel datasets were obtained from the Niš Fortress Meteorological Station for the same period to support calibration and validation of site-specific measurements. The instrument locations at observation points P1–P4 within the HRHA are shown in Figure 2. Additionally, in order to verify the data collected at observation points P1–P4, additional on-site recordings were randomly conducted using a Davis Wireless Vantage Pro2™ mobile meteorological station produced by Davis Instruments Corp., Hayward, CA, USA (Figure 3). The detailed specifications for sensors enclosed in the Davis Wireless Vantage Pro2™ are provided in Table 2.
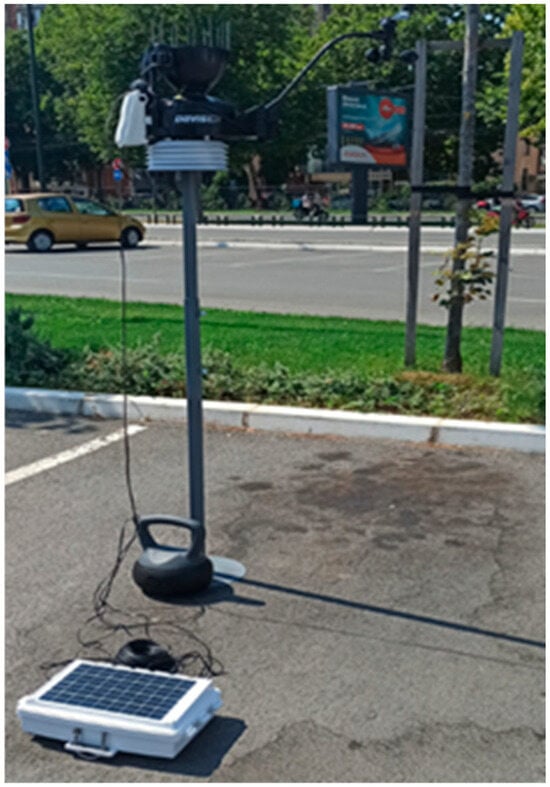
Figure 3.
Mobile meteorological station.
Table 2.
Detailed specifications for sensors enclosed in the Davis Wireless Vantage Pro2™.
The date of 14 August 2024 was selected for simulation and validation because it combined clear-sky conditions, weak winds, and no precipitation during the preceding three days—conditions conducive to strong UHI expression. Initial meteorological inputs for the ENVI-met model were derived from the field campaign and the station records (Table 3).
Table 3.
Meteorological data on 14 August 2024.
The ENVI-met simulation covered 00:00–24:00 CET, producing hourly outputs. High-frequency calculations (1 min internal timestep) were applied during peak daytime hours. The main input parameters are summarized in Table 2, and the calibrated base model is illustrated in Figure 4.
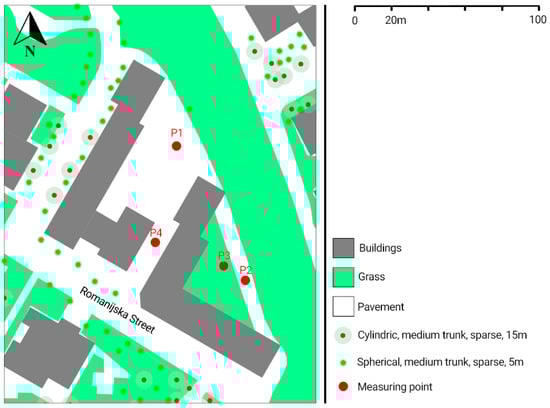
Figure 4.
ENVI-met BM layout of the HRHA on Romanijska Street in Niš, Serbia, showing the base-case scenario (S0), illustrating the spatial configuration of buildings, vegetation, and measurement points (P1–P4).
To capture intra-courtyard variability related to geometry, land cover, and use, the study area was partitioned into three functional sub-zones, with four observation points (P1–P4) instrumented (Figure 2; Table 4):
Table 4.
Characteristics of the selected observation points [92].
- P1—Central paved OS above the underground garage (no vegetation or equipment). Located in the geometric center, flanked by 8-story residential blocks on two long sides; the southwest short side hosts two single-story commercial buildings, while the northeast side remains largely undeveloped. As in many HRHA courtyards in Niš, occasional informal parking on the southeast margin further degrades the microclimate (heated vehicle masses and tailpipe emissions).
- P2—Asphalt parking area (southeast of R2, above the second underground garage). Originally conceived as part of the communal OS connected to the greenery along the Gabrovačka River, the area has been repurposed for parking.
- P3—The only larger lawn (northeastern sector). A small but critical grassed patch representing the sole sizeable permeable and vegetated surface within the courtyard.
- P4—Narrow paved corridor between R1, R2, and a commercial unit (no vegetation). A linear, high-aspect-ratio passage with limited sky view, analogous to P1 in its lack of vegetation.
To provide minimal geometric and radiative context for interpreting the thermal results, an approximate sky-view factor (SVF) was estimated for each observation point based on courtyard dimensions (≈27 m building height; 12–20 m spacing) and horizon angles. The central courtyard (P1) exhibits an SVF of ≈0.35–0.45, while the partially open parking area (P2) shows ≈0.40–0.55. The small lawn (P3) has moderately higher openness (≈0.45–0.60). In contrast, the narrow paved canyon (P4), which is only ~2 m wide and enclosed by 27 m façades, has an extremely low SVF of ≈0.15–0.25. These low SVF values explain the strong longwave trapping.
3.2.2. Built-Environment Documentation
A concurrent survey catalogued vegetation types and conditions, surface materials, and building morphology using direct field observation, measuring equipment, detailed cadastral maps, Google Earth imagery, and plan documentation.
The base-case layout consists of a lawn behind one residential block, a small street-edge lawn with planters, and extensive paved surfaces elsewhere.
The collected microclimate parameters were used as input data for ENVI-met 5.7.1 to construct the model. The BioMet 5.7.1 submodule of ENVI-met was used to compute PET values for both measured and simulated datasets.
3.3. ENVI-Met Model Setup
The existing condition (BM) was simulated using ENVI-met 5.7.1, calibrated against on-site measurements and cross-validated with data from the Niš Fortress Meteorological Station (WMO 13270). The computational domain comprised 215 × 210 × 40 cells with a spatial resolution of 2 × 2 × 2 m. Hourly meteorological forcing for 00:00–24:00 CET on 14 August 2024 was derived from the station’s hourly dataset. Large-scale wind varied from 190° at 1.5 m s−1 (02:00) to 230° at 2.4 m s−1 (14:00). The model was initialized with five soil layers (0–2 m depth) of loam and sandy-loam texture, surface roughness lengths ranging from 0.01–0.08 m, and albedos between 0.18 and 0.35 depending on the surface type. Radiation parameters followed the default ENVI-met two-stream shortwave and longwave scheme with an emissivity of 0.95. These parameters were adjusted based on field material sampling and ensured conclusive surface–atmosphere energy balance during the 48 h spin-up period.
To present all physical input parameters in one place, the complete set of soil, surface, and vegetation characteristics used in the ENVI-met simulations is summarized here. The five soil layers (0–2 m depth) were assigned loam and sandy-loam textures with ENVI-met default hydraulic and thermal properties. Surface materials used shortwave albedos between 0.18 and 0.35, an emissivity of 0.95, and aerodynamic roughness lengths (z0) ranging from 0.01 to 0.08 m depending on the material type (asphalt, concrete, bare soil, or grass). Vegetation was represented by two deciduous tree types and one grass type from the ENVI-met plant database (“Cylindric, medium trunk, sparse, medium”; “Spherical, medium trunk, sparse, small”; and “Grass, average density”). Their key geometric, physiological, and radiative properties (height, crown diameter, LAI, canopy density, evapotranspiration coefficient (Ke), shortwave albedo, and emissivity) are listed in Table 5.
Table 5.
ENVI-met vegetation model parameters applied in scenarios S1–S3.
Key atmospheric inputs and model settings are summarized in Table 6, which also clarifies the relationship between the station’s synoptic maximum and the hourly forcing maximum used in the model. The BM geometry is shown in Figure 4, and the scenario layouts (S0–S3) are presented in Figure 5. Figure 4 also illustrates the spatial relationship between the measurement points (P1–P4) and the ENVI-met model grid, ensuring a scale and orientation consistent with the field layout shown in Figure 3.
Table 6.
Initial input parameters for the ENVI-met simulation on 14 August 2024 (Niš, Serbia).
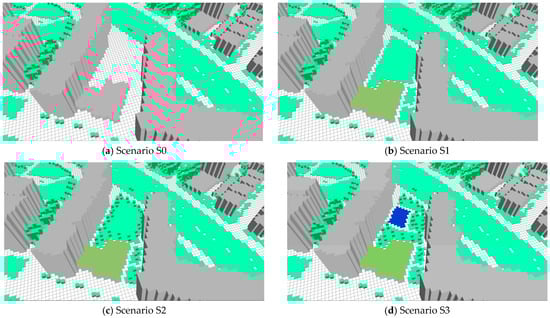
Figure 5.
Layout of scenarios: (a) S0; (b) S1; (c) S2; (d) S3.
Following the parameters listed in Table 5, PET was calculated at 1.4 m height using BioMet 5.7.1 with standard personal parameters: metabolic rate of 80 W m−2, clothing insulation of 0.6 clo, and reference air speed of 0.1 m s−1.
PET was evaluated at 1.4 m above ground level, consistent with the ENVI-met BioMet default pedestrian height representing the human body’s thermal center [58,94,95]. Before analysis, a 48 h spin-up was applied to stabilize thermal and moisture fluxes within the soil–building–air system, following the recommended 24–48 h buffer for model equilibration [96]. Model outputs (Ta, Tmrt, and PET) were archived at hourly intervals across the 24 h simulation period, with finer internal timesteps inspected during daytime peaks.
In this study, the ENVI-met output variable of potential air temperature (PAT) refers to the modeled near-surface air temperature at 1.5 m height, internally adjusted for adiabatic effects, which represents the local air temperature normalized to the model’s reference surface pressure. Validation was performed by comparing the measured air temperature with the ENVI-met “Potential Air Temperature”, consistent with standard practice in ENVI-met-based validation studies [94,97,98].
The difference between the synoptic maximum (40.5 °C) and the hourly forcing maximum (38.2 °C), as noted in Table 6, reflects temporal aggregation. Calibration aligned modeled diurnal peaks with on-site sensor records within the expected tolerance range.
To quantify the effect of the 2.3 °C difference between hourly forcing (38.2 °C) and the synoptic maximum (40.5 °C), an additional simulation was performed by adjusting the boundary input. The results show a mean PET increase of 1.9–2.4 °C across all points, with the highest deviation at P4 (≈60.9 °C). This confirms that the discrepancy in meteorological input induces only a minor bias within the model’s validated performance range [83,99].
3.4. Definition of the Project Scenarios
This study evaluates ground-level BGI solutions to improve OTC within the selected HRHA courtyard. The analysis is intentionally confined to interventions on the flat roof above the underground garage, which is flush with the surrounding ground level and adjacent paved areas, reflecting the site’s existing conditions and realistic constructability constraints.
Envelope retrofits (façades and roofs) and full replacement of pavement with porous slab systems were excluded, as they lie beyond the scope of this study. As noted in the Introduction, such measures are presently unlikely to be implemented at scale in Serbia under current budgetary and institutional constraints; this remains a contextual assumption rather than a cost-analysis limitation.
In several European cities (e.g., Copenhagen, Berlin, and Stuttgart), intensive green roofs over ground-level slabs of underground garages have successfully converted formerly paved OSs into multifunctional courtyards (lawns, pedestrian paths, play areas, and tree plantings), with documented OTC and social co-benefits [100,101,102]. The scenarios developed here adapt these principles to the context of the Serbian case.
BGI measures were targeted at P1 and P4. No interventions were defined at P2 and P3, with the latter serving as a limited green reference. Because the modeled OS areas are predominantly situated above the garage slab, proposed planting typologies were restricted to loads compatible with the construction of the ground-level slab of the underground garage. A formal structural-capacity and waterproofing assessment is assumed as a prerequisite for real-world implementation but lies outside the scope of this research.
To test mitigation potential and derive design guidance, four incremental surface-cover scenarios were defined and simulated in ENVI-met (Figure 5a–d).
Building geometry, traffic layout, and meteorological forcing were held constant across all runs; only ground-level materials and vegetation/water elements were varied:
- S0—Base case: Existing condition with continuous concrete/asphalt paving, except for a ~420 m2 lawn above the garage at P3 and a ~30 m2 lawn in front of commercial building C2.
- S1—Grass: Replacement of selected paved areas by lawn over the ground-level slab of the underground garage between and in front of R1 and R2, focusing on P1 and P4.
- S2—Grass + Deciduous Trees: Scenario S1 plus deciduous canopy trees positioned on the ground-level slab of the underground garage (in load-appropriate planting pits), primarily around P1 and P4 and between R1 and R2.
- S3—S2 + Shallow Reflecting Pool: Scenario S2 augmented with a ~40 m2 shallow reflecting pool located on the ground-level slab of the underground garage near P1.
Scenarios S1–S3 use the ENVI-met vegetation parameterization described in Table 5 (Section 3.3), while only the spatial arrangement of grass and trees differs between scenarios.
These scenarios were designed to isolate the stepwise cooling contributions of vegetation cover (grass and trees) and the small water surface, allowing for direct comparison of diurnal Ta, Tmrt, and PET responses under identical boundary conditions. The results are reported relative to S0 (BM), with spatial emphasis on the monitored points (P1–P4) and key activity nodes within the courtyard.
4. Results
To enhance clarity and reproducibility, the results are presented using quantitative visualizations, including heat maps that depict spatial and temporal variation in OTC indices across scenarios. Diurnal variation of PAT, (Tmrt), and PET is discussed explicitly to illustrate the magnitude and timing of thermal stress within the courtyard. Figures were reformatted to ensure consistent scales and are accompanied by self-contained captions summarizing key insights rather than descriptive content alone. A graphical summary at the end of this section synthesizes the main findings across scenarios.
4.1. Validation
A one-day summer field campaign was conducted under clear-sky and calm conditions within the study block. Although validation was conducted for a single representative day, this approach follows previous ENVI-met studies that adopted 24 h calibration campaigns under clearly defined forcing conditions [94,96,97,98]. Short-term validation has been shown to provide reliable model accuracy for urban microclimate analyses when clear-sky and heatwave conditions are selected.
Micrometeorological variables at pedestrian height (~1.5 m) were recorded using HOBO U23 data loggers, produced by Onset Computer Corporation, Bourne, MA, USA connected to an Almemo® portable data logger, while wind speed was measured with a Lutron AM-4215SD hot-wire anemometer produced by Lutron Electronic Enterprise Co., Ltd., Taipei, Taiwan [103]. Concurrent observations from the Niš Fortress Meteorological Station were used both to force and to constrain the ENVI-met simulations (see Table 5 for forcing inputs).
The ENVI-met simulation included a 48 h spin-up period preceding the analysis window to allow soil and façade heat stores and the radiative–aerodynamic budget to reach a quasi-steady diurnal cycle; only post-spin-up outputs were retained for comparison. Early-hour outputs were discarded to avoid initialization artefacts, following standard practice in urban microclimate validation studies [104,105].
Field time series were time-aligned with model outputs, screened for outliers and spikes, harmonized for sensor height and radiative geometry, and aggregated at the model’s one-hour temporal resolution. Measurements from the four pedestrian-level points (P1–P4) were aggregated using the median to obtain one representative hourly value per variable, reducing the effect of small-scale turbulence and shading variability. Therefore, the validation dataset consists of 96 hourly observations per variable (24 h × 4 points) that were transformed into 24 spatially aggregated (median) model–measurement pairs used for comparison with ENVI-met outputs. Model–measurement agreement was assessed pointwise at P1–P4 for air temperature (Ta), relative humidity (RH), wind speed (W), and mean radiant temperature (Tmrt). PET was computed from model outputs using BioMet with the same personal parameters specified in Section 3.3. Model performance was quantified using the mean absolute error (MAE), root mean square error (RMSE), mean bias error (MBE), and coefficient of determination (R2), reported both for daytime peak hours and for the full 24 h period (see figures and tables in the following subsections).
This validation protocol comprising local meteorological forcing, explicit spin-up, and pointwise comparison for Ta, RH, W, Tmrt, and PET is consistent with recent ENVI-met validation studies [60,62,105,106] demonstrating planning-grade accuracy for ENVI-met 5.7.1 in courtyard and dense urban environments when locally forced and calibrated. Superior agreement has been reported where local forcing and updated radiation schemes are applied [98], with multi-site confirmations reported in [98,107]. PET calculation followed the ENVI-met BioMet manual.
Because wind and radiation forcing critically influence model skill, these parameters were specified with particular care. Despite improvements in ENVI-met 5.7.1, summer Tmrt peaks can still be slightly underestimated—a tendency considered in the interpretation of PET patterns and heat-stress class transitions [108,109].
A simple bound based on the sensitivity of published PET elasticities to air temperature (≈0.6–1.1 °C·°C−1) indicates that a 2.3 °C higher forcing would raise the peak-hour PET by ≈1.4–2.5 °C without altering the heat-stress classification or the scenario ranking reported herein [37,38].
4.2. Overview of Microclimatic Parameters and PET Values of Individual Parts of OS Scenario S0—Existing State
For the existing condition (S0), diurnal profiles of Potential Air Temperature (PAT), W, RH, and PET were analyzed at four observation points (P1–P4). Hourly trajectories are shown in Figure 6, Figure 7, Figure 8 and Figure 9, and the corresponding values and summary statistics are given in Table A1 (Appendix A).
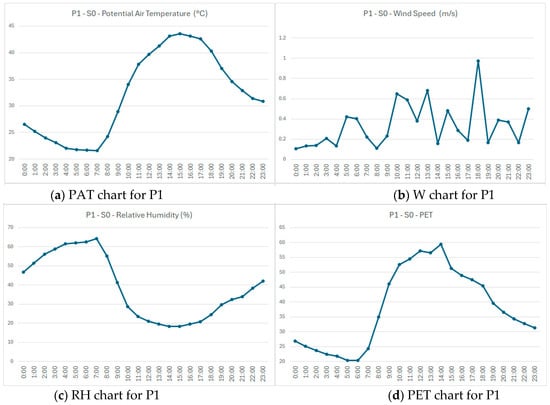
Figure 6.
Scenario S0—existing condition: hourly (a) PAT, (b) W, (c) RH, and (d) PET at P1.
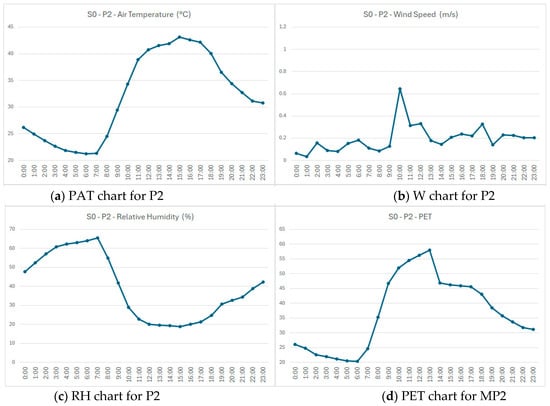
Figure 7.
Scenario S0—existing condition: hourly (a) PAT, (b) W, (c) RH, and (d) PET at P2.
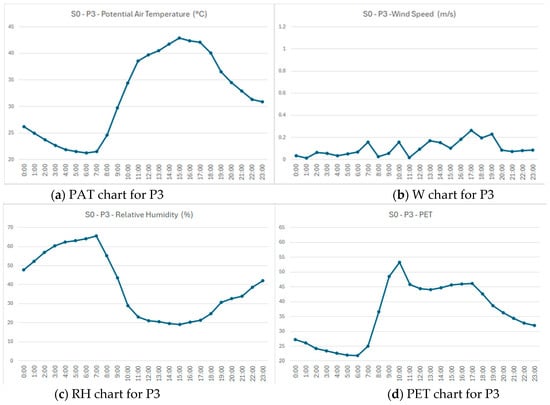
Figure 8.
Scenario S0—existing condition: hourly (a) PAT, (b) W, (c) RH, and (d) PET at P3.
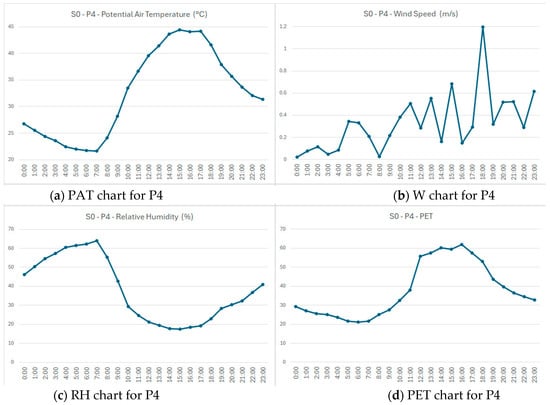
Figure 9.
Scenario S0–existing condition: hourly (a) PAT, (b) W, (c) RH, and (d) PET at P4.
The diurnal curves show that thermal stress peaks at 16:00 h, with PET reaching 61.9 °C, indicating extreme heat accumulation in the narrow paved canyon, despite afternoon shading.
According to the data provided in Figure 6, Figure 7, Figure 8 and Figure 9 and Table A1 (Appendix A), the following results were identified:
- At observation point P1, PAT decreased between 00:00 and 07:00 h, then rose to its maximum at 15:00 h. The PET curve generally followed this trend, with the lowest PAT occurring one hour after the most comfortable period. An inverse relationship was observed between PET and RH. Surrounding buildings and paved surfaces re-emitted stored heat, while the lack of ventilation contributed to PET rising starting at 05:00 h and reaching a relatively high maximum at 14:00 h. Despite façade shading after 15:00 h, thermal relief remained insufficient. Acceptable comfort occurred only between 00:00 and 03:00 and at 07:00 h, while pleasant conditions were limited to 03:00–06:00 h. By late evening (23:00 h), PET remained around 30.89 °C.
- At observation point P4, similar diurnal dynamics of PAT and RH were observed, with minor magnitude differences. The minimum PET occurred one hour earlier, while the maximum PET of 61.94 °C—the highest of all points—occurred one hour later than the maximum PAT. Due to limited air movement and strong heat accumulation caused by the enclosed geometry, OTC remained poor despite shading between 11:00 and 17:00–18:00 h. Pleasant comfort occurred only between 05:00 and 07:00 h.
- At observation points P2 and P3, PAT decreased between 00:00 and 06:00 h and peaked at 15:00 h, with negligible differences between these two locations. RH varied inversely with PAT:
- At P2, PET decreased from 00:00 to 06:00 h and reached its maximum at 13:00 h—two hours earlier than the PAT peak—due to heat release from dark asphalt.
- At P3, PET also decreased from 00:00 to 06:00 h and peaked at 53.21 °C at 10:00 h, which is 4–6 °C lower than the maxima at P1 and P2. This early peak reflected the dry, easternly oriented lawn lacking shade, with relatively low RH and weak ventilation (low W). Pleasant comfort occurred between 04:00 and 06:00 h, and acceptable comfort was confined to the hours of 00:00–04:00 h and 07:00 h.
Across all OS areas, OTC conditions were predominantly unfavorable, with acceptable levels observed only during the early morning hours.
4.3. Overview of Microclimate Parameters and PET Values of Scenarios of Individual Parts of OS
For scenario comparison, diurnal series of PAT, W, RH, and PET were evaluated for two representative observation points—P1 and P4—across all simulated scenarios (S0–S3). Hourly profiles are shown in Figure 10 and Figure 11, with detailed hourly values in Table A1 and Table A2 (Appendix A).
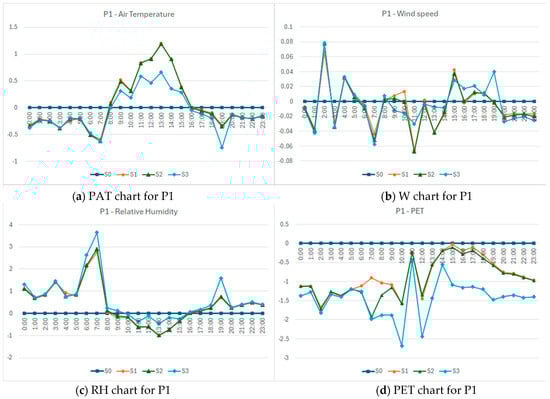
Figure 10.
Observation point P1: hourly (a) PAT, (b) W, (c) RH, and (d) PET in the base case (S0) and scenarios S1−S3.
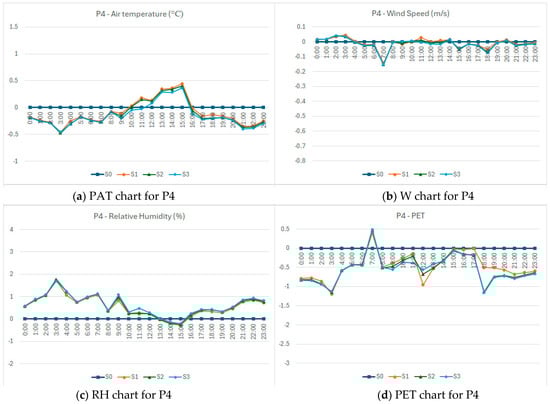
Figure 11.
Observation point P4: hourly (a) PAT, (b) W, (c) RH, and (d) PET in the base case (S0) and scenarios S1−S3.
Based on ENVI-met outputs, as well as Figure 10 and Table A1 (Appendix A), the following observations can be made for observation point P1:
- In Scenario S1, PAT followed a similar trend as in S0, being up to 1.2 °C lower in early morning and up to 0.9 °C higher at mid-day. PET values were slightly reduced—by less than 1.67 °C—compared to S0. Neither the presence of lawn nor façade shading after 15:00 h substantially improved OTC, which remained pleasant or acceptable only from 00:00 to 07:00 h, as in S0.
- In Scenario S2, PAT, RH, and W differed negligibly from S0, with PET reduced by about 1.2 °C only during early-morning hours, which was insufficient to improve daytime comfort. Pleasant or acceptable comfort persisted only from 00:00 to 07:00 h.
- In scenario S3, PAT and W differed minimally from S0, RH varied by up to 3.65%, and PET values were slightly lower—by up to 2.68 °C at 10:00 h. As in S0, shading after 15:00 h failed to bring conditions to acceptable levels; comfort remained confined to early-morning hours (00:00–07:00 h).
Therefore, the applied surface-level modifications had a negligible effect on OTC at P1, indicating limited microclimatic efficiency under the given conditions.
Differences between scenarios remained marginal, with maximum PET reductions below 2.7 °C under S3. The central paved courtyard retained high heat loads throughout the day, and acceptable comfort was limited to early-morning hours (00:00–07:00 h).
The diurnal patterns are nearly identical across scenarios, confirming that minor green interventions do not significantly mitigate heat stress in confined canyon spaces. PET peaks remained above 60 °C around 16:00 h, with pleasant comfort restricted to early-morning hours.
ENVI-met outputs, supported by Figure 11 and Table A2 (Appendix A), indicate the following results for observation point P4:
- In the base case (S0), PAT and PET both decreased during early-morning hours (07:00 h and 06:00 h, respectively). PET began rising one hour earlier and declined one hour later than PAT. The maximum PET of 61.94 °C occurred at 16:00 h, coinciding with minimum RH. Pleasant OTC occurred only between 05:00 and 07:00 h, and acceptable comfort only occurred during the periods of 01:00–04:00 h and 07:00–09:00 h.
- In scenarios S1 and S2, all parameters differed negligibly from S0. PET reductions were below 1 °C, and building shading in the morning did not improve OTC to acceptable levels.
- In scenario S1, OTC was pleasant from 04:00 to 07:00 h and acceptable during the hours of 00:00–04:00 h and 07:00–09:00 h.
- In Scenario S2, pleasant OTC occurred from 04:00 to 07:00 h, and acceptable OTC occurred during the hours of 00:00–04:00 h and 08:00–10:00 h.
These results indicate that greening and tree planting had no statistically significant effect in terms of improving OTC at point P4.
The minimal cooling observed across scenarios S1–S3 is largely attributable to the extremely low sky-view factor of the courtyard (SVF ≈ 0.10–0.35 across P1–P4), which traps longwave radiation between façades and limits radiative losses. Under these conditions, small surface-level BGI interventions (grass, individual trees, and shallow water) provide only marginal reductions in Ta, Tmrt, and PET, despite their well-documented performance in more open urban settings.
Figure 12 shows the spatial distribution of PAT for 06.00, 13.00, 16.00, and 22.00 h across all scenarios (S0–S3), using identical color bands from 20 to 45 °C.
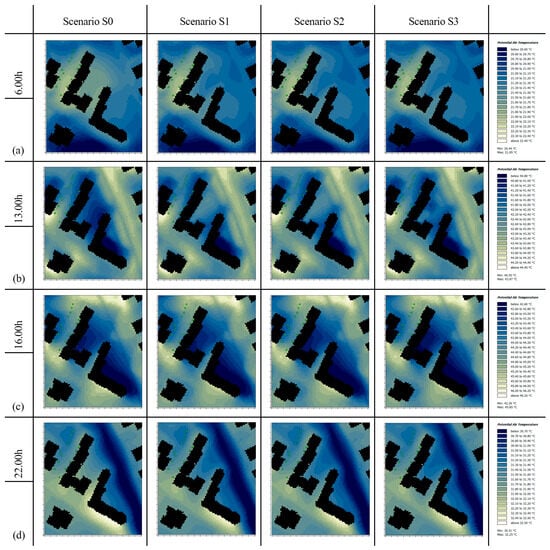
Figure 12.
Spatial representation of PAT in in the base case (S0) and scenarios S1, S2, and S3 at (a) 6 h (b), 13 h (c), 16 h (d), and 22 h. The green dots (or squares) visible in the illustrations represent tree canopies that begin at the observation height.
Morning cooling and late-evening recovery are limited to peripheral areas, while mid-day and afternoon heat accumulation is pronounced in the paved courtyard center. Surface modifications yield only slight temperature reductions (≤1.5 °C) under S3.
In Figure 13a–d, the spatial representation of PET is shown at four selected hours—6 h, 13 h, 16 h, and 22 h—for the base case (S0) and scenarios S1–S3.
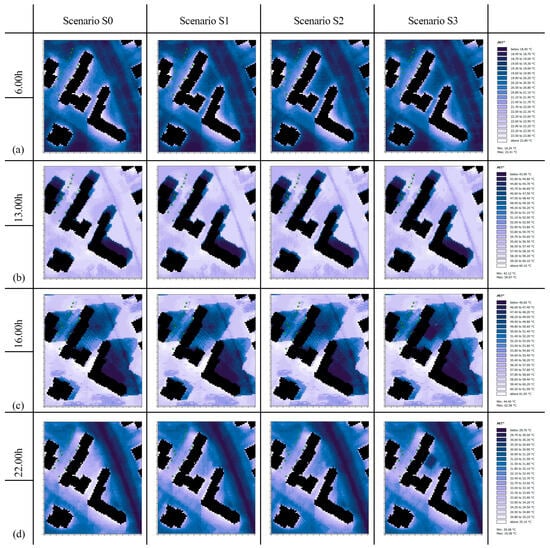
Figure 13.
Spatial representation of PET in in the base case (S0) and scenarios S1, S2, and S3 at (a) 6 h (b), 13 h (c), 16 h (d), and 22 h. The green dots (or squares) visible in the illustrations represent tree canopies that begin at the observation height. The asterisk in PET* denotes the ENVI-met BioMet variant of PET, calculated using ENVI-met’s internal thermophysiological model (with its own Tmrt scheme and standardized assumptions for clothing insulation, metabolic rate, emissivity, and radiative exchange).
Figure 14 presents the diurnal evolution of air temperature (PAT) at the four observation points (P1–P4) for the base case (S0) and retrofitting scenarios (S1–S3). The curves show a clear mid-day maximum (around 14:00 h), with the highest PAT values consistently recorded in the narrowest and most enclosed part of the courtyard (P4). This pattern reflects the influence of reduced building spacing, low sky-view factor, and constrained ventilation, which intensify heat accumulation. Although scenarios S1–S3 introduce small PAT reductions—mostly during the morning hours at P1—these differences generally remain within 1–1.5 °C and do not meaningfully change the overall diurnal temperature dynamics.
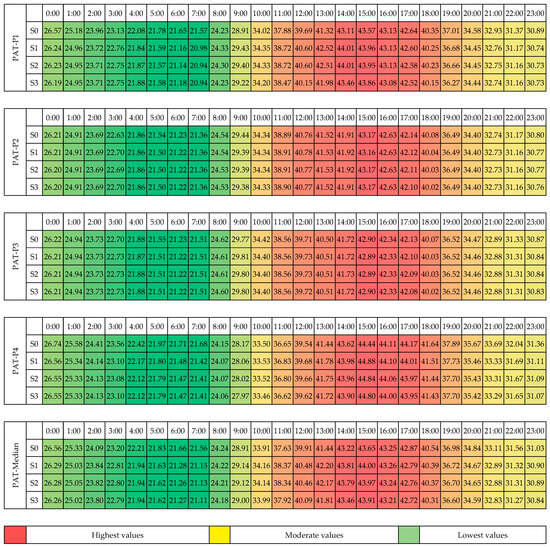
Figure 14.
Heat map of hourly air temperature (PAT, °C) at observation points P1–P4 for scenarios S0–S3 on 14 August.
Figure 14 shows pronounced mid-day heating (13:00–16:00 h), with the highest values at P4 due to morphological enclosure and reduced ventilation. Minor reductions in S1–S3 remain within 1–1.5 °C and do not alter the overall diurnal pattern.
Building on these temporal patterns, Figure 15 presents the spatial distribution of PET for the base case (S0) and retrofitting scenarios S1–S3 at four representative hours (06:00, 13:00, 16:00, and 22:00 h). The maps reveal that extreme afternoon heat-stress conditions (>55 °C) persist across most of the courtyard in all scenarios, with the highest values concentrated in morphologically constrained areas such as P4. Scenarios S1 and S2 introduce localized cooling around lawn patches and individual tree shade, but the effect is spatially limited and does not alter the dominant heat-stress category. Scenario S3 shows slightly larger cooling surfaces due to combined shading and the reflective water feature; however, these improvements remain insufficient to shift the thermal class during peak hours. Evening heat retention is also visible, particularly in the western and southern courtyard segments, reflecting high longwave storage in façades and pavements.
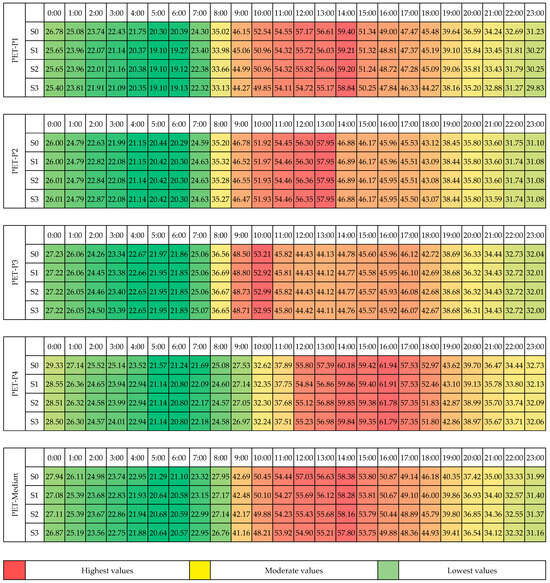
Figure 15.
Heat map of hourly PET (°C) for scenarios S0–S3 at observation points P1 and P4.
Extreme heat-stress values (>55 °C) persist across most courtyard zones, particularly in enclosed segments such as P4. Scenarios S1–S3 produce only localized cooling, with S3 showing the largest—yet still insufficient—mitigation effect during peak hours.
Across all scenarios (S0–S3), the PET patterns confirm that small-scale landscape interventions—grass, isolated trees, and shallow water features—provide only marginal thermal relief within a densely enclosed HRHA courtyard (Figure 16). Despite the additional shading and reflective water element in S3, most courtyard areas remain in the highest heat-stress category according to the Matzarakis classification [40], with PET exceeding 55 °C during the afternoon peak. The morphology of the courtyard—narrow canyon geometry, limited sky openness, and restricted airflow—dominates the thermal response, while morning hours (04:00–05:00 h) remain the only period offering acceptable outdoor thermal comfort.
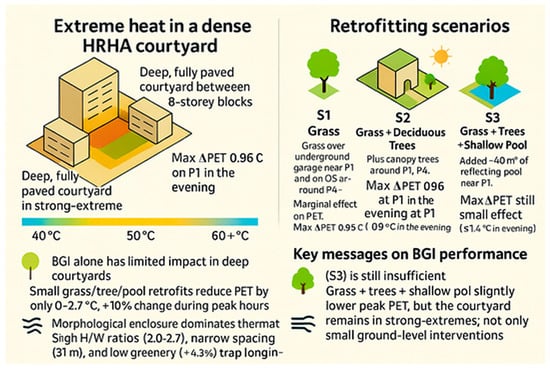
Figure 16.
Visual summary of the results.
5. Discussion
5.1. Synthesis of Key Findings
Based on field data collected in the OS in a densely built HRHA along Romanijska Street in Niš, Serbia, model validation demonstrated high reliability (R2 = 0.92; RMSE = 1.1 °C for PAT; R2 = 0.88; RMSE = 3.5 °C for PET). This strong agreement is visualized in Figure 17 and Figure 18 below. The diurnal comparison plots show a close alignment between measured and simulated values over the 24 h cycle, while the scatter plots confirm the high linear correlation.
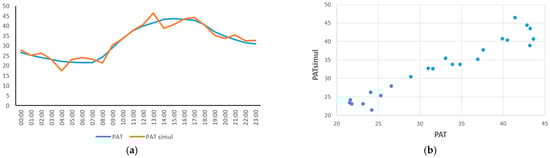
Figure 17.
Validation of PAT: (a) diurnal profile comparison of measured PAT and simulated PAT values; (b) scatter plot of measured vs. simulated PAT values.
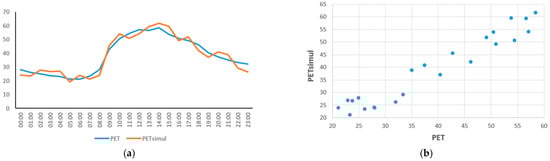
Figure 18.
Validation of Physiological Equivalent Temperature (PET): (a) diurnal profile comparison of measured and simulated PET values; (b) Scatter plot of measured vs. simulated PET values.
However, it is important to acknowledge that the meteorological forcing data used in the ENVI-met hourly input underestimated the synoptic maximum temperature (38.2 °C vs. 40.5 °C). Although a 2.3 °C difference exists between the hourly forcing maximum (38.2 °C) and the synoptic daily maximum (40.5 °C), sensitivity checks showed that this discrepancy resulted in PET deviations of 1.9–2.4 °C at all observation points. In the most enclosed paved canyon (P4), PET increased from 58.6 °C to about 60.9 °C (≈4–5% rise), while at P1–P3, PET increases ranged between +1.7 and +2.1 °C. These shifts remain within the validated model uncertainty (RMSE ≈ 3.5 °C) and do not alter the spatial or temporal interpretation of courtyard heat-stress patterns reported in this study.
Across all four observation points (P1–P4), PET values remained well above the “strong” and “extreme” heat-stress thresholds throughout most of the day, particularly in the afternoon. Consequently, OTC was highly unfavorable, except for a few early-morning and late-night hours—periods largely irrelevant for residents’ outdoor activity. These findings are consistent with previous research conducted in comparable urban environments [34,35,42].
The proposed retrofitting scenarios at P1 and P4 produced only modest improvements. At P1, PET decreased by 1.2 °C during minimum PAT periods across all scenarios and by 0.2 °C (S1 and S2) or 0.56 °C (S3) during maximum PAT hours. The largest PET reduction (2.68 °C) occurred at 10:00 h in S3. At P4, PET decreased by only 0.436 °C during minimum PAT periods and by 0.037–0.163 °C during periods of peak temperatures. These marginal improvements were insufficient to alleviate thermal discomfort.
The primary cause lies in the morphological enclosure and radiative trapping of heat. The height-to-width (H/W) ratio of approximately 0.87–2.7 promotes longwave radiation accumulation and restricts ventilation, sustaining high PAT and PET, even after mid-day. In such a low-SVF environment, a large fraction of outgoing longwave radiation is repeatedly exchanged between façades and the ground instead of being lost to the sky, while airflow is constrained by the compact block form. These conditions help explain why the grass, isolated trees and shallow water in scenarios S1–S3 leads only to marginal reductions in Ta, Tmrt, and PET, even though similar measures often achieve stronger cooling in more open urban settings. Therefore, the results suggest that in dense post-socialist HRHA courtyards, small surface-level BGI interventions are unlikely to provide substantial thermal relief unless they are combined with measures that increase sky openness and improve ventilation. The highest PET (61.9 °C) was recorded in the narrow paved canyon (P4), which is defined by tall façades and limited width.
The analyzed block—typical of many Serbian HRHAs—shows an extremely high built-up intensity (SC ≈ 0.43; FAR ≈ 3.27), a small OS area per capita (≈3.45 m2/person), a very low greenery share relative to the net block area (≈4.3%, with ≈95% impervious surfaces), and minimal green area per inhabitant (≈0.27 m2/person). This value is below the city average of 1.2 m2/person and far below international recommendations. Current Serbian planning regulations require a minimum building separation (for NW–SE orientation) of 1.5 H; in the P4 courtyard, this would require 46.5 m, whereas the actual spacing is only 31 m, significantly impeding ventilation and promoting heat entrapment across all scenarios.
At P1, shallow soil above the underground garages and scarce vegetation reduce evapotranspiration, resulting in only minor PAT decreases while PET remains high. Pleasant or acceptable OTC occurs only from 00:00 to 07:00 h. The massive concrete slab stores and re-emits heat, counteracting daytime cooling (Figure 10 and Figure 11). Although previous studies have documented substantial benefits of vegetation and shading [69,74], the present results confirm that in dense blocks with low sky-view factors and poor ventilation, such measures yield only marginal improvements. PET remains high, and OTC is restricted to early-morning hours.
While previous studies in less compact urban settings have reported PET reductions of 2–6 °C for comparable blue–green infrastructure (BGI) interventions [110,111,112], the present results indicate much smaller changes—typically below 2.7 °C and often <1 °C during peak hours. This discrepancy reflects the deep morphological enclosure and poor ventilation characteristic of post-socialist HRHA courtyards, which cause such measures to yield only marginal improvements. As a result, PET remains high, and OTC is limited to the early-morning hours.
These results further demonstrate that the limited reduction in PET values across all retrofitting scenarios is primarily driven by the morphological enclosure of the analyzed HRHA block. Points with high height-to-width ratios (H/W = 2.0–2.7), reduced building separation (≈31 m instead of the required 46.5 m), and low sky openness exhibited negligible cooling (<0.5 °C), despite added greening or reflective surfaces. In contrast, more open spaces with less obstructed airflow achieved up to a 2.7 °C reduction. This pattern confirms that radiative trapping and constrained ventilation—mechanisms typically associated with very low sky-view factors—dominate the thermal environment and suppress the cooling potential of small-scale BGI interventions. Although SVF and radiation balance components were not explicitly calculated, their effects are implicitly captured through the analyzed morphological indicators. A dedicated quantitative SVF–PET correlation analysis is planned for future research.
The timing of shading further constrains mitigation. In S2–S3, tree canopies cast shade only later in the day, failing to mitigate peak heat stress between 13:00 and 16:00 h, when heat loads are maximal. Consequently, overall mitigation remains limited (Figure 10 and Figure 11). The shallow reflecting pool (40 m2) in S3 reduced PET by 2.68 °C at 10:00 h (P1), but this effect did not translate into improved daytime comfort, as radiative storage within façades quickly offset the cooling. This outcome supports previous findings that small water features provide limited benefits unless integrated within larger BGI systems [113,114,115].
In summary, small-scale ground-level interventions are insufficient to mitigate heat stress in dense post-socialist HRHAs. Effective adaptation demands integrated strategies combining morphological regulation, canopy expansion, permeable surfaces, ventilation corridors, and vertical or roof greening.
5.2. Suggestions for Planning and Design
The results clearly demonstrate that compact urban morphology—characterized by high H/W ratios, limited building separation, and a restricted sky-view factor—significantly reduces the mitigation potential of small-scale blue–green infrastructure (BGI). Diurnal curves, spatial distributions of PET, and heat maps (Figure 6, Figure 7, Figure 8, Figure 9, Figure 10, Figure 11, Figure 12, Figure 13, Figure 14 and Figure 15) consistently indicate that microclimatic improvements remain marginal in deeply enclosed HRHA courtyards. Therefore,
- Tree canopy coverage should be prioritized in OSs where ventilation is less obstructed and shading can be timed to daily peak periods;
- Interventions in enclosed canyons (e.g., P4) are unlikely to provide substantial relief unless combined with structural or ventilation improvements;
- Grass and shallow water features offer only marginal cooling in deeply enclosed courtyards dominated by thermal storage and radiative trapping.
These insights provide actionable guidance for planning and regeneration within HRHA estates, especially those built above underground garages, where soil depth and load-bearing capacity severely constrain planting options.
The results confirm that small-scale interventions (lawns, individual trees, and shallow water features) cannot deliver significant PET reductions or meaningfully improve OTC in deep, semi-enclosed courtyards. The study intentionally focused on affordable, ground-level retrofitting measures suitable for current Serbian conditions, where operational budgets, institutional capacity, and regulatory frameworks limit the adoption of more complex solutions. While hybrid measures such as façade greening, vertical greening systems, and high-albedo coatings were not simulated, as they require higher capital investment, technical maintenance, and regulatory support that are presently uncommon in Serbian HRHA contexts, such measures may offer substantial benefits if future programs, funding mechanisms, or public–private partnerships enable their application at scale.
Scope note: The following recommendations refer only to interventions simulated and validated for the Romanijska Street courtyard during the 14 August 2024 heatwave. Reported effects correspond directly to model–measurement comparisons (Figure 10 and Figure 11 and Table A1, Table A2 and Table A3-Appendix A), including the PET heat maps (Figure 15).
5.2.1. What the Study Supports (Evidence-Based)
The empirical evidence obtained from the validated microclimatic simulations allows for a set of concrete, site-specific recommendations directly grounded in observed thermal patterns. The following measures are therefore supported by the model–measurement agreement and can be confidently applied in similar HRHA courtyard environments.
- Remove dark asphalt from paved areas (P2-type surfaces)—In S0, dark asphalt advanced and amplified PET peaks relative to air-temperature peaks at P2; replacing small asphalt patches with lawn (S1) yielded ≤1.7 °C PET reductions at P1 but did not improve afternoon comfort (13:00–16:00 h).
Recommendation: phase out asphalt within pedestrian cores; where resurfacing is feasible, prioritize lighter, low-storage finishes (Figure 6, Figure 7, Figure 8, Figure 9 and Figure 15; Table A1-Appendix A).
- 2.
- Specify light-colored, low-heat-storage finishes on ground-level slabs of underground garage areas (P1/P4)—At P1, high thermal storage suppressed evening cooling; even in S3, afternoon PET remained within “strong–extreme” heat-stress classes.
Recommendation: Adopt light, low-storage slabs above underground garage finishes as a necessary (though not sufficient) measure to reduce retained heat (Figure 10, Figure 11 and Figure 15; Table A2 and Table A3-Appendix A).
- 3.
- Align shade with the daily peak (13:00–16:00 h)—In S2–S3, canopy shade arrived too late to mitigate the peak; PET reductions at P1 were ≤1.2 °C in early morning and ≤0.6 °C near the peak.
Recommendation: Tree placement and crown size should be planned so that shade covers the main activity zone during the hours of 13:00–16:00 h. This timing requirement follows directly from the observed diurnal pattern (Figure 10 and Figure 11).
- 4.
- Small reflecting pools offer modest off-peak relief only—The ~40 m2 pool in S3 produced the largest observed reduction at P1 (ΔPET = 2.68 °C at 10:00 h) but did not change the afternoon heat-stress class.
Recommendation: Water features of this size should be combined with shade timed at 13:00–16:00 h; by themselves, they will not secure acceptable afternoon comfort (Figure 10 and Figure 15; Table A2-Appendix A).
- 5.
- Operational window for use—Across S0–S3, pleasant/acceptable OTC occurs mainly during the hours of 04:00–07:00 h; evenings retain heat due to storage, especially in narrow canyons (P4, PET max = 61.9 °C at 16:00 h).
5.2.2. What the Study Cannot Prescribe (Not Tested Here and Requires Further Research)
While the evidence allows for several concrete recommendations, certain design variables were not parameterized in this study. As these factors can substantially influence courtyard microclimates, the following elements cannot be prescribed at this stage and require targeted simulations or monitoring.
- Building height/spacing and plot coverage—Although results show that enclosure and radiative trapping drive overheating (e.g., P4), the study did not vary H/W, SVF, building spacing, or coverage.
Recommendation: Parametric testing is recommended to identify thresholds (e.g., spacing and height caps) that provide adequate SVF during the hours of 13:00–16:00 h.
- Minimum canopy coverage targets—While timing of shade is critical, the study did not investigate canopy fraction/continuity.
Recommendation: Derive scenario-specific canopy fractions that shift the PET class during the daily peak.
- Permeability of structural ground-level slabs above underground garages—The study assessed only small lawn patches placed on the structural slab but did not test fully permeable or hybrid permeable drainage systems. Such solutions typically require substantial capital investment, structural reinforcement, and long-term maintenance capacities that exceed current economic conditions in Serbian HRHA estates.
Recommendation: Future work should quantify permeability ratios and lightweight system configurations that are compatible with garage slabs and economically feasible while still capable of producing measurable reductions in afternoon PET.
- Ventilation corridors—No openings, perforations, or spatial realignments were modeled to modify the prevailing wind paths. Although ventilation corridors can meaningfully improve courtyard airflow, their implementation generally entails major structural interventions, property consolidation, and significant financial resources—conditions not aligned with current economic and institutional capacities in Serbia.
Recommendation: Parametric simulations of realistic, financially attainable corridor geometries are necessary to determine configurations that can measurably reduce PET during the daily peak (13:00–16:00 h).
Despite the clear evidence-based recommendations outlined above, several structural and aerodynamic factors remain insufficiently explored within the present simulation framework. Addressing these limitations requires a more comprehensive research program, as outlined in the following section.
5.3. Future Research Directions
Building on the present single-day, single-site assessment and recognizing the untested variables identified in Section 5.2.2, future research should advance along the following axes:
- Multi-seasonal evidence: Extend field campaigns beyond heatwaves to cover spring–autumn (including shoulder seasons) and night-time periods, capturing humidity/radiation–wind co-variability and storage-release cycles that shape PET diurnals.
- Human perception and exposure: Pair microclimate measurements with on-site thermal sensation votes (TSVs), short exposure diaries, and observations of adaptive behaviors (e.g., shade seeking and timing of stay) to relate PET shifts to perceived comfort and plausible health risk.
- Parametric morphology tests: Systematically vary height–width ratios, the sky-view factor, building spacing/orientation, and canopy coverage/continuity to identify thresholds that move PET out of strong/extreme classes during the hours of 13:00–16:00 h (e.g., minimum SVF or canopy fraction for peak-hour relief).
- Ventilation and permeability levers: Evaluate ventilation-corridor geometries (openings and alignments) and the permeability underground garage-compatible slabs (substrate depth, porous systems) to quantify combined effects on afternoon PET under prevailing wind regimes.
- Regional transferability: Replicate the measurement–validation workflow across multiple western Balkan estates to derive context-specific benchmarks and planning targets suitable for regulation and design briefs.
These steps will translate modeling gains into operational guidance by linking microclimate performance to human perception and exposure across representative post-socialist settings.
6. Conclusions
This study evaluated outdoor thermal comfort in the open spaces of a high-rise housing area in Niš, Serbia, during the record heatwave of 14 August 2024. A 24 h field campaign provided the air temperature, relative humidity, wind speed, and mean radiant temperature for validation of an ENVI-met microclimate model, which was then used to conduct stepwise testing of blue–green infrastructure scenarios—grass (S1), grass with deciduous trees (S2), and S2 plus a shallow reflecting pool (S3)—against the existing condition (S0). Thermal stress was assessed with PET. Across all monitored points, daytime PET frequently reached strong to extreme heat-stress classes, and even the most favorable configuration delivered only modest reductions, which were insufficient to create acceptable afternoon comfort during peak hours.
Beyond these site-specific findings, the research offers two broader contributions. First, it provides, to the best of our knowledge, the first field-validated ENVI-met application for a post-2000 Serbian infill block under an actual extreme-heat event, demonstrating planning-grade agreement between measurements and simulations. Second, it quantifies the upper-bound cooling that can be expected from small surface-level blue–green infrastructure in deep, semi-enclosed courtyards: lawn patches, isolated trees, and a ~40 m2 shallow pool lowered PET by only a few degrees and did not shift afternoon conditions into comfortable ranges. Therefore, the results indicate that courtyard morphology—high enclosure, low sky-view factor, restricted ventilation, and extensive impervious cover—dominates outdoor thermal comfort and constrains the efficacy of minor surface interventions.
The practical implication is that meaningful thermal relief in comparable post-socialist high-rise housing areas will depend on integrated morphology-aware strategies that combine increased vegetation volume and continuity, permeability improvements, adequate building separations to enable airflow, and multi-level greening (ground, façades, and roofs), complemented by light, low-storage surface materials. The present work is limited to one courtyard type, one extreme day, and ground-level slabs of underground garage-feasible measures; future research should expand the scenario space (including ventilation corridors and canopy coverage targets), assess multi-seasonal behavior, and link microclimate changes to exposure and health-risk indicators. In brief, under the conditions examined here, small-scale blue–green infrastructure improves PET marginally but cannot, by itself, deliver comfortable afternoons during heatwaves; validated modeling confirms that only integrated, form-conscious interventions can achieve resilient open spaces in dense residential settings.
This study assessed outdoor thermal comfort in the open spaces in a high-rise housing area containing residential buildings (P + 8) in Niš, Serbia, constructed in the post-socialist period. Climatic parameters were obtained through direct field observations and ENVI-met simulations during an extreme heatwave on 14 August 2024. Four scenarios (S0–S3) and four observation points (P1–P4) were analyzed to evaluate the influence of different blue–green infrastructure configurations on outdoor thermal comfort. The existing condition (S0) exhibited extremely high PET values, confirming that thermal stress was severe or extreme for most of the day at all locations. These results indicate that the built morphology and surface characteristics of dense infill high-rise housing areas are the dominant drivers of overheating.
The three proposed retrofit scenarios—S1–S3—produced only minor temperature and PET reductions. Even the most favorable scenario (S3) achieved a maximum PET reduction of 2.68 °C, which was insufficient to meaningfully improve thermal comfort. The findings reveal that in deep, semi-enclosed courtyards typical of post-socialist housing blocks, small-scale surface-level measures cannot substantially mitigate heat stress during summer heatwaves. Morphological enclosure, a low sky-view factor, limited ventilation, and extensive impervious surfaces prevent significant cooling, even when vegetation or shallow water elements are introduced.
To achieve sustainable usability of open spaces, a comprehensive, integrated approach is required. The measures proposed in Section 5.2—limiting building height and coverage; ensuring adequate spacing for ventilation; increasing canopy cover; introducing continuous green corridors; and employing light, permeable materials—should be prioritized in urban plan revisions. These measures need institutional support through national programs such as the Green Transition of Serbia and the Global Environmental Fund framework.
Beyond regulatory reform, implementation should combine ground-level greenery with vertical greening, green roofs, permeable pavements, dynamic water features, and shading networks at the neighborhood scale. Such multi-layered strategies can achieve measurable microclimate improvement and support social use of outdoor spaces during extreme heat.
This research provides a quantitative and qualitative basis for improving urban plans, design guidelines, and regeneration programs for high-rise housing areas in Serbia and across southeastern Europe, where similar morphological and climatic conditions prevail. Future work should focus on identifying optimal spatial configurations, applying multi-seasonal monitoring, and integrating CFD modeling and user behavioral data to link microclimate improvements with public health and livability outcomes.
Author Contributions
Conceptualization, I.B.P.; Methodology, I.B.P. and L.V.; Software, N.P.; Validation, N.P.; Formal analysis, I.B.P. and L.V.; Investigation, I.B.P.; Data curation, I.B.P.; Writing—original draft preparation, I.B.P.; Writing—review and editing, I.B.P. and L.V.; Visualization, I.B.P. and N.P. All authors have read and agreed to the published version of the manuscript.
Funding
This research was supported by the Science Fund of the Republic of Serbia (Grant No. 7572, Reclaiming Public Open in Residential Areas: Shifting Planning Paradigms and Design Perspectives for a Resilient Urban Future—RePOS) and by the Ministry of Science, Technological Development, and Innovation of the Republic of Serbia, under the Agreement on Financing the Scientific Research Work of Teaching Staff at the Faculty of Civil Engineering and Architecture, University of Niš-Registration (registration number: 451-03-137/2025-03/200095; dated 4 February 2025.
Institutional Review Board Statement
Not applicable.
Informed Consent Statement
Not applicable.
Data Availability Statement
Data are contained within the article.
Conflicts of Interest
The authors declare no conflicts of interest.
Abbreviations
The following abbreviations are used in this manuscript:
UHI—urban heat island; OTC—outdoor thermal comfort; OS—open space; HRHA—high-rise housing area; PET—physiological equivalent temperature; BGI—blue–green infrastructure; PAT—potential air temperature; BM—base model; SVF—sky-view factor.
Appendix A
Table A1.
Scenario S0—existing condition: hourly values and summary statistics of PAT, W, RH, and PET at P1–P4.
Table A1.
Scenario S0—existing condition: hourly values and summary statistics of PAT, W, RH, and PET at P1–P4.
| P1 | P2 | P3 | P4 | |||||
|---|---|---|---|---|---|---|---|---|
| Time | PAT | PET | PAT | PET | PAT | PET | PAT | PET |
| (h) | (°C) | (°C) | (°C) | (°C) | (°C) | (°C) | (°C) | (°C) |
| 1 | 2 | 3 | 4 | 5 | 6 | 7 | 8 | 9 |
| 0.00 | ||||||||
| 1.00 | ||||||||
| 2.00 | ||||||||
| 3.00 | Fall on 21.24 | Fall on 20.29 | Fall on 21.24 | |||||
| 4.00 | Fall on 21.57 | Fall on 20.30 | Fall on 21.30 | Fall on 21.85 | Fall on 21.68 | |||
| 5.00 | ||||||||
| 6.00 | ||||||||
| 7.00 | ||||||||
| 8.00 | Rise on 53.21 | |||||||
| 9.00 | max | |||||||
| 10.00 | Rise on 57.95 | |||||||
| 11.00 | Rise on 43.57 | Rise on 43.17 | max | |||||
| 12.00 | max | Rise on 59.40 | max | Rise on 42.90 | Rise on 44.43 | Rise on 61.94 | ||
| 13.00 | max | max | max | max | ||||
| 14.00 | ||||||||
| 15.00 | ||||||||
| 16.00 | ||||||||
| 17.00 | ||||||||
| 18.00 | ||||||||
| 19.00 | ||||||||
| 20.00 | Fall on 31.10 | Fall on 32.04 | Fall on 31.36 | Fall on 32.73 | ||||
| 21.00 | Fall on 30.80 | Fall on 30.87 | ||||||
| 22.00 | Fall on | Fall on 31.23 | ||||||
| 23.00 | 30.89 | |||||||
|
|
|
| |||||
Table A2.
Observation point P1: hourly values and ΔPET per scenario.
Table A2.
Observation point P1: hourly values and ΔPET per scenario.
| S0 | S1 | S2 | S3 | |||||||||
|---|---|---|---|---|---|---|---|---|---|---|---|---|
| Time | PAT | PET | ∆PET | PAT | PET | ∆PET | PAT | PET | ∆PET | PAT | PET | ∆PET |
| (h) | (°C) | (°C) | (°C) | (°C) | (°C) | (°C) | (°C) | (°C) | (°C) | (°C) | (°C) | (°C) |
| 1 | 2 | 3 | 4 | 5 | 6 | 7 | 8 | 9 | 10 | 11 | 12 | 13 |
| 0.00 | ||||||||||||
| 1.00 | ||||||||||||
| 2.00 | ||||||||||||
| 3.00 | Fall on | (0.5 h) | Fall on | Fall on | (0.5 h) | Fall on | ||||||
| 4.00 | Fall on | 19.10 | −1.2 | 20.94 | 19.10 | −1.20 | 19.10 | (0.5 h) | ||||
| 5.00 | Fall on | 20.3 | Fall on | Fall on | −1.20 | |||||||
| 6.00 | 21.57 | 20.98 | 20.93 | |||||||||
| 7.00 | ||||||||||||
| 8.00 | ||||||||||||
| 9.00 | ||||||||||||
| 10.00 | Rise on | Rise on | ||||||||||
| 11.00 | Rise on | Rise on | 59.21 | 59.20 | (14 h) | Rise on | ||||||
| 12.00 | 59.40 | 44.05 | max | (14 h) | Rise on | max | −0.20 | 58.84 | ||||
| 13.00 | Rise on | max | −0.19 | 44.01 | Rise on | max | (14 h) | |||||
| 14.00 | 43.57 | 43.86 | −0.56 | |||||||||
| 15.00 | ||||||||||||
| 16.00 | ||||||||||||
| 17.00 | ||||||||||||
| 18.00 | ||||||||||||
| 19.00 | ||||||||||||
| 20.00 | ||||||||||||
| 21.00 | Fall on | Fall on | Fall on | (23 h) | Fall on | Fall on | (23 h) | Fall on | Fall on | (23 h) | ||
| 22.00 | 30.89 | Fall on | 30.74 | 30.26 | −0.96 | 30.73 | 30.25 | −0.98 | 30.73 | 29.83 | −1.40 | |
| 23.00 | 31.23 | |||||||||||
|
|
|
| |||||||||
Table A3.
Observation point P4: hourly values and ΔPET per scenario.
Table A3.
Observation point P4: hourly values and ΔPET per scenario.
| S0 | S1 | S2 | |||||||
|---|---|---|---|---|---|---|---|---|---|
| Time | PAT | PET | ∆PET | PAT | PET | ∆PET | PAT | PET | ∆PET |
| (h) | (°C) | (°C) | (°C) | (°C) | (°C) | (°C) | (°C) | (°C) | (°C) |
| 1 | 2 | 3 | 4 | 5 | 6 | 7 | 8 | 9 | 10 |
| 0.00 | |||||||||
| 1.00 | |||||||||
| 2.00 | |||||||||
| 3.00 | Fall on | Fall on | (0.6 h) | Fall on | (0.6 h) | ||||
| 4.00 | Fall on | 21.24 | Fall on | 20.80 | Fall on | 20.80 | |||
| 5.00 | 21.68 | 21.42 | −0.436 | 21.41 | |||||
| 6.00 | −0.436 | ||||||||
| 7.00 | |||||||||
| 8.00 | |||||||||
| 9.00 | |||||||||
| 10.00 | |||||||||
| 11.00 | Rise on | Rise on 44.88 | Rise on 44.84 | ||||||
| 12.00 | 44.43 | Rise on | max | Rise on 61.91 | max | Rise on 61.78 | |||
| 13.00 | max | 61.94 | max | (16.0 h) | max | (16 h) | |||
| 14.00 | max | −0.037 | −0.163 | ||||||
| 15.00 | |||||||||
| 16.00 | |||||||||
| 17.00 | |||||||||
| 18.00 | |||||||||
| 19.00 | |||||||||
| 20.00 | Fall on | Fall on | Fall on | Fall on | (23 h) | Fall on | Fall on | (23 h) | |
| 21.00 | 31.36 | 32.73 | 31.11 | 32.13 | −0.602 | 31.09 | 32.09 | −0.643 | |
| 22.00 | |||||||||
| 23.00 | |||||||||
|
|
| |||||||
References
- United Nations, Department of Economic and Social Affairs. Available online: https://www.un.org/uk/desa/68-world-population-projected-live-urban-areas-2050-says-un (accessed on 20 February 2025).
- Yao, L.; Sun, S.; Song, C.; Li, J.; Xu, W.; Xu, Y. Understanding the spatiotemporal pattern of the urban heat island footprint in the context of urbanization, a case study in Beijing, China. Appl. Geogr. 2021, 133, 102496. [Google Scholar] [CrossRef]
- Sultana, S.; Satyanarayana, A.N.V. Urban heat island intensity during winter over metropolitan cities of India using remote-sensing techniques: Impact of urbanization. Int. J. Remote Sens. 2018, 39, 6692–6730. [Google Scholar] [CrossRef]
- Voogt, J.A.; Oke, T.R. Thermal remote sensing of urban climates. Remote Sens. Environ. 2003, 86, 370–384. [Google Scholar] [CrossRef]
- Mushore, T.D.; Mutanga, O.; Odindi, J.; Dube, T. Linking major shifts in land surface temperatures to long term land use and land cover changes: A case of Harare, Zimbabwe. Urban Clim. 2017, 20, 120–134. [Google Scholar] [CrossRef]
- Cuce, P.M.; Cuce, E.; Santamouris, M. Towards Sustainable and Climate-Resilient Cities: Mitigating Urban Heat Islands Through Green Infrastructure. Sustainability 2025, 17, 1303. [Google Scholar] [CrossRef]
- Ren, Y.; Lafortezza, R.; Giannico, V.; Sanesi, G.; Zhang, X.; Xu, C. The unrelenting global expansion of the urban heat island over the last century. Sci. Total Environ. 2023, 880, 163276. [Google Scholar] [CrossRef]
- Oke, T.R. The energetic basis of the urban heat island. Q. J. R. Meteorol. Soc. 1982, 108, 1–24. [Google Scholar] [CrossRef]
- Rizwan, A.M.; Dennis, L.Y. A review on the generation, determination and mitigation of Urban Heat Island. J. Environ. Sci. 2008, 20, 120–128. [Google Scholar] [CrossRef]
- Amengual, A.; Homar, V.; Romero, R.; Brooks, H.E.; Ramis, C.; Gordaliza, M.; Alonso, S. Projections of heat waves with high impact on human health in Europe. Glob. Planet. Change 2014, 119, 71–84. [Google Scholar] [CrossRef]
- Koppe, C.; Kovats, S.; Jendritzky, G.; Menne, B. Heat-Waves: Risks and Responses; World Health Organization: Copenhagen, Denmark, 2004. [Google Scholar]
- Marando, F.; Heris, M.P.; Zulian, G.; Udías, A.; Mentaschi, L.; Chrysoulakis, N.; Maes, J. Urban heat island mitigation by green infrastructure in European Functional Urban Areas. Sustain. Cities Soc. 2022, 77, 103564. [Google Scholar] [CrossRef]
- Copernicus Climate Change Service (C3S). Copernicus Record-Breaking Heat Stress in Southeastern Europe During Summer 2024; Copernicus Climate Change Service; European Centre for Medium-Range Weather Forecasts: Reading, UK, 2025; Available online: http://climate.copernicus.eu/copernicus-record-breaking-heat-stress-southeastern-europe-during-summer-2024 (accessed on 8 May 2025).
- UNICEF. Rising Heat Across Europe and Central Asia Kills Nearly 400 Children a Year. Press Release, 24 July 2024. Available online: https://www.unicef.org/serbia/en/press-releases/rising-heat-across-europe-and-central-asia-kills-nearly-400-children-a-year (accessed on 12 May 2025).
- Republic of Serbia, Ministry of Environmental Protection. Climate Change Adaptation Programme for the Period 2023–2030; Adopted 12 July 2024. Available online: https://unfccc.int/sites/default/files/resource/NAP_Serbia_2024.pdf (accessed on 3 March 2025).
- Đurđević, V.; Vuković, A.; Vujadinović Mandić, M. Climate Changes Observed in Serbia and Future Climate Projections Based on Different Scenarios of Future Emissions; United Nations Development Programme (UNDP) Serbia: Belgrade, Serbia, October 2018; ISBN 978-86-7728-301-8. Available online: https://www.klimatskepromene.rs/wp-content/uploads/2021/08/Observed-Climate-Change-and-Projections.pdf (accessed on 10 July 2025).
- Republic Hydrometeorological Service of Serbia (RHMSS). Seasonal Bulletin for Serbia, Summer 2024; Republic Hydrometeorological Service of Serbia: Belgrade, Serbia, 2024. Available online: https://www.hidmet.gov.rs/data/klimatologija/eng/summer.pdf (accessed on 2 June 2025).
- Vasilevska, L.; Vranic, P.; Marinkovic, A. The effects of changes to the post-socialist urban planning framework on public open spaces in multi-story housing areas: A view from Nis, Serbia. Cities 2014, 36, 83–92. [Google Scholar] [CrossRef]
- Bogdanović Protić, I.; Mitković, P.; Vasilevska, L.J. Toward regeneration of public open spaces within large housing estates–A case study of Niš, Serbia. Sustainability 2020, 12, 10256. [Google Scholar] [CrossRef]
- Yuan, T. The Role of Green Infrastructure in Mitigating the Urban Heat Island Effect. Open J. Appl. Sci. 2024, 14, 3155–3164. [Google Scholar] [CrossRef]
- Vujovic, S.; Haddad, B.; Karaky, H.; Sebaibi, N.; Boutouil, M. Urban heat island: Causes, consequences, and mitigation measures with emphasis on reflective and permeable pavements. CivilEng 2021, 2, 459–484. [Google Scholar] [CrossRef]
- Piracha, A.; Chaudhary, M.T. Urban air pollution, urban heat island and human health: A review of the literature. Sustainability 2022, 14, 9234. [Google Scholar] [CrossRef]
- Stanilov, K. Taking stock of post-socialist urban development: A recapitulation. In The Post-Socialist City: Urban Form and Space Transformations in Central and Eastern Europe after Socialism; Stanilov, K., Ed.; Springer: Dordrecht, The Netherlands, 2007; pp. 3–17. [Google Scholar]
- Nedučin, D.; Krklješ, M.; Perović, S.K. Demolition-Based Urban Regeneration from a Post-Socialist Perspective: Case Study of a Neighborhood in Novi Sad, Serbia. Sustainability 2021, 13, 10430. [Google Scholar] [CrossRef]
- Institute for Urban Planning Niš. Plan of General Regulation of the City Municipality of Medijana; Official Gazette of the City of Niš, No. 72/12: Niš, Serbia, 2012; Available online: http://www.eservis.ni.rs/urbanistickiprojekti/ (accessed on 27 January 2025).
- Republic of Serbia, City of Niš, City Planning and Construction Administration, Monitoring Department. Analysis of the Condition of Surfaces for the Needs of the Functioning of Facilities Within the Block; City of Niš: Niš, Serbia, 2025. Available online: https://publikacije.stat.gov.rs/G2023/pdf/G20234003.pdf (accessed on 4 May 2023).
- Sendi, R.; Kerbler, B. The Evolution of Multifamily Housing: Post-Second World War Large Housing Estates versus Contemporary Trends. Urbani Izziv 2021, 32, 4–17. [Google Scholar]
- Tandarić, N.; Ives, C.D.; Watkins, C. From City in the Park to “Greenery in Plant Pots”: The Influence of Socialist and Post-Socialist Planning on Opportunities for Cultural Ecosystem Services. Land Use Policy 2022, 120, 106309. [Google Scholar] [CrossRef]
- Krištofić, B. Tranzicijska preobrazba stanovanja na super-periferiji Evrope. In Tranzicijska Preobrazba Glavnih Gradova, Zagreba i Podgorice, Kao Sustava Naselja; Svirčić Gotovac, A., Rade, Š., Eds.; Institut za Društvena Istraživanja u Zagrebu: Zagreb, Croatia, 2016; pp. 139–166. [Google Scholar]
- Nepravishta, F. Contemporary Architecture in Tirana during the Transition Period. S. East Eur. J. Archit. Des. 2016, 2016, 1–10. [Google Scholar] [CrossRef]
- Vasilevska, L.; Živković, J.; Vasilevska, M.; Lalović, K. Revealing the Relationship between City Size and Spatial Transformation of Large Housing Estates in Post-Socialist Serbia. J. Hous. Built Environ. 2020, 35, 1099–1121. [Google Scholar] [CrossRef]
- City Administration for Construction, City of Niš. Information-Analytical Data: Monitoring the Green Space Index through Residential Blocks; Monitoring Unit of the City of Niš: Niš, Serbia, 2025; unpublished. [Google Scholar]
- Đekić, J.; Vasilevska, L. Characteristics of multifamily housing development in the post-socialist period: Case study, the city of Niš. Facta Univ.—Ser. Archit. Civ. Eng. 2021, 19, 245–260. [Google Scholar] [CrossRef]
- Meili, N.; Acero, J.A.; Peleg, N.; Manoli, G.; Burlando, P.; Fatichi, S. Vegetation Cover and Plant-Trait Effects on Outdoor Thermal Comfort in a Tropical City. Build. Environ. 2021, 195, 107733. [Google Scholar] [CrossRef]
- Xue, L.; Doan, Q.V.; Kusaka, H.; He, C.; Chen, F. Insights into Urban Heat Island and Heat Waves Synergies Revealed by a Land-Surface-Physics-Based Downscaling Method. J. Geophys. Res. Atmos. 2024, 129, e2023JD040531. [Google Scholar] [CrossRef]
- Li, D.; Liao, W.; Rigden, A.J.; Liu, X.; Wang, D.; Malyshev, S.; Shevliakova, E. Urban Heat Island: Aerodynamics or Imperviousness? Sci. Adv. 2019, 5, eaau4299. [Google Scholar] [CrossRef]
- Cheung, P.K.; Jim, C.Y.; Nichol, J.E. Urban Morphology and Thermal Stress in High-Density Cities: PET Assessment in Hong Kong. Build. Environ. 2021, 188, 107428. [Google Scholar]
- Höppe, P. The Physiological Equivalent Temperature—A Universal Index for the Biometeorological Assessment of the Thermal Environment. Int. J. Biometeorol. 1999, 43, 71–75. [Google Scholar] [CrossRef]
- Kántor, N.; Unger, J. The Most Problematic Variable in the Course of Human-Biometeorological Comfort Assessment—The Mean Radiant Temperature. Open Geosci. 2011, 3, 90–100. [Google Scholar] [CrossRef]
- Matzarakis, A.; Mayer, H.; Iziomon, M.G. Applications of a Universal Thermal Index: Physiological Equivalent Temperature (PET). Int. J. Biometeorol. 1999, 43, 76–84. [Google Scholar] [CrossRef]
- Matzarakis, A.; Endler, C. Climate Change and Thermal Bioclimate in Cities: Examples for Urban Areas in Freiburg, Germany. Int. J. Biometeorol. 2010, 54, 479–483. [Google Scholar] [CrossRef] [PubMed]
- Chen, L.; Ng, E. Outdoor Thermal Comfort and Outdoor Activities: A Review of Research in the Past Decade. Cities 2012, 29, 118–125. [Google Scholar] [CrossRef]
- Slavković, M. Urbanistički Modeli Primene Integrisanih Pristupa Upravljanju Kišnim Oticajem u Funkciji Održive Regeneracije i Planiranja Područja Višeporodičnog Stanovanja. Ph.D. Thesis, Faculty of Civil Engineering and Architecture, University of Niš, Niš, Serbia, 2024. [Google Scholar]
- Gunawardena, K.R.; Wells, M.J.; Kershaw, T. Utilizing Green and Blue space to Mitigate Urban Heat Island Intensity. Sci. Total Environ. 2017, 584, 1040–1055. [Google Scholar] [CrossRef]
- Marchi, L.; Gaspari, J.; Fabbri, K. Outdoor Microclimate in Courtyard Buildings: Impact of Building Perimeter Configuration and Tree Density. Buildings 2023, 13, 2687. [Google Scholar] [CrossRef]
- Unal, M.; Middel, A. Improving Thermal Comfort in Hot-Arid Phoenix, Arizona Courtyards: Exploring the Cooling Benefits of Ground Surface Cover and Shade. Build. Environ. 2025, 278, 113001. [Google Scholar] [CrossRef]
- Li, H.; Wang, J.; Dai, M. Improving Comfort and Health: Green Retrofit Designs for Sunken Courtyards during the Summer Period in a Subtropical Climate. Buildings 2021, 11, 413. [Google Scholar] [CrossRef]
- Lin, C.; Yang, J.; Huang, J.; Zhong, R. Examining the Effects of Tree Canopy Coverage on Human Thermal Comfort and Heat Dynamics in Courtyards: A Case Study in Hot-Humid Regions. Atmosphere 2023, 14, 1389. [Google Scholar] [CrossRef]
- Hirt, S. Whatever happened to the (post)socialist city? Cities 2013, 32, S29–S38. [Google Scholar] [CrossRef]
- Sýkora, L.; Bouzarovski, S. Multiple transformations: Conceptualising the post-communist urban transition. Urban Stud. 2012, 49, 43–60. [Google Scholar] [CrossRef]
- Haase, D.; Dushkova, D.; Haase, A.; Kronenberg, J. Green infrastructure in post-socialist cities: Evidence and experiences from Eastern Germany, Poland and Russia. In Post-Socialist Urban Infrastructures; Schindler, S., Díaz, S., Eds.; Routledge: London, UK, 2019; pp. 140–160. [Google Scholar]
- Sharmin, T.; Steemers, K.; Humphreys, M. Outdoor Thermal Comfort and Summer PET Range: A Field Study in Tropical City Dhaka. Energy Build. 2019, 198, 149–159. [Google Scholar] [CrossRef]
- Wei, R.; Yan, J.; Cui, Y.; Song, D.; Yin, X.; Sun, N. Studies on the Specificity of Outdoor Thermal Comfort during the Warm Season in High-Density Urban Areas. Buildings 2023, 13, 2473. [Google Scholar] [CrossRef]
- Su, Y.; Li, Z.; Meng, Q.; Zhao, Q.; Wu, X.; Liu, Q.; Wang, C. Simulation and Optimization of Thermal Comfort in Residential Areas Based on Outdoor Morphological Parameters. Build. Environ. 2023, 245, 110837. [Google Scholar] [CrossRef]
- Briegel, F.; Wehrle, J.; Schindler, D.; Christen, A. High-Resolution Multi-Scaling of Outdoor Human Thermal Comfort and Its Intra-Urban Variability Based on Machine Learning. Geosci. Model Dev. 2024, 17, 1667–1688. [Google Scholar] [CrossRef]
- Ribeiro, K.F.A.; Justi, A.C.A.; Novais, J.W.Z.; de Moura Santos, F.M.; Nogueira, M.C.D.J.A.; Miranda, S.A.; Marques, J.B. Calibration of the Physiological Equivalent Temperature (PET) Index Range for Outside Spaces in a Tropical Climate City. Urban Clim. 2022, 44, 101196. [Google Scholar] [CrossRef]
- Karimimoshaver, M.; Shahrak, M.S. The Effect of Height and Orientation of Buildings on Thermal Comfort. Sustain. Cities Soc. 2022, 79, 103720. [Google Scholar] [CrossRef]
- ENVI-Met. Official ENVI-Met Website. Available online: https://envi-met.info/doku.php?id=root:start (accessed on 13 February 2025).
- Yang, X.; Zhao, L.; Bruse, M.; Meng, Q. Evaluation of a Microclimate Model for Predicting the Thermal Behavior of Different Ground Surfaces. Build. Environ. 2013, 60, 93–104. [Google Scholar] [CrossRef]
- Forouzandeh, A. Numerical Modeling Validation for the Microclimate Thermal Condition of Semi-Closed Courtyard Spaces between Buildings. Sustain. Cities Soc. 2018, 36, 327–345. [Google Scholar] [CrossRef]
- Taleghani, M.; Tenpierik, M.; van den Dobbelsteen, A.; Sailor, D. Thermal Comfort in Outdoor Urban Spaces: A Comparison of Different Strategies. Build. Environ. 2014, 77, 199–216. [Google Scholar]
- Salata, F.; Golasi, I.; de Lieto Vollaro, A.; de Lieto Vollaro, R. Urban Microclimate and Outdoor Thermal Comfort: A Proper Methodology for Heat Mitigation through Urban Planning. Sustain. Cities Soc. 2016, 26, 27–47. [Google Scholar]
- Chatzidimitriou, A.; Yannas, S. Microclimate Design for Open Spaces: Ranking Urban Design Effects on Pedestrian Thermal Comfort in Summer. Sustain. Cities Soc. 2016, 26, 27–47. [Google Scholar] [CrossRef]
- Mahmoud, R.M.A.; Abdallah, A.S.H. Assessment of Outdoor Shading Strategies to Improve Outdoor Thermal Comfort in School Courtyards in Hot and Arid Climates. Sustain. Cities Soc. 2022, 86, 104147. [Google Scholar] [CrossRef]
- Jamei, E.; Chau, H.W.; Seyedmahmoudian, M.; Stojcevski, A. Review on the Cooling Potential of Green Roofs in Different Climates. Sci. Total Environ. 2021, 791, 148407. [Google Scholar] [CrossRef] [PubMed]
- Aydin, E.E.; Ortner, F.P.; Peng, S.; Yenardi, A.; Chen, Z.; Tay, J.Z. Climate-Responsive Urban Planning through Generative Models: Sensitivity Analysis of Urban Planning and Design Parameters for Urban Heat Island in Singapore’s Residential Settlements. Sustain. Cities Soc. 2024, 114, 105779. [Google Scholar] [CrossRef]
- Tan, Z.; Lau, K.K.L.; Ng, E. Urban Tree Design Approaches for Mitigating Daytime Urban Heat Island Effects in a High-Density Urban Environment. Energy Build. 2016, 114, 265–274. [Google Scholar] [CrossRef]
- Jin, Y.; Yoon, H. Evaluating Planting Strategies for Outdoor Thermal Comfort in High-Rise Residential Complexes: A Computational Fluid Dynamics Simulation Study. Environ. Sci. Pollut. Res. 2023, 30, 88641–88663. [Google Scholar] [CrossRef]
- Zölch, T.; Maderspacher, J.; Wamsler, C.; Pauleit, S. Using Green Infrastructure for Urban Climate-Proofing: An Evaluation of Heat Mitigation Measures at the Micro-Scale. Urban For. Urban Green. 2016, 20, 305–316. [Google Scholar] [CrossRef]
- Dimoudi, A.; Nikolopoulou, M. Vegetation in the Urban Environment: Microclimatic Analysis and Benefits. Energy Build. 2003, 35, 69–76. [Google Scholar] [CrossRef]
- Shashua-Bar, L.; Potchter, O.; Bitan, A.; Boltansky, D.; Yaakov, Y. Microclimate Modelling of Street Tree Species Effects within the Varied Urban Morphology in the Mediterranean City of Tel Aviv, Israel. Int. J. Climatol. 2010, 30, 44–57. [Google Scholar] [CrossRef]
- Wong, N.H.; Tan, C.L.; Kolokotsa, D.D.; Takebayashi, H. Greenery as a Mitigation and Adaptation Strategy to Urban Heat. Nat. Rev. Earth Environ. 2021, 2, 166–181. [Google Scholar] [CrossRef]
- Pancewicz, A.; Kurianowicz, A. Urban Greening in the Process of Climate Change Adaptation of Large Cities. Energies 2024, 17, 377. [Google Scholar] [CrossRef]
- Aghamolaei, R.; Azizi, M.M.; Aminzadeh, B.; O’Donnell, J. A Comprehensive Review of Outdoor Thermal Comfort in Urban Areas: Effective Parameters and Approaches. Energy Environ. 2023, 34, 2204–2227. [Google Scholar] [CrossRef]
- Budzik, G.; Sylla, M.; Kowalczyk, T. Understanding Urban Cooling of Blue–Green Infrastructure: A Review of Spatial Data and Sustainable Planning Optimization Methods for Mitigating Urban Heat Islands. Sustainability 2025, 17, 142. [Google Scholar] [CrossRef]
- Diana, L.; Sommese, F.; Ausiello, G.; Polverino, F. New Green Spaces for Urban Areas: A Resilient Opportunity for Urban Health. In Resilience vs Pandemics: Innovations in Public Places and Buildings; Springer Nature: Singapore, 2024; pp. 37–53. [Google Scholar]
- Lai, D.; Lian, Z.; Liu, W.; Guo, C.; Liu, W.; Liu, K.; Chen, Q. A Comprehensive Review of Thermal Comfort Studies in Urban Open Spaces. Sci. Total Environ. 2020, 742, 140092. [Google Scholar] [CrossRef]
- Su, Y.; Wu, Z.; Gao, W.; Wang, C.; Zhao, Q.; Wang, D.; Li, J. Summer Outdoor Thermal Comfort Evaluation of Urban Open Spaces in Arid-Hot Climates. Energy Build. 2024, 321, 114679. [Google Scholar] [CrossRef]
- Li, H.; Zhao, Y.; Wang, C.; Ürge-Vorsatz, D.; Carmeliet, J.; Bardhan, R. Cooefficacy of Trees across Cities Is Determined by Background Climate, Urban Morphology, and Tree Trait. Commun. Earth Environ. 2024, 5, 754. [Google Scholar] [CrossRef]
- Abrahem, S.A.; Taha, H.S.; Hassan, S.A. Effect of Water Features on the Microclimate of Residential Projects in a Hot-Arid Climate: A Comparative Analysis. Acta Sci. Pol. Adm. Locorum 2022, 21, 5–13. [Google Scholar] [CrossRef]
- Rising, H.H.; Deng, L. The Effects of Small Water Cooling Islands on Body Temperature. J. Urban Des. 2024, 29, 167–183. [Google Scholar] [CrossRef]
- Golden, J.S.; Carlson, J.; Kaloush, K.E.; Phelan, P. A Comparative Study of the Thermal and Radiative Impacts of Photovoltaic Canopies on Pavement Surface Temperatures. Sol. Energy 2007, 81, 872–883. [Google Scholar] [CrossRef]
- Lin, T.P.; Matzarakis, A.; Hwang, R.L. Shading Effect on Long-Term Outdoor Thermal Comfort. Build. Environ. 2010, 45, 213–219. [Google Scholar] [CrossRef]
- Hwang, R.L.; Lin, T.P.; Matzarakis, A. Seasonal Effects of Urban Street Shading on Long-Term Outdoor Thermal Comfort. Build. Environ. 2011, 46, 863–870. [Google Scholar] [CrossRef]
- Szczerek, E. The Problem of Densification of Large-Panel Housing Estates upon the Example of Cracow. Land 2021, 10, 1359. [Google Scholar] [CrossRef]
- Mandić, L.; Đjukić, A.; Marić, J.; Mitrović, B. A Systematic Review of Outdoor Thermal Comfort Studies for the Urban (Re) Design of City Squares. Sustainability 2024, 16, 4920. [Google Scholar] [CrossRef]
- Przesmycka, N.; Kwiatkowski, B.; Kozak, M. The Thermal Comfort Problem in Public Space during the Climate Change Era. Energies 2022, 15, 6504. [Google Scholar] [CrossRef]
- Republic Hydrometeorological Service of Serbia. Monthly Bulletin for Serbia: August 2024; Republic Hydrometeorological Service of Serbia: Belgrade, Serbia, 2024. Available online: https://www.hidmet.gov.rs/data/klimatologija/ciril/Avgust.pdf (accessed on 6 May 2025).
- Wikipedia. Niš. Available online: https://sh.wikipedia.org/wiki/Niš (accessed on 19 February 2025).
- Google Maps. Niš. Available online: https://www.google.com/maps/place/Nis (accessed on 5 September 2025).
- GIS Niš. GIS Portal of the City Administration of Niš—gunisPublic. Available online: https://gis.ni.rs/smartPortal/gunisPublic (accessed on 15 February 2025).
- Weather Atlas. Climate: Niš, Serbia. Available online: https://www.weather-atlas.com/en/serbia/nis-climate (accessed on 15 September 2025).
- ISO 7726; Ergonomics of the Thermal Environment—Instruments for Measuring Physical Quantities. International Organization for Standardization: Geneva, Switzerland, 1998.
- Koletsis, I.; Tseliou, A.; Lykoudis, S.; Tsiros, I.X.; Lagouvardos, K.; Psiloglou, B.; Founda, D.; Pantavou, K. Validation of ENVI-met Microscale Model with In-Situ Measurements in Warm Thermal Conditions across Athens Area. In Proceedings of the 17th International Conference on Environmental Science and Technology, CEST2021, Athens, Greece, 1–4 September 2021. [Google Scholar]
- Zhang, Y.; Hu, X.; Cao, X.; Liu, Z. Numerical simulation of the thermal environment during summer in coastal open space and research on evaluating the cooling effect: A case study of May Fourth Square, Qingdao. Sustainability 2022, 14, 15126. [Google Scholar] [CrossRef]
- Salvati, A.; Kolokotroni, M. Microclimate Data for Building Energy Modelg: Study on ENVI-met Forcing Data. In Proceedings of the Building Simulation 2019, Rome, Italy, 2–4 September 2019. [Google Scholar]
- Liu, S.; Middel, A.; Fang, X.; Wu, R. ENVI-met Model Performance Evaluation for Courtyard Simulations in Hot-Humid Climates. Urban Clim. 2024, 55, 101909. [Google Scholar] [CrossRef]
- Bande, L.; Afshari, A.; Al Masri, D.; Jha, M.; Norford, L.; Tsoupos, A.; Marpu, P.; Pasha, Y.; Armstrong, P. Validation of UWG and ENVI-met Models in an Abu Dhabi District, Based on Site Measurements. Sustainability 2019, 11, 4378. [Google Scholar] [CrossRef]
- Thorsson, S.; Lindberg, F.; Eliasson, I.; Holmer, B. Different Methods for Estimating the Mean Radiant Temperature in an Outdoor Urban Setting. Int. J. Climatol. 2007, 27, 1983–1994. [Google Scholar] [CrossRef]
- Vaverková, M.D.; Kosakiewicz, M.; Krysińska, K.; Strzeszewska, K. Sustainable Construction in Post-Industrial Ursus District in Warsaw: Biologically Active Areas on Roofs and Underground Garages. Inżyn. Bezpieczeństwa Obiektów Antropog. 2024, 3, 10–35. [Google Scholar] [CrossRef]
- ODU Green Roof. Liziera Residential Complex—Intensive Green Roof. 2022. Available online: https://odu-green-roof.com (accessed on 3 July 2025).
- ZinCo. Grønttorvet, Copenhagen—Park Above an Underground Car Park. 2023. Available online: https://zinco-greenroof.com (accessed on 28 July 2025).
- Alsaad, H.; Hartmann, M.; Hilbel, R.; Voelker, C. ENVI-met Validation Data Accompanied with Simulation Data of the Impact of Facade Greening on the Urban Microclimate. Data Brief 2022, 42, 108200. [Google Scholar] [CrossRef]
- Stern, P.; Holzer, M.; Kretschmer, F. Implementing Blue-Green Infrastructures in Cities—A Methodological Approach Considering Space Constraints and Microclimatic Benefits. Sustain. Cities Soc. 2025, 126, 106391. [Google Scholar] [CrossRef]
- Galán-Marín, C.; Rivera-Gómez, C.; López-Cabeza, V.P.; Roa-Fernández, J. Courtyard Microclimate ENVI-met Outputs Deviation from the Experimental Data. Sustainability 2018, 10, 2220. [Google Scholar]
- López-Cabeza, V.P.; Diz-Mellado, E.; Rivera-Gómez, C.; Galán-Marín, C.; Samuelson, H.W. Thermal Comfort Modelling and Empirical Validation of Predicted Air Temperature in Hot-Summer Mediterranean Courtyards. J. Build. Perform. Simul. 2022, 15, 39–61. [Google Scholar] [CrossRef]
- Ouyang, W.; Sinsel, T.; Simon, H.; Morakinyo, T.E.; Liu, H.; Ng, E. Evaluating the Thermal-Radiative Performance of ENVI-met Model for Green Infrastructure Typologies: Experience from a Subtropical Climate. Build. Environ. 2022, 207, 108427. [Google Scholar] [CrossRef]
- Eingrüber, N.; Korres, W.; Löhnert, U.; Schneider, K. Investigation of the ENVI-met Model Sensitivity to Different Wind Direction Forcing Data in a Heterogeneous Urban Environment. Adv. Sci. Res. 2023, 20, 65–71. [Google Scholar] [CrossRef]
- Aleksandrowicz, O.; Saroglou, S.T.; Pearlmutter, D. Evaluation of Summer Mean Radiant Temperature Simulation in ENVI-met in a Hot Mediterranean Climate. Build. Environ. 2023, 245, 110881. [Google Scholar] [CrossRef]
- Ng, E.; Chen, L.; Wang, Y.; Yuan, C. A study on the cooling effects of greening in a high-density city: An experience from Hong Kong. Build. Environ. 2012, 47, 256–271. [Google Scholar] [CrossRef]
- Middel, A.; Häb, K.; Brazel, A.J.; Martin, C.A.; Guhathakurta, S. Impact of urban form and design on mid-afternoon microclimate in Phoenix Local Climate Zones. Landsc. Urban Plan. 2014, 122, 16–28. [Google Scholar] [CrossRef]
- Coccolo, S.; Kämpf, J.; Scartezzini, J.-L.; Pearlmutter, D. Outdoor Human Comfort and Thermal Stress: A Comprehensive Review on Urban Microclimate Modeling. Urban Clim. 2018, 24, 165–181. [Google Scholar]
- Balany, F.; Livesley, S.J.; Fletcher, T.D. Studying the Effect of Blue-Green Infrastructure on Microclimate and Human Thermal Comfort in Melbourne’s Central Business District. Sustainability 2022, 14, 9057. [Google Scholar] [CrossRef]
- Yu, Z.; Yang, G.; Zhan, W.; Jin, S. A Critical Review on the Cooling Effect of Urban Blue-Green Infrastructures: Size, Configuration and Synergy. Ecol. Indic. 2020, 117, 106543. [Google Scholar]
- Probst, N.; Bach, P.M.; Cook, L.M.; Maurer, M.; Leitão, J.P. Blue-Green Systems for Urban Heat Mitigation: Mechanisms, Effectiveness and Research Directions. Blue-Green Syst. 2022, 4, 348–372. [Google Scholar]
Disclaimer/Publisher’s Note: The statements, opinions and data contained in all publications are solely those of the individual author(s) and contributor(s) and not of MDPI and/or the editor(s). MDPI and/or the editor(s) disclaim responsibility for any injury to people or property resulting from any ideas, methods, instructions or products referred to in the content. |
© 2025 by the authors. Licensee MDPI, Basel, Switzerland. This article is an open access article distributed under the terms and conditions of the Creative Commons Attribution (CC BY) license (https://creativecommons.org/licenses/by/4.0/).