Abstract
Distributed generation (DG) is one of the types of generation with great potential in the world and fits into the incentive schemes used worldwide. In addition, biogas as a fuel for DG presents itself as an interesting option, both from an economic and a sustainability point of view. Thus, this article addresses the modeling of the investment evaluation process in biogas-based DG projects in Brazil, using the Business Process Model and Notation (BPMN) and Decision Model and Notation (DMN) techniques, intending to define a standard model. Although the study is applied to the Brazilian scenario, the proposed investment evaluation model can be applied to any scenario as long as the specificities of each location or country analyzed are considered. The results show that the model supports decisions on new investments in the sector and highlights the process sequence and main decision points for quality analysis. In addition, the model highlights the need to know the regulations and incentives for DG using renewable energy sources (RES) in the country, shows the available technologies, the process for producing electricity using biogas, the times for collecting operational data, estimating revenues, and investment evaluation methodologies, and promotes the growth of knowledge about RES. Finally, this approach supports sustainable development by using renewable resources efficiently, reducing waste, and lowering greenhouse gas emissions. It also helps investors and policymakers make decisions about low-carbon energy systems.
1. Introduction
Over time, the widespread use of fossil fuels for electricity generation has been a significant contributor to escalating greenhouse gas (GHG) emissions on a global scale, prompting increased attention from governmental authorities. To tackle this critical issue, a concerted effort has been made to incentivize investments in Renewable Energy Sources (RES) across developed and developing countries. This strategic shift aims to meet the growing demand for electricity and facilitate the gradual phasing out of fossil fuels [1,2].
Given the urgency to transition to low-carbon economies, developing countries play an essential role in this scenario, as they have a more significant potential for RES generation and a growing energy demand [3,4]. These issues have fostered the dissemination of the distributed generation (DG) concept worldwide [5].
In general, DG is a set of technologies that enable electricity production close to the place of consumption [6]. In addition, the concept of DG is linked to RES (photovoltaic solar—PV, wind, biomass, biogas, and others), energy storage technologies, tools, and methods for controlling and regulating energy consumption on the consumer side [7,8], being of fundamental importance for the expansion and consolidation of the smart grid concept.
To accelerate the process of expanding energy generation using RES, many countries adopt incentive policies, aiming to level the costs of generating electricity by RES to the expenses of generation by fossil fuels [9]. Within this context, Brazil uses the long-term net-metering policy, which remunerates DG users with total or partial compensation for each unit of electrical energy injected into the grid.
Brazil began to adopt the net-metering mechanism from Resolution 482/2012 of the Brazilian National Electric Energy Agency [10], which subsequently improved to enable new business models in DG. Although PV systems represent the majority of the installed power in DG in Brazil, systems based on biogas have attracted attention due to the immense potential for the production of organic waste (municipal solid waste–MSW, agricultural waste, and industrial waste) that offers an excellent opportunity for investments in this source in the country [11].
Thus, producing electricity from biogas through DG is a pertinent alternative to the Brazilian context. Brazilian regulation includes biogas as an alternative to be used for DG. However, in 2022, Law 14300 [12], known as the Legal Framework of DG, was approved, reducing the benefits of the credit of the energy injected into the grid, due to the charge related to the distribution tariff component (FIO B). Currently, systems up to 75 kW are characterized as microgeneration, and systems between 75 kW and 3 MW are called mini-generation [12].
The National Bank for Economic and Social Development (BNDES) and other national and international financial institutions offer subsidized financing for installing clean generation systems [13]. In addition, through ICMS Agreement 16 [14], Brazilian states offer ICMS exemption, which can be attributed according to the criteria defined by the government of each state.
Therefore, this study aims to map the process of evaluating investments in biogas-based DG projects, defining a standard model, highlighting the sequence of activities for quality analysis, and the main decision points of this process. The business process model and notation (BPMN) and decision model and notation (DMN) techniques will be used. Finally, it is worth mentioning that the Brazilian scenario will be used to test the proposed model.
Thus, the study’s novelty lies in evaluating the essential steps for designing DG projects involving waste reuse and analyzing their technical and economic feasibility. The proposal of this study will be the development of a map of the process of evaluating investments in biogas-based DG, presenting the sectors promotion policies, the steps involved in the production of biogas, the technologies involved in the production of biogas and the transformation of biogas into electrical energy, and the appropriate investment evaluation techniques to define the projects viability, improving decisions for new ventures in this market. The study’s main contribution is to produce a support tool for investment planning for biogas DG. To this end, process mapping using BPMN and DMN allows for the development of a planning guide, which covers everything from the main regulatory aspects investors should consider to the definition of compensation schemes and DG modalities, as well as mapping subsidies and tax exemptions that may affect the project. Subsequently, the mapping includes decisions on the substrate that will serve as input for the project, the type of processing, and the physical state and volume characteristics of the substrate used.
Although the study is applied to the Brazilian scenario, the proposed investment evaluation model can be applied to any scenario as long as the specificities of each location or country analyzed are considered. In this way, the contributions of this study go beyond the Brazilian scenario and can serve as an auxiliary tool for decision-making for different countries, contributing to the rationalization of the work of public policy formulators and decision-makers at the most varied organizational levels.
In addition to this introductory section, in Section 2, a literature review will be presented on investments in biogas-based DG in Brazil and studies related to the joint use of BPMN and DMN techniques; in Section 3, the steps to carry out the process mapping will be presented; in Section 4, the results and discussions will be presented; and finally, in Section 5, the final considerations and recommendations for future studies are proposed.
2. Theoretical Background
2.1. Investments in Biogas-Based DG in Brazil
Brazil’s regulatory framework for DG commenced with resolution 482/2012 [10]. That resolution introduced a net-metering scheme applicable to DG electricity systems, encompassing microgeneration up to 100 kW and minigeneration up to 1 MW [15]. These systems utilize various sources such as hydraulic, PV, biofuels, wind, and qualified cogeneration, and are installed in residential and commercial premises.
Such as traditional net-metering schemes, the support scheme launched by resolution 482/2012 enabled access to the electricity grid for DG systems covered by the resolution, using a bidirectional meter, in which the excess energy would be injected into the grid, with the excess credit being available to the prosumer initially for 36 months. Figure 1 illustrates a net-metering scheme for pig biogas DG systems.
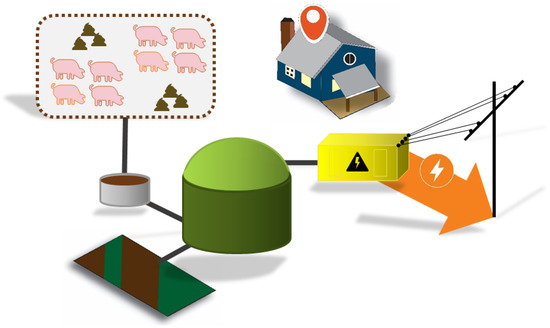
Figure 1.
Net-metering in a generation system from pig farming waste.
Resolution 687/2015 ushered in new opportunities for prosumers, expanding beyond traditional energy generation models [16]. These included remote self-consumption, enabling compensation for prosumers with generation systems located at a distance from their consumption point, and multiple prosumers, allowing for individual compensation within shared electricity consumption spaces such as condominiums. Additionally, shared generation introduced collaborative frameworks for prosumers to benefit collectively from DG resources separately from consumption areas.
Resolution 687/2015 also streamlined administrative processes alongside these modalities, reducing system registration timeframes, extending energy credit validity, and revising power characterization ranges [16]. Subsequent amendments through resolution 786/2017 refined net metering regulations, addressing issues such as raising power limits for hydraulic sources and ensuring fair treatment for previously licensed systems [17].
In January 2022, the Legal Framework of DG was created through Law 14300/2022 [12]. The law presents several changes in the scope of DG. However, for projects filed up to 12 months after the publication of the law, the current regime is maintained until 31 December 2045. The main change brought by the law is that some tariff components will gradually cease to be compensated staggered, starting a partial compensation system due to the requirement to pay FIO B, referring to the energy distributor. It is estimated that FIO B represents, on average, a 30% reduction in the credit currently injected. The charge will be gradual, starting in 2023 with 15% of FIO B and ending in 2029 with 100% of the value of this tariff component [12].
In Brazil, the net-metering scheme is the established long-term policy for DG, complemented by short-term policies geared towards amplifying its impact [18]. These include tax incentives and subsidized financing, exemplified by ICMS Agreement 16, which exempts DG systems under Brazilian net metering from the commercialization tax [14,19].
Implemented gradually across Brazilian states since 2015, this initiative varies in its application, with some states offering exemptions only during the initial years of operation while others extend exemptions throughout the system’s lifecycle. Another national short-term policy, Law 13169/2015, provides exemptions from certain taxes on electricity injected into the grid by prosumers [20,21].
However, Law 13169/2015 and the ICMS Agreement 16 are limited to generation alongside the load and remote self-consumption, excluding other modalities. Despite these limitations, these policies have marked significant progress in fostering DG growth since 2015 [22]. Additionally, the DG Development Program (ProDG), launched in 2015, introduced new financing opportunities for DG projects, contributing to the sector’s expansion through funding from national public banks targeted at prosumers and related industries [23]. Table 1 summarizes these Brazilian DG policies.

Table 1.
DG policies in Brazil.
As for the biogas market for DG, although it is still behind the PV source in DG participation, it is a promising market in Brazil [24]. Some Brazilian organizations, such as the International Center for Renewable Energies (CIBiogás), the Brazilian Biogas Association (ABiogás), and the Brazilian Biogas and Biomethane Association (ABBM), have sought to promote this market and instruct new entrepreneurs in energy generation from biogas. In addition, the potential raw material available for biogas production in Brazil is much greater than what is currently consumed [11,25]. Brazil uses about 2.8% of its total biogas production potential [26].
Compared to other biofuels, biogas can be obtained using various types of substrates as long as they are biodegradable, as illustrated in Figure 2 [27]. Among the wide range of substrates that can be found, the following stand out: urban solid waste, agricultural waste, industrial waste, and aquatic and terrestrial plants [28].
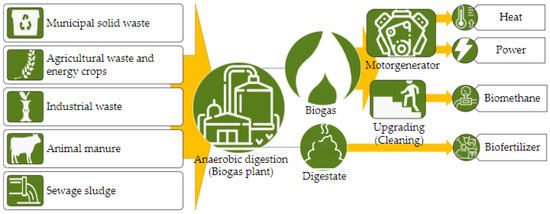
Figure 2.
Substrates employed in the generation of biogas and its derivatives.
The conversion of organic waste into biogas occurs from the anaerobic digestion (AD) process, which can be carried out using only one type of substrate (mono-digestion) or a mix of two or more types of substrates (co-digestion) [29]. AD occurs inside biodigesters, where organic compounds are broken down into smaller molecules until a mixture of gases (CH4, CO2, and others) that form biogas is obtained [27].
The biodigesters traditionally used for the AD process are covered lagoon, complete mixture (CSTR, from the English continuous stirred-tank reactor), plug flow, and up-flow sludge blanket (USAB) [30]. The definition of the technology adopted for biodigestion depends on the type and consistency of the substrate used as raw material (solid, pasty, or liquid).
Due to its attributes, biogas has some additional advantages that motivate the incentive and dissemination of its use; among them is the fact that the production of biogas depends on the proper treatment of organic waste from other economic activities, which are often discarded incorrectly, causing environmental damage, which go beyond GHG emissions; it is the second largest RES available in the world, losing only to solar energy; it can be stored without the aid of batteries, unlike solar and wind sources; it presents high efficiency in the production of other forms of energy, it can also be used in heat generation and as transport fuel (biomethane); it also produces digestate that can be used as fertilizer [22,31].
The incentives for investments in DG in Brazil and the advantages of biogas show a latent investment opportunity. However, to estimate the gains from investment projects quantitatively, it is necessary to use investment evaluation techniques.
In this sense, to evaluate investments that involve technologies for the production of energy from renewable sources, traditional indicators can be used, such as Net Present Value (NPV), Internal Rate of Return (IRR), Simple Payback Period (PB) or Discounted Payback (DPB), Levelized Cost of Energy (LCOE) and Life Cycle Cost Analysis (LCCA). Traditional investment indicators evaluate the economic viability of investment projects. Still, more complex projects with high volatility of the main variables also require risk analysis, and the Monte Carlo Simulation (MCS) can be adopted to identify the inherent risk to the investment [32].
In addition, investments with many future options, such as expansion, change in the final product, abandonment, and others, present high managerial flexibility. It is necessary to use the Real Options (RO) technique to price the value of the possible options in the investment project [32].
Table 2 presents a compilation of studies that analyze the economic viability of DG projects from waste.
Table 2.
Studies on the economic feasibility of biogas power plants.
Few studies have proposed the use of BPMN modeling to support investment evaluation. One of the few examples is the study by Torres et al. [50], which developed a process model for securitization trading, representing the modeled business process. The proposed modeling later supported the development of an e-value model for the analyzed process.
To promote better decisions about investments in biogas-based DG in Brazil and contribute to the dissemination of the source, the techniques of BPMN and DMN combined will be used to map the process of evaluating the viability of investments in this sector, detailing the most relevant decision points throughout the process, highlighting the current incentive policies, the technologies used, and the appropriate investment analysis techniques in various situations.
2.2. Joint Use of BPMN and DMN
BPMN was initially published in 2004 by the Business Process Modeling Initiative as a graphical notation representing business process layouts. However, the growing number of company adoptions and the ever-increasing interest in this notation led to the adoption of BPMN as a standard by the Object Management Group (OMG) in 2006 [51]. BPMN aims to provide a notation that is easily understandable by business users (business analysts, technical developers, business teams, and other stakeholders), creating a standardized tool to bridge the gap between business process design and implementation [52].
Using its notation, BPMN enables the detailed representation of process flows, including their exceptions [51]. In addition, White [53] highlights that the development of BPMN arose from the need for a simple mechanism for building business process models capable of dealing with the inherent complexity of these processes.
Over the years, the updates to BPMN have generated several versions, such as BPMN 1.x, later versions 1.1, which introduced a class diagram and description of the notation to give a better formalization to the original version, from version 1.2, the number of elements increases, even though most users only use a small subset of BPMN elements to model business processes [51].
The version of BPMN 2.0 is currently the leader in process design [54]. As it offers a consolidated graphical notation for developing process activities, BPMN also allows logical organization and temporal ordering, and it is suitable for different levels of abstraction, which meet various categories of users. Silver [55] adds that BPMN does not belong to a single vendor and, therefore, its use does not require the payment of royalties. The technique meets ISO standards and is one of the primary process modeling tools. Most of the elements of BPMN are shown in Figure 3.
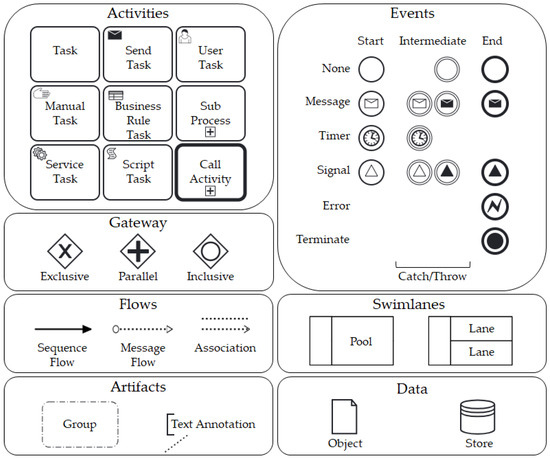
Figure 3.
BPMN Elements.
The BPMN comprises several elements for representation, but according to Campos [56], it is possible to construct an efficient business process model using only essential elements. The main objects are detailed in Table 3.
Table 3.
Description of the main BPMN elements.
According to Haubler et al. [57], the gateway elements of BPMN can be used to map simple decisions. Still, the process quickly becomes confusing if several criteria within these relationships need to be evaluated. To simplify this situation and present the decision options more clearly, DMN was developed, and version 1.3 was published in December 2019.
DMN provides a standard notation that is understandable by all business users (business analysts, technical developers, business people, and other users), creating a standardized bridge between the business decision design and implementation. This notation was designed to be used with BPMN [58]. Bazhenova et al. [59] complement that the combination of the BPMN and DMN models allows the decision and process logics to be modeled separately, improving the maintenance of the decision model and obtaining a separation of interests. Also, according to the author above, DMN comprises two layers that combine decision requirements, represented by diagrams, and decision logic, defined by decision tables.
The essential elements of DMN, presented in Figure 4, represent the decision requirement diagrams (DRD). These diagrams define which decisions are made in process tasks, their interrelationships, and their requirements for the decision logic [54].
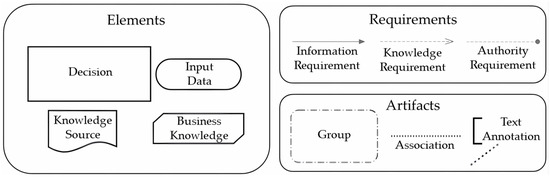
Figure 4.
DMN elements.
Table 4.
Description of DMN elements.
Finally, business rules can be detailed using decision logic. The modeling of decision logic can be carried out in various ways, translating business experience into business rules, analytical models, or other formalisms [58]. The most common representation of decision logic is through a decision table, an example illustrated in Table 5, which comprises inputs, outputs, rules, hit policy, and the definition of data types [60].
Table 5.
Example of a decision table—set discount.
As previously presented, BPMN is a standardized graphical notation that describes business processes, allowing the representation of activities, events, decisions, and workflows in a structured manner [61]. Mathematically, the behavior of a BPMN process can be formalized through a Petri Net, defined as [62]:
where
- P = {p1, p2, …, pm} is the set of places, representing the process states in BPMN (for example: “process start”, “task in progress”, “task completed”);
- T = {t1, t2, …, tn} represents the set of transitions—corresponding to BPMN activities (tasks), events (start, intermediate, or end), and decision points (gateways) (such as “send form”, “approve request”, “end process”);
- F ⊆ (P × T) ∪ (T × P) is the set of flow arcs—showing how states and activities connect, similar to arrows in BPMN.
Each place can contain a token, which indicates where the process is at a given moment. The set of active tokens is called a marker:
this means that M(pi) shows how many tokens exist in each state. When an activity is executed, the corresponding transition (ti) is triggered, and the token leaves one state and moves to the next, representing the progress of the process. For example:
means that, when executing task t1, the process changes from the initial state M0 to the next state M1 [62,63].
On the other hand, DMN is a complementary notation to BPMN, aimed at modeling business decisions and rules, typically expressed in decision tables [64]. Mathematically, it can be described as a mapping function [62]:
where
- X = {x1, x2, …, xk} is the set of input variables (conditions evaluated in the process, such as income, history, time, status);
- Y = {y1, y2, …, yk} is the set of possible decisions (resulting outputs, such as “approve” or “deny”).
When BPMN and DMN are integrated, the transition corresponding to the business decision tdecision becomes dependent on the result of the decision function f(X), that is, the BPMN transition is enabled only if the result of the decision rule (DMN) allows the process to continue [65]. In this context, a decision transition in BPMN can be formalized as:
where
- Mi: process state before the decision;
- tdecision: transition associated with the decision (decision activity in BPMN);
- f (X): decision function (DMN) that determines the flow;
- Mi+1: state after the decision (path chosen in BPMN).
Recently, many studies have used the combined BPMN and DMN techniques. Haubler et al. [57] investigated the specifications outlined in Deutsche Bahn A’s guidelines regarding the technical design of structures in railway construction. Their study assessed the practicality of integrating these regulations through BPMN and DMN. Hasic et al. [66] suggest five principles for integrated process and decision modeling (5PDM) to correct inconsistencies between process and decision models.
Sooter et al. [67] used the notations of BPMN and DMN to model and standardize the processes and decisions involved in the initiation of birth control according to medical eligibility criteria, documented by the Centers for Disease Control and Prevention, with the later intention of incorporating the model into an electronic health record system or another digital platform. Using actual processes from the health area, Bazhenova et al. [59] explored data modeled in BPMN and how and to what extent the decision points in this model could have a corresponding representation in DMN.
Combi et al. [54] presented a methodological framework that promotes the integrated conception, implementation, and execution of health-related processes and decision-making, considering the adequate representation and management of organizational and clinical information; for this, the combined BPMN and DMN techniques were used. The proposed methodology was applied to model health processes related to chronic obstructive pulmonary disease in the Veneto region, Italy.
Pankowska [68] conducted a literature review to present and discuss which business models are already well known for business analysis of corporate architecture, concluding that the use of BPMN, case management model, and notation (CMMN), and DMN allows a general approach in business process management. According to Hasic et al. [66], the literature is moving towards separating the process and decision models.
The use of BPMN/DMN techniques for developing an analysis model for investment projects focused on biogas production is justified by the complexity of the decision-making process, which involves both the analysis of sectoral policies and technical-economic-financial decisions influenced by multidisciplinary variables. Among these variables, the following stand out: (1) regulatory variables, related to permissions and limitations defined by government agencies; (2) physicochemical and biological variables, associated with substrate characteristics, digestion type, and biodigester model; (3) operational variables, encompassing the configuration and sizing of the plant and its components; and (4) economic-financial variables, relating to the preparation of cash flow, the definition of capital use, and the calculation of investment viability.
Given this complexity, BPMN and DMN techniques make it possible to organize the process into modules, defining the ideal sequence of steps and structuring each decision point logically, which ensures the standardization of the model and the reproducibility of the analyses. In this sense, the use of BPMN/DMN simplifies and makes the investment analysis process for biogas plants more transparent, facilitating the understanding and actions of investors, regulatory bodies, and funding agencies, contributing to increased investments, greater accuracy in policy formulation, and stimulating the creation of financial instruments to support the biogas sector.
It is worth noting that research that uses BPMN and DMN to model investment processes in general, investment processes in RES, and even the process of electricity production by RES, was not found in the literature. Thus, modeling this process will also contribute to the academic environment. The creation of the models in BPMN and DMN involved four steps, which are detailed in the next section.
3. Materials and Methods
Roadmap for Process Modeling
The first step in process modeling is to assemble the process roadmap, which requires the completion of four steps, as detailed in Figure 5.
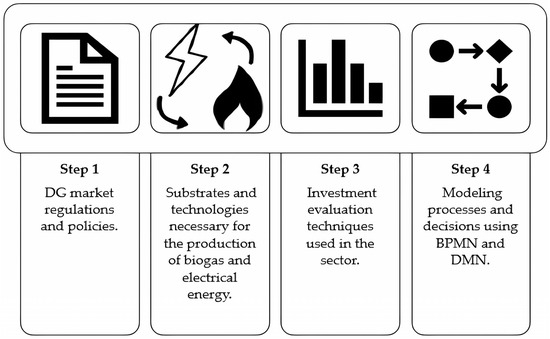
Figure 5.
Steps for creating the model in BPMN and DMN.
- -
- Step 1: The process of evaluating investment in DG based on biogas begins by checking the current regulation, the long-term policy adopted by the country in the DG modality, and the fiscal and financial incentives (public or private) for RES.
- -
- Step 2: It deals with the technical knowledge of the biogas production process, involves the availability of substrates (raw material) and their characteristics, the types of technologies (biodigesters) that can be adapted to carry out the DA, and the inherent results of the production process.
- -
- Step 3: Survey the most suitable investment analysis techniques and how they complement the investment evaluation in DG based on biogas.
- -
- Step 4: After gathering all the necessary information, the process is modeled using BPMN in the last step. In addition, DMN was used to model the decision points throughout the process, which presented a well-defined set of rules.
The construction of the model in BPMN obeyed most of the seven guidelines (7 PMG) proposed by Mendling et al. [69]. In this sense, the model has a reduced number of elements, as it was decomposed using collapsed subprocesses; the routing paths were minimized by using the DMN technique; the divergence and convergence connectors used are of the same type, showing a well-structured model; not obeying two of the proposed guidelines, the model presents more than one end event, since the final decision can be to carry out or not the project and; it was necessary to adopt an inclusive routing element, due to the flexibility required at a particular stage of the process.
In addition, the representation of the decisions inherent to the process follows the principles of integration between the processes and the decisions (5PDM) described by Hasic et al. [66]. This framework mandates modeling all crucial decision output flows, excluding decision logic from the process model. Sub-decisions contributing to intermediate results or relevance to the process should be depicted as decision activities. Proper sequencing of relevant decision activities is imperative. Finally, comprehensive modeling of data objects and intermediate results is essential for effective process and decision-making.
Translating the process of evaluating biogas-based DG investments into a model that presents the sequencing of necessary activities and the inherent decision points in this process allows potential investors to better structure investments in the sector. The models were developed on the online platform Cawemo®. The tool allows the use of resources to build models in BPMN and DMN.
4. Results and Discussion
4.1. Modeling the Process of Evaluating Biogas-Based DG Investment
Evaluating biogas-based DG investment comprises six collapsed subprocesses (Figure 6).
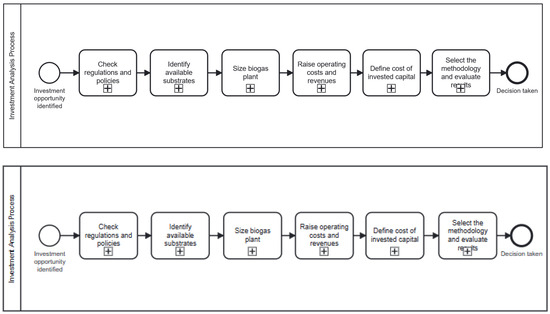
Figure 6.
Investment analysis process.
Every investment analysis process begins with an identified opportunity. Still, the decision to invest in a project, consuming financial resources, to take advantage of the opportunity present in the market must go through a rigorous evaluation, allowing the decision-maker a broad knowledge of the regulations and policies of the sector, the operation, the necessary capital contributions, the possible results, and the risks inherent to the investment. The process of evaluating biogas-based DG investment will be detailed in the following subsection.
4.2. Detailing of Subprocesses and Decision Points
The first modeled subprocess concerns verifying the regulation and available incentive policies (Figure 7).
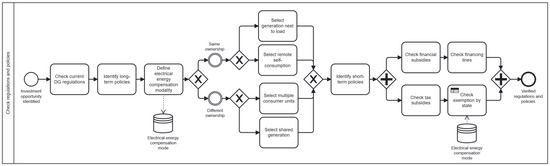
Figure 7.
Check regulations and policies.
The first step of the subprocess is to verify the regulation for DG. In Brazil, the regulation allows investors access to the electricity grid (Normative Resolutions 482/2012 [10], 687/2015 [16], 786/2017 [17], and Law 14300/2022 [12]—DG Legal Framework), subject to meeting various requirements. Subsequently, through the regulation, the remuneration of investors is defined. In the country, net metering is adopted as a long-term incentive, guaranteeing DG investors the accounting of total or partial credits for the electricity injected into the grid, which can be offset in the establishment’s energy bill.
Another critical point of this subprocess is the definition of the compensation modality used; the modalities of a single holder (generation after the load and remote self-consumption) are exempt from ICMS according to state legislation. On the other hand, modalities with more than one holder do not receive this benefit.
After defining the energy compensation modality, the next step is to investigate what financing lines are available for this type of investment. There are subsidized lines for RES from BNDES, such as Renovagro and Inovagro [70], and some financing lines offered by private banks.
Fiscal subsidies are verified, as described in the DRD (Figure 8), parallel to the verification of financial subsidies.
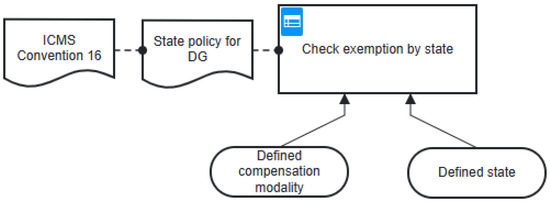
Figure 8.
DRD—Check exemption by state.
The decision to check exemption by the state is based on the inputs related to the compensation modality and the state where the investment will be made [22]. In addition, the ICMS 16 convention and state policies support decision-making. The decision table (Table 6) represents each combination’s business rules and outputs.
Table 6.
Decision table—Check exemption by state.
After verifying the regulations and policies, the next subprocess identifies the available substrates (Figure 9).
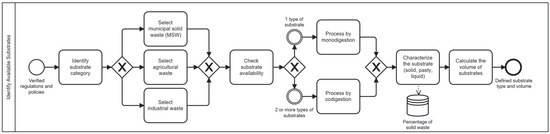
Figure 9.
Identify Available Substrates.
A range of substrates can be used as raw material in the AD process and divided into three categories: MSW, agricultural waste, and industrial waste.
At this stage, the types of waste that will be processed must be defined, whether only one substrate (mono digestion) or two or more types of substrates simultaneously (co-digestion). In addition, it is necessary to identify the percentage of solid waste the substrate has, depending on the percentage of the substrate assuming liquid, pasty, or solid characteristics, and the estimated substrate volume.
The definition of the type and estimate of the substrate volume allow the subprocess execution to size the biogas plant (Figure 10).
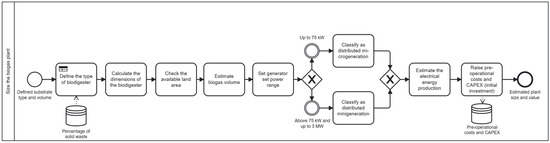
Figure 10.
Size the biogas plant.
The information on the percentage of solid waste (substrate characteristic) enables the definition of the type of biodigester according to the DRD (Figure 11) and the decision table (Table 7).
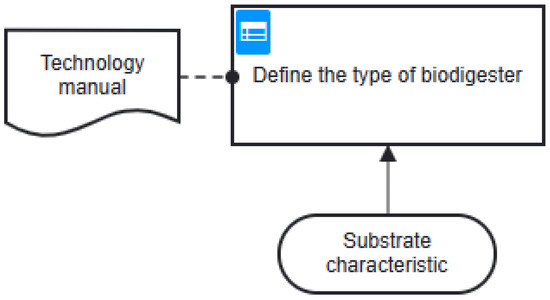
Figure 11.
DRD—define the type of biodigester.
Table 7.
Decision table—define the type of biodigester.
In this subprocess, the biodigester is also sized, the available area for installation is verified, and the volume of biogas produced is estimated. Subsequently, based on the volume of biogas, the power of the generator set is defined, and the classification as to the type of DG, microgeneration (up to 75 kW), or minigeneration (Above 75 kW up to 3 MW). The power of the generator set (installed capacity of the plant) and the volume of biogas allow for estimating the electricity produced and raising the pre-operational costs (documentation, equipment installation, and others) and the CAPEX (initial investment). Pre-operational costs and initial investment are the first disbursement in the project’s cash flow.
The other components of the cash flow are the operating costs (OPEX) (salaries and charges of the plant operator, maintenance costs, and insurance costs) and revenues (credit for the total kW/h injected into the energy grid, considering the tax subsidy). Both estimates are part of the subprocess of raising operating costs and revenues (Figure 12), which ends with the elaborate cash flow of the project.
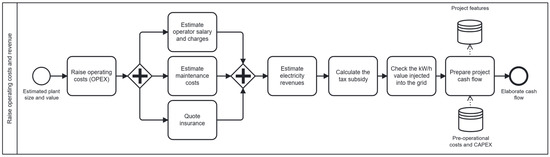
Figure 12.
Raise operating costs and revenue.
An essential step in evaluating an investment is the correct definition of the cost of the invested capital, a subprocess described in Figure 13.
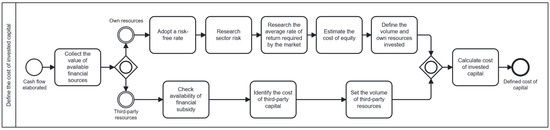
Figure 13.
Define the cost of invested capital.
After elaborating on the cash flow, it is necessary to calculate a discount rate used to manipulate the values of the cash flow, allowing values at different dates to be adjusted to the same date, usually date zero, allowing the flows to be added or subtracted to obtain the NPV or the Present Value (PV), depending on the analysis technique adopted.
The invested capital can be composed only of own capital, third-party capital, or a combination of both sources of financing. In this sense, the inclusive gateway was used in BPMN to better represent the financing sources that can be used in the investment.
The most adopted methodology for calculating the cost of own capital is the Capital Asset Pricing Model (CAPM), which uses a risk-free rate, an estimate of the risk for the sector (sectoral beta), and an estimate of the return rate on average required in the market. On the other hand, the cost of third-party resources is the interest rate charged by financial institutions. For investments in DG that use RES, several subsidized financing lines are offered in public and private banks. Subsidized financing lines require a reduced interest rate, a longer term for payment, and even a grace period, benefiting the investment project and increasing its viability.
The subprocess of defining the cost of the invested capital is closed with the calculation of the Weighted Average Cost of Capital (WACC), where the costs of own capital and third-party capital, weighted by the volume of each source of capital, are added to form the cost of the invested capital.
The last subprocess of evaluating investments in biogas-based DG is to select the methodology and assess the results (Figure 14).
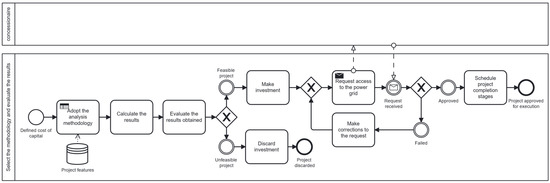
Figure 14.
Select the methodology and evaluate the results.
The selection of the analysis methodology is detailed in the DRD of Figure 15.
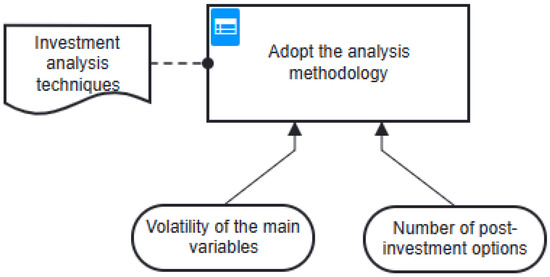
Figure 15.
DRD—Adopt analysis methodology.
The decision of which analysis methodology to adopt depends on the characteristics of the investment project. Thus, some investments present high volatility in the selling price, some specific costs of the operation, and others that can result in a high risk for the investment. Another characteristic that influences the choice of methodology is the number of options present that may appear after the investment is made. The described inputs will impact the decision (outputs) according to the established business rules of the decision table presented in Table 8.
Table 8.
Decision table—adopt the analysis methodology.
Considering only the economic part, less complex investments can be evaluated using only traditional indicators (NPV, IRR, PB, DPB, LCOE, and LCCA). When the main variables present high volatility, it is appropriate to analyze the economic value of the investment and the risks inherent in the fluctuations of the main variables. Thus, traditional indicators, such as the MCS, are linked to a risk analysis.
Some projects have a range of options that involve expanding the investment, abandoning it, and even changing the product offered in the market. Biogas, being a versatile product, presents great managerial flexibility, being able to be used for heat generation, as an option for electric energy, or to expand the investment by acquiring purification equipment and generating biomethane, used as a vehicular fuel. The Real Options methodology is used to ascertain the value of the options present in an investment.
After defining the investment analysis methodology, the results are calculated and evaluated; if the result is unfeasible, the possibility of investment is discarded, and the process ends. If the viability is proven, the project must be carried out, a request for grid access for the DG enterprise must be made to the concessionaire that serves the region, and after approval, the steps to carry out the project must be scheduled. The execution started, ending the process.
The modeling of the process of evaluating an investment in biogas-based DG allows a holistic view of the investment, details the steps from the regulation to the available investment analysis techniques using the BPMN tool (Camunda Modeler Platform, Version 8.8.52 [71]), and highlights the main decision points by the model in DMN. In this sense, this study offers support for decision-making on new investments in the sector, showing the steps new investors should follow through a standardized model for evaluating investments in biogas-based DG. In addition, it presents the potential to contribute to the growth of knowledge about RES.
One limitation of the model is that it lacks a greater number of applications in different contexts to assess its behavior and achieve generalization. Furthermore, although the model serves as a guide for the investment evaluation process in biogas-based distributed generation projects, this does not diminish the complexity of the political and regulatory aspects of each country, the technical aspects of sizing and operationalizing the processes, the accounting and financial aspects for forecasting cash flows, nor the specific technical aspects for implementing the tools for economic feasibility analysis of the projects.
4.3. Case Study
This case study addresses an investment project focused on microgeneration electricity from biogas produced on a full-cycle farm from pig waste in Uberlândia, Minas Gerais. It is noteworthy that the surveys were conducted in 2020. This type of farm carries out all stages of pig production—from reproduction and piglet rearing to finishing—and houses approximately 6700 animals [22]. The project description aims to validate the process mapping model developed, highlighting the main elements of BPMN and DMN decision rules. To facilitate understanding, the study will be described in stages, each corresponding to a subprocess represented in Figure 6.
4.3.1. Step 1—Checking Regulations and Policies (Figure 7)
Brazil’s DG regulations were analyzed, emphasizing Law No. 14300, establishing the electricity compensation system (net-metering). The project adopts a close-to-load generation model, in which the energy produced is offset at the same point of consumption. Short-term incentive policies considered included the BNDES’ Low Carbon Agriculture Program, which offers financing with subsidized rates and terms. Additionally, the ICMS tax subsidy granted by the State of Minas Gerais, under ICMS Agreement 16, was identified. This provides a full tax exemption for the first six years, with a gradual 20% annual reduction thereafter, in accordance with the decision rule in Table 6 for the state of Minas Gerais.
4.3.2. Step 2—Identify Available Substrates (Figure 9)
The substrate used to feed the biodigester consists of swine manure, classified as agricultural waste, available in sufficient volume to ensure continuous operation of the system. Monodigestion was chosen, using a single type of substrate, with a pasty consistency (low percentage of solid waste). The estimated annual production is approximately 16,300 m3 of manure (44 m3/day), calculated based on the size and number of animals in each phase of the production cycle.
4.3.3. Step 3—Size the Biogas Plant (Figure 10)
Based on the substrate type and the volume of waste produced, a covered lagoon biodigester was chosen, according to the decision rule in Table 7, recommended for substrates with a solids content of less than 2%. The system was sized for a volume of 1500 m3, considering a Hydraulic Retention Time (HRT) of 30 days and a total area of approximately 730 m2. Under these conditions, an annual production of 188,200 m3 of biogas is estimated, equivalent to an average flow rate of 43 m3/h (with 12 h of daily operation). The biogas will power a 72 kW motor generator, classifying the project as distributed microgeneration. After efficiency losses, net electricity generation is estimated at 1.23 kWh/m3 of biogas, totaling approximately 231,000 kWh/year. The total investment (CAPEX) was estimated at R$499,283.28, as detailed in Table 9.
Table 9.
CAPEX.
4.3.4. Step 4—Raise Operating Costs and Revenue (Figure 12)
OPEX was estimated at 6% of CAPEX, resulting in an annual cost of R$29,957.00, which includes maintenance expenses, insurance, and potential incidentals at the biogas plant. Operator salaries and charges total R$25,660.80 per year. Revenues were calculated based on savings in electricity generated and injected into the Minas Gerais Energy Company (CEMIG) grid, considering an average tariff of R$641.00/MWh, adjusted for the state’s ICMS tax subsidies. Therefore, the estimated annual revenue for the first year was R$148,071.00. Table 10 details the cash flow structure, projected for 25 years.
Table 10.
Project Cash Flow (in R$).
4.3.5. Step 5—Define the Cost of Invested Capital (Figure 13)
The project is financed primarily by third-party resources from the BNDES’ Low Carbon Agriculture Program credit line, which offers a real rate of 1.62% per year, adjusted by the IPCA of 4.31%, with a 5-year grace period, amortization in 10 years, and financing of up to 80% of the total investment, equivalent to R$399,426.62. The cost of equity (ke) was estimated according to the capital asset pricing model (CAPM):
where
- rf = risk-free rate;
- β = risk coefficient;
- MRP = market risk premium.
The risk-free rate (rf) was based on a Brazilian government bond (NTN-B) with a 25-year maturity. Beta (β) represents the average of companies in the electricity sector listed on the national stock market, obtained using Economática® database (https://www.economatica.com) [72]. The market risk premium (MRP) was extracted from data published for the Brazilian market in 2020, with rf and MRP adjusted for inflation measured by the IPCA (4.31% per year). Since the project uses free cash flow to the shareholder, the discount rate corresponds exclusively to the cost of equity (ke), as shown in Table 11.
Table 11.
Parameters for the discount rate.
4.3.6. Step 6—Select the Methodology and Evaluate the Results (Figure 14)
With the cash flow and discount rate defined, the NPV technique combined with MCS was adopted for investment analysis, as per the decision rule in Table 8. This approach was chosen due to the high volatility of variables such as energy tariffs and biogas production, and the low post-investment flexibility.
Therefore, a sensitivity analysis was performed to identify which key variables have the greatest impact on the NPV result, as shown in Figure 16.
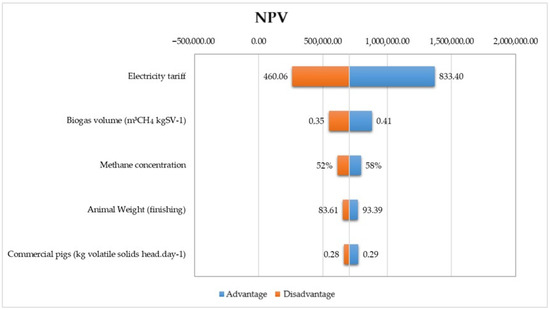
Figure 16.
Sensitivity analysis.
As shown in Figure 16, the electricity tariff and the volume of biogas were the variables that had the greatest impact on the NPV. Still, the results indicated an average NPV of R$801,200.00, with a standard deviation of R$48,017.67 and extreme values between R$651,686.87 and R$996,306.44, obtained from 10,000 simulations performed in Crystal Ball® software Version 11.1.
Thus, the project’s economic viability and low risk level are confirmed, and the investment is recommended, and access to the utility’s grid is requested, concluding the mapping process.
5. Conclusions
This study aimed to model the process of evaluating investments in biogas-based DG projects in Brazil, using the BPMN and DMN tools [71] to define a standard model, highlighting the sequence of activities, the most relevant activities, and the main decision points inherent to the process, for quality analysis. In addition, the model highlights the need for knowledge of the regulation and incentives for DG by RES in the country, presents the available technologies and the process for producing electricity using biogas, the appropriate moments for data collection, an estimate of revenues, and the methodology applied for investment evaluation.
Evaluating investments in biogas-based DG was divided into six collapsed subprocesses to describe the process’s stages better. The first subprocess detailed the regulation of the sector, the normative resolutions 482/2012, 687/2015, 786/2017, and law 14300/2022 (DG Legal Framework), the tax incentives, mainly enabled by the ICMS 16 Agreement, and the financial incentives, leveraged by ProGD in 2015, were also described. The regulation guarantees access to the energy grid but requires a series of requirements to allow access, while incentives increase in viability of this type of investment.
The second and third subprocesses present essential points in producing electricity through biogas. Describe the types of substrates, the possibilities of using one or more substrates in the DA, and the characteristics of the substrate that impact the choice of the biodigester. It also presents the types of biodigesters and, based on a business rule, the appropriate option according to the level of solid waste of the available substrate. The correct moments for sizing the biodigester and generator set and estimating biogas and electricity production are highlighted. At the end of the third subprocess, the values of CAPEX and pre-operational costs necessary for the start of the project are obtained.
In the fourth subprocess, the activities of raising the OPEX were mapped. The revenues obtained to compose the cash flow, the pre-operational costs, and CAPEX were estimated. The cash flow allows for an understanding of the characteristics of the project, which is essential for the adequate adoption of the investment analysis methodology. The last subprocess presented the possible analysis methodologies and a rule for selecting the most appropriate one, according to the project under analysis, and showed the steps of evaluating the result and the paths to start the execution or discard the project, according to the viability results obtained.
In this way, the process model of evaluating investment in biogas-based DG, created in BPMN and DMN, presents a standard to be followed by potential investors, offering support for decision-making by highlighting the main points of the process. In addition, it contributes to the dissemination of knowledge of RES.
From a sustainability perspective, the proposed investment assessment model can improve the evaluation of biogas projects by considering their economic viability, the environmental benefits of waste reuse, and the influence of political incentives. This integrated approach strengthens the link between financial performance and environmental outcomes, supporting evidence-based decisions in energy planning. It contributes to advancing the sustainable development goals (SDGs) related to affordable and clean energy, responsible production, and climate action.
Among other suggestions for future work, the need for modeling in BPMN and DMN for investments in biomethane or creating a model that identifies all possible results with biogas (electricity, heat, biomethane, and biofertilizer) is worth mentioning, in addition to the need for conducting a comparative analysis with other methods and in other scenarios. Furthermore, the literature lacks investment process models for other RES, such as solar, wind, and hydro. As a limitation, this study presented an initial approach with a less complex level of detail. Future studies can fill this gap by exploring greater interaction between stakeholders, such as the distributor, the regulatory agency, and the integrator who will implement the technology on-site. With greater detail on the interaction between these stakeholders, more elements of BPMN can be explored, enriching the methodology in future work.
Author Contributions
Conceptualization, P.A.C.d.S.B., G.A. and E.d.O.P.; Methodology, P.A.C.d.S.B., G.A., A.L.M. and E.d.O.P.; Software, P.A.C.d.S.B., A.L.M. and L.C.S.R.; Validation, G.A., A.L.M., E.d.O.P., P.R.J. and L.C.S.R.; Formal analysis, P.A.C.d.S.B., G.A. and A.L.M.; Investigation, P.A.C.d.S.B., A.L.M., E.d.O.P. and P.R.J.; Resources, P.A.C.d.S.B., A.L.M., P.R.J. and L.C.S.R.; Data curation, G.A.; Writing—original draft, P.A.C.d.S.B., G.A. and A.L.M.; Writing—review & editing, G.A., E.d.O.P., P.R.J. and L.C.S.R.; Visualization, P.A.C.d.S.B., E.d.O.P., P.R.J. and L.C.S.R.; Supervision, G.A. and E.d.O.P.; Project administration, G.A. and E.d.O.P.; Funding acquisition, E.d.O.P., P.R.J. and L.C.S.R. All authors have read and agreed to the published version of the manuscript.
Funding
For financial support and research incentives, the authors would like to thank the Brazilian National Council for Scientific and Technological Development—CNPq Brazil (Processes 304897/2024-8; 169639/2023-1; 443802/2023-8; 303341/2022-0; 440444/2022-5); the Minas Gerais Research Funding Foundation—FAPEMIG Brazil; the Coordination for the Improvement of Higher Education Personnel—CAPES Brazil; the Federal University of Itajubá—UNIFEI; and the Foundation for the Support of Education, Research, and Extension of Itajubá—FAPEPE Brazil.
Institutional Review Board Statement
Not applicable.
Informed Consent Statement
Not applicable.
Data Availability Statement
The data that support the findings of this study are available from the corresponding author, P.R.J., upon reasonable request.
Conflicts of Interest
The authors declare no conflicts of interest.
Abbreviations
The following abbreviations are used in this manuscript:
| AD | Anaerobic Digestion |
| ANEEL | National Electricity Agency |
| ABiogás | Brazilian Biogas Association |
| ABBM | Brazilian Biogas and Biomethane Association |
| BNDES | National Bank for Economic and Social Development |
| BPMN | Business Process Model and Notation |
| CAPEX | Capital Expenditure |
| CAPM | Capital Asset Pricing Model |
| CIBiogás | International Center for Renewable Energies |
| CSTR | Continuous Stirred-Tank Reactor |
| DG | Distributed Generation |
| DMN | Decision Model and Notation |
| DPB | Discounted Payback Period |
| DRD | Decision Requirement Diagram |
| FIO B | Tariff Component of Energy Distribution |
| GHG | Greenhouse Gas |
| ICMS | Tax on Circulation of Goods and Services |
| IRR | Internal Rate of Return |
| LCCA | Life Cycle Cost Analysis |
| LCOE | Levelized Cost of Energy |
| MCS | Monte Carlo Simulation |
| MRP | Market Risk Premium |
| MSW | Municipal Solid Waste |
| NPV | Net Present Value |
| O and M | Operation and Maintenance |
| OPEX | Operating Expenditure |
| OMG | Object Management Group |
| PB | Payback Period |
| PV | Photovoltaic |
| RES | Renewable Energy Sources |
| RO | Real Options |
| ROI | Return on Investment |
| USAB | Up-flow Sludge Blanket |
| WACC | Weighted Average Cost of Capital |
References
- de Doile, G.N.D.; Rotella Junior, P.; Rocha, L.C.S.; Janda, K.; Aquila, G.; Peruchi, R.S.; Balestrassi, P.P. Feasibility of hybrid wind and photovoltaic distributed generation and battery energy storage systems under techno-economic regulation. Renew. Energy 2022, 195, 1310–1323. [Google Scholar] [CrossRef]
- de Doile, G.N.D.; Rotella Junior, P.; Rocha, L.C.S.; Janda, K.; Peruchi, R.; Aquila, G.; Balestrassi, P.P. Impacts of economic regulation on photovoltaic distributed generation with battery energy storage systems. J. Energy Storage 2023, 72, 108382. [Google Scholar] [CrossRef]
- Vanegas Cantarero, M.M. Of renewable energy, energy democracy, and sustainable development: A roadmap to accelerate the energy transition in developing countries. Energy Res. Soc. Sci. 2020, 70, 101716. [Google Scholar] [CrossRef]
- Saidur, R.; Islam, M.R.; Rahim, N.A.; Solangi, K.H. A review on global wind energy policy. Renew. Sustain. Energy Rev. 2010, 14, 1744–1762. [Google Scholar] [CrossRef]
- Vita, V.; Alimardan, T.; Ekonomou, L. The Impact of Distributed Generation in the Distribution Networks’ Voltage Profile and Energy Losses. In Proceedings of the 2015 IEEE European Modelling Symposium (EMS), Madrid, Spain, 6–8 October 2015; IEEE: New York, NY, USA, 2015; pp. 260–265. [Google Scholar]
- Ufa, R.A.; Malkova, Y.Y.; Rudnik, V.E.; Andreev, M.V.; Borisov, V.A. A review on distributed generation impacts on electric power system. Int. J. Hydrogen Energy 2022, 47, 20347–20361. [Google Scholar] [CrossRef]
- Ghafouri, A.; Milimonfared, J.; Gharehpetian, G.B. Coordinated Control of Distributed Energy Resources and Conventional Power Plants for Frequency Control of Power Systems. IEEE Trans. Smart Grid 2015, 6, 104–114. [Google Scholar] [CrossRef]
- Chapman, A.C.; Verbic, G. Dynamic distributed energy resource allocation for load-side emergency reserve provision. In Proceedings of the 2016 IEEE Innovative Smart Grid Technologies—Asia (ISGT-Asia), Melbourne, VIC, Australia, 28 November–1 December 2016; IEEE: New York, NY, USA, 2016; pp. 1189–1194. [Google Scholar]
- IRENA—International Renewable Energy Agency. Renewable Power Generation Costs in 2019. 2020. Available online: https://www.irena.org/-/media/Files/IRENA/Agency/Publication/2020/Jun/IRENA_Power_Generation_Costs_2019.pdf (accessed on 6 June 2025).
- ANEEL—National Electricity Agency. Normative Resolution No. 482 of 17 July 2012. Available online: http://www2.aneel.gov.br/cedoc/ren2012482.pdf (accessed on 6 June 2025).
- Borges, C.P.; Sobczak, J.C.; Silberg, T.R.; Uriona-Maldonado, M.; Vaz, C.R. A systems modeling approach to estimate biogas potential from biomass sources in Brazil. Renew. Sustain. Energy Rev. 2021, 138, 110518. [Google Scholar] [CrossRef]
- Brazilian National Congress. Brazilian Ordinary Law no 14300. 2022. Available online: https://www.planalto.gov.br/ccivil_03/_ato2019-2022/2022/lei/L14300.htm (accessed on 6 June 2025).
- Rigo, P.D.; Siluk, J.C.M.; Lacerda, D.P.; Rosa, C.B.; Rediske, G. Is the success of small-scale photovoltaic solar energy generation achievable in Brazil? J. Clean. Prod. 2019, 240, 118243. [Google Scholar] [CrossRef]
- CONFAZ—National Council of Financial Policies. Convênio ICMS 16. 2015. Available online: https://www.confaz.fazenda.gov.br/legislacao/convenios/2015/CV016_15 (accessed on 3 June 2025).
- de Paula Sermarini, A.C.; Azevedo, J.H.P.; de Albuquerque, V.C.; Calili, R.F.; Gonçalves, F.; Jannuzzi, G. Distributed energy resources in low-income communities: A public policy proposal for Brazil. Energy Policy 2024, 187, 114030. [Google Scholar] [CrossRef]
- ANEEL—National Electricity Agency. Normative Resolution No. 687 of 24 November 2015. Available online: http://www2.aneel.gov.br/cedoc/ren2015687.pdf (accessed on 3 June 2025).
- ANEEL—National Electricity Agency. Normative Resolution No. 786 of 17 October 2017. Available online: http://www2.aneel.gov.br/cedoc/ren2017786.pdf (accessed on 3 June 2025).
- Ayoub, N.; Yuji, N. Governmental intervention approaches to promote renewable energies—Special emphasis on Japanese feed-in tariff. Energy Policy 2012, 43, 191–201. [Google Scholar] [CrossRef]
- Silva, P.F.; Bonatto, B.D.; Valério, V.E.M.; Miranda, R.C.; Costa, V.B.F. Model and feasibility Analysis: Photovoltaic generation systems installed at Brazilian public universities for energy sustainability. Sustain. Energy Technol. Assess. 2024, 63, 103652. [Google Scholar] [CrossRef]
- CONFAZ—National Council of Financial Policies. Convênio ICMS 18. 2018. Available online: https://www.confaz.fazenda.gov.br/legislacao/convenios/2018/CV042_18 (accessed on 3 April 2025).
- SEF-MG—Secretaria de Estado da Fazendo de Minas Gerais. Law No 6763/1975—2/13. 2022. Available online: http://www.fazenda.mg.gov.br/empresas/legislacao_tributaria/leis/l6763_1975_02.html (accessed on 10 October 2023).
- Bernardes, P.A.C.S.; Aquila, G.; Pamplona, E.O.; Rocha, L.C.S.; Rotella Junior, P. Net metering and tax incentives for distributed generation in Brazil: Economic impact analysis for swine biogas. J. Clean. Prod. 2022, 375, 134138. [Google Scholar] [CrossRef]
- MME—Ministério de Minas e Energia. Programa de Desenvolvimento da Geração Distribuída de Energia Elétrica (ProGD). Available online: https://www.gov.br/mme/pt-br/arquivos/document-0-896106613761072.pdf (accessed on 6 June 2025).
- Castro, P.H.; Filho, D.O.; Rosa, A.P.; Navas Gracia, L.M.; Almeida Silva, T.C. Comparison of externalities of biogas and photovoltaic solar energy for energy planning. Energy Policy 2024, 188, 114070. [Google Scholar] [CrossRef]
- Sica, P.; Marabesi, A.O.; Seleghim, A.R.; Das, K.C.; Baptista, A.S. Effects of vinasse concentration on biogas production: An experimental work and case study in the context of RenovaBio in Brazil. Bioresour. Technol. Rep. 2024, 25, 101698. [Google Scholar] [CrossRef]
- CIBIOGÁS—Centro Internacional de Energias Renováveis—Biogás Panorama do Biogás no Brasil. 2021. Available online: https://cibiogas.org/wp-content/uploads/2022/04/NT-PANORAMA-DO-BIOGAS-NO-BRASIL-2021.pdf (accessed on 3 May 2025).
- Adekunle, K.F.; Okolie, J.A. A Review of Biochemical Process of Anaerobic Digestion. Adv. Biosci. Biotechnol. 2015, 6, 205–212. [Google Scholar] [CrossRef]
- Tezer, Ö.; Karabağ, N.; Öngen, A.; Çolpan, C.Ö.; Ayol, A. Biomass gasification for sustainable energy production: A review. Int. J. Hydrogen Energy 2022, 47, 15419–15433. [Google Scholar] [CrossRef]
- Kunatsa, T.; Xia, X. A review on anaerobic digestion with focus on the role of biomass co-digestion, modelling and optimisation on biogas production and enhancement. Bioresour. Technol. 2022, 344, 126311. [Google Scholar] [CrossRef]
- Mutungwazi, A.; Mukumba, P.; Makaka, G. Biogas digester types installed in South Africa: A review. Renew. Sustain. Energy Rev. 2018, 81, 172–180. [Google Scholar] [CrossRef]
- Scarlat, N.; Dallemand, J.-F.; Fahl, F. Biogas: Developments and perspectives in Europe. Renew. Energy 2018, 129, 457–472. [Google Scholar] [CrossRef]
- NREL—National Renewable Energy Laboratory. A Manual for the Economic Evaluation of Energy Efficiency and Renewable Energy Technologies; Scholar’s Choice: London, UK, 2023. [Google Scholar]
- Avaci, A.B.; Melegari de Souza, S.N.; Werncke, I.; Chaves, L.I. Financial economic scenario for the microgeneration of electric energy from swine culture-originated biogas. Renew. Sustain. Energy Rev. 2013, 25, 272–276. [Google Scholar] [CrossRef]
- Dos Santos, I.F.S.; Barros, R.M.; Tiago Filho, G.L. Electricity generation from biogas of anaerobic wastewater treatment plants in Brazil: An assessment of feasibility and potential. J. Clean. Prod. 2016, 126, 504–514. [Google Scholar] [CrossRef]
- Pazuch, F.A.; Nogueira, C.E.C.; Souza, S.N.M.; Micuanski, V.C.; Friedrich, L.; Lenz, A.M. Economic evaluation of the replacement of sugar cane bagasse by vinasse, as a source of energy in a power plant in the state of Paraná, Brazil. Renew. Sustain. Energy Rev. 2017, 76, 34–42. [Google Scholar] [CrossRef]
- Amini, A.; Aponte-Morales, V.; Wang, M.; Dilbeck, M.; Lahav, O.; Zhang, Q.; Cunningham, J.A.; Ergas, S.J. Cost-effective treatment of swine wastes through recovery of energy and nutrients. Waste Manag. 2017, 69, 508–517. [Google Scholar] [CrossRef] [PubMed]
- Bernal, A.P.; dos Santos, I.F.S.; Moni Silva, A.P.; Barros, R.M.; Ribeiro, E.M. Vinasse biogas for energy generation in Brazil: An assessment of economic feasibility, energy potential and avoided CO2 emissions. J. Clean. Prod. 2017, 151, 260–271. [Google Scholar] [CrossRef]
- de Almeida, C.; Bariccatti, R.A.; Frare, L.M.; Camargo Nogueira, C.E.; Mondardo, A.A.; Contini, L.; Gomes, G.J.; Rovaris, S.A.; dos Santos, K.G.; Marques, F. Analysis of the socio-economic feasibility of the implementation of an agro-energy condominium in western Paraná—Brazil. Renew. Sustain. Energy Rev. 2017, 75, 601–608. [Google Scholar] [CrossRef]
- Govender, I.; Thopil, G.A.; Inglesi-Lotz, R. Financial and economic appraisal of a biogas to electricity project. J. Clean. Prod. 2019, 214, 154–165. [Google Scholar] [CrossRef]
- Velásquez Piñas, J.A.; Venturini, O.J.; Silva Lora, E.E.; del Olmo, O.A.; Calle Roalcaba, O.D. An economic holistic feasibility assessment of centralized and decentralized biogas plants with mono-digestion and co-digestion systems. Renew. Energy 2019, 139, 40–51. [Google Scholar] [CrossRef]
- Menezes Lima, J.A.; Correa Magalhães Filho, F.J.; Constantino, M.; Formagini, E.L. Techno-economic and performance evaluation of energy production by anaerobic digestion in Brazil: Bovine, swine and poultry slaughterhouse effluents. J. Clean. Prod. 2020, 277, 123332. [Google Scholar] [CrossRef]
- Cudjoe, D.; Nketiah, E.; Obuobi, B.; Adu-Gyamfi, G.; Adjei, M.; Zhu, B. Forecasting the potential and economic feasibility of power generation using biogas from food waste in Ghana: Evidence from Accra and Kumasi. Energy 2021, 226, 120342. [Google Scholar] [CrossRef]
- Meyer, E.L.; Overen, O.K.; Obileke, K.; Botha, J.J.; Anderson, J.J.; Koatla, T.A.B.; Thubela, T.; Khamkham, T.I.; Ngqeleni, V.D. Financial and economic feasibility of bio-digesters for rural residential demand-side management and sustainable development. Energy Rep. 2021, 7, 1728–1741. [Google Scholar] [CrossRef]
- de Brito, R.C.; Barros, R.M.; dos Santos, I.F.S.; Tiago Filho, G.L.; da Silva, S.P.G. Municipal solid waste management and economic feasibility for electricity generation from landfill gas and anaerobic reactors in a Brazilian state. Environ. Technol. Innov. 2021, 22, 101453. [Google Scholar] [CrossRef]
- Klimek, K.; Kapłan, M.; Syrotyuk, S.; Bakach, N.; Kapustin, N.; Konieczny, R.; Dobrzyński, J.; Borek, K.; Anders, D.; Dybek, B.; et al. Investment Model of Agricultural Biogas Plants for Individual Farms in Poland. Energies 2021, 14, 7375. [Google Scholar] [CrossRef]
- Oliveira, D.d.S.; Gomes, G.C.; Rocha, L.C.S.; Rotella Junior, P.; Aquila, G.; Bernardes, P.A.; Janda, K. Energy and stochastic economic assessment for distributed power generation from Manipueira biogas. Environ. Technol. 2024, 45, 1608–1621. [Google Scholar] [CrossRef]
- Ankathi, S.K.; Chaudhari, U.S.; Handler, R.M.; Shonnard, D.R. Sustainability of Biogas Production from Anaerobic Digestion of Food Waste and Animal Manure. Appl. Microbiol. 2024, 4, 418–438. [Google Scholar] [CrossRef]
- Kusz, D.; Kusz, B.; Wicki, L.; Nowakowski, T.; Kata, R.; Brejta, W.; Kasprzyk, A.; Barć, M. The Economic Efficiencies of Investment in Biogas Plants—A Case Study of a Biogas Plant Using Waste from a Dairy Farm in Poland. Energies 2024, 17, 3760. [Google Scholar] [CrossRef]
- Marcucci, S.M.P.; Dos Santos, E.D.N.; Fuziki, M.E.K.; Lenzi, G.G.; Balthazar, J.M.; Tusset, A.M. Techno-Economic Analysis of Biogas Production with Vinasse and Co-Digestion with Vinasse and Filter Cake for Annexed Plants: Case Study in Paraná State, Brazil. Biomass 2025, 5, 10. [Google Scholar] [CrossRef]
- Torres, I.D.S.; Fantinato, M.; Branco, G.M.; Gordijn, J. Guidelines to derive an e^{3}value business model from a BPMN process model: An experiment on real-world scenarios. Softw. Syst. Model. 2023, 22, 599–618. [Google Scholar] [CrossRef]
- Chinosi, M.; Trombetta, A. BPMN: An introduction to the standard. Comput. Stand. Interfaces 2012, 34, 124–134. [Google Scholar] [CrossRef]
- OMG—Object Management Group. Business Process Model and Notation—BPMN. 2023. Available online: https://www.bpmn.org/ (accessed on 5 April 2025).
- White, S. Introduction to BPMN. Ibm Cooperation. 2004. Available online: http://www.bptrends.com (accessed on 5 April 2025).
- Combi, C.; Oliboni, B.; Zardini, A.; Zerbato, F. A Methodological Framework for the Integrated Design of Decision-Intensive Care Pathways—An Application to the Management of COPD Patients. J. Healthc. Inform. Res. 2017, 1, 157–217. [Google Scholar] [CrossRef]
- Silver, B. BPMN Method and Style: With BPMN Implementer’s Guide, 2nd ed.; Cody-Cassidy Press: Altadena, CA, USA, 2017. [Google Scholar]
- Campos, A. Modelagem de Processos com BPMN, 2nd ed.; Braspot: Rio de Janeiro, Brazil, 2014. [Google Scholar]
- Häußler, M.; Esser, S.; Borrmann, A. Code compliance checking of railway designs by integrating BIM, BPMN and DMN. Autom. Constr. 2021, 121, 103427. [Google Scholar] [CrossRef]
- OMG—Object Management Group. Decision Model and Notation—DMN. 2023. Available online: https://www.omg.org/spec/DMN/1.2/PDF (accessed on 6 June 2025).
- Bazhenova, E.; Zerbato, F.; Oliboni, B.; Weske, M. From BPMN process models to DMN decision models. Inf. Syst. 2019, 83, 69–88. [Google Scholar] [CrossRef]
- Figl, K.; Mendling, J.; Tokdemir, G.; Vanthienen, J. What we know and what we do not know about DMN. J. Concept. Model 2018, 13, 1–16. [Google Scholar] [CrossRef]
- OMG—Object Management Group. Business Process Model and Notation (BPMN), Version 2.0.2.; OMG Document Number: Formal/2013-12-09; BMPN: Berlin, Germany, 2014.
- Van Der Aalst, W.M.P. The Application of Petri Nets to Workflow Management. J. Circuits Syst. Comput. 1998, 8, 21–66. [Google Scholar] [CrossRef]
- Reisig, W. Petri Nets: An introduction; Springer-Verlag: Berlin/Heidelberg, Germany, 1985. [Google Scholar]
- OMG—Object Management Group. Decision Model and Notation (DMN), Version 1.1.; OMG Document Number: Formal/2015-06-01; DMN: Mülheim, Germany, 2016.
- de Leoni, M.; Felli, P.; Montali, M. Integrating BPMN and DMN: Modeling and Analysis. J. Data Semant. 2021, 10, 165–188. [Google Scholar] [CrossRef]
- Hasić, F.; De Smedt, J.; Vanthienen, J. Augmenting processes with decision intelligence: Principles for integrated modelling. Decis. Support Syst. 2018, 107, 1–12. [Google Scholar] [CrossRef]
- Sooter, L.J.; Hasley, S.; Lario, R.; Rubin, K.S.; Hasić, F. Modeling a Clinical Pathway for Contraception. Appl. Clin. Inform. 2019, 10, 935–943. [Google Scholar] [CrossRef]
- Pankowska, M. Business Models in CMMN, DMN and ArchiMate language. Procedia Comput. Sci. 2019, 164, 11–18. [Google Scholar] [CrossRef]
- Mendling, J.; Reijers, H.A.; van der Aalst, W.M.P. Seven process modeling guidelines (7PMG). Inf. Softw. Technol. 2010, 52, 127–136. [Google Scholar] [CrossRef]
- BNDES—Banco Nacional de Desenvolvimento Econômico e Social. Renovagro—Programa de Financiamento a Sistemas de Produção Agropecuária Sustentáveis. 2023. Available online: https://www.bndes.gov.br/wps/portal/site/home/financiamento/produto/renovagro (accessed on 6 June 2025).
- Camunda Modeler Plataform. 2025. Camunda Modeler: Process Modeling using BPMN [WWW Document]. Available online: https://camunda.com/platform/modeler/ (accessed on 12 February 2024).
- Economática. 2025. Economática Software Database [WWW Document]. Available online: https://www.economatica.com (accessed on 6 June 2025).
Disclaimer/Publisher’s Note: The statements, opinions and data contained in all publications are solely those of the individual author(s) and contributor(s) and not of MDPI and/or the editor(s). MDPI and/or the editor(s) disclaim responsibility for any injury to people or property resulting from any ideas, methods, instructions or products referred to in the content. |
© 2025 by the authors. Licensee MDPI, Basel, Switzerland. This article is an open access article distributed under the terms and conditions of the Creative Commons Attribution (CC BY) license (https://creativecommons.org/licenses/by/4.0/).