Abstract
As a pioneering initiative in the advancement of green finance, China’s Green Finance Reform and Innovation Pilot Zone (GFPZ) offers critical empirical and theoretical insights for the development of a global green financial system. While existing studies highlight the GFPZ’s role in promoting pollution reduction within designated regions, it remains unclear whether its effects extend along supply chains. Exploiting the GFPZ policy as a quasi-natural experiment and employing a difference-in-differences (DID) approach, this study uses panel data from A-share listed companies on the Shanghai and Shenzhen stock exchanges in China from 2013 to 2021 to assess its impact. The findings reveal the following: (1) The GFPZ significantly reduces emissions not only among focal heavily polluting firms but also across their upstream and downstream partners. (2) The primary transmission channel is a financing penalty spillover, whereby the policy intensifies financing constraints and reduces credit access for supply chain firms, compelling them to scale down operations. Notably, the evidence does not support the presence of a Porter effect. (3) Heterogeneity analysis indicates that the spillover effect is more pronounced among upstream suppliers and firms with stronger green capacities, while excessive government subsidies tend to weaken the transmission of policy impacts.
1. Introduction
Green finance, a financial mechanism integrating environmental regulatory functions, plays a critical role in facilitating low-carbon transitions and fostering sustainable development [1]. By channeling capital into environmentally sustainable industries and projects, green finance helps internalize environmental externalities, encouraging firms to adopt pollution control measures and invest in green innovation.
In June 2017, China launched the first cohort of Green Finance Reform and Innovation Pilot Zones (GFPZs) across five provinces—Zhejiang, Jiangxi, Guangdong, Guizhou, and Xinjiang—tailoring green finance strategies to the distinct institutional and ecological contexts of each region. In contrast to traditional command-and-control approaches, such as emission quotas or pollution levies, GFPZs employ a market-based framework that uses financial incentives to guide firms’ environmental practices [2]. While existing research has explored the policy’s effects at the firm level, its broader impact on supply chains remains under explored. Specifically, whether market-driven mechanisms can induce emission reductions among upstream and downstream partners of regulated polluters is an unresolved empirical question.
Most studies on GFPZs have focused on firm-level outcomes, such as green technological innovation [3,4], improved environmental responsibility [5], enhanced energy efficiency [6], and pollution reduction [6,7]. The GFPZ policy framework emphasizes strict credit regulation for high-emission, energy-intensive firms and promotes differentiated financing based on carbon intensity. Several studies highlight varied policy effects across firm types, with green finance instruments limiting financing capacity, increasing capital costs, and reducing total factor productivity in pollution-intensive industries [8,9,10,11]. However, empirical research on the supply chain effects of GFPZ policies remains limited. Most existing analyses have concentrated on the direct impact of regulations on firms within the pilot zones, neglecting the broader spillover effects across supply chains. Given the interconnected nature of supply chains—especially the upstream and downstream linkages—environmental governance increasingly depends on policy tools that can generate spillovers beyond the focal firms. As industrial production becomes more fragmented, these inter-firm connections amplify both environmental and macroeconomic effects [12,13]. Targeted regulation of polluting firms may thus drive greater emissions reductions through spillover effects within the supply chain [14].
International research provides a more systematic understanding of how environmental and green finance policies propagate through supply chains. Existing research predominantly emphasizes the direct effects of green finance instruments on firms’ pollution abatement, while paying insufficient attention to the indirect transmission mechanisms that operate through supply chains. The international literature generally recognizes that linkages between upstream and downstream firms constitute a critical channel for advancing green transitions at the supply chain level, as environmental policies can generate significant spillovers in both pollution reduction and technological upgrading. For instance, El Ouardighi et al., drawing on a double-marginalization framework, demonstrate how emission-reduction efforts by manufacturers and retailers interact within the supply chain, revealing that environmental pressures can accumulate and induce coordinated governance across firms [15]. Similarly, Dai et al. find that customers’ corporate social responsibility (CSR) performance significantly shapes suppliers’ CSR behaviors, indicating that firms’ green actions can propagate along supply chain relationships [16].
Regarding the transmission of environmental policies, existing studies mostly focus on their effects on innovation efficiency and technological progress. Steinbrunner and P.R.’s analysis of Central European manufacturing firms from 2009 to 2017 finds that environmental tax regulation has a significant impact on technological efficiency and productivity, with heterogeneous spillover effects across upstream and downstream firms [17]. Franco and Marin also document that environmental tax rates generate cross-firm and cross-chain spillovers on innovation and efficiency [18]. Using Germany’s azo fuel ban as a quasi-natural experiment, Chakraborty and Chatterjee further show that environmental regulation influences innovation activities across supply chain tiers [19]. In the U.S. context, Ghosh and Sanyal, studying deregulation in the U.S. electricity sector, demonstrate that intensified downstream competition leads to a 19.3% decline in upstream technological innovation, highlighting that regulatory changes can transmit upstream through supply chain links and reshape technology suppliers’ incentives [20].
Taken together, the international literature underscores the importance of recognizing supply chain transmission channels when evaluating green finance and environmental policy effects. This study fills this gap by investigating whether GFPZ policies lead to pollution abatement spillovers among the supply chain affiliates of regulated firms. It further explores the mechanisms driving these effects and examines their heterogeneity across different supply chain positions and levels of green capacity. Using panel data from non-financial A-share listed firms between 2013 and 2021, and employing a difference-in-differences (DID) approach, we focus on the first set of GFPZs. Pollution intensity is measured using environmental tax data and ESG disclosures, encompassing emissions from solid, liquid, and gaseous pollutants.
Empirical findings indicate that GFPZs significantly reduce emissions among supply chain affiliates of targeted firms. Spillover effects are more pronounced among firms with a strong green foundation and upstream positioning, while excessive government subsidies may dilute policy effectiveness. Mechanism analysis reveals that green spillovers operate primarily via a financing penalty channel, constraining capital access, reducing excess capacity, and contracting production scale. This study contributes to the literature in three key ways. First, it uncovers the GFPZ’s environmental spillover effects within supply chains, extending firm-level policy evaluation to inter-firm dynamics. Second, it explores the contextual heterogeneity of policy impact, especially the differential effects across environmental foundations and supply chain positions. Third, it reveals the role of financing constraints as a critical transmission mechanism, confirming that emission reductions result from restricted financial capacity and production scale among supply chain firms.
2. Materials and Methods
2.1. Policy Background
In June 2017, seven central ministries jointly launched the first five-year plan for the Green Finance Reform and Innovation Pilot Zones (GFPZs), initiating a nationally differentiated regional experiment across Zhejiang, Jiangxi, Guangdong, Guizhou, and Xinjiang. The initiative was later expanded to include Lanzhou New Area (Gansu) in 2019 and the municipality of Chongqing in 2022.
Zhejiang and Guangdong, representing the eastern coastal region, benefit from well-established financial infrastructures and have focused on developing innovative green financial instruments, facilitating the low-carbon transition of traditional industries. In contrast, Jiangxi and Guizhou, located in central China, have capitalized on their ecological resources to restructure local economies, promote green industries, and explore region-specific pathways toward carbon peaking and neutrality. Xinjiang, in the western frontier, has emphasized cross-border green finance cooperation, the development of customized financial products for environmental and high-end manufacturing sectors, and the application of green finance in ethnically diverse and economically developing regions.
2.2. Hypothesis Development
Amid the pursuit of high-quality economic development, organizational isomorphism and environmental synergy within supply chain networks have emerged as critical areas of inquiry. As supply chain collaboration intensifies, knowledge-sharing channels [21], factor mobility, and risk transmission mechanisms between focal firms and their supply chain partners have become increasingly salient, fostering behavioral convergence and coordinated responses. Beyond the exchange of production inputs and information, supply chain actors are also subject to institutional pressures and environmental externalities [22,23], which can propagate spillover effects through network linkages.
Focusing specifically on the transmission mechanisms of green finance policies, two dimensions can be distinguished, as illustrated in Figure 1: Policy Incentive Mechanism: On one hand, The GFPZ framework fosters a favorable green financing environment that encourages focal firms to invest in green technologies. These innovations may diffuse through supply chain linkages, prompting upstream and downstream firms to adopt cleaner production processes [24]. Simultaneously, green transformation expectations are embedded in contractual relationships, effectively transmitting environmental governance demands and compelling supply chain partners to enhance their environmental performance [16]. Policy Constraint Mechanism: GFPZ policies impose financial constraints on high-emission firms by restricting access to capital. These constraints transmit along the supply chain, prompting upstream and downstream enterprises to adjust capacity and resource allocations in response to the shifting financial landscape. This coordinated response contributes to collective emission reductions.
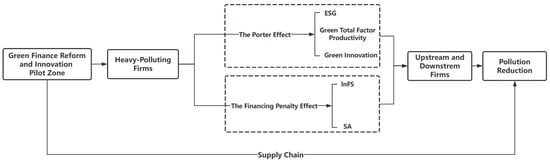
Figure 1.
Theoretical logic.
2.2.1. The Porter Effect
The Porter Effect asserts that well-designed environmental regulations can induce firms to innovate in ways that compensate for compliance costs and ultimately improve productivity [25]. Building on this foundational view, subsequent research distinguishes between the weak and strong versions of the Porter Effect [26]. The weak Porter Effect holds that appropriate environmental regulation encourages firms to conduct green innovation to offset potential regulatory costs [12]. The strong Porter Effect further argues that once innovation has been triggered, firms can achieve sustained improvements in core competitiveness [27,28]. Both stages have been empirically validated in the Chinese context, where environmental regulations have been shown to promote green technological innovation and enhance firm performance [29,30].
Existing research suggests that the Green Finance Reform and Innovation Pilot Zones can generate significant incentives for green transformation by improving the efficiency of financial resource allocation, implementing preferential green financing policies, and guiding capital flows toward environmentally friendly projects [14]. These policies foster a favorable green financing environment for eco-friendly enterprises, thereby encouraging firms within the pilot regions to increase investments in green technological innovation and enhance their green total factor productivity. Concurrently, firms are incentivized to assume greater social responsibility, reflected in improved ESG performance.
The policy effects manifest through a dual mechanism of knowledge spillovers and expectation-driven adjustments, thereby facilitating collaborative emissions reductions across the supply chain. On one hand, as focal firms enhance their capacity for green innovation, the resulting technological advances produce spillover effects. Upstream and downstream enterprises, by participating in supply chains led by these focal firms, gain access to advanced green technologies, which they can adopt and adapt to improve their own production processes. This leads to a green upgrading of production activities across the entire supply chain [31,32].
On the other hand, focal firms, guided by policy signals, adjust their resource allocation strategies by investing more heavily in low-carbon technologies and increasing the transparency of ESG-related information through environmental disclosures [33]. These green transformation strategies are transmitted via contractual relationships within the supply chain. To maintain their business relationships, upstream and downstream partners must align with the environmental standards set by the focal firms. This creates a cascading effect that drives green development across the supply chain network.
2.2.2. The Financing Penalty Effect
For heavily polluting industries, the GFPZ policies exhibit a clear constraint-oriented function. These policies intensify financing constraints faced by pollution-intensive enterprises, which are compelled to incur additional environmental compliance costs or accept higher financing risk premiums to meet environmental standards [34]. In the early stages of transition, due to rigid limitations in financing channels, such enterprises often must undergo internal resource reallocation—namely, reducing investment in conventional production activities to expand environmental investment [14]. These adjustments tend to manifest as capacity reductions rather than technological innovation and are aimed at achieving emission reduction targets rather than enhancing green total factor productivity.
When focal firms in high-pollution sectors come under pressure from the pilot zone policies, this constraint transmits along the supply chain, increasing pressure on upstream and downstream firms and inducing behavioral alignment. On one hand, the emission-reduction actions taken by focal firms create pressure and a convergence effect on supply chain partners, potentially generating spillover effects. Under heightened financing constraints and cost pressures, upstream and downstream enterprises—operating within the same supply chain financial network and subject to shared stakeholder expectations—are likely to adopt similar environmental behaviors in response to the focal firm’s actions. On the other hand, in the early phase of emissions reduction, focal firms often face environmental investments characterized by long cycles, low short-term returns, and high risk. Under external financing constraints, these enterprises are exposed to greater cash flow and operational risks [35]. As a result, they may lack the financial resources and innovation incentives necessary for proactive green and low-carbon transformation, leading instead to passive emission-reduction strategies centered on scaling down operations.
For upstream and downstream firms, the policy-induced constraints exacerbate the financing and capacity challenges of focal firms. Should focal enterprises downsize their operations, supply chain partners may encounter excess supply and declining demand. In such circumstances, upstream and downstream firms—seeking to mitigate overcapacity and anticipating the deteriorating creditworthiness of focal firms—may adopt similar short-term emissions reduction strategies to avoid more substantial losses.
In summary, this paper proposes the following hypothesis:
H1:
The GFPZ policy facilitates pollution reduction among upstream and downstream enterprises associated with heavily polluting firms.
2.3. Data
This study draws on data for A-share listed companies on the Shanghai and Shenzhen stock exchanges from 2013 to 2021. Supply chain linkages are constructed based on firms’ disclosed sales and procurement relationships. We extract each firm’s top five suppliers and top five customers from the CSMAR database to ensure data consistency and availability. These trading counterparties are then matched with listed firms to build a supplier–focal firm–customer–year panel structure [36]. For instance, if a focal firm A reports multiple trading partners (e.g., X and Y) in 2021, the corresponding observations are recorded as A–X–2021 and A–Y–2021. Only cases in which both the focal firm and its upstream or downstream partners are publicly listed are retained in order to guarantee completeness and comparability of the information used.
During sample construction, firms marked as ST or *ST, as well as observations with substantial missing financial or governance data, are excluded. Financial indicators are obtained primarily from the CSMAR database, while corporate governance variables are compiled using information from the national tax survey dataset. This integrated approach ensures a high-quality and reliable supply chain dataset suitable for empirical analysis.
2.4. Empirical Model Specification
Given that this study focuses on the impact of pollution emissions among upstream and downstream enterprises associated with heavily polluting firms within the GFPZ, a DID model is employed to empirically test the policy effects.
Peit = β0 + β1treatit × pollutionit + Σjβjcontroljit + ΣkαkYeark + ΣnϑnIdn + εit
In the model, β0 denotes the constant term. The dependent variable Peit represents the level of pollution emissions for firm i in year t. The variable treatit is a dummy variable indicating whether the firm is located in a pilot city, while pollutionit is a dummy variable identifying whether the firm operates in a heavily polluting industry. controljit represents a set of control variables for firm i in year t. ϑn and αk denote firm-fixed effects and year-fixed effects, respectively, and εit is the random error term. This study focuses primarily on the significance and magnitude of the coefficient β1, which captures the extent to which the GFPZ policy influences pollution reduction through supply chain linkages among heavily polluting firms.
2.5. Variable Selection
2.5.1. Dependent Variable
The dependent variable Peit represents the pollution emission level of firm i in year t. The emission of different types of pollutants is usually included in the existing literature, but different types of pollutants cannot be directly compared due to the difference in dimensions. This study constructs a comprehensive Pollution Emission Index by integrating three categories of pollutants: solid, liquid, and gaseous emissions. Specifically, industrial dust emissions are used to represent solid pollutants, ammonia nitrogen emissions in industrial wastewater are used to capture liquid pollutants and carbon emissions are employed as a proxy for gaseous pollutants. The index is calculated as follows:
Specifically, let Pij denote the emission volume of pollutant j in firm i, and Paij represents the proportion of firm i emissions of pollutant j relative to the total emissions of pollutant j across the entire sample. Data on industrial dust emissions and ammonia nitrogen emissions in industrial wastewater are manually compiled from the National Tax Survey database. In this study, carbon emissions are classified according to the Greenhouse Gas Protocol, which defines three scopes of emissions. As Scope 3 includes all other indirect emissions not owned or directly controlled by the firm, only Scope 1 (direct emissions) and Scope 2 (indirect emissions from purchased energy) are aggregated to represent the firm’s carbon emissions. Carbon emissions data are primarily obtained from publicly disclosed ESG reports of listed companies. For firms that do not directly report carbon emissions, estimates are manually calculated following the Corporate Greenhouse Gas Accounting and Reporting Guidelines.
2.5.2. Independent Variable
The key explanatory variable in this study is the interaction term treat × pollution. The variable treat takes the value of 1 if the city in which the focal firm is located was included in the GFPZ, and 0 otherwise. To identify firms in heavily polluting industries, firms are defined as belonging to heavily polluting industries if their primary business falls into one of the following categories: coal mining and washing; oil and natural gas extraction; ferrous metal ore mining; non-ferrous metal ore mining; non-metallic mineral mining; manufacture of alcoholic beverages, soft drinks, and refined tea; textile manufacturing; manufacture of textile apparel and accessories; leather, fur, feather products, and footwear manufacturing; paper and paper products; processing of petroleum, coal, and other fuels; manufacture of chemical raw materials and chemical products; pharmaceutical manufacturing; manufacture of chemical fibers; rubber and plastic products; non-metallic mineral products; smelting and pressing of ferrous metals; smelting and pressing of non-ferrous metals; and production and supply of electricity, heat, gas, and water. Firms operating in these sectors are coded as 1 for the variable Pollution, and 0 otherwise.
2.5.3. Control Variables
This study selects three control variables related to enterprise characteristics, operating conditions, and corporate governance. (1) Enterprise characteristics include the company’s establishment period (FirmAge); the company’s size (Size), and the proportion of fixed assets (Fixed). (2) Operating conditions include debt-to-asset ratio (Lev), expressed by the ratio of the total liabilities to total assets; cash flow ratio (Cashflow), expressed by the net cash flow generated by operating activities divided by total assets; Tobin Q value (TobinQ), the sum of the market value of circulating shares, the number of non-circulating shares multiplied by the net assets per share, and the book value of liabilities, and divided by total assets; operating income growth rate (Growth), expressed by the operating income for this year divided by the operating income of the previous year, minus 1. Administrative expense ratio (AgC), expressed by administrative expenses divided by operating income. The net profit margin of fixed assets (Rorppe) is expressed by the average value of the net profit divided by the fixed assets’ opening balance and the end balance. (3) Corporate governance includes basic indicators such as board size (Board), dual-job integration (Dual), management shareholding ratio (Mshare), and institutional investor shareholding ratio (INST). The specific variable definitions are shown in Table 1.

Table 1.
Variables selection and calculation method.
3. Results
3.1. Descriptive Statistics
Table 2 presents the descriptive statistics for the variables used in this study. The mean value of Treatis 0.0502, indicating that approximately 5.02% of the 4644 firm-year observations are located within the GFPZ. The mean value of Pollution is 0.3882, suggesting that around 38.82% of the sampled firms operate in heavily polluting industries. The standard deviation of Pe is 1.0891, reflecting substantial heterogeneity in pollution levels across listed firms. All other control variables fall within reasonable fluctuation ranges, indicating that the dataset is of acceptable quality for empirical analysis.
Table 2.
Descriptive statistics.
3.2. Baseline Regression
Table 3 reports the baseline regression results examining the impact of the GFPZ policy on pollution emissions among upstream and downstream enterprises associated with heavily polluting focal firms. The dependent variable is Pe, and the key explanatory variable is the policy interaction term Treat × Pollution. To ensure the robustness of the regression results, Column (1) in Table 3 includes firm fixed effects and year fixed effects without incorporating any control variables. The coefficient on Treat × Pollution is negative and statistically significant at the 5% level, indicating that the pilot zone policy significantly reduces pollution emissions among the upstream and downstream enterprises of heavily polluting firms. Columns (2) and (3) sequentially introduce firm-level control variables. Column (3) represents the fully specified baseline regression model. In this specification, the coefficient on the interaction term is −0.056 and remains statistically significant at the 5% level, suggesting that, on average, pollution emissions among the supply chain affiliates of heavily polluting firms in the pilot zones are 5.60% lower than those in the control group. In terms of economic significance, a one standard deviation increase in the core explanatory variable is associated with a 0.8 percentage point reduction in pollution emissions. These findings indicate that the pilot zone policy significantly improves the environmental performance of supply chain partners through a transmission mechanism, providing preliminary empirical support for Hypothesis H1.
Table 3.
Regression results analysis.
To mitigate concerns regarding potential sample selection bias and reverse causality in the baseline regression, we re-estimate the policy effects using matching methods combined with a DID approach. Column (4) reports the regression results based on the PSM sample. The kernel matching method is applied, using all control variables from Model (1) as covariates for balance matching. Column (5) follows the approach of Hainmueller [37], employing the Entropy Balancing (EB) method to re-examine the results. As presented in Table 3, all specifications yield significantly negative coefficients for the interaction term. These consistent findings indicate that the GFPZ policy effectively reduces pollution emissions among both upstream and downstream enterprises related to heavily polluting firms, thereby reinforcing the reliability and validity of our main findings.
3.3. Robustness Test
3.3.1. Dynamic Effect Test
This study conducts parallel trend and dynamic effect tests to validate the assumptions underlying the DID model employed in the baseline regression. According to the theoretical framework proposed by Angrist and Pischke [38], the key identifying assumption of the DID model is that the treatment and control groups exhibit parallel trends in the outcome variable—in this case, pollution emissions—before the implementation of the GFPZ policy.
To test this assumption, a symmetrical time window of four years before and after the policy implementation is adopted. Given that the sample period spans from 2013 to 2021, the maximum post-treatment observation window is constrained to four years. This design ensures a balanced comparison around the policy intervention point while minimizing sample attrition that may result from extending the time frame too far. As shown in Figure 2, the blue dots represent the estimated treatment effect in each year relative to the policy implementation. Crucially, there is no statistically significant difference in the pollution emission trends between the treatment and control groups before the policy implementation. Following the establishment of the pilot zones, however, the treatment group demonstrates a significant reduction in pollution emissions relative to the control group. These results confirm that the DID model satisfies the parallel trends assumption and supports the temporal causal interpretation of the policy effect.
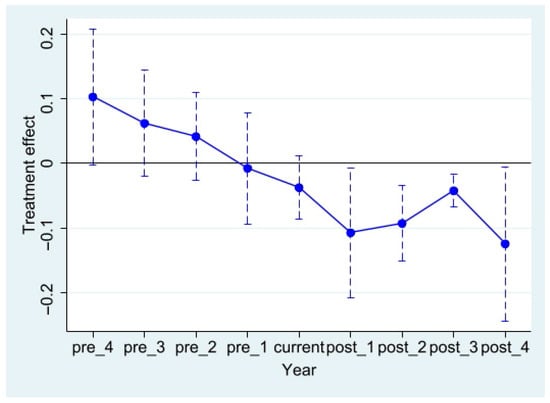
Figure 2.
Dynamic effect test.
3.3.2. Placebo Test
To rule out the influence of omitted variables and unobservable random factors, this study conducts a placebo test by randomly generating both the treatment group and the timing of the GFPZ policy. A placebo policy shock variable treatf × pollutionf is constructed and incorporated into the baseline regression model. This process is repeated 500 times.
Since the treatment assignment and timing are randomly generated, the estimated coefficients of the placebo variable are expected to center around zero, indicating that the artificially constructed policy shock should have no significant impact on pollution emissions among upstream and downstream enterprises of heavily polluting firms. As illustrated in Figure 3, the red dots represent the density distribution of the estimated coefficients from placebo policy assignments, while the smooth blue line represents the reference normal distribution. The distribution of the estimated coefficients under random assignment follows an approximately normal distribution centered around zero, and these estimates lie substantially distant from the actual coefficient observed in the baseline regression. This finding indicates that the randomly assigned pilot zone policy has no significant effect on pollution reduction, thereby confirming that the observed treatment effect in the baseline model is not attributable to random variation. These results lend further support to the causal interpretation of the GFPZ policy’s effect on pollution mitigation.
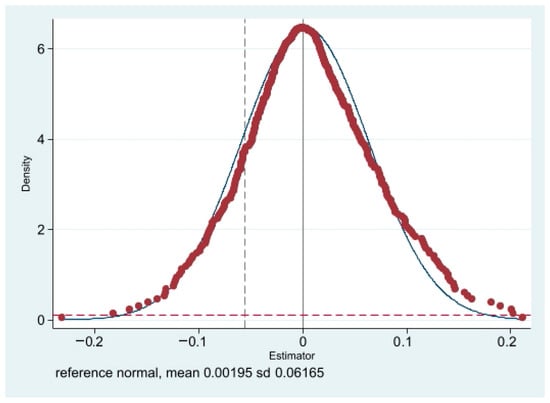
Figure 3.
Placebo test.
3.3.3. Anticipation Effects
To rule out the possibility that upstream and downstream enterprises of heavily polluting firms may have adjusted their business strategies in anticipation of the establishment of the GFPZ, this study conducts a placebo test on policy anticipation. Specifically, the policy implementation year is artificially shifted forward to 2016, 2015, and 2014, and interaction terms Treat × Pollution are constructed based on these lead years in Table 4 columns (1), (2) and (3), respectively. These placebo interaction terms are then included in the baseline regression model for empirical testing.
Table 4.
Anticipation effects.
According to the theory of policy anticipation, if firms adjust their behavior in expectation of the upcoming policy, the coefficients of the interaction terms at earlier time points should be significantly negative. However, the regression results indicate that none of the placebo interaction terms are statistically significant at the 10% level. This suggests that upstream and downstream firms of heavily polluting enterprises did not alter their pollution emission behaviors in advance of the actual policy implementation. Therefore, the concern of anticipatory effects distorting the baseline regression results can be effectively ruled out. These findings further validate the homogeneity assumption of the policy shock and reinforce the robustness of the causal inference.
3.3.4. Alternative Variable Measurement
To further test the robustness of the baseline results, this study decomposes the dependent variable into three alternative indicators of corporate pollution emissions: total nitrogen emissions, carbon emissions, and the logarithm of comprehensive water pollution equivalents. These variables are used to separately proxy pollution intensity and are successively substituted into the baseline regression equation. The regression results, reported in Columns (1) through (3) of Table 5, show that the coefficients on the interaction term Treat × Pollution remain significantly negative across all specifications. Moreover, the direction and magnitude of the effects are consistent with those observed in the baseline regression. These findings indicate that the GFPZ policy continues to exert a significant inhibitory effect on pollution emissions among upstream and downstream enterprises of heavily polluting firms, even when the measurement of pollution emissions is altered. This further demonstrates the robustness of the baseline results and confirms that the empirical findings are not sensitive to alternative measures of the dependent variable.
Table 5.
Alternative variable measurement.
3.3.5. Controlling for Other Concurrent Policies
In 2010, the National Development and Reform Commission (NDRC) launched the Low-Carbon City Pilot Program (LCPP), with the first batch of pilots covering five provinces—including Guangdong and Liaoning—and eight cities, such as Tianjin and Shenzhen. This policy aimed to promote regional green transformation and has been shown to influence corporate behavior [39]. To eliminate the potential confounding effects of the Low-Carbon City Pilot on the baseline regression estimates in this study, a policy dummy variable, Lowcarb, is introduced. It takes the value of 1 if a city is part of the Low-Carbon City Pilot, and 0 otherwise. This variable is included in the baseline regression model as a control. As reported in Column (1) of Table 6, the coefficient on the interaction term Treat × Pollution remains significantly negative at the 5% level, indicating that the Low-Carbon City Pilot policy does not materially affect the results of the baseline regression. This finding supports the robustness of the study’s main conclusions.
Table 6.
Controlling for other concurrent policies.
In 2013, the State Council issued the “Twelfth Five-Year Plan for Air Pollution Prevention and Control in Key Regions (APPC)”, designating areas such as Beijing–Tianjin–Hebei, the Yangtze River Delta, and the Pearl River Delta as key zones for air pollution control. To account for the potential confounding effects of this policy on the baseline regression results, this study introduces a policy dummy variable, Air, which equals 1 if the city is a designated pilot area and 0 otherwise. As shown in Column (2) of Table 6, the coefficient on the interaction term Treat × Pollution remains significantly negative at the 5% level, suggesting that the air pollution control policy does not confound the estimated effects of the GFPZ policy. This finding further strengthens the validity of the baseline results.
In 2011, the National Development and Reform Commission (NDRC) issued the Notice on Launching Pilot Programs for Carbon Emissions Trading (CETP), initiating the development of regional carbon markets, which may influence corporate pollution reduction behaviors. To control for the potential confounding effect of the carbon emissions trading pilot policy on the baseline regression results, this study constructs a dummy variable, Trade, which equals 1 if the focal firm is located in a city that is part of the carbon trading pilot in a given year, and 0 otherwise. As reported in Column (3) of Table 6, the coefficient on the interaction term Treat × Pollution remains significantly negative at the 5% level, indicating that the carbon trading pilot does not exert a significant confounding influence on the estimated effects of the GFPZ policy. Furthermore, Column (4) of Table 6 includes all three environmental policy controls. The coefficient on the key interaction term remains significantly negative at the 5% level, confirming that the emission reduction effect of the green finance pilot policy is independent of other concurrent environmental policies. These results reinforce the robustness and internal validity of the study’s main findings.
4. Further Analysis
4.1. Mechanism Analysis
Building upon the preceding analysis, which provides preliminary evidence that the GFPZ policy facilitates pollution reduction among both focal heavy-polluting firms and their upstream and downstream partners within pilot regions, the subsequent section of this study aims to further investigate the underlying mechanisms through which this policy exerts its environmental impact. Specifically, we seek to identify and empirically test the channels by which the green finance policy drives supply chain-wide pollution abatement among high-emission firms operating within the designated pilot zones.
4.1.1. The Porter Effect
The Porter Effect posits that appropriately designed environmental and green finance policies may incentivize firms to undertake green innovation, thereby offsetting compliance costs and ultimately improving productivity. Under the GFPZ framework, these incentives are expected to diffuse along supply chains through technological spillovers and policy-induced adjustments in firms’ expectations, potentially enhancing the green performance of upstream and downstream partners.
This study examines whether the GFPZ policy enhances the ESG performance of upstream and downstream enterprises linked to heavily polluting firms by employing Huazheng ESG ratings as a proxy. When ESG scores are used as the dependent variable in the baseline regression, results in Column (1) of Table 7 reveal a statistically insignificant coefficient on the treatment variable, suggesting that the policy does not materially influence ESG outcomes within these supply chains. Further analysis considers green total factor productivity (GTFP) as a potential transmission mechanism.
Table 7.
The Porter effect.
A GTFP index is constructed using the non-radial Slack-Based Measure–Malmquist–Luenberger (SBM-ML) approach. The measurement of input and output indicators follows established practice. First, factor inputs include labor, capital and energy. Labor input is proxied by the number of employees, capital input by the net value of fixed assets, and energy input by converting city-level industrial electricity consumption according to each firm’s share of urban employment. Second, expected output is represented by firms’ operating revenue. Third, non-expected output is measured by allocating city-level industrial sulfur dioxide emissions, industrial wastewater and industrial smoke and dust, based on the firm’s share of urban employment.
However, as indicated in Column (2) of Table 7, the treatment effect remains insignificant, providing no evidence that the policy fosters improvements in GTFP. Green technological innovation (Innovation) is also investigated, measured by the number of annual green invention patent applications, following the methodologies of Amore and Bennedsen, Wurloda and Noailly [40,41]. Results in Column (3) of Table 7 show a significantly negative coefficient at the 1% level, implying that the policy may, in fact, inhibit innovation efforts among supply chain firms connected to polluting enterprises. Collectively, these findings point to the absence of a short-term “Porter Effect” within the supply networks of heavily polluting industries. The GFPZ policy does not significantly enhance ESG performance, GTFP, or green innovation among affiliated upstream or downstream firms.
4.1.2. The Financing Penalty Effect
The GFPZ policy strengthens financing constraints on heavily polluting enterprises, which are subsequently required to reallocate internal resources toward environmental compliance and often respond through capacity contraction rather than technological upgrading. As these constraint-induced adjustments transmit through supply chain finance channels, upstream and downstream firms interpret them as signals of heightened operational risk and expected demand decline, leading to coordinated reductions in production and the emergence of policy spillover effects.
Given that the GFPZ policy directly targets heavily polluting enterprises within designated regions, any resulting adverse shocks to these firms’ financing activities or operational stability may propagate throughout their supply chains. This transmission occurs via supply chain finance channels, potentially intensifying financial constraints and reducing the financing scale available to upstream and downstream partners. To empirically test this mechanism, the study constructs a proxy for supply chain finance intensity by calculating the logarithmic frequency of relevant keywords—such as accounts receivable, prepayments, inventories, and general financial terms—extracted from the annual reports of listed firms. Firms are then categorized into high and low supply chain finance groups based on the median value of keyword frequency. An interaction term between this dummy variable (Finchain) and the policy treatment indicator is introduced to assess whether policy-induced shocks to focal firms extend to their supply chain affiliates.
To capture the scale of firm-level financing, the study replaces pollution emissions (Pe) in the baseline regression with the logarithm of the sum of annual short- and long-term borrowings (lnFS). As shown in Column (1) of Table 8, the coefficient on the interaction term is −0.2837 and statistically significant at the 5% level, indicating that firms with stronger supply chain ties are more adversely affected in terms of financing scale. To further assess financial constraints, the SA index proposed by Hadlock and Pierce is employed as an alternative dependent variable. Column (2) of Table 8 presents a significantly positive coefficient (0.0129) on the interaction term at the 1% level, suggesting that financing constraints among upstream and downstream firms are significantly exacerbated following the policy’s implementation [42].
Table 8.
The financing penalty effect.
Previous empirical results indicate that supply chain firms associated with heavily polluting focal enterprises fail to achieve emission reductions through improved ESG performance, higher green total factor productivity (GTFP), or enhanced green innovation. These findings can be attributed to the increased financing frictions experienced by focal firms in the aftermath of policy enforcement. Such constraints limit the capacity for short-term technological upgrades, compelling firms to meet environmental mandates through reduced production—a passive rather than proactive compliance strategy. In line with the signaling hypothesis, upstream and downstream partners closely linked to these focal firms are likely to interpret such financial strain as indicative of broader operational risks, leading them to adopt similar emission-reduction measures by cutting back production.
To validate this production-contraction mechanism, the study examines three financial performance indicators obtained from the CNRDS database: operating revenue (OPREV), business value added is measured by subtracting operating costs from operating revenue (ADD), and operating income (OI). Substituting these variables into the baseline model, regression outcomes in Columns (3) to (5) of Table 8 reveal significantly negative coefficients across all three indicators. Both operating revenue and value-added decline at the 1% significance level, while operating income is negatively affected at the 5% level. These results provide compelling evidence that upstream and downstream enterprises respond to GFPZ which induced shocks by reducing scale and capacity, rather than through efficiency improvements or innovation-led transitions.
In conclusion, the extended analysis confirms the existence of supply chain spillover effects in the transmission of GFPZ policy impacts. The signaling embedded in supply chain finance networks ensures that policy shocks to focal firms reverberate outward, indirectly constraining the financial flexibility of affiliated enterprises. Consequently, these constraints manifest in production cutbacks and capacity reductions, leading to passive emission reductions that arise not from strategic environmental upgrades but from economic necessity.
4.2. Heterogeneity Analysis
The transmission of GFPZ policy spillovers is unlikely to be uniform across supply chain firms, as differences in structural positions, technological capabilities, and external policy environments may condition firms’ responses to green finance incentives. To more comprehensively identify the channels through which policy effects propagate, this study focuses on three theoretically grounded sources of heterogeneity. First, upstream and downstream firms differ in market power, dependence on focal firms, and exposure to demand shocks, making supply chain direction a critical determinant of policy transmission. Second, firms’ pre-existing green foundations shape their ability to convert regulatory pressure into innovation-driven competitiveness. Third, government subsidies may either reinforce or dilute the incentives embedded in green finance policies, thereby altering the magnitude of spillover effects. Accordingly, the heterogeneity analysis proceeds along these three dimensions.
4.2.1. Direction of Transmission
The market position heterogeneity between upstream and downstream firms within supply chains significantly shapes the transmission of policy spillover effects. Supplier firms typically possess stronger monopolistic power and exhibit lower demand-price elasticity compared to customer firms [43]. Consequently, when focal firms reduce production capacity in response to policy pressures, suppliers face a dual shock—demand contraction and limited price adjustment flexibility. In contrast, customer firms, due to their proximity to end markets and higher procurement elasticity, can mitigate these risks through supplier substitution or diversification strategies.
Building on this theoretical framework, this study hypothesizes that upstream suppliers are more significantly impacted by GFPZ policy spillovers and are more likely to adopt passive emission reduction strategies. To test this hypothesis, the sample is divided into supplier firms (TAP = 1) and customer firms (TAP = 0), and interaction term regression analysis is employed. As shown in Column (1) of Table 9, the interaction term is significantly negative at the 5% level, indicating that the policy’s spillover effect has a stronger impact on upstream suppliers. This effect can be attributed to suppliers’ greater dependency on transactions with focal firms and their limited ability to diversify risks, making them more susceptible to the cascading effects of production cuts and amplifying the policy-induced emission reduction.
Table 9.
Heterogeneity analysis.
4.2.2. Green Foundation
Green Total Factor Productivity (GTFP) is a key determinant of a firm’s ability to internalize and respond to policy incentives. Firms with a robust green foundation are better equipped to mitigate short-term policy shocks, leveraging accumulated environmental patents, certified management systems, and other proprietary resources to convert institutional constraints into drivers of green innovation. In contrast, firms with weaker green foundations are constrained by resource rigidity, often resorting to passive production cuts to meet short-term compliance goals, thereby failing to achieve technological advancements in emission reduction.
Building on this premise, this study hypothesizes that firms with higher GTFP are more likely to experience stronger spillover effects from green finance policies. The non-radial SBM-ML index is used to measure GTFP at the firm level, and firms are categorized into low-GTFP (TAP = 0) and high-GTFP (TAP = 1) groups based on the sample mean. As reported in Column (2) of Table 9, the coefficient on the interaction term is significantly negative at the 1% level. This finding indicates that firms with higher GTFP are better positioned to absorb policy signals through the supply chain. By leveraging their technological capabilities, these firms convert regulatory pressure into green competitiveness, thereby enhancing the emission reduction spillover effects of the policy.
4.2.3. Government Subsidy
Government subsidies play a pivotal role in facilitating corporate pollution reduction. While moderate subsidies can enhance policy incentives by internalizing environmental externalities, subsidies that are higher than average may distort market signals and dampen firms’ intrinsic motivation for technological innovation [44]. When subsidies exceed market equilibrium, their substitution effect may counteract the regulatory constraints imposed by green finance policies, thereby undermining coordination of pollution reduction efforts across the supply chain. This study hypothesizes that government subsidies hinder the spillover effects of green finance policies on pollution abatement. Based on the average subsidy received by upstream and downstream firms of the focal enterprises, the sample is divided into low-subsidy (TAP = 0) and high-subsidy (TAP = 1) groups. As shown in Column (3) of Table 9, the coefficient of the interaction term is significantly positive at the 5% level, suggesting that larger subsidies diminish the effectiveness of the GFPZ policy in reducing pollution. Specifically, high subsidy levels reduce firms’ sensitivity to differentiated financial resource allocation, leading them to depend more on fiscal support than on market mechanisms to meet compliance targets.
Furthermore, government subsidies may crowd out green technological innovation within heavily polluting enterprises [45]. This not only stifles the innovation capacity of subsidized firms but also generates negative spillover effects on the green innovation activities of their supply chain partners, thereby diminishing the overall effectiveness of pollution reduction measures across the supply chain.
5. Conclusions and Recommendations
5.1. Research Findings
This study utilizes China’s Green Finance Pilot Zones (GFPZs) as a quasi-natural experiment to examine the impact of green finance policies on pollution reduction across supply chains. The analysis yields several critical insights: (1) GFPZ significantly promotes pollution reduction, not only within heavily polluting firms but also among their upstream and downstream partners. This spillover effect is robust across multiple empirical tests, including PSM, placebo tests, alternative variable specifications, and additional robustness checks. (2) The pollution abatement effect primarily operates through a financing penalty mechanism, where the policy tightens financing constraints, reducing external financing scale and compelling firms to scale back operations to achieve emissions reductions. (3) Spillover effects on upstream and downstream pollution abatement are heterogeneous, with stronger effects observed among firms with higher green foundations and those in upstream positions within the supply chain. Additionally, the study finds that larger amount of government subsidies may weaken the spillover effects of green finance policies on pollution reduction.
5.2. Policy Implications
Based on the empirical findings presented above, this study proposes the following policy recommendations: First, the supply chain transmission effect of the GFPZ should be fully leveraged through differentiated governance strategies for upstream and downstream firms. The establishment of GFPZ not only contributes to pollution reduction among local enterprises, but also induces similar improvements among upstream and downstream firms, demonstrating a strong transmission effect along supply chains. Specifically, upstream suppliers bear a disproportionately stronger policy spillover pressure due to their heavier reliance on focal firms and limited capacity to adjust prices or substitute customers. Policymakers should therefore design position-sensitive policy tools, such as providing capacity-building programs, phased compliance arrangements, or temporary risk-sharing mechanisms for upstream firms to prevent excessive production contraction. Expanding the number of pilot zones where appropriate would help amplify the policy’s spillover effects and extend them to a broader set of regions. Furthermore, firms across the supply chain should be encouraged to engage in collaborative efforts for green development, thereby fostering synergies in the transition toward a sustainable industrial system.
Second, green financial instruments should be tailored to the heterogeneous financing constraints faced by upstream and downstream actors during the transition. In tightening regulatory environments, uniform credit restrictions may unintentionally amplify operational risks for upstream firms, which are more exposed to demand contraction following focal firms’ production adjustments. To mitigate this, financial institutions should provide tailored financial products that address the specific needs of high-carbon industries undergoing green transitions. These could include flexible loan terms, lower interest rates for firms demonstrating clear progress in reducing emissions, and targeted green credit facilities that support industry-specific transformation efforts.
Third, the targeted effectiveness of the GFPZ can be further enhanced by addressing policy heterogeneity observed in the spillover effects. Our findings indicate that firms with stronger green capabilities and those located in upstream positions benefit more significantly from the policy, while government subsidies that are higher than average may undermine the intended outcomes. As such, policy instruments should be designed to incentivize firms to enhance their internal green capacities and better align with the objectives of green finance. In particular, tailored support should be provided to downstream firms to encourage proactive participation in pollution reduction. While policy support is vital, overly generous subsidies may distort firm behavior and undermine the intended environmental outcomes of green finance regulation.
Author Contributions
Conceptualization, Z.W. and X.L.; Data curation, X.L.; Formal analysis, Z.W. and X.L.; Methodology, Z.W.; Project administration, Z.W.; Visualization, Z.W.; Writing—original draft, X.L.; Writing—review and editing, Z.W. and X.L. All authors have read and agreed to the published version of the manuscript.
Funding
This research was funded by the Beijing Social Science Foundation Project, grant number 24GLC063.
Institutional Review Board Statement
Not applicable.
Informed Consent Statement
Not applicable.
Data Availability Statement
The original contributions presented in this study are included in the article. Further inquiries can be directed to the corresponding author.
Conflicts of Interest
The authors declare no conflicts of interest.
References
- Wang, Z.; He, A.; Nan, S. Green Finance Reform, Multifaceted Collaborative Governance, and Corporate Greenwashing: Evidence from Double/Debiased Machine Learning Method. J. Environ. Manag. 2025, 383, 125466. [Google Scholar] [CrossRef] [PubMed]
- Du, M.; Zhang, J.; Hou, X. Decarbonization like China: How Does Green Finance Reform and Innovation Enhance Carbon Emission Efficiency? J. Environ. Manag. 2025, 376, 124331. [Google Scholar] [CrossRef] [PubMed]
- Yu, C.-H.; Wu, X.; Zhang, D.; Chen, S.; Zhao, J. Demand for Green Finance: Resolving Financing Constraints on Green Innovation in China. Energy Policy 2021, 153, 112255. [Google Scholar] [CrossRef]
- Liu, S.; Wang, Y. Green Innovation Effect of Pilot Zones for Green Finance Reform: Evidence of Quasi Natural Experiment. Technol. Forecast. Soc. Change 2023, 186, 122079. [Google Scholar] [CrossRef]
- Huang, H.; Mbanyele, W.; Wang, F.; Zhang, C. Nudging Corporate Environmental Responsibility through Green Finance? Quasi-Natural Experimental Evidence from China. J. Bus. Res. 2023, 167, 114147. [Google Scholar] [CrossRef]
- Zhao, X.; Benkraiem, R.; Abedin, M.Z.; Zhou, S. The Charm of Green Finance: Can Green Finance Reduce Corporate Carbon Emissions? Energy Econ. 2024, 134, 107574. [Google Scholar] [CrossRef]
- Cheng, Z.; Kai, Z.; Zhu, S. Does Green Finance Regulation Improve Renewable Energy Utilization? Evidence from Energy Consumption Efficiency. Renew. Energy 2023, 208, 63–75. [Google Scholar] [CrossRef]
- Liu, J.Y.; Xia, Y.; Fan, Y.; Lin, S.-M.; Wu, J. Assessment of a Green Credit Policy Aimed at Energy-Intensive Industries in China Based on a Financial CGE Model. J. Clean. Prod. 2017, 163, 293–302. [Google Scholar] [CrossRef]
- Wang, Y.; Lei, X.; Long, R.; Zhao, J. Green Credit, Financial Constraint, and Capital Investment: Evidence from China’s Energy-Intensive Enterprises. Environ. Manag. 2020, 66, 10591071. [Google Scholar] [CrossRef]
- Xu, X.; Li, J. Asymmetric Impacts of the Policy and Development of Green Credit on the Debt Financing Cost and Maturity of Different Types of Enterprises in China. J. Clean. Prod. 2020, 264, 121574. [Google Scholar] [CrossRef]
- Zhao, L.; Wang, D.; Wang, X.; Zhang, Z. Impact of Green Finance on Total Factor Productivity of Heavily Polluting Enterprises: Evidence from Green Finance Reform and Innovation Pilot Zone. Econ. Anal. Policy 2023, 79, 765–785. [Google Scholar] [CrossRef]
- Acemoglu, D.; Aghion, P.; Bursztyn, L.; Hemous, D. The Environment and Directed Technical Change. Am. Econ. Rev. 2012, 102, 131–166. [Google Scholar] [CrossRef]
- Grossman, G.M.; Helpman, E.; Redding, S.J. When Tariffs Disrupt Global Supply Chains. Am. Econ. Rev. 2024, 114, 988–1029. [Google Scholar] [CrossRef]
- Shi, J.; Yu, C.; Li, Y.; Wang, T. Does Green Financial Policy Affect the Debt-Financing Cost of Heavy-Polluting Enterprises? An Empirical Evidence Based on Chinese Pilot Zones for Green Finance Reform and Innovations. Technol. Forecast. Soc. Change 2022, 179, 121678. [Google Scholar] [CrossRef]
- El Ouardighi, F.; Sim, J.E.; Kim, B. Pollution Accumulation and Abatement Policy in a Supply Chain. Eur. J. Oper. Res. 2016, 248, 982–996. [Google Scholar] [CrossRef]
- Dai, R.; Liang, H.; Ng, L. Socially Responsible Corporate Customers. J. Financ. Econ. 2021, 142, 598–626. [Google Scholar] [CrossRef]
- Steinbrunner, P.R. Boon or bane? On Productivity and Environmental Regulation. Environ. Econ. Policy Stud. 2022, 24, 365–396. [Google Scholar] [CrossRef]
- Franco, C.; Marin, G. The Effect of Within-Sector, Upstream and Downstream Environmental Taxes on Innovation and Productivity. Environ. Resour. Econ. 2017, 66, 261–291. [Google Scholar] [CrossRef]
- Chakraborty, P.; Chatterjee, C. Does Environmental Regulation Indirectly Induce Upstream Innovation? New Evidence from India. Res. Policy 2017, 46, 939–955. [Google Scholar] [CrossRef]
- Sanyal, P.; Ghosh, S. Product Market Competition and Upstream Innovation: Evidence from the U.S. Electricity Market Deregulation. Rev. Econ. Stat. 2013, 95, 237–254. [Google Scholar] [CrossRef]
- Leary, M.T.; Roberts, M.R. Do Peer Firms Affect Corporate Financial Policy? J. Financ. 2014, 69, 139–178. [Google Scholar] [CrossRef]
- Bimber, B.; Flanagin, A.J.; Stohl, C. Reconceptualizing Collective Action in the Contemporary Media Environment. Commun. Theory 2005, 15, 365–388. [Google Scholar] [CrossRef]
- Li, L.; Wang, Z.; Chen, L.; Zhang, Y. Supply Chain Collaboration and Supply Chain Finance Adoption: The Moderating Role of Information Transparency and Transaction Dependence. Supply Chain Manag. 2023, 28, 710–723. [Google Scholar] [CrossRef]
- Levinson, A. Technology, International Trade, and Pollution from US Manufacturing. Am. Econ. Rev. 2009, 99, 2177–2192. [Google Scholar] [CrossRef]
- Porter, M. America’s Green Strategy. Sci. Am. 1991, 264, 168. [Google Scholar] [CrossRef]
- Jaffe, A.B.; Palmer, K. Environmental Regulation and Innovation: A Panel Data Study. Rev. Econ. Stat. 1997, 79, 610–619. [Google Scholar] [CrossRef]
- Hamamoto, M. Environmental Regulation and the Productivity of Japanese Manufacturing Industries. Resour. Energy Econ. 2006, 28, 299–312. [Google Scholar] [CrossRef]
- Lanoie, P.; Patry, M.; Lajeunesse, R. Environmental Regulation and Productivity: Testing the Porter Hypothesis. J. Productiv. Anal. 2008, 30, 121–128. [Google Scholar] [CrossRef]
- Chen, Y.; Yao, Z.; Zhong, K. Do Environmental Regulations of Carbon Emissions and Air Pollution Foster Green Technology Innovation? Evidence from China’s Prefecture-Level Cities. J. Clean. Prod. 2022, 350, 131537. [Google Scholar] [CrossRef]
- Zhao, A.; Wang, J.; Sun, Z.; Guan, H. Environmental Taxes, Technology Innovation Quality and Firm Performance in China—A Test of Effects Based on the Porter Hypothesis. Econ. Anal. Policy 2022, 74, 309–325. [Google Scholar] [CrossRef]
- Li, G.; Wei, W. Financial Development, Openness, Innovation, Carbon Emissions, and Economic Growth in China. Energy Econ. 2021, 97, 105194. [Google Scholar] [CrossRef]
- Mohsin, M.; Taghizadeh-Hesary, F.; Iqbal, N.; Saydaliev, H.B. The Role of Technological Progress and Renewable Energy Deployment in Green Economic Growth. Renew. Energy 2022, 190, 777–787. [Google Scholar] [CrossRef]
- Liu, Y.; Xi, B.; Wang, G. The Impact of Corporate Environmental Responsibility on Financial Performance—Based on Chinese Listed Companies. Environ. Sci. Pollut. Res. 2021, 28, 7840–7853. [Google Scholar] [CrossRef]
- Zhang, S.; Wu, Z.; Wang, Y.; Hao, Y. Fostering Green Development with Green Finance: An Empirical Study on the Environmental Effect of Green Credit Policy in China. J. Environ. Manag. 2021, 296, 113159. [Google Scholar] [CrossRef]
- Deng, X.; Li, L. Promoting or Inhibiting? The Impact of Environmental Regulation on Corporate Financial Performance—An Empirical Analysis Based on China. Int. J. Environ. Res. Public Health 2020, 17, 3828. [Google Scholar] [CrossRef] [PubMed]
- Isaksson, O.H.D.; Simeth, M.; Seifert, R.W. Knowledge Spillovers in the Supply Chain: Evidence from the High Tech Sectors. Res. Pol. 2016, 45, 699–706. [Google Scholar] [CrossRef]
- Hainmueller, J. Entropy Balancing for Causal Effects: A Multivariate Reweighting Method to Produce Balanced Samples in Observational Studies. Polit. Anal. 2012, 20, 25–46. [Google Scholar] [CrossRef]
- Angrist, J.D.; Pischke, J.-S. Mostly Harmless Econometrics: An Empiricist’s Companion. Eur. Rev. Agric. Econ. 2008. [Google Scholar] [CrossRef]
- Shao, W.; Yang, K.; Chen, Z. Does the Market-Oriented Environmental Regulation Promote Firms’ Technological Innovation? Evidence from A-share Listed Companies in China. Environ. Dev. Sustain. 2025, 27, 1145–1174. [Google Scholar] [CrossRef]
- Amore, M.D.; Bennedsen, M. Corporate Governance and Green Innovation. J. Environ. Econ. Manag. 2016, 75, 54–72. [Google Scholar] [CrossRef]
- Wurlod, J.-D.; Noailly, J. The Impact of Green Innovation on Energy Intensity: An Empirical Analysis for 14 Industrial Sectors in OECD Countries. Energy Econ. 2018, 71, 47–61. [Google Scholar] [CrossRef]
- Hadlock, C.J.; Pierce, J.R. New Evidence on Measuring Financial Constraints: Moving Beyond the KZ Index. Rev. Financ. Stud. 2010, 23, 1909–1940. [Google Scholar] [CrossRef]
- Fisman, R.; Raturi, M. Does Competition Encourage Credit Provision? Evidence from African Trade Credit Relationships. Rev. Econ. Stat. 2004, 86, 345–352. [Google Scholar] [CrossRef]
- Shleifer, A.; Vishny, R.W. Politicians and Firms. Q. J. Econ. 1994, 109, 995–1025. [Google Scholar] [CrossRef]
- Roychowdhury, S. Earnings Management through Real Activities Manipulation. J. Account. Econ. 2006, 42, 335–370. [Google Scholar] [CrossRef]
Disclaimer/Publisher’s Note: The statements, opinions and data contained in all publications are solely those of the individual author(s) and contributor(s) and not of MDPI and/or the editor(s). MDPI and/or the editor(s) disclaim responsibility for any injury to people or property resulting from any ideas, methods, instructions or products referred to in the content. |
© 2025 by the authors. Licensee MDPI, Basel, Switzerland. This article is an open access article distributed under the terms and conditions of the Creative Commons Attribution (CC BY) license (https://creativecommons.org/licenses/by/4.0/).