


Abstract
Under the global imperative for climate action and sustainable development, accelerating the transition towards high-penetration renewable energy systems remains a universal priority, central to achieving the United Nations Sustainable Development Goals. However, the inherent uncertainty and volatility of renewables such as wind and solar PV pose fundamental challenges to power system stability and flexibility worldwide. These challenges, if unaddressed, could significantly hinder the reliable and sustainable integration of clean energy on a global scale. While pumped storage hydropower (PSH) represents a mature, large-scale solution for enhancing system regulation capabilities, existing planning methodologies frequently suffer from critical limitations. These included oversimplified scenario representations—particularly the inadequate consideration of escalating extreme weather events under climate change—and computational inefficiencies in solving large-scale stochastic optimization models. These shortcomings ultimately constrained the practical value of such approaches for advancing sustainable energy planning and building climate-resilient power infrastructures globally. To address these issues, this paper proposed a bi-level stochastic planning method integrating scenario optimization and improved Benders decomposition. Specifically, an integrated framework combining affinity propagation clustering and isolation forest algorithms was developed to generate a comprehensive scenario set that covered both typical and anomalous operating days, thereby capturing a wider range of system uncertainties. A two-layer stochastic optimization model was established, aiming to minimize total investment and operational costs while ensuring system reliability and renewable integration. The upper layer determined PSH capacity, while the lower layer simulated multi-scenario system operations. To efficiently solve the model, the Benders decomposition algorithm was enhanced through the introduction of a heuristic feasible cut generation mechanism, which strengthened subproblem feasibility and accelerated convergence. Simulation results demonstrated that the proposed method achieved a 96.7% annual renewable energy integration rate and completely avoided load shedding events with minimal investment cost, verifying its effectiveness, economic efficiency, and enhanced adaptability to diverse operational scenarios.
1. Introduction
Under the “carbon peak and carbon neutrality” strategy, building a new power system with renewable energy at its core became the paramount direction of China’s energy transition. Achieving these dual carbon goals necessitated a profound restructuring of the energy sector, characterized by the large-scale integration of wind, solar, and hydro power. This transition aimed not only for high penetration rates but also for leveraging the complementary synergies among these variable sources to form a robust and efficient energy supply matrix. However, the inherent randomness and volatility of renewable generation posed formidable challenges to power system stability. These energy sources were non-dispatchable and often created substantial peak-shaving pressure when connecting to transmission-constrained systems [1]. While conventional hydropower offered some regulation capability, its flexibility was limited. Pumped hydro energy storage, as the most technologically mature and economically viable large-scale storage solution, represented a key technical approach to enhancing system flexibility and supporting the reliable integration of high renewable penetration [2].
The quest for optimal energy storage configuration has spurred extensive research. Current research on pumped storage planning predominantly employed optimization models based on operations research methods. For instance, reference [3] used stochastic optimization for coordinated capacity planning of hybrid renewable energy systems with pumped storage. Reference [4] proposed an integrated transmission expansion planning model incorporating pumped storage, solved using multi-objective optimization. Reference [5] jointly optimized capacity allocation and operational strategies considering renewable uncertainty and multi-timescale operational characteristics. Beyond pumped storage, recent studies explored various other storage technologies and optimization methodologies. Reference [6] conducted a comparative life-cycle optimization of hybrid battery/hydrogen storage systems, highlighting the economic and technological trade-offs. Similarly, reference [7] demonstrated the significant enhancement in peak-shaving capability achieved by coupling coal-fired power plants with a compressed carbon dioxide energy storage system. For operational coordination, reference [8] proposed an improved PSO algorithm to optimize the charging/discharging strategies of battery storage paired with PV systems. On the algorithmic front, machine learning techniques were increasingly applied to address system complexities. Reference [9] and reference [10] both utilized the Isolation Forest algorithm, the former for anomaly detection in big data and the latter for mineral prospectivity mapping, showcasing its efficacy in identifying rare and critical patterns—a capability highly relevant for detecting extreme operational scenarios in power systems.
Nevertheless, existing studies on pumped storage often suffered from two critical gaps. Firstly, their scenario construction was often oversimplified, failing to systematically incorporate low-probability, high-impact events like extreme weather. Prevailing methods like K-means clustering [11] or scenario reduction techniques [12] frequently neglect these anomalous conditions, resulting in planning solutions with inadequate real-world adaptability. Although reference [13] attempted to include anomalous scenarios using K-means clustering, the requirement for a predetermined cluster number introduced subjectivity that compromised objectivity and representativeness [14]. Secondly, the resulting optimization models constituted large-scale mixed-integer linear programming problems with numerous variables and constraints, posing high computational difficulty [15]. While decomposition algorithms like Benders decomposition were widely adopted [16], and references [17,18,19] incorporated regularization strategies and cut plane enhancement techniques to address convergence and infeasibility issues, their effectiveness in complex power system planning with a comprehensive scenario set required further validation and improvement.
This research was situated within the critical context of sustainable energy transition. By advancing the planning methodologies for pumped storage hydropower—a key enabler for renewable energy integration—this work directly contributed to building resilient and low-carbon power systems. The proposed method aimed to enhance grid reliability and renewable energy utilization, thereby supporting the overarching goals of sustainable development and climate change mitigation, which were core to the scope of Sustainability.
To address these challenges, this paper proposed a novel pumped storage planning method that integrated advanced scenario optimization with an improved Benders decomposition algorithm. A key contribution lay in developing a combined “clustering-anomaly detection-re-clustering” framework. Unlike traditional methods that required a pre-defined cluster number, the study first employed Affinity Propagation (AP) clustering to autonomously extract typical daily operational scenarios. Then, inspired by the application of anomaly detection in reference [9] and reference [10], it utilized the Isolation Forest algorithm to systematically identify potential anomalous operating days from the residual data, effectively capturing extreme weather events. These anomalous days were subsequently re-integrated into the scenario set via a final clustering step, yielding a comprehensive and representative scenario set that fully characterized system operational uncertainty.
This paper employed a two-layer programming model. The outer layer handled pumped storage capacity investment decisions with an economic objective, while the inner layer employed a unique “max–min” framework: the max layer generated a complete spectrum of scenario types through scenario combination optimization to achieve maximum scenario difference, and the min layer aimed to minimize operational costs, renewable energy curtailment, and load shedding, while considering constraints such as line power flow, unit security, renewable integration, and power supply reliability. Constructed based on a DC power flow framework, this model was solved using an enhanced Benders decomposition algorithm where the outer layer served as the master problem and each scenario in the inner layer constituted a subproblem. To address the convergence challenges faced by traditional Benders decomposition when solving such complex problems, this study introduced a heuristic feasible cut updating mechanism that significantly strengthened the feasibility handling capability of the subproblems, thereby improving the overall convergence performance of the algorithm. Case studies verified that the improved solution method maintained economic efficiency while effectively enhancing the system’s adaptability to diverse operational scenarios, significantly improving power supply reliability and renewable energy integration capability.
2. Scenario Combination Optimization Method
To accurately identify the complex operational patterns in power systems formed by factors such as load, photovoltaic, and wind power, a scenario optimization method considering both normal and abnormal days was proposed. Abnormal days were typically caused by extreme weather conditions like typhoons, blizzards, prolonged rain, or windless periods. Their generation profiles for wind and solar power showed significant differences compared to normal days. Although accounting for a small proportion of the year, these days were crucial for enhancing system resilience against extreme events.
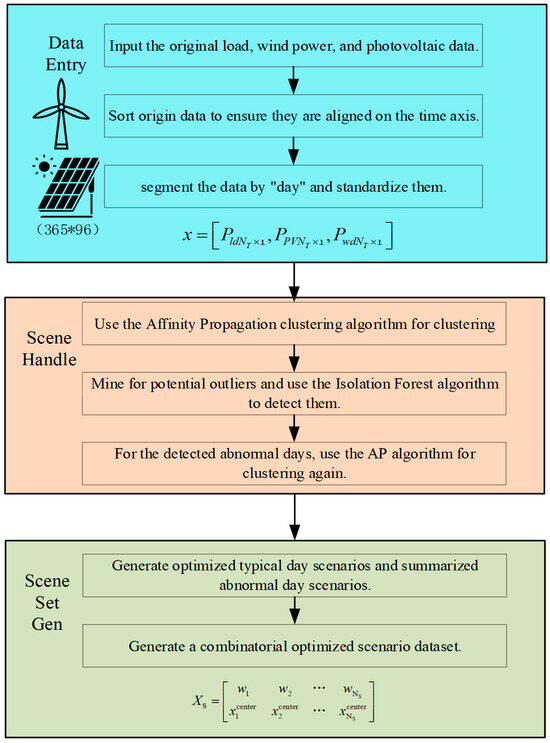
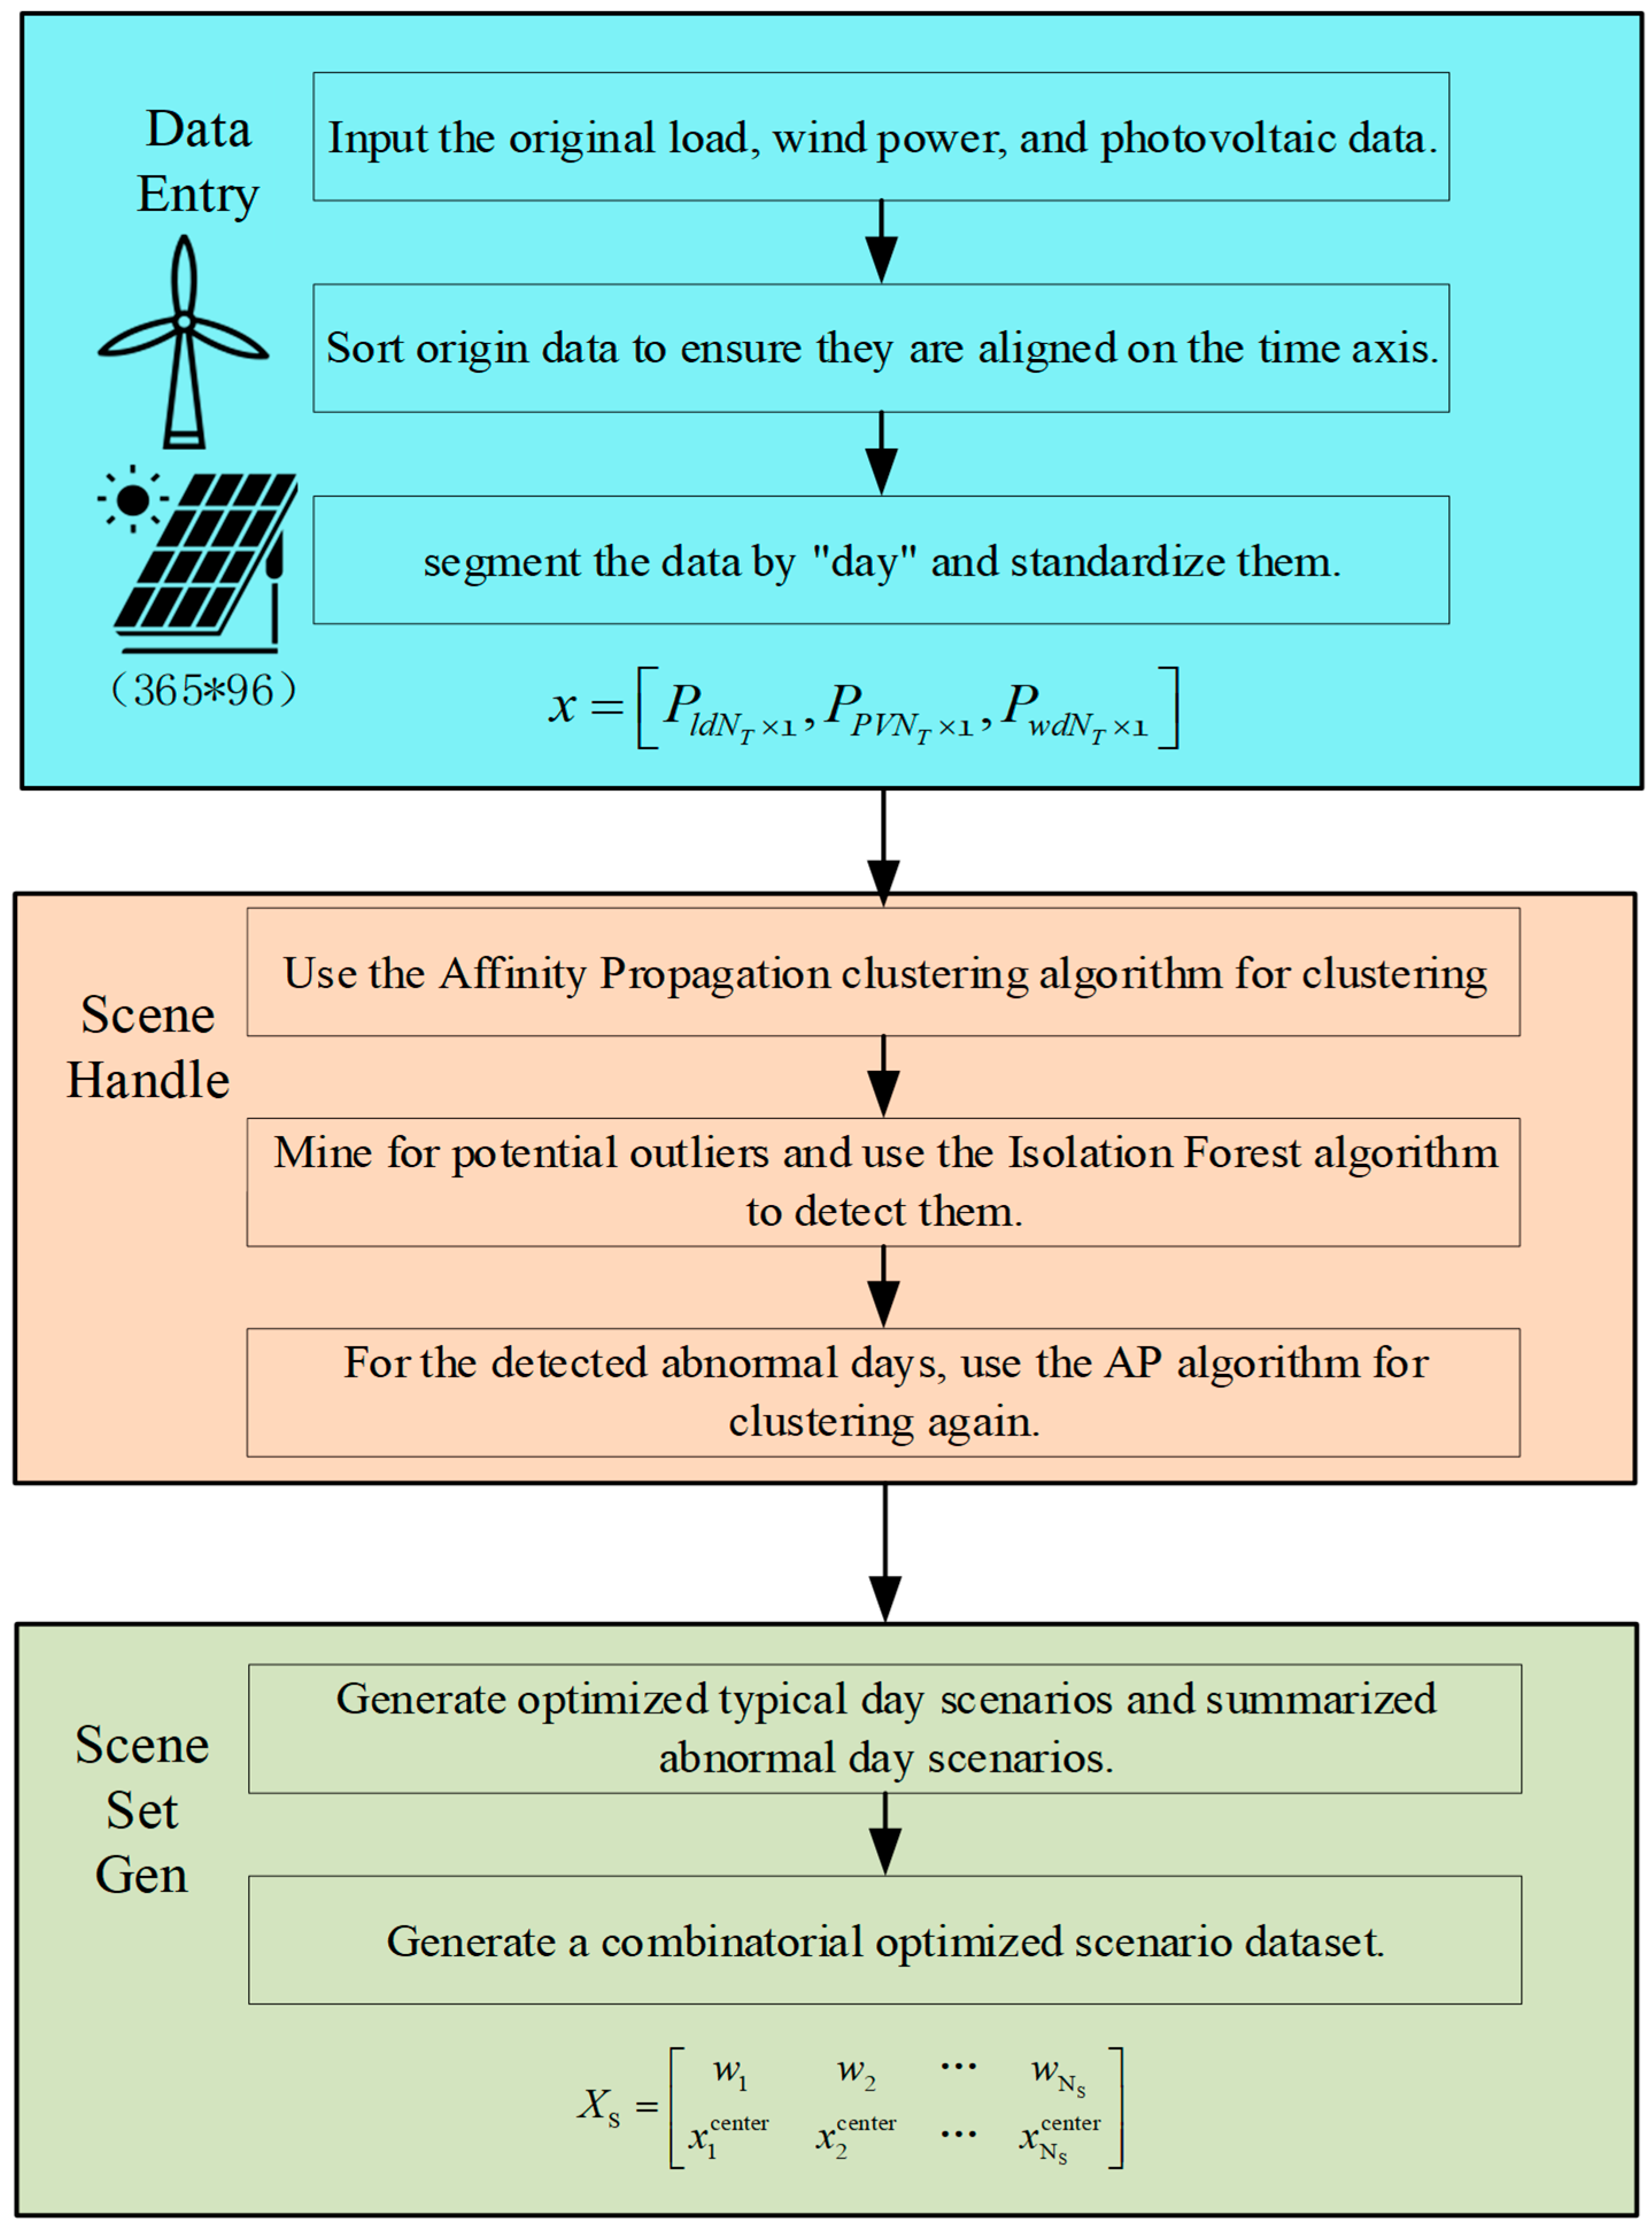
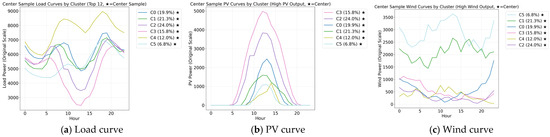
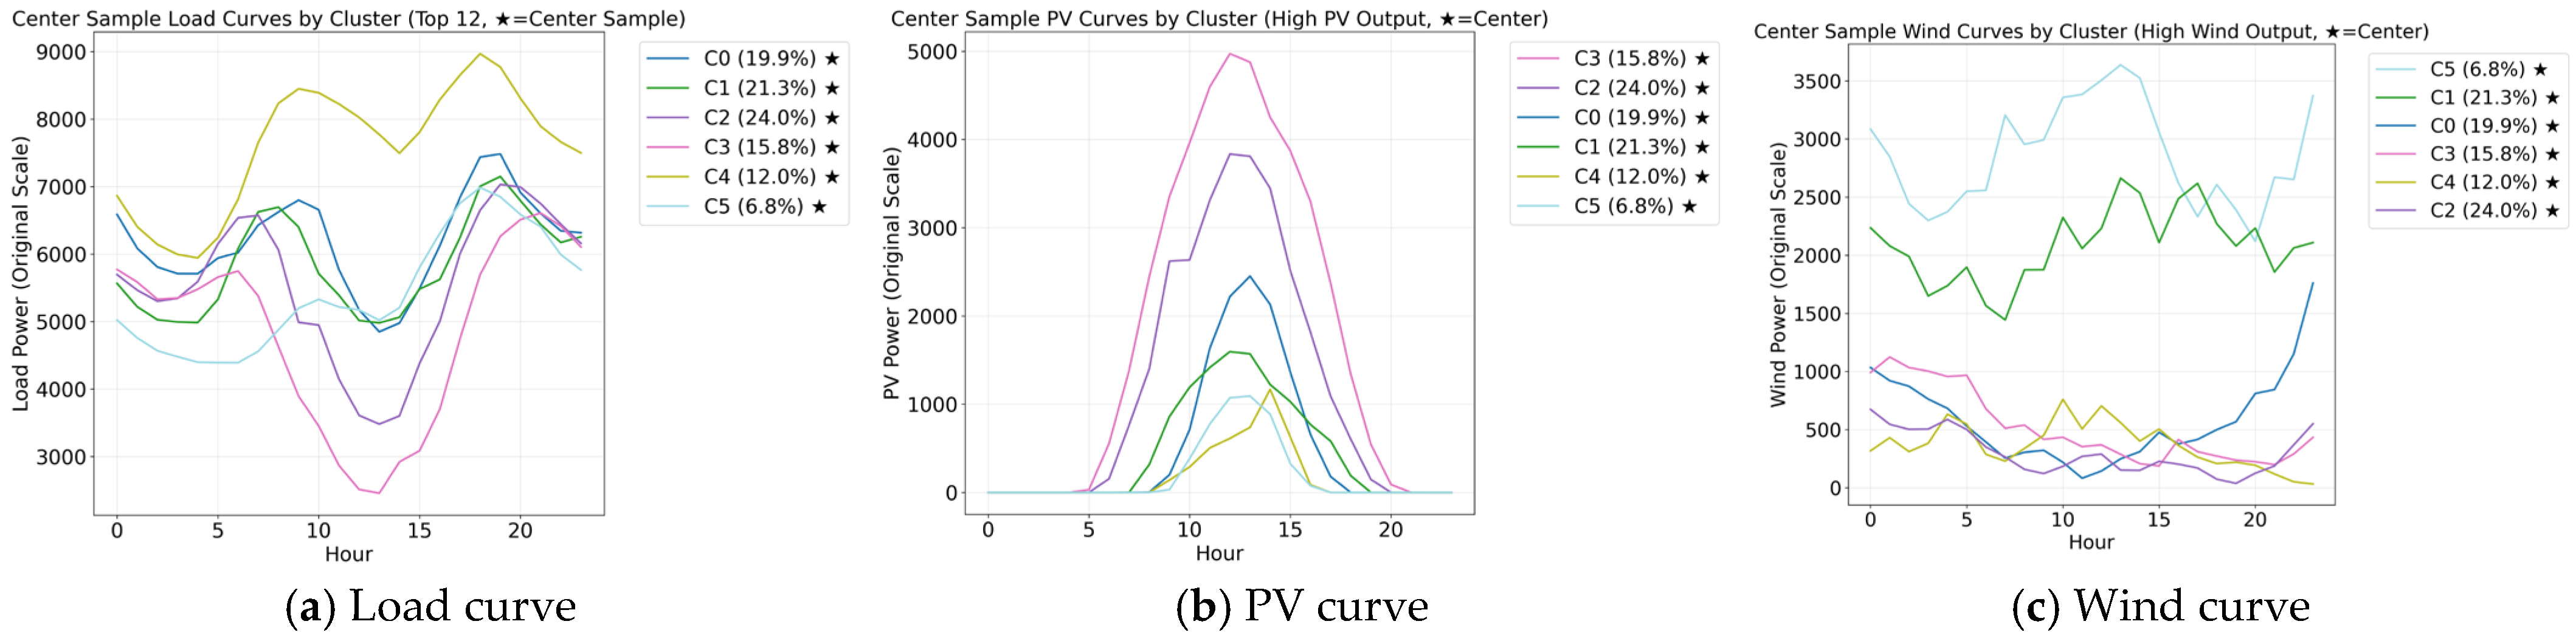
The proposed scenario combination optimization method primarily involved three steps: data preparation and preprocessing, initial clustering and outlier detection, and data integration and re-clustering. Finally, a combined and optimized scenario dataset was established. This dataset was used for solving the pumped storage planning model in power systems with a high penetration of renewable energy. The optimization framework is shown in Figure 1. The original data for the three types of data were shown in Figure 2. The utility-scale photovoltaic power, wind power, and load power profiles were obtained from 366 days of data for the year 2024, provided by Elia, the Belgian electricity grid operator [20].
Figure 1.
Scenario Combination Optimization Framework.
Figure 2.
Three Types of Origin Data.
2.1. Data Preparation and Preprocessing
To transform the raw, multi-source time-series data into a structured and standardized feature matrix, the input net load, utility-scale photovoltaic, and wind power data were first precisely sorted by timestamp. Missing or anomalous values were processed to ensure complete synchronization of the three power curves on the time axis.
Subsequently, the three types of data for each day were combined into a high-dimensional feature vector. Assuming each data type had NT sampling points per day, the daily net load, utility-scale photovoltaic, and wind power data could be represented as vectors, as shown in Equations (1)–(3), respectively.
Equations (1)–(3) were concatenated along the feature dimension to form a comprehensive feature vector . This vector fully describes the operational characteristics of the day, as shown in Equation (4):
Through this method, a raw dataset containing was ultimately transformed into a sample matrix composed of daily samples . Its dimensions were × × 3. Each sample x represented a point in the data space, characterizing the combined daily operational scenario of wind, solar, and load.
Significant differences existed in the numerical ranges and fluctuation amplitudes of net load, photovoltaic, and wind power. If used directly in clustering algorithms, features with larger numerical values (such as load) would dominate the process. This would compromise the objectivity of the clustering results. To eliminate the influence of different feature dimensions, Z-score standardization was applied to process the data, as shown in Equation (5):
2.2. Initial Clustering and Isolation Forest Detection
All preprocessed daily samples were input into the Affinity Propagation (AP) clustering model. The model automatically determined the optimal number of clusters and assigned each daily sample to a cluster, forming preliminary typical daily scenarios.
AP clustering is an algorithm based on message passing between data points. It iteratively exchanges information among all daily sample vectors and eventually selects the exemplars that best represent the group as the cluster centers (typical days) [21]. The main steps are as follows:
Initialization: All availabilities were initialized to 0.
Responsibility Update: The availabilities and similarities were used to calculate and update all responsibilities .
Availability Update: The responsibilities were used to calculate and update all availabilities .
Exemplar Selection: For each sample , the data point that maximized the sum + was selected as its exemplar. All data points sharing the same exemplar formed one cluster. The process terminated if the convergence criterion was met; otherwise, it returned to Step 2.
The methods for calculating similarity , responsibility , and availability were given in Equations (6)–(8):
Similarity measured the suitability of sample to serve as the exemplar for sample . It was calculated using the negative squared Euclidean distance. A larger value indicated greater similarity between the operational scenarios of the two samples.
Responsibility represented the message sent from sample to candidate exemplar . It reflected the cumulative evaluation of serving as the representative day for the category of , considering all other possible candidate exemplars.
Availability represented the message sent from candidate exemplar to sample . It indicated the general suitability of as an exemplar, how much support it received from other samples—making it appropriate for xi to choose it as a representative.
For the initial clustering results, the Isolation Forest algorithm was independently applied to each typical daily scenario cluster. It evaluated the local density deviation of each sample within the cluster relative to its neighboring samples. If the anomaly score of a sample vector exceeded a predefined threshold, it indicated a significant deviation in its core pattern. Consequently, such a sample was identified as an outlier [22,23].
2.3. Data Integration and Re-Clustering
All identified outlier daily sample vectors were concatenated into a separate outlier sample matrix. To further investigate the inherent patterns within these anomalies, the AP clustering algorithm was applied again to this outlier dataset. This process grouped the originally scattered abnormal occurrences into several interpretable abnormal daily scenarios.
For each initial cluster after the removal of outliers, the central sample was computed. These central samples were then combined with the central samples from the abnormal daily scenarios to form a complete set of scenarios. The probability of occurrence for each scenario was represented by a mixture weight w, calculated as the proportion of samples in that scenario cluster relative to the total number of samples. Thus, the sum of all probabilities weighted equaled 1. The combined central samples of the scenarios and their corresponding weights formed the optimized scenario dataset, as shown in Equation (9):
3. Bi-Level Pumped Storage Planning Model
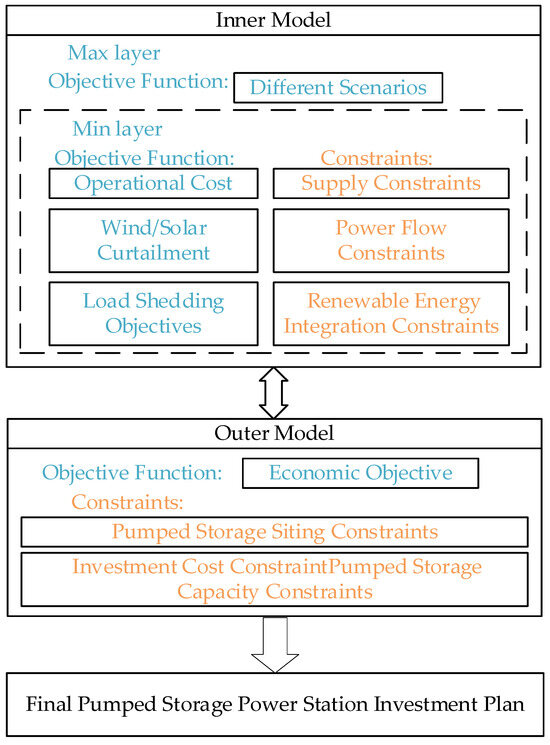
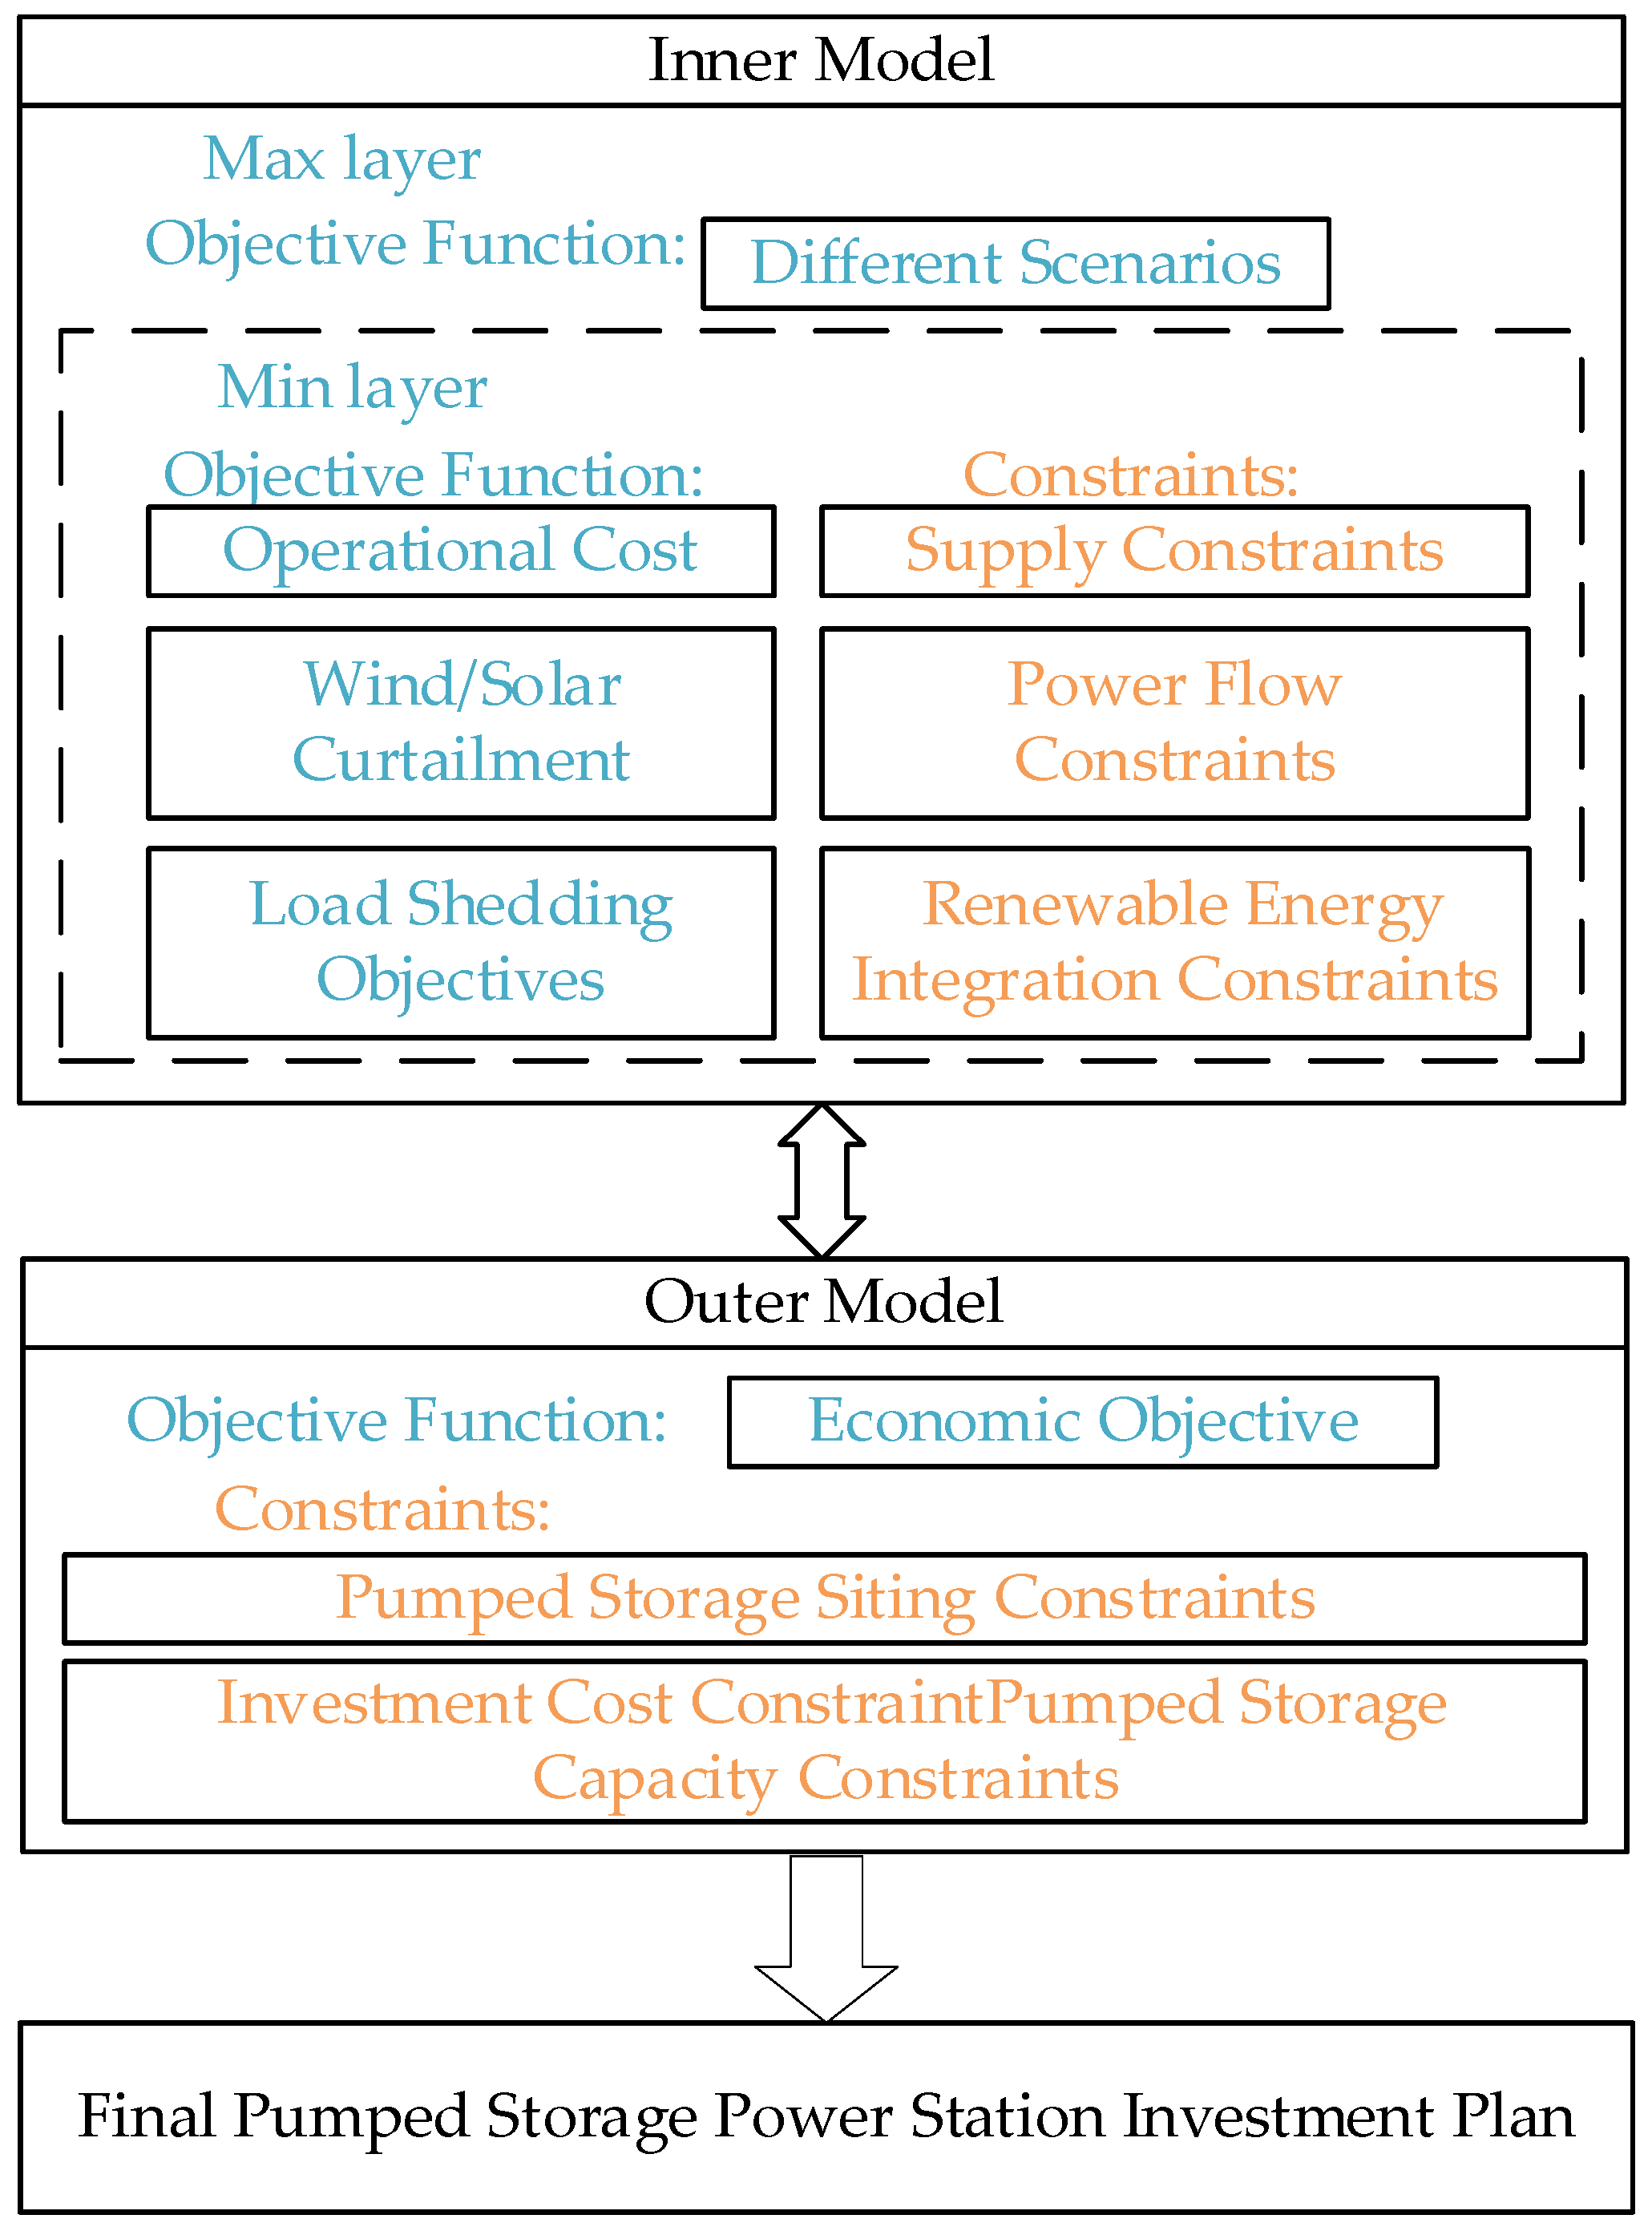
The bi-level planning model established in this study was structured as illustrated in Figure 3. The outer model served as the master problem, aiming to minimize the total investment and expected operational costs, with its decisions constrained by investment considerations such as pumped storage power station capacity and siting. The model was solved using an improved Benders decomposition algorithm, which dynamically incorporated optimality cuts and feasibility cuts into the master problem based on feedback from the lower-level subproblems. This iterative process progressively refined the solution toward the optimal planning scheme, with convergence controlled by strict upper and lower bound error criteria.
Figure 3.
Two-layer planning model for pumped storage.
The inner model featured a two-layer inner structure dedicated to scenario generation and operational simulation. In the Max layer, a comprehensive set of scenarios encompassing all typical and extreme conditions was generated through scenario combination optimization, with the primary objective of maximizing scenario dissimilarity. The subsequent Min layer then performed detailed power system operational simulations for each generated scenario, aiming to minimize operational costs, renewable energy curtailment, and load shedding. These simulations had to satisfy a complete set of operational constraints, including line power flow, generator operating limits, renewable energy integration, and power supply reliability requirements. Through this integrated approach, the model effectively evaluated the adaptability and robustness of the upper-level investment decisions across diverse operating conditions.
3.1. Master Problem
3.1.1. Objective Function
The objective of the master problem was to minimize the total cost, as shown in Equation (10):
3.1.2. Constraints
The investment constraints included the pumped storage capacity constraint and the siting constraint, as specified in Equations (11) and (12), respectively:
Benders decomposition constraints included optimality cuts and feasibility cuts. When all subproblems were solvable, an optimality cut was added for each scenario. If a subproblem was infeasible, a feasibility cut was introduced to eliminate the investment decisions that led to the infeasibility.
For feasibility cuts, the conventional approach combined cuts using Farkas multipliers. However, this method was nearly impractical for the planning problem addressed in this paper. The subproblems incorporated numerous and complex power system operational constraints, each potentially generating Farkas multipliers. Identifying the key constraints—those actually causing the infeasibility—proved extremely difficult, making it challenging to form an effective constraint combination. Furthermore, extracting Farkas multipliers from mixed integer programming (MIP) models was inherently unstable [24].
Therefore, this paper improved the Benders decomposition process by adopting a heuristic algorithm to update feasibility cuts. These cuts were expressed in the form of increased investment. The constraints for optimality cuts and feasibility cuts were shown in Equations (13) and (14), respectively:
3.1.3. Convergence Condition
The premise for the convergence judgment was that all subproblems across scenarios had feasible solutions. In the k iteration, the convergence of the algorithm was evaluated by calculating the error between the upper bound and the lower bound . This included both relative error and absolute error, as specified in Equations (15) and (16). Convergence was considered achieved when either error fell below a predefined tolerance. In this paper, was set to 1 × 10⁻⁶ and was set to $1000.
The upper bound and lower bound were obtained by solving the subproblems and the master problem, respectively. Their calculation methods were given in Equations (17) and (18):
The upper bound represented the actual weighted total cost of the system under the planning scheme provided by the master problem. This value corresponded to the total cost of a feasible solution and was therefore necessarily greater than or equal to the global optimal cost. The objective of the algorithm was to iteratively identify an investment plan that minimized this upper bound cost.
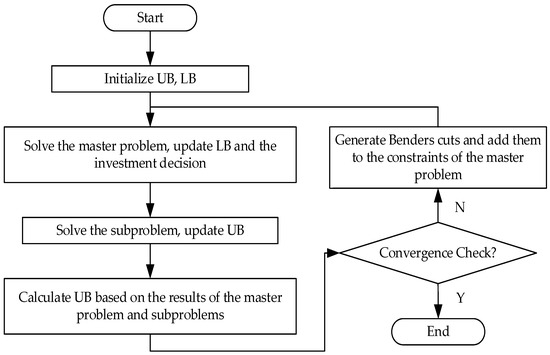
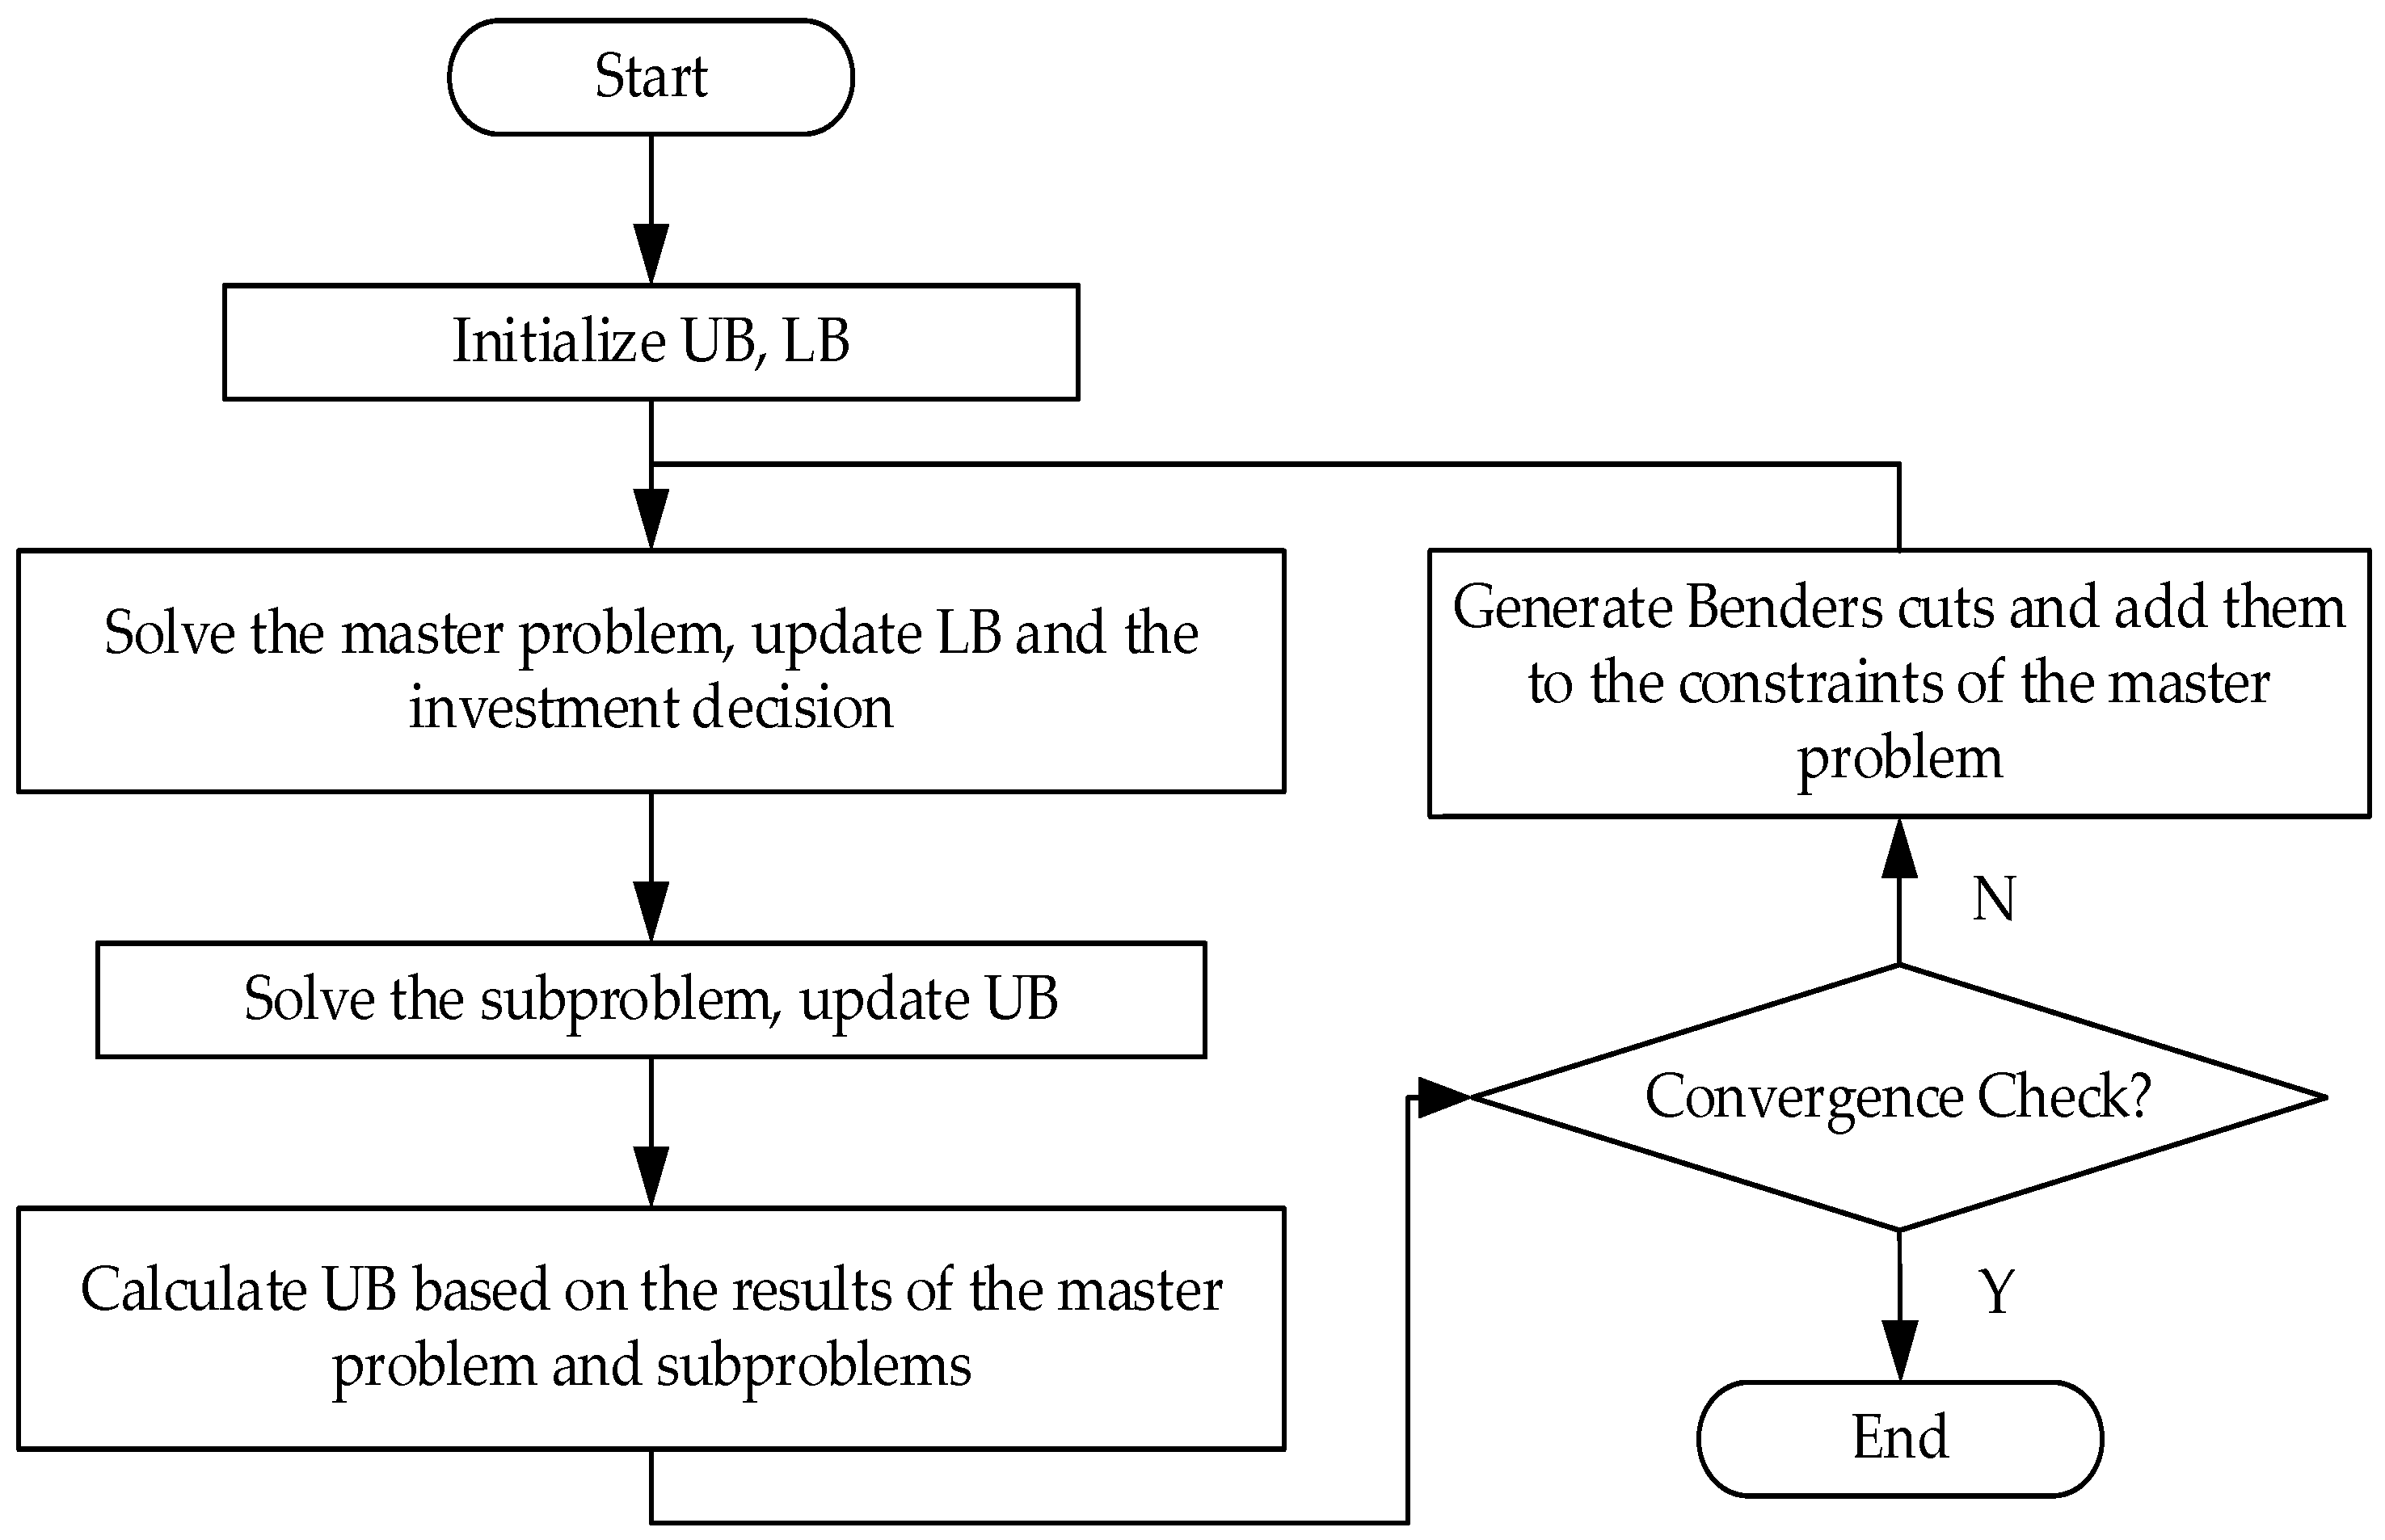
The lower bound indicated the theoretically achievable minimum total cost of the system based on the operational cost information expressed by the Benders cuts. As the number of iterations increased, more Benders cuts were added, leading to increasingly accurate estimates of the future operational costs. Consequently, the value of monotonically non-decreasing and progressively approached the true optimal solution. The iterative process was illustrated in Figure 4:
Figure 4.
Flowchart of the Improved Benders Decomposition Solution Process.
3.2. Subproblem
3.2.1. Subproblem’s Objective Function
The objective of the subproblem was to minimize the comprehensive cost under each scenario. This cost incorporated penalties for renewable energy curtailment and load shedding, while the operational costs of renewable energy sources were neglected, as shown in Equation (19):
3.2.2. Subproblem’s Constraints
The operational simulation constraints represented by the subproblem included power flow constraints of the grid, security and stability operation constraints for various types of generation units, as well as constraints related to renewable energy integration and power supply reliability.
The nodal power balance constraint was given by Equation (20):
Constraints for conventional units were given by Equations (21) and (22). These included the upper and lower output limits and ramping constraints for thermal power units. The daily energy generation constraint for hydropower units was also included, as shown in Equation (23).
In Equations (21) and (23): and represented the lower and upper output limits of thermal unit i, respectively; denoted the ramping power limit of thermal unit ; indicated the total daily energy generation of hydropower unit .
The operational constraints for the pumped storage units were given by Equations (24)–(29):
Equation (24) described the dynamic energy balance constraint of the reservoir. Equation (25) represented the reservoir capacity constraint, which was also the source of Benders dual variables. Equation (26) enforced the consistency of the initial and final reservoir energy levels to ensure the storage energy remained identical at the beginning and end of the day, simulating a sustainable daily cycling operation. Equation (27) defined the pumping and generating power constraints. Equation (28) imposed the mutual exclusivity constraint between operating modes. Equation (29) specified the daily start-up limit constraints for pumping and generating.
The renewable energy integration constraint and the power supply reliability constraint were given by Equations (30) and (31), respectively:
4. Analysis of Simulation Results
The simulation tests were implemented on a hardware platform equipped with an Intel(R) Core(TM) i5-10200H CPU and an NVIDIA GeForce GTX1650 GPU. A modified IEEE 9-bus system was used for simulation validation. This system incorporated multiple conventional generators and load buses, making it suitable for evaluating the planning effectiveness of pumped storage hydropower plants.
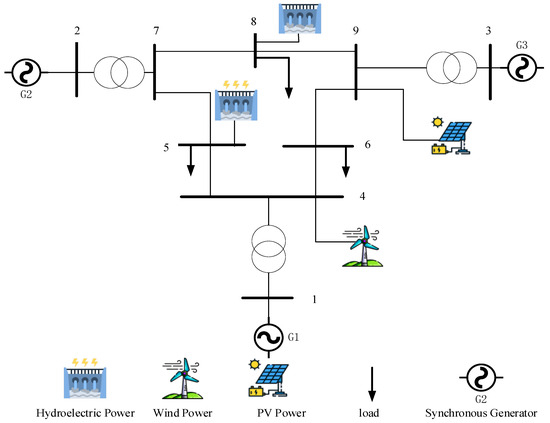
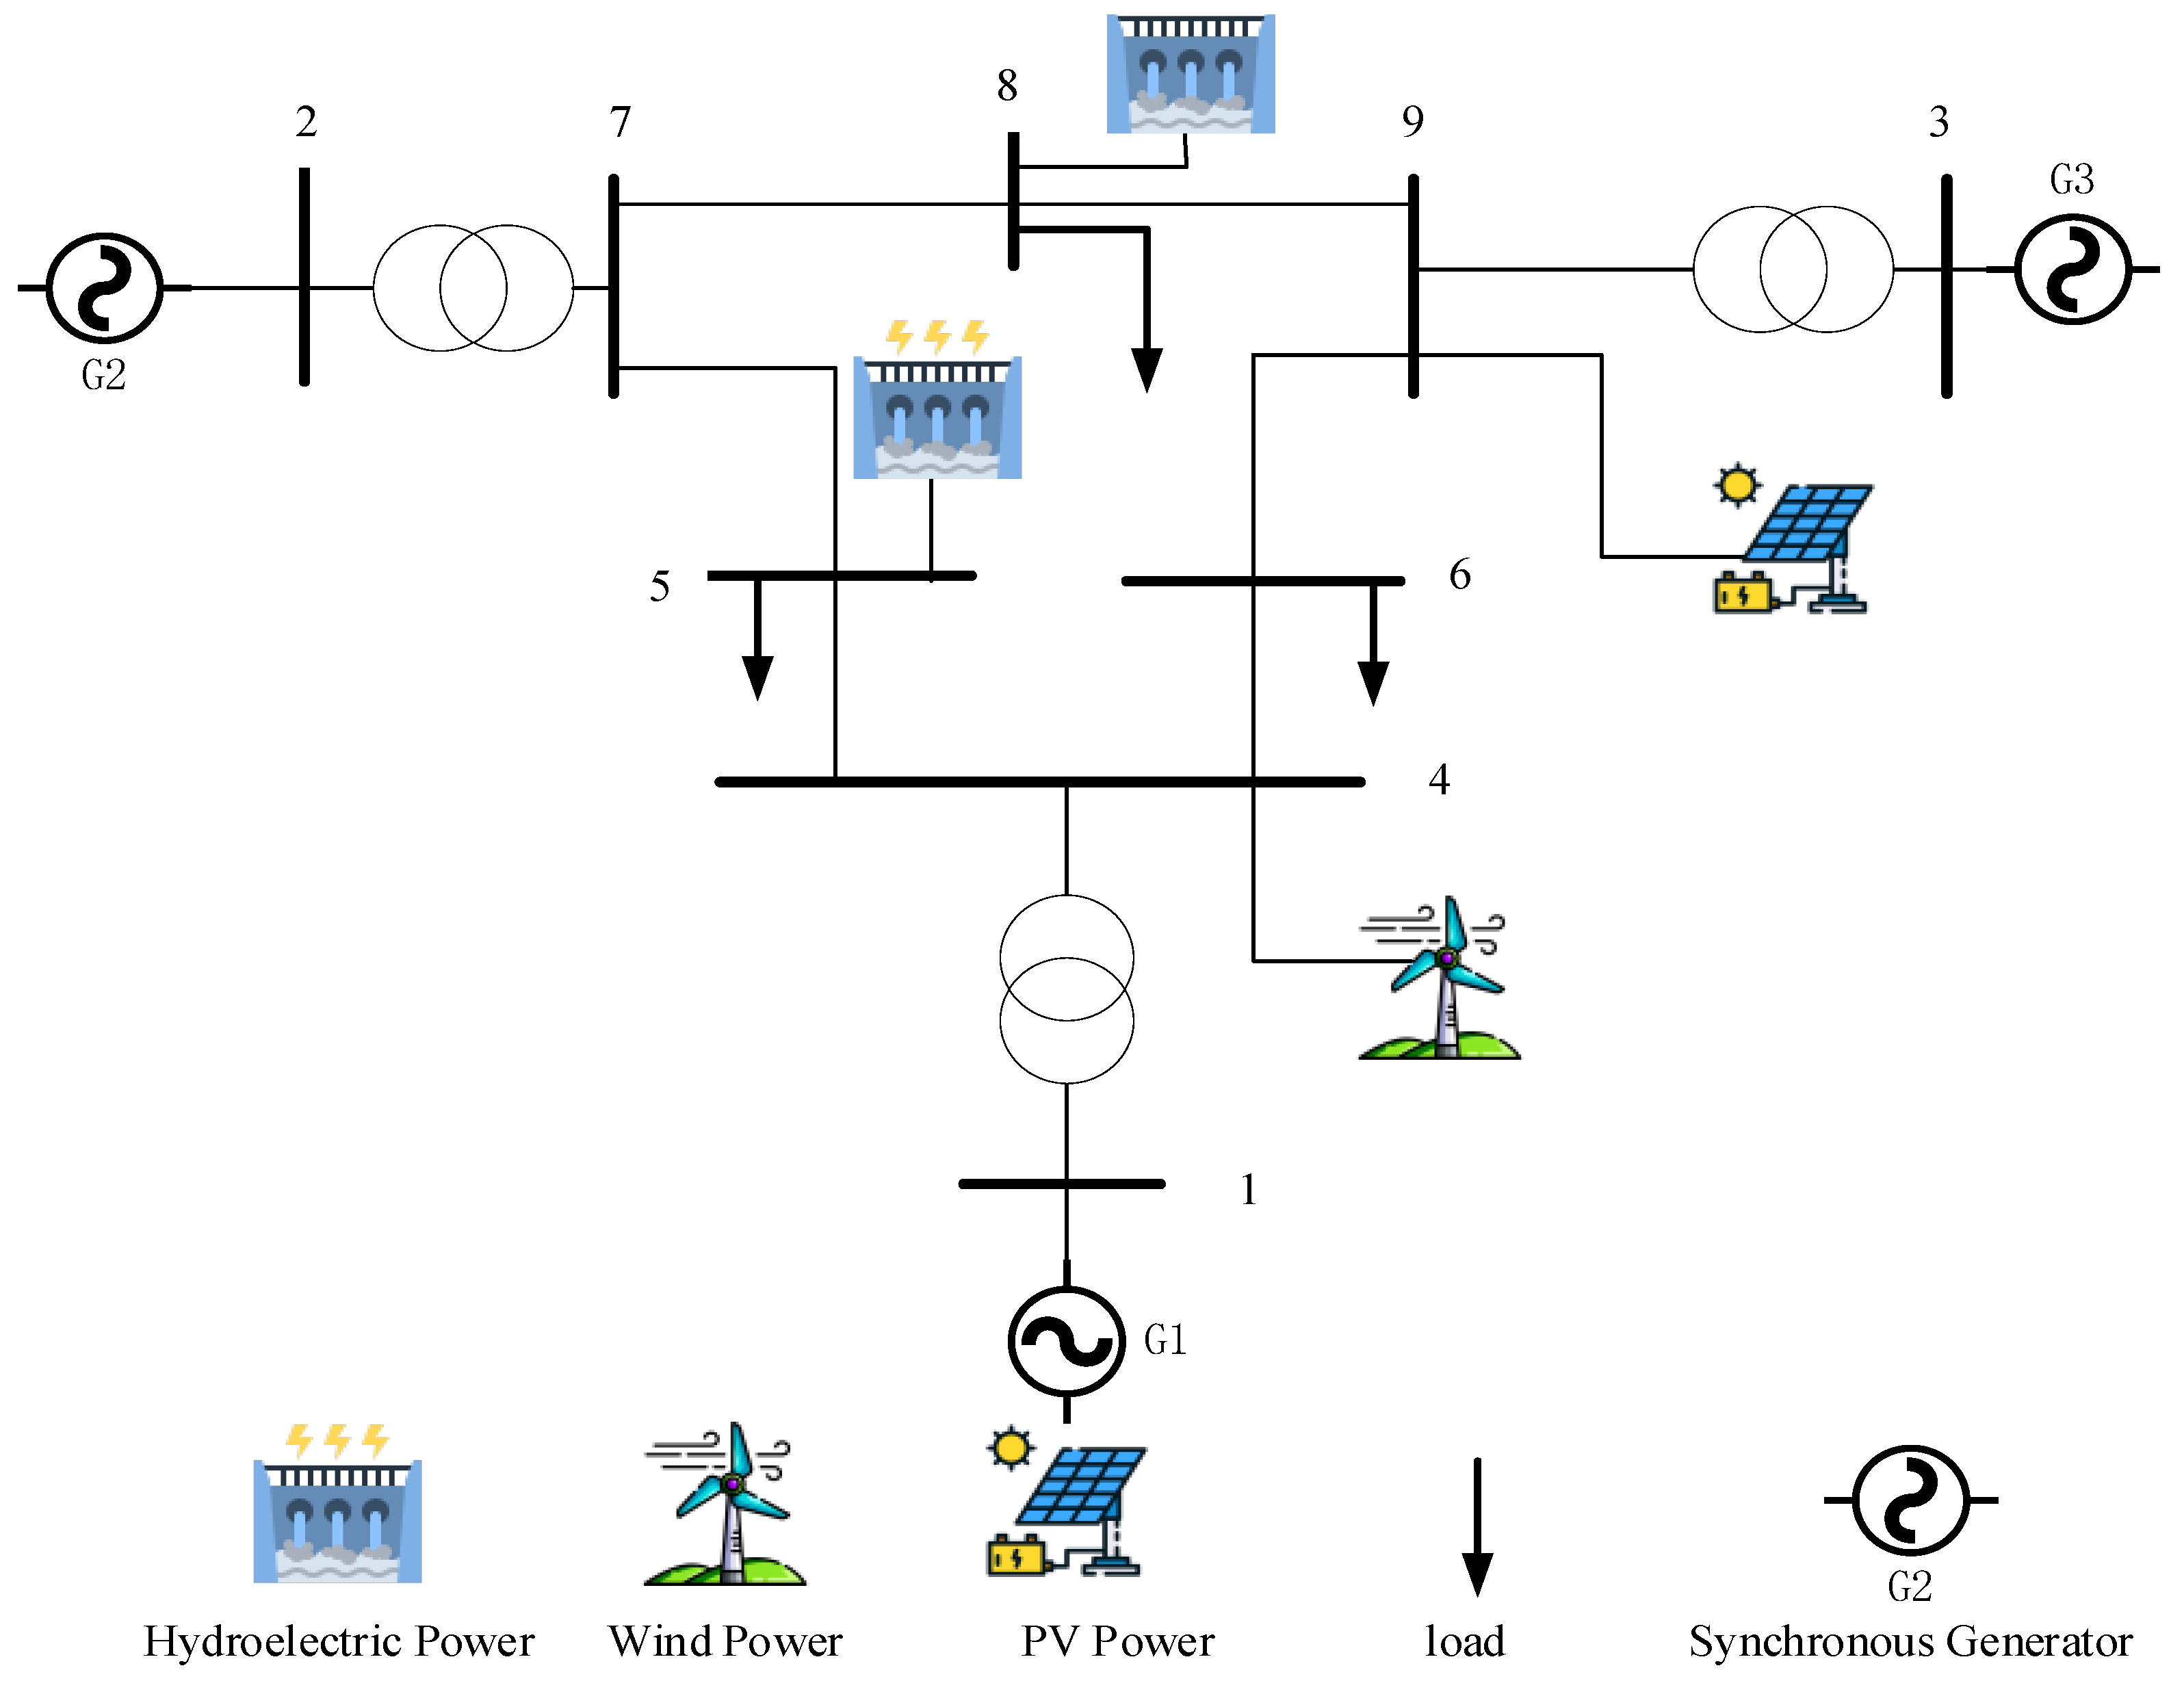
Based on the IEEE 9-bus system, wind power, photovoltaic power, and conventional hydropower were added. The modified test case was shown in Figure 5. All buses B1 to B9 were assumed to be candidate nodes for pumped storage construction.
Figure 5.
Modified IEEE 9-Bus System.
The utility-scale photovoltaic power, wind power, and load power profiles were obtained from 366 days of data for the year 2024 provided by Elia, the Belgian electricity grid operator based in Brussels, Belgium. The original data had a resolution of 15 min. Through sampling and scaling, data with an hourly resolution was generated. The centralized photovoltaic and wind power penetration rates, defined by peak ratios, were set at 60% and 40%, respectively. The load in this region exhibited typical dual-peak characteristics in the morning and evening. In this paper, the selected outlier ratio threshold was 0.06, and the preference parameter for outlier clustering was −70.
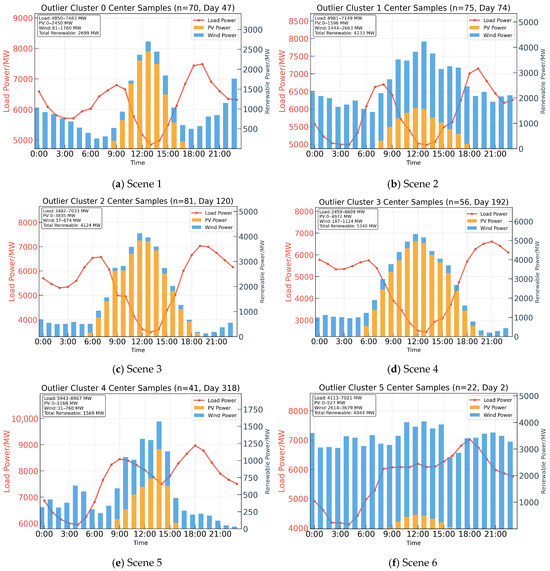
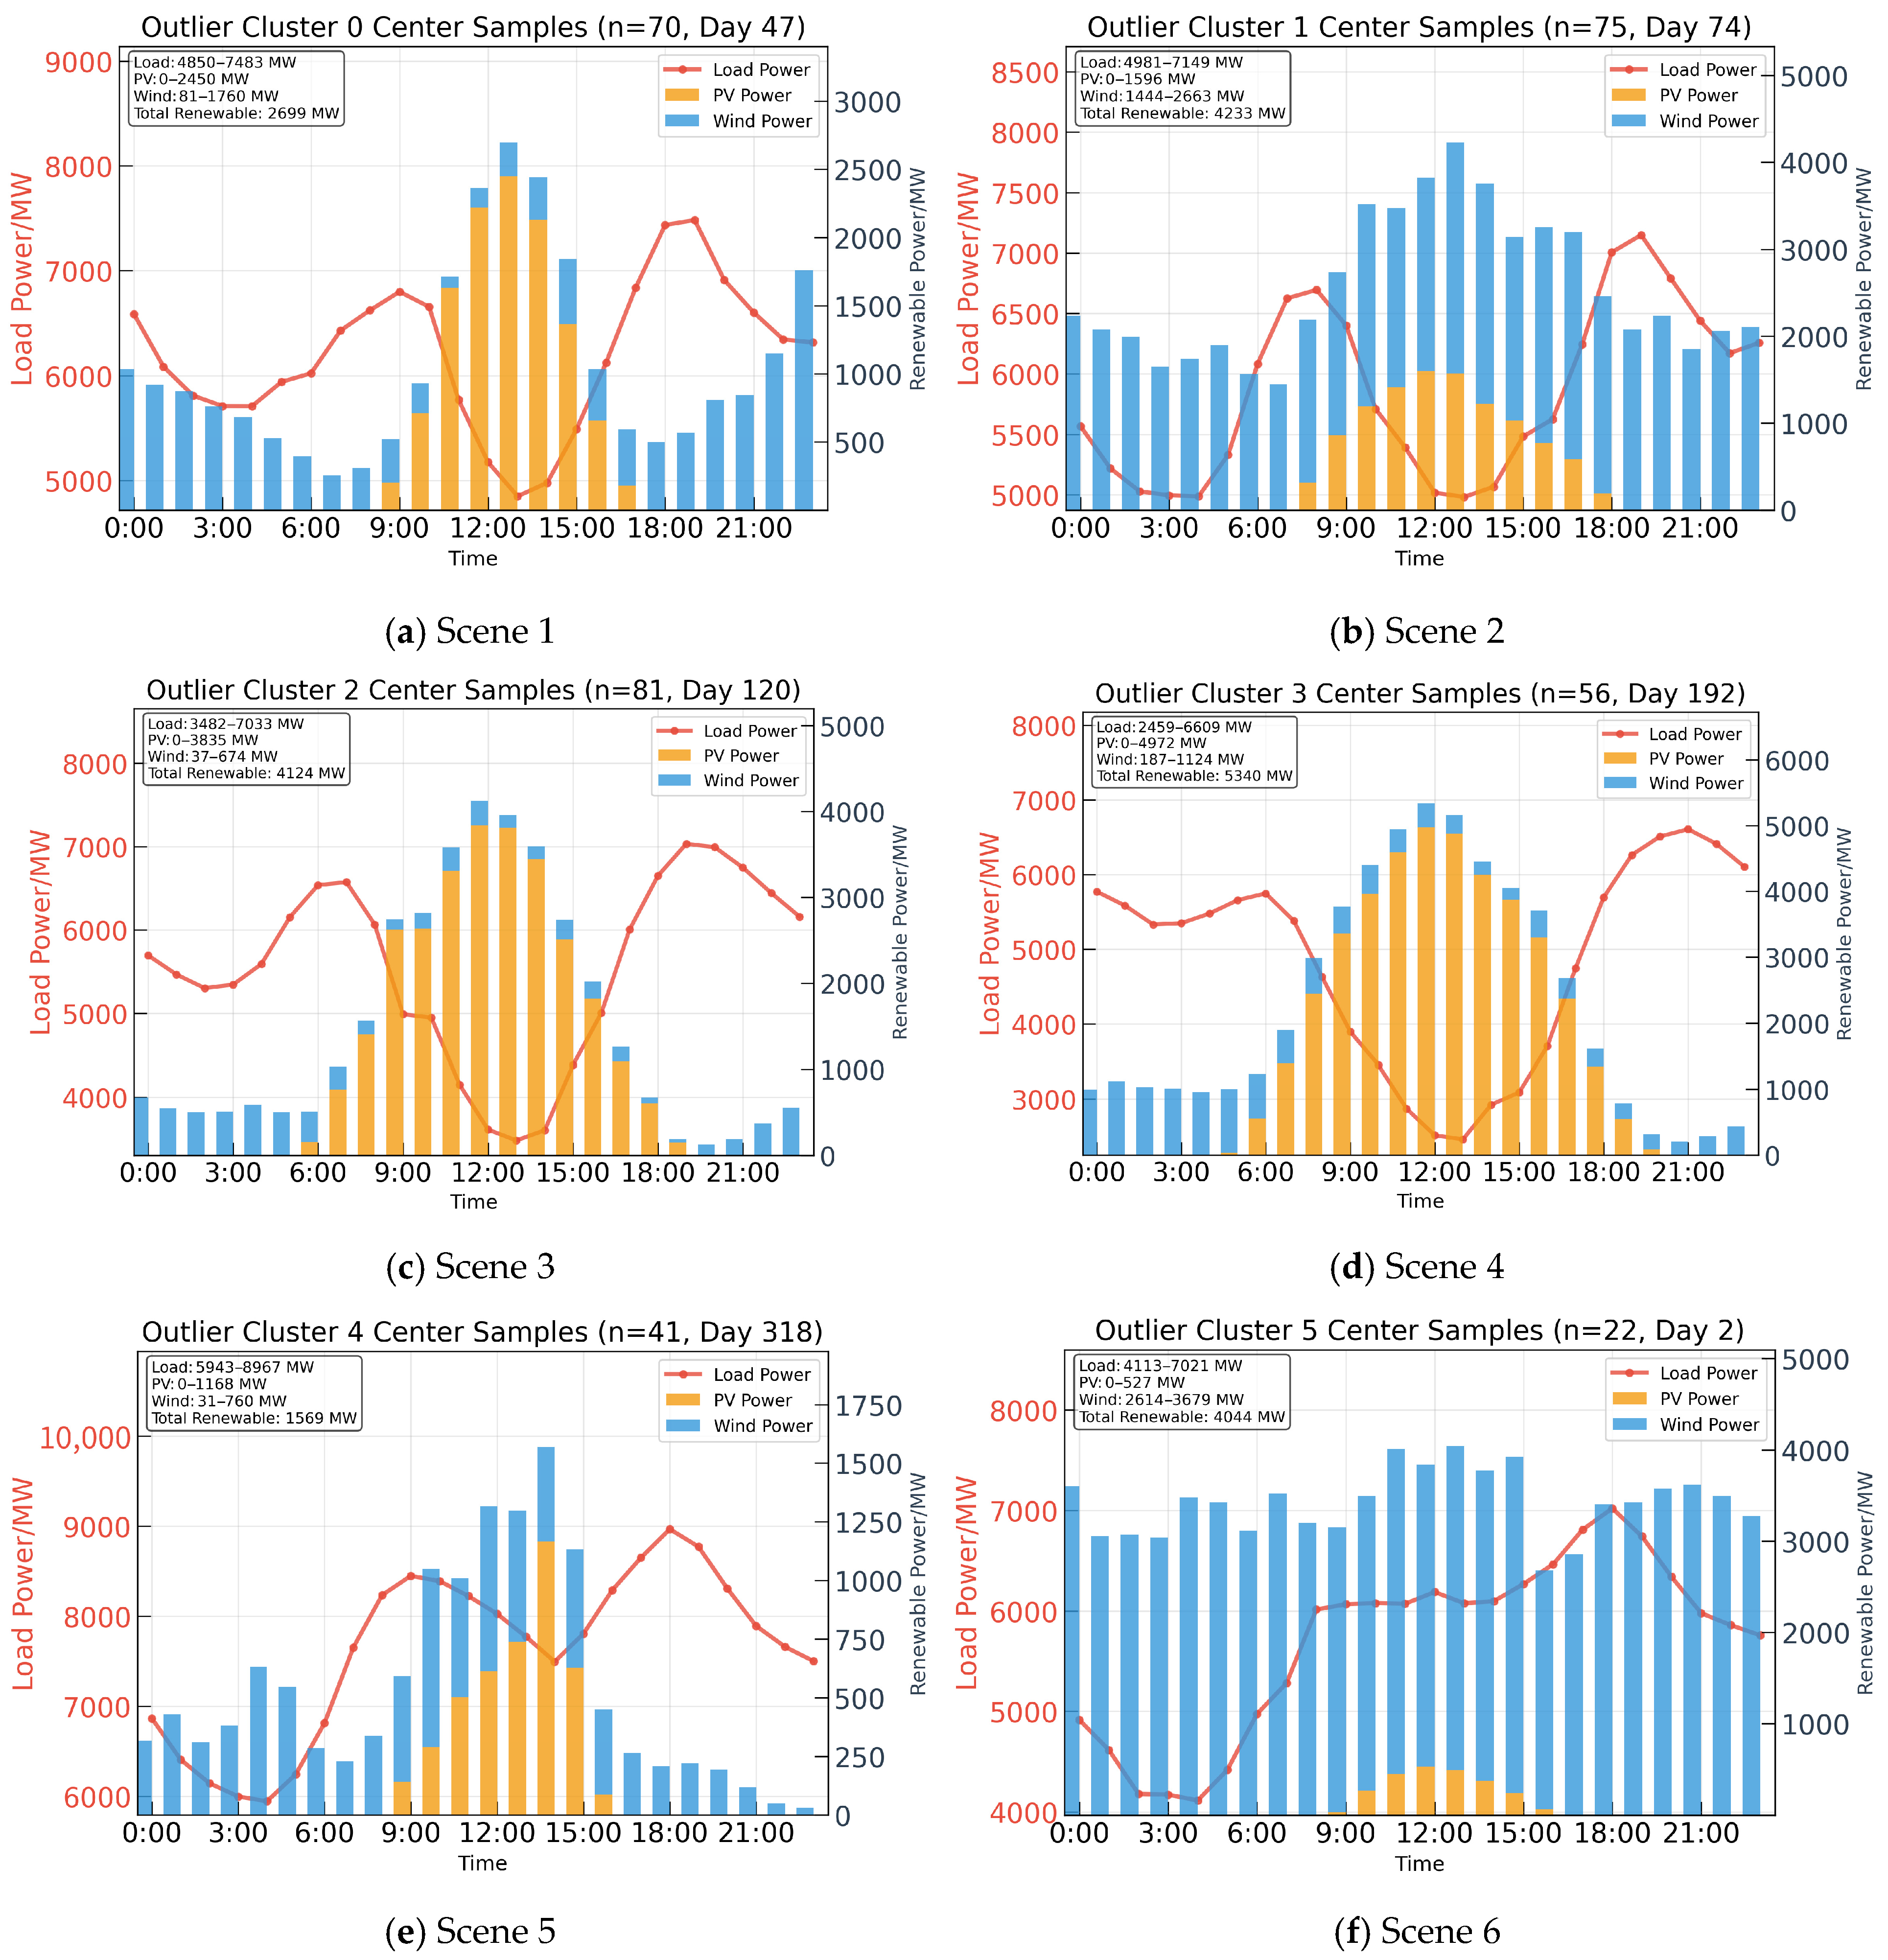
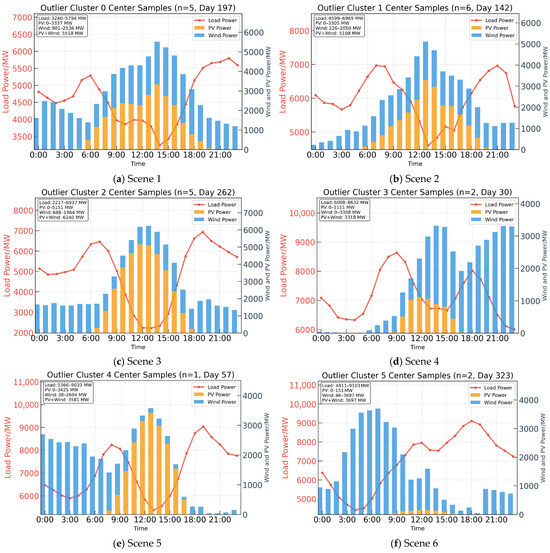
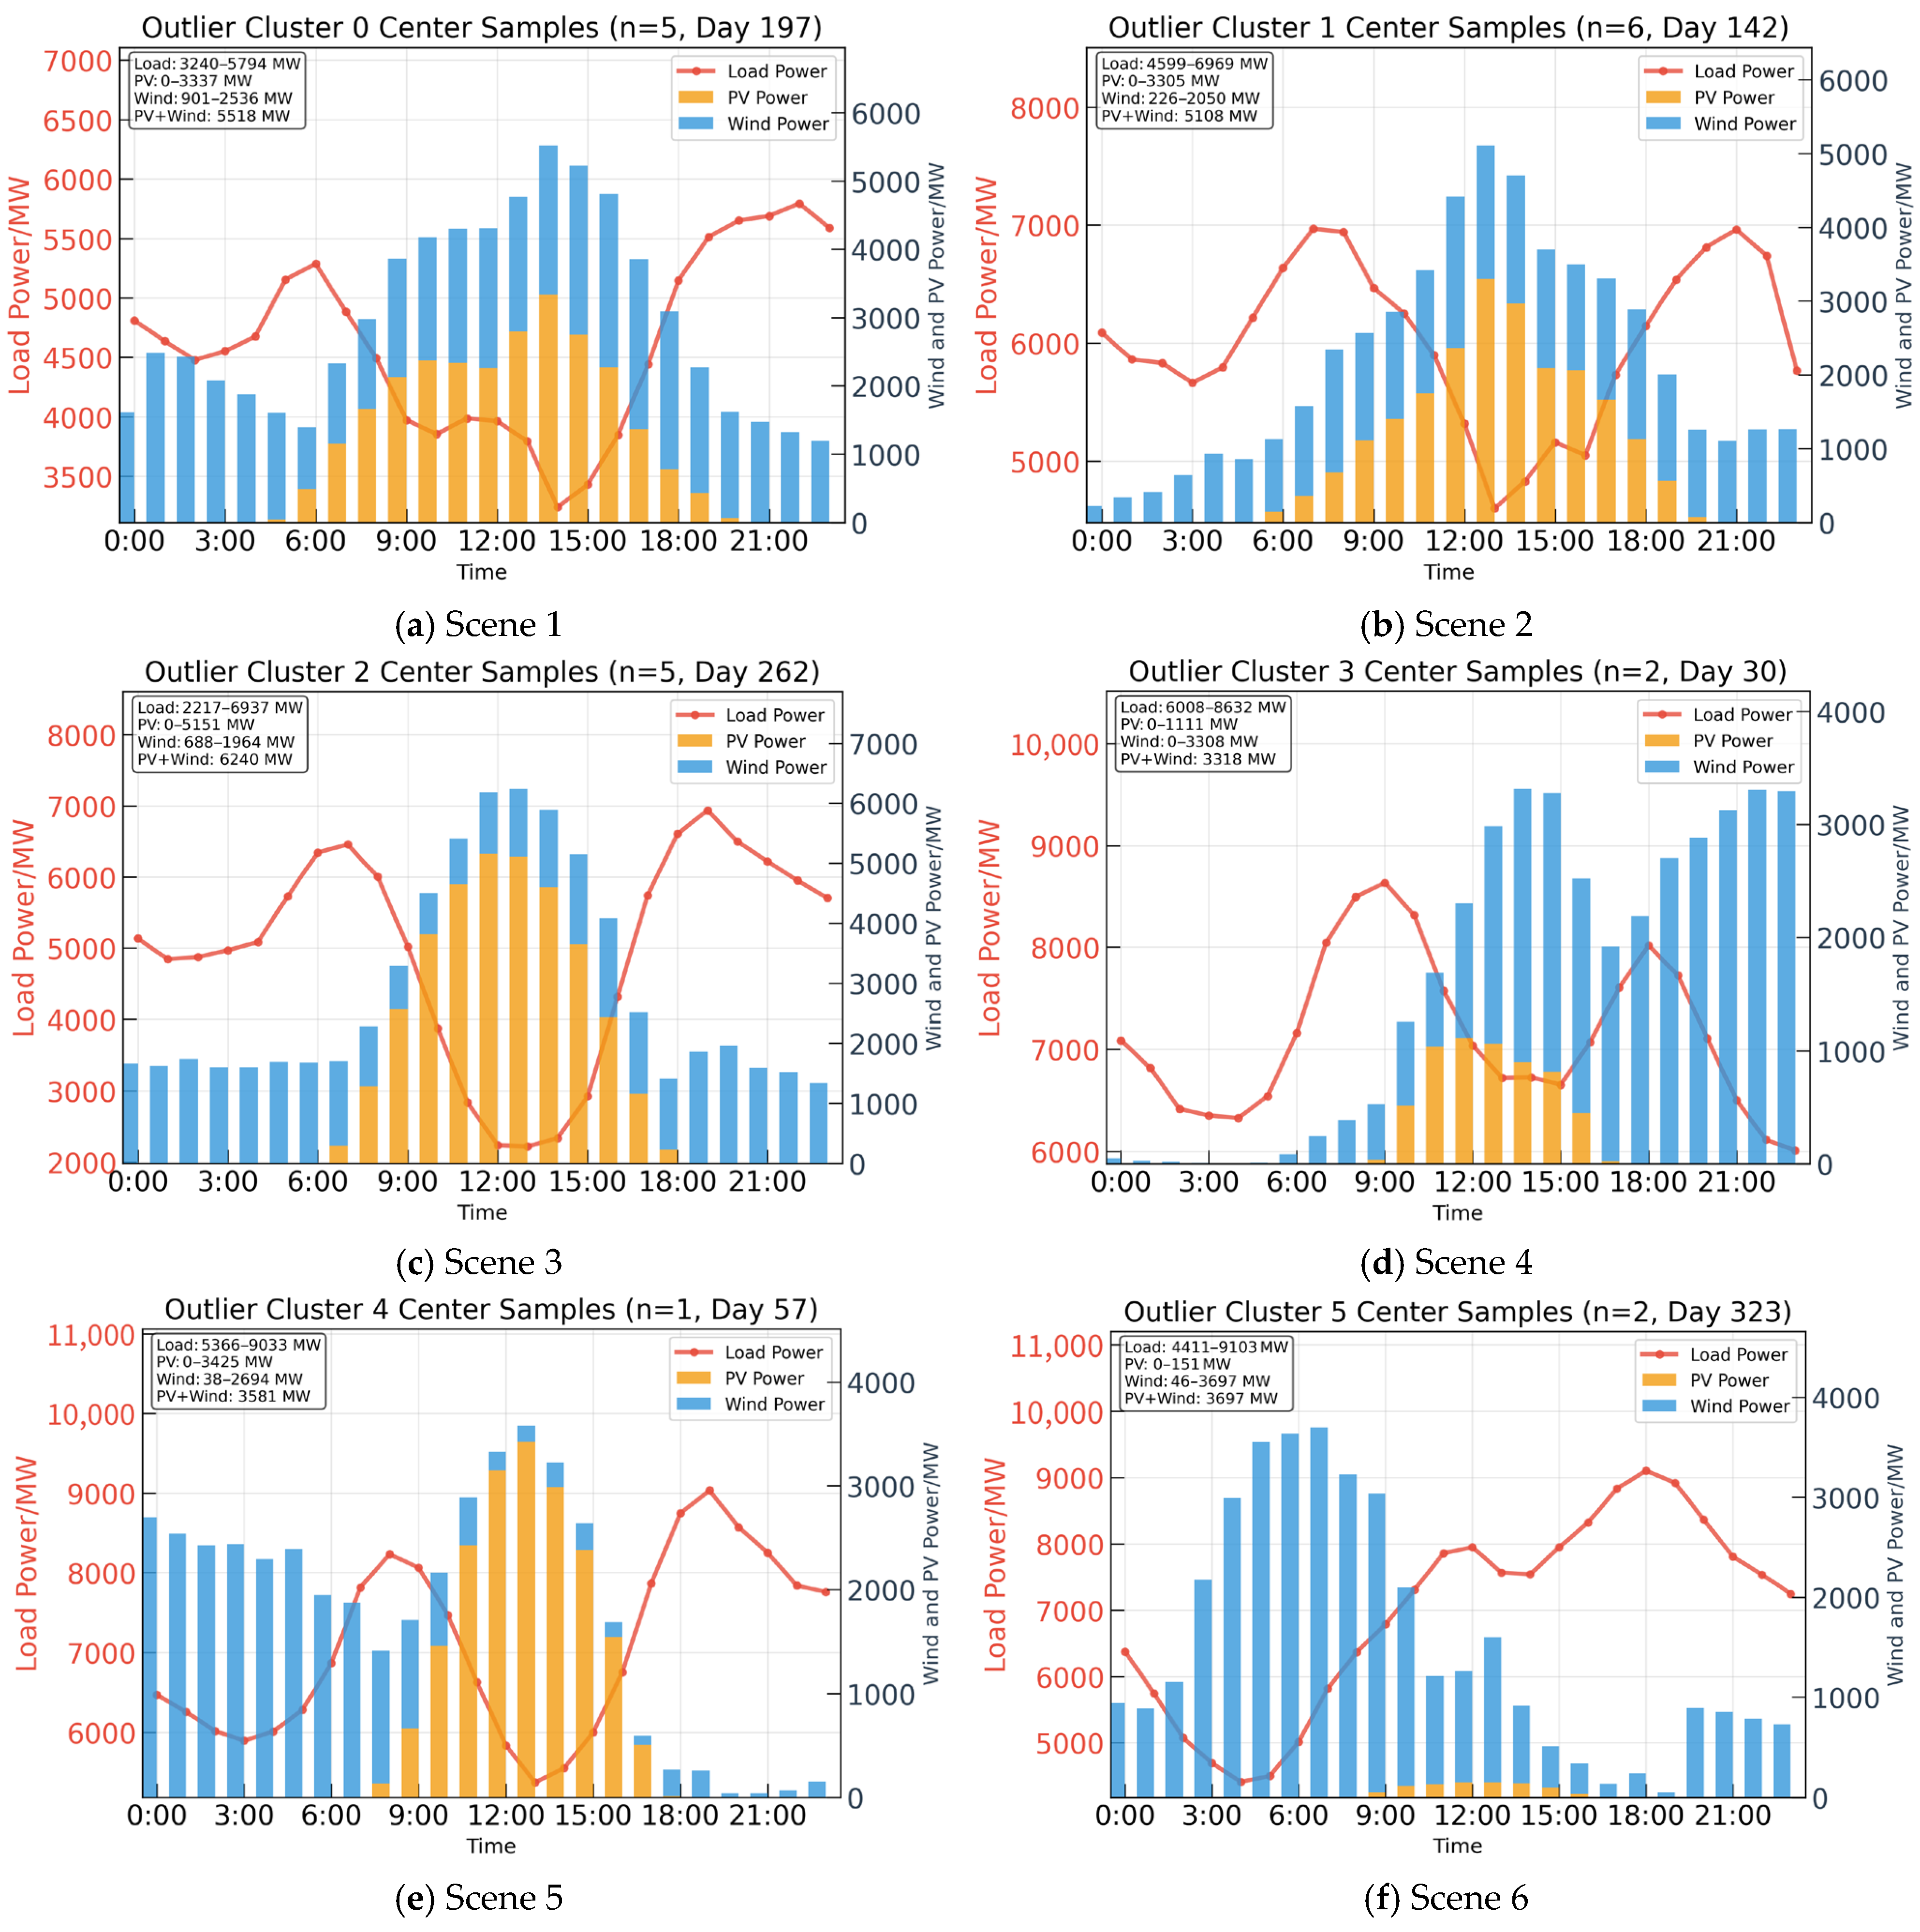
Through the method proposed in this paper, we processed Belgium’s data using an approach involving initial clustering, followed by outlier detection and subsequent clustering, ultimately obtaining operational conditions for 12 scenarios. Figure 6 and Figure 7, respectively, display the specific power curves of the 6 scenarios from the original cluster and the 6 scenarios from the outlier cluster. Table 1 presents the weighting coefficients for these 12 scenarios. After obtaining the required scenario set for solution, we constructed the model according to the bi-level programming framework outlined in Section 3. The model was subsequently solved using an improved Benders decomposition algorithm, ultimately yielding a solution set corresponding to all 12 scenarios. To evaluate the effectiveness of the proposed method, we compared it with the K-means scene clustering method. Under the condition of the same number of clusters, the proposed method optimized the Davies-Bouldin Index from 1.6 to 1.4. This result demonstrated the rationality of the scene set constructed in this paper. The optimization results were analyzed and summarized into four major scenario categories to intuitively understand the actual conditions represented by each cluster:
Figure 6.
The six samples from the origin cluster.
Figure 7.
The six samples from the outlier cluster.
Table 1.
The weighting coefficients assigned to each scenario.
The first category was sunny and low-wind, “PV-dominated” days, with Scenario 3 of the origin cluster being an extreme example. This scenario typically occurred on clear, low-wind weekdays during spring and autumn under high PV penetration. During the daytime, PV resources were excellent, resulting in a full and smooth bell-shaped output curve that peaked at noon, serving as the core driver of this scenario. Wind power output remained generally low or moderate throughout the day, providing limited contribution to the power system and failing to effectively support the evening peak. The main challenges included potential PV overgeneration at noon, requiring curtailment or energy storage, and the rapid ramp-up demand from other adjustable sources in the evening as PV declined and the peak load arrived, placing extremely high demands on system flexibility and ramping capability.
The second category was cloudy/rainy and windless, supply tight days, represented by Scenario 5 of the origin cluster. Such days often occurred during windless rainy days in summer or stable weather in winter. PV and wind output were low throughout the day, accounting for less than a quarter of the total load, indicating continuous cloudy/rainy weather with scarce renewable resources. In this scenario, renewables provided almost no support, and the entire power supply pressure was borne by conventional generation sources.
The third category was windy and rainy, “wind-dominated” days, such as Scenario 6 of the outlier cluster, which exemplified windy and rainy days in winter and spring. Due to overcast and rainy conditions, PV output remained near zero or at very low levels all day, while wind resources were exceptionally abundant, maintaining very high output and becoming the main power source. When load demand was low (e.g., during holiday nights), wind output easily exceeded load requirements, leading to severe wind curtailment issues.
The fourth category was mixed renewable output with steep evening peak, “complex and variable” days, represented by Scenario 5 of the outlier cluster, demonstrating a complex transitional state. The challenge in grid operation arose from the “triple overlap” in the evening: the rapid decline of PV output, the sharp increase in user load, and the simultaneous growth in wind power output. This required the grid to smoothly compensate for the loss of PV, cope with the steep load increase, and simultaneously integrate and manage variable wind power.
Using the proposed planning and solution methodology, the optimal solution was identified as investing in and constructing a pumped storage power plant with a rated capacity of 5760 MWh at bus B9. Simulation results of system operation showed that the annual renewable energy integration rate reached 96.73%, with PV and wind curtailment rates as low as 6.6% and 0.7%, respectively. No active load shedding events occurred. To further validate this result, we performed comparative analyses at 5000 MW and 6500 MW capacities. The results show that while the 5000 MW configuration reduces system costs by $7,150,265, it increases curtailment rate by 0.36%; conversely, the 6500 MW configuration improves curtailment by 0.35% but increases costs by $7,668,129. These comparisons confirm that the 5760 MW capacity achieves the optimal balance between economic efficiency and renewable energy utilization, justifying its selection as the optimal investment.
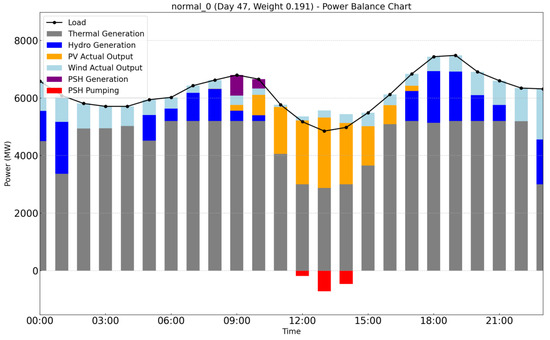
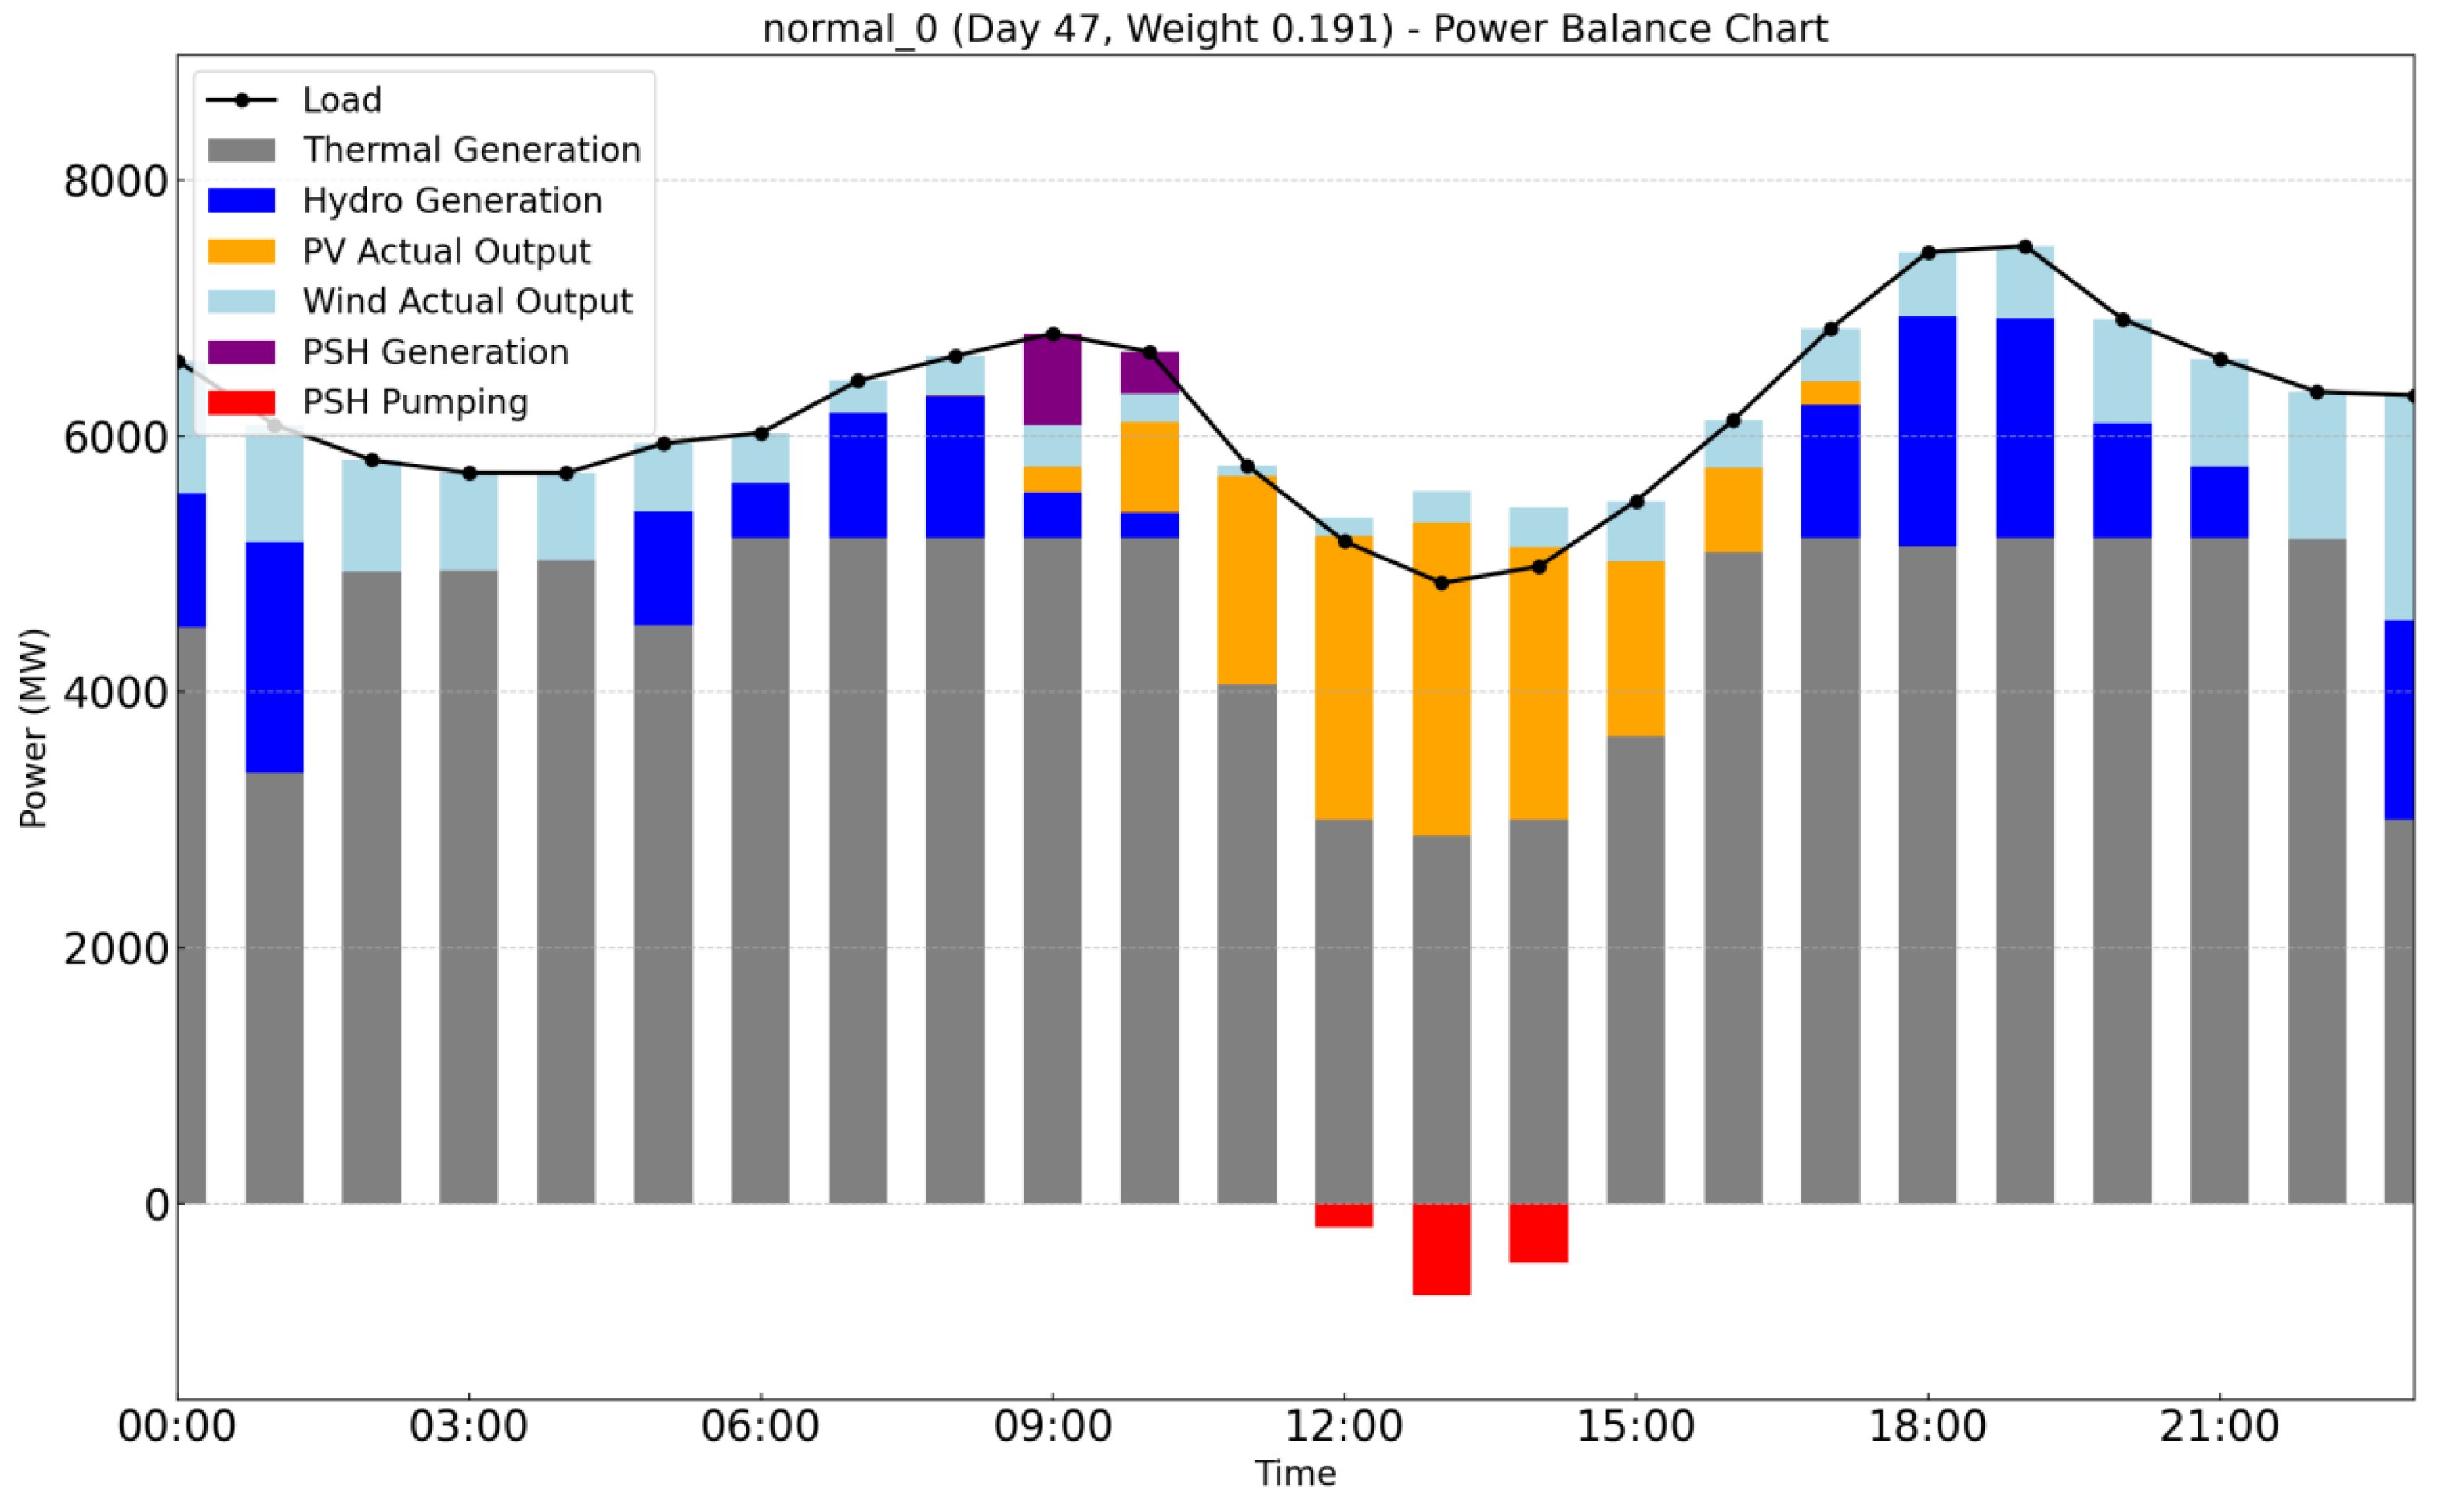
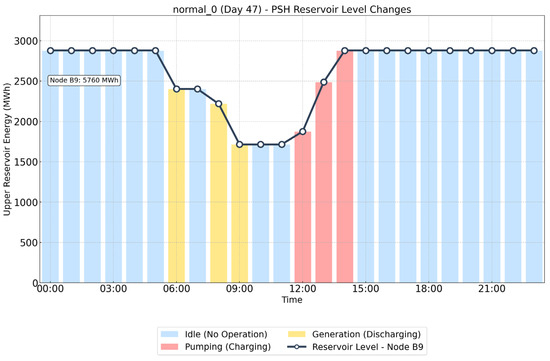
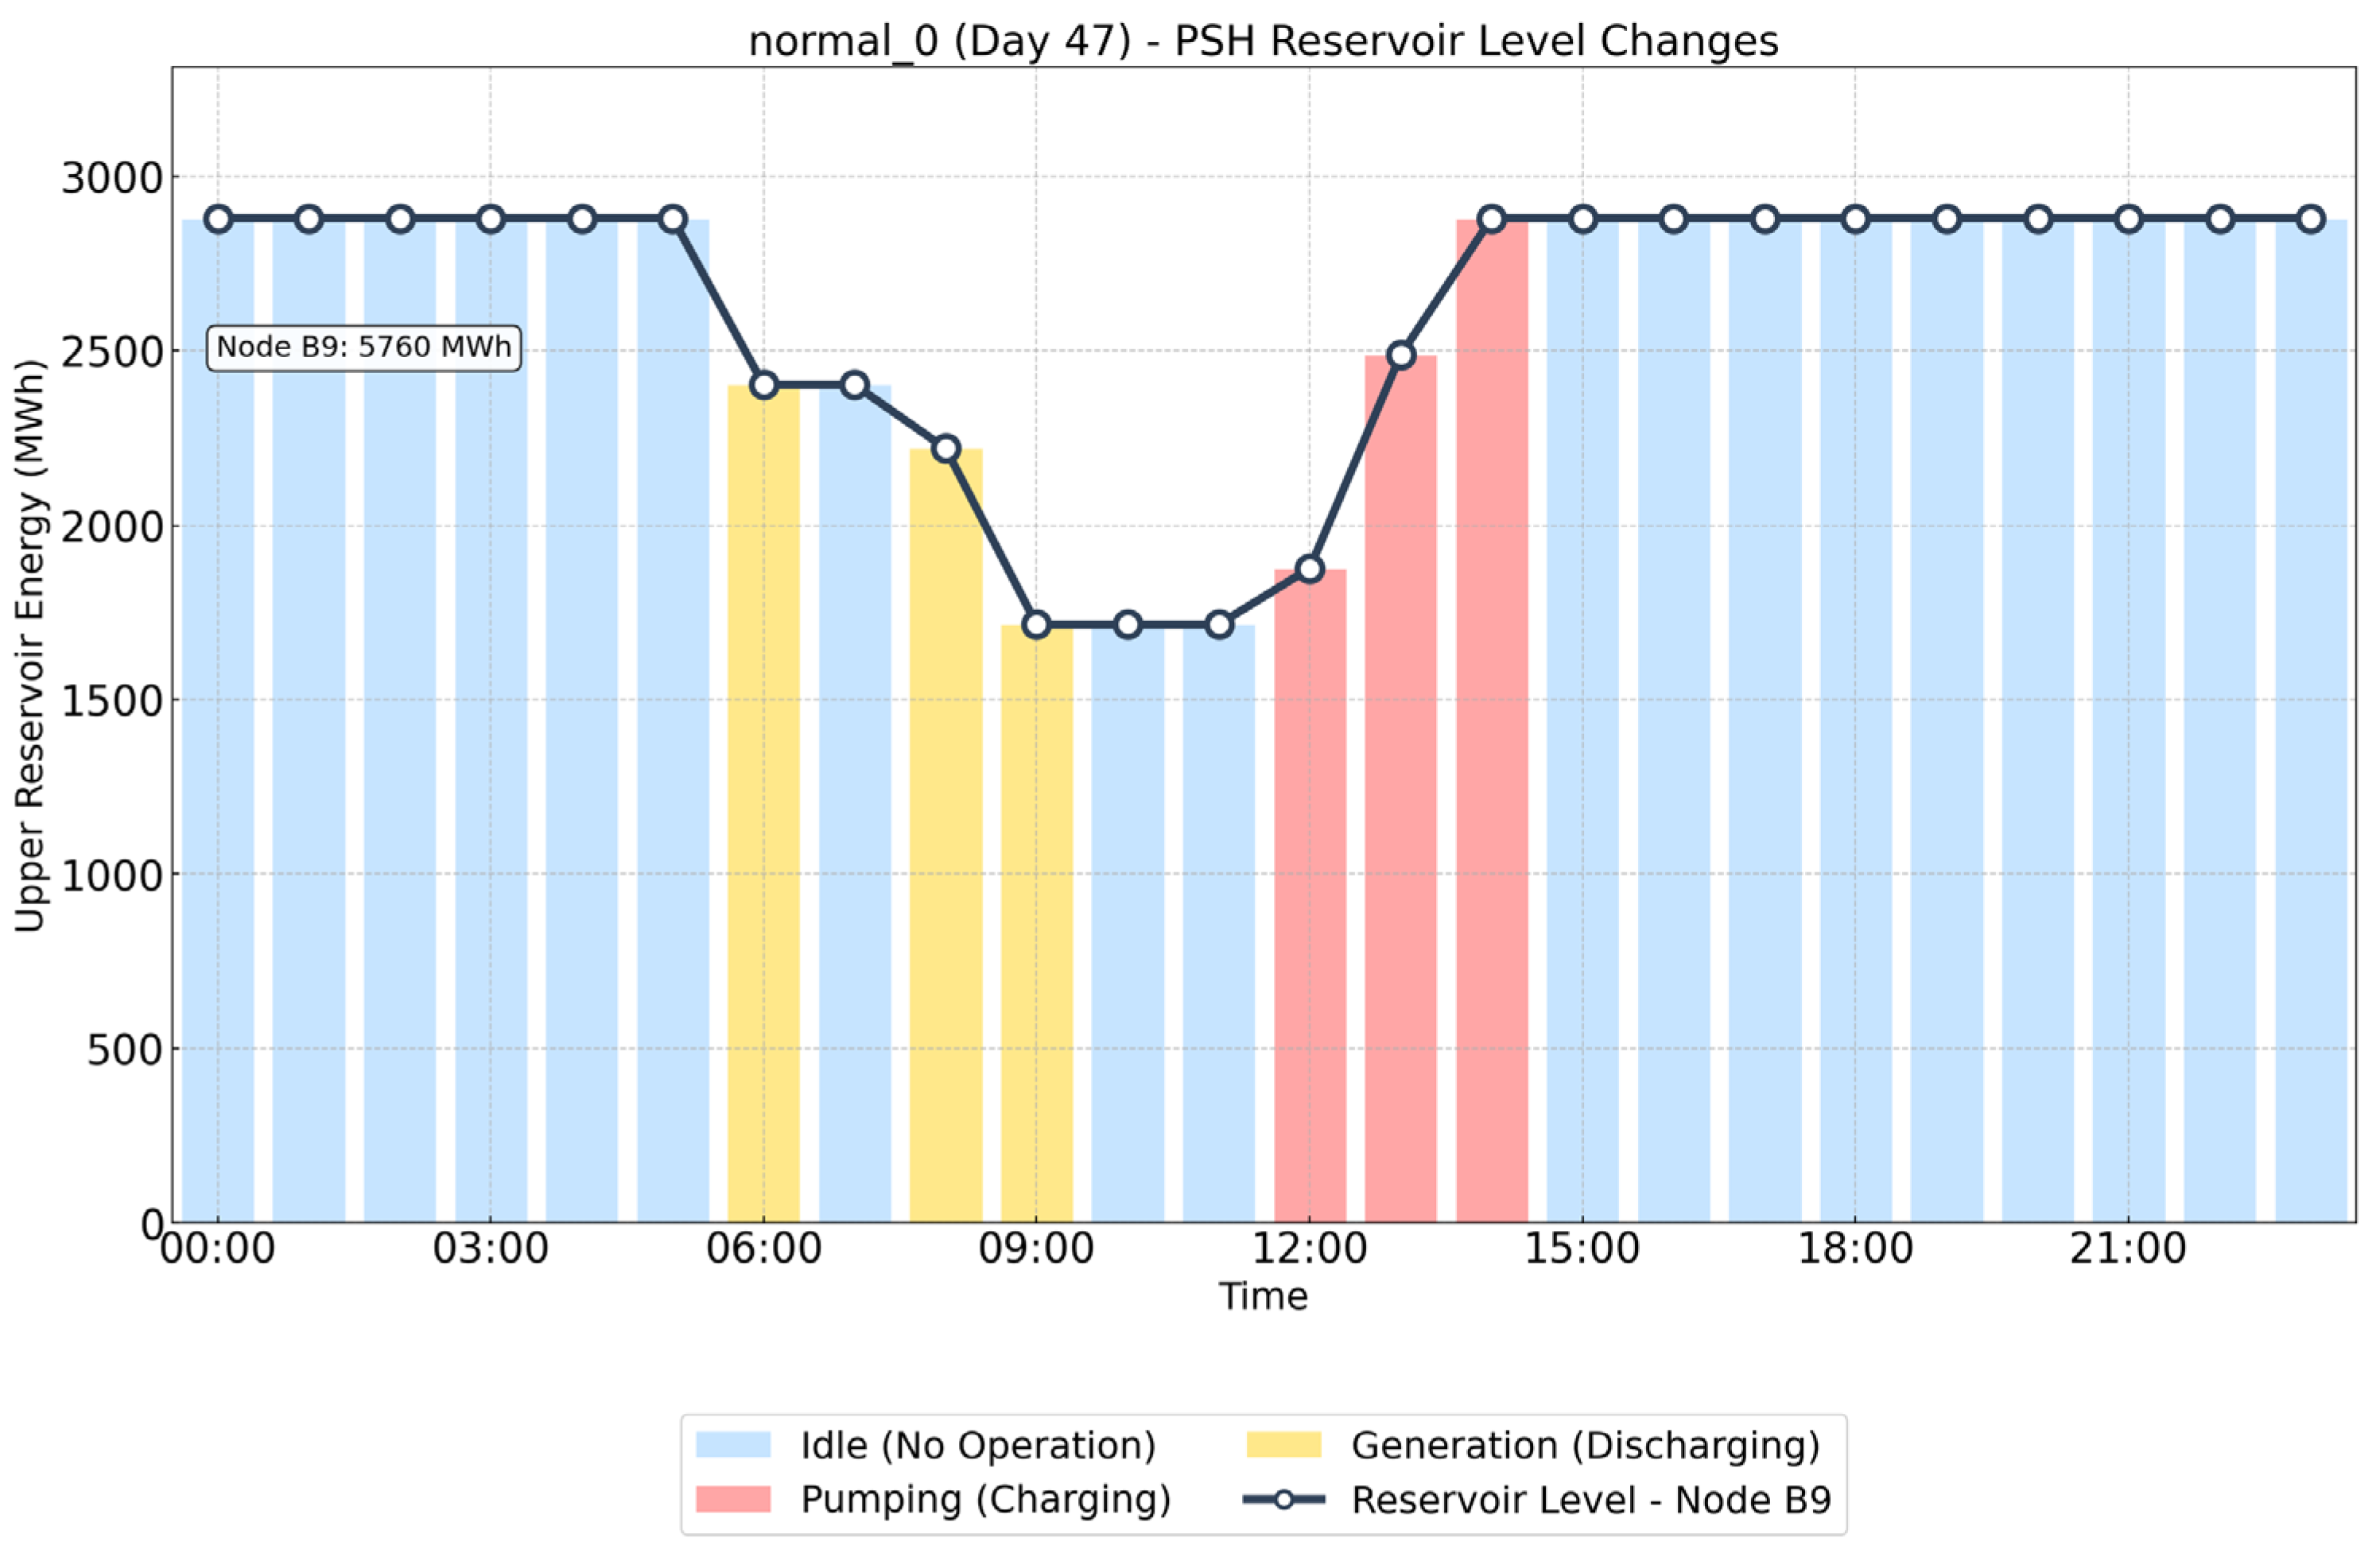
Taking the first scenario (Day 47) from the original detection as an example, this sample recorded a sunny and windy day with hybrid renewable energy output. Due to the clear weather, photovoltaic power generation peaked at noon, while wind resources contributed the majority of the output during the early morning and evening. The two sources alternated in supplying power, collectively supporting the system. Figure 8 and Figure 9 present the simulation results of unit commitment under the optimal pumped storage investment scheme.
Figure 8.
Operational Status of Various Units for the Central Sample of Scenario 3 of the origin cluster.
Figure 9.
Effective Usable Energy Curve of the Upper Reservoir for the Central Sample of Scenario 3 of the origin cluster.
As shown in Figure 8, wind power generation occurred between 00:00 and 06:00 and 18:00–24:00, while thermal power generation remained at a relatively high level. During these periods, system load was also elevated, maintaining a relatively balanced state where pumped storage units remained inactive. From 12:00 to 15:00, when system load was low and photovoltaic generation reached its peak, the system activated pumped storage units to increase output, effectively utilizing the surplus solar energy. Between 09:00 and 10:00, hydropower and pumped storage units operated in coordination to precisely meet electricity demand, avoiding the activation of higher-cost thermal power units.
As illustrated in Figure 9, the pumped storage plant played a critical role in maintaining system balance by filling the gap between load demand and photovoltaic generation. During the high solar irradiation period from 12:00 to 15:00, the plant operated at full capacity to absorb excess photovoltaic energy, preventing renewable curtailment. Between 09:00 and 10:00, it released stored electricity to support peak demand, effectively bridging the supply-demand gap. Leveraging the flexible dispatch capability of pumped storage, surplus renewable energy was fully utilized during low-load periods while ensuring stable and reliable power supply during peak hours. This two-phase operational strategy achieved zero wind and solar curtailment and prevented any load shedding, demonstrating the exceptional performance of pumped storage in enabling high renewable penetration while maintaining system stability.
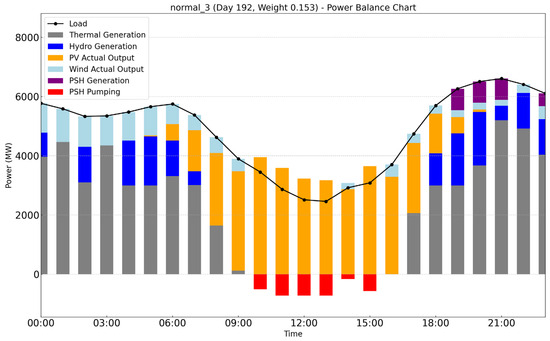
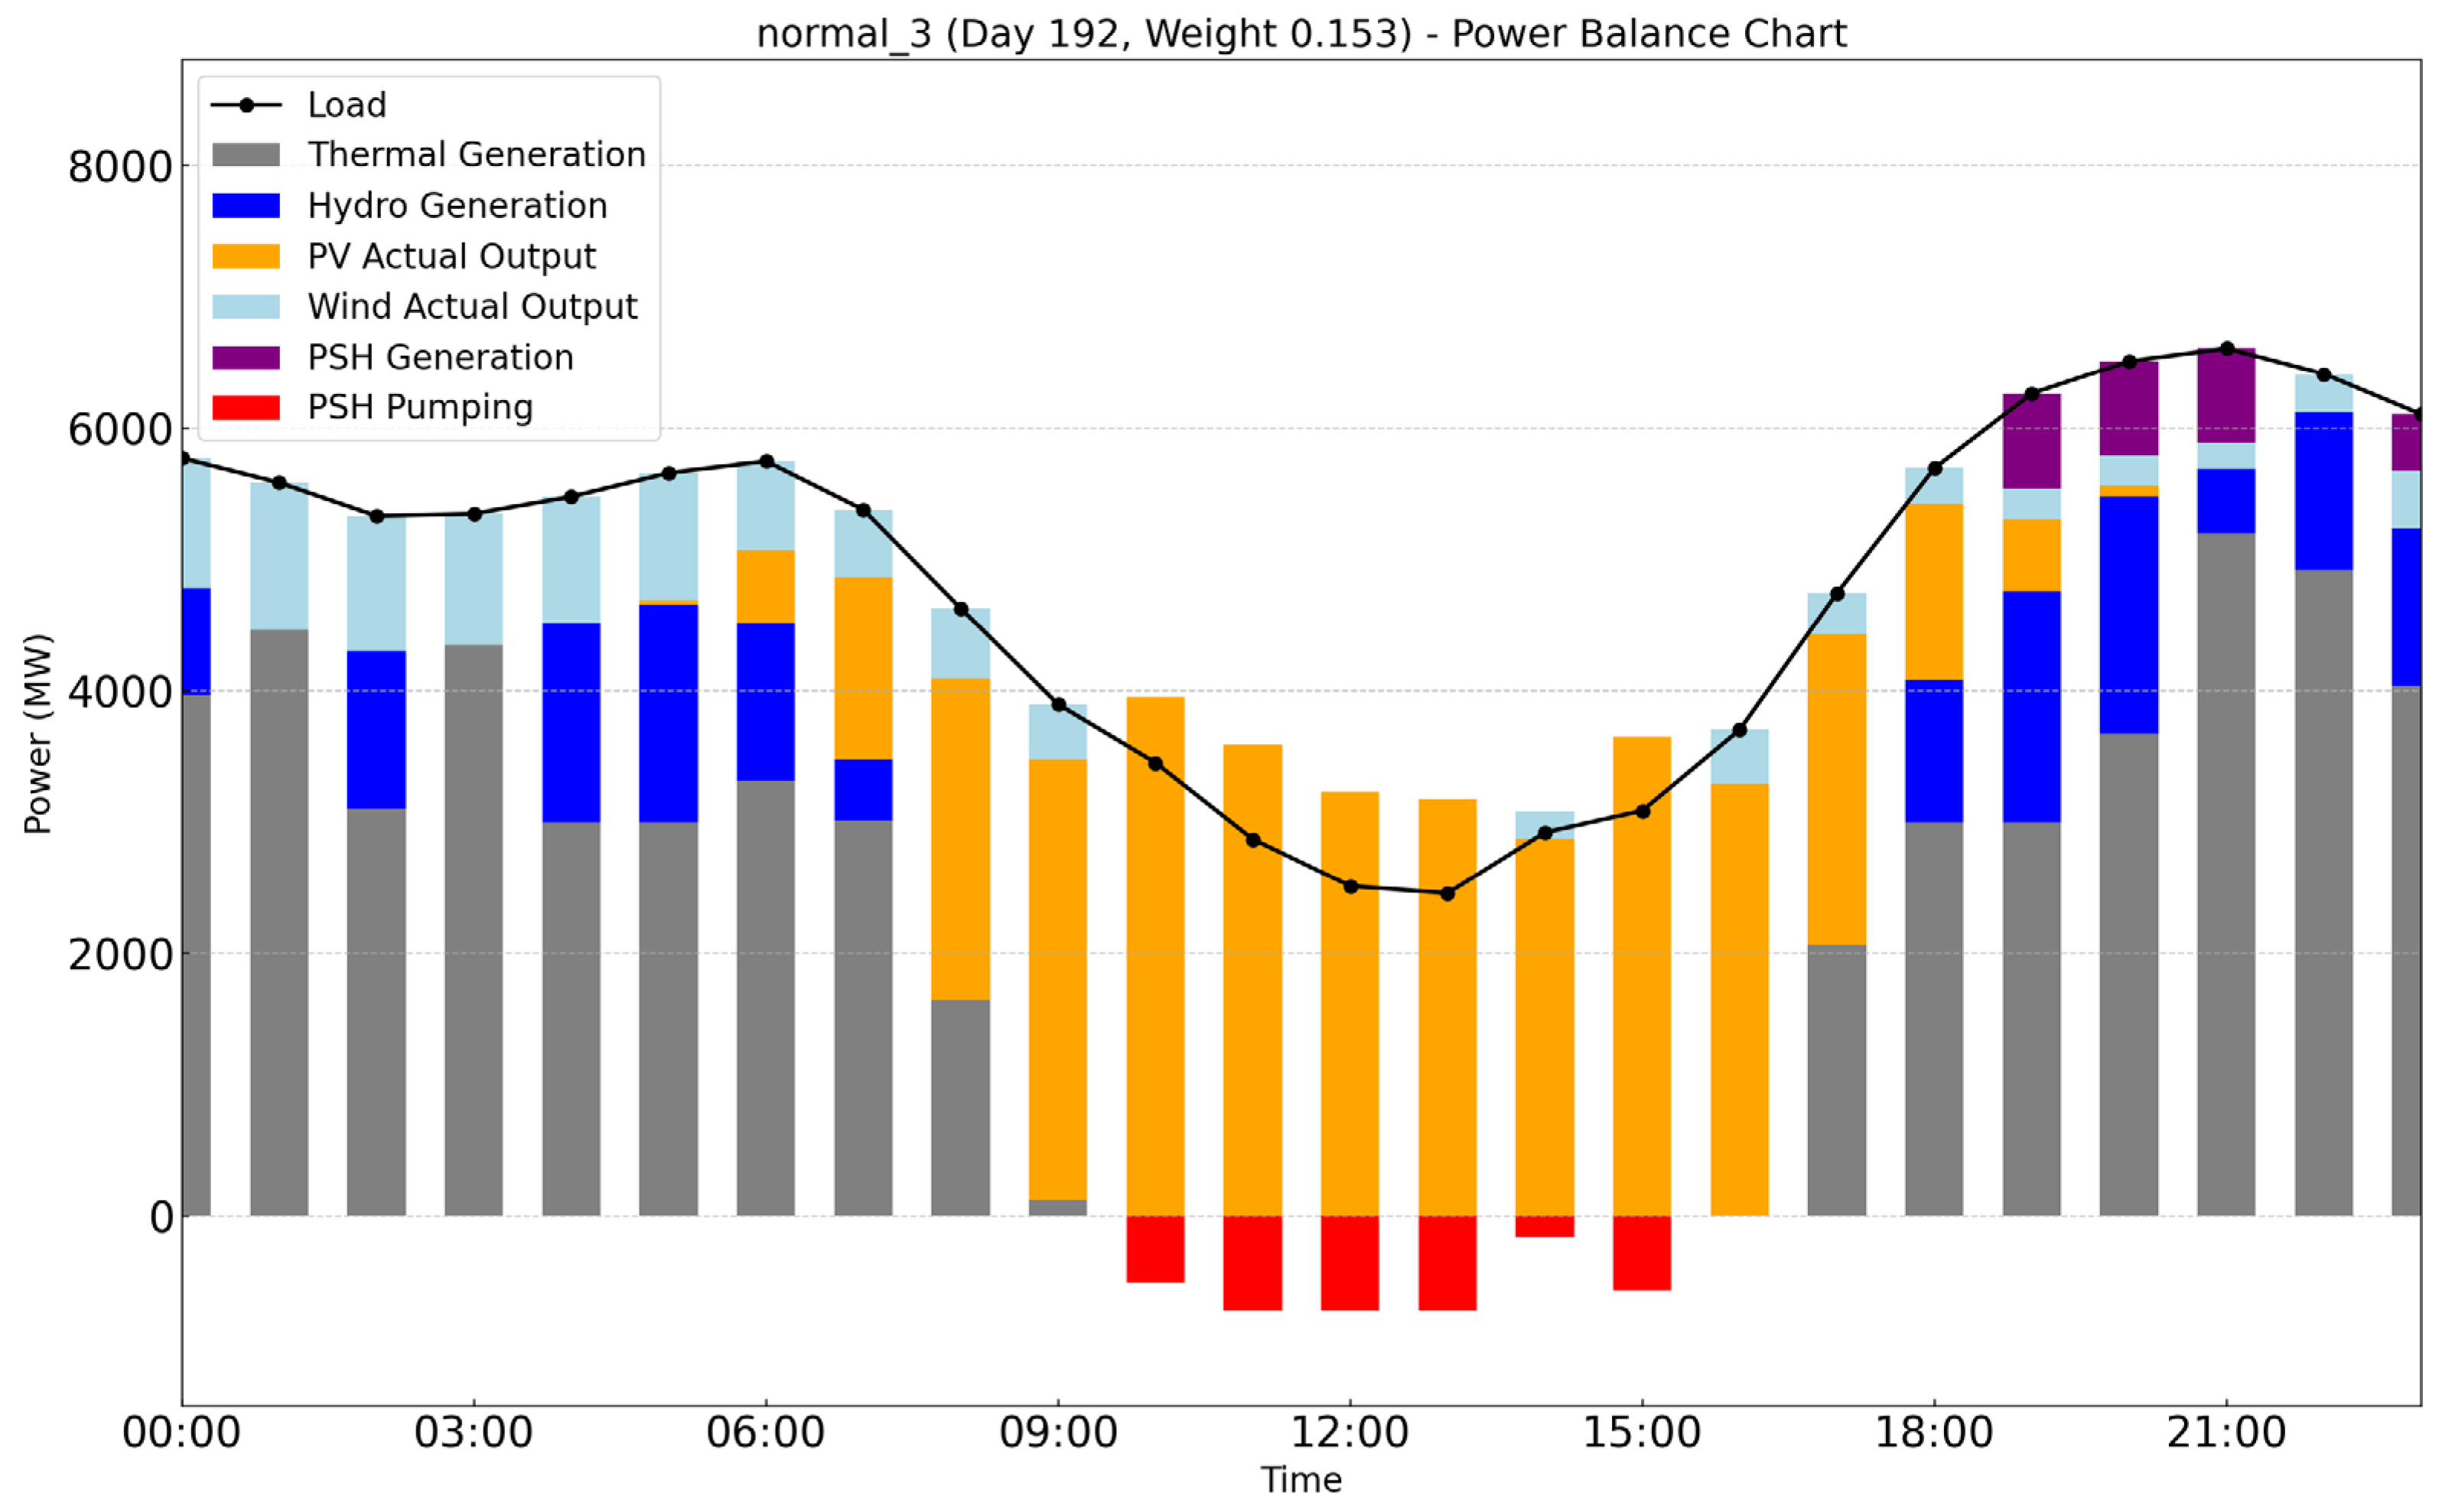
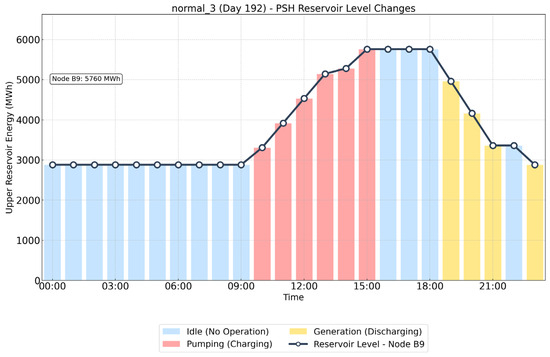
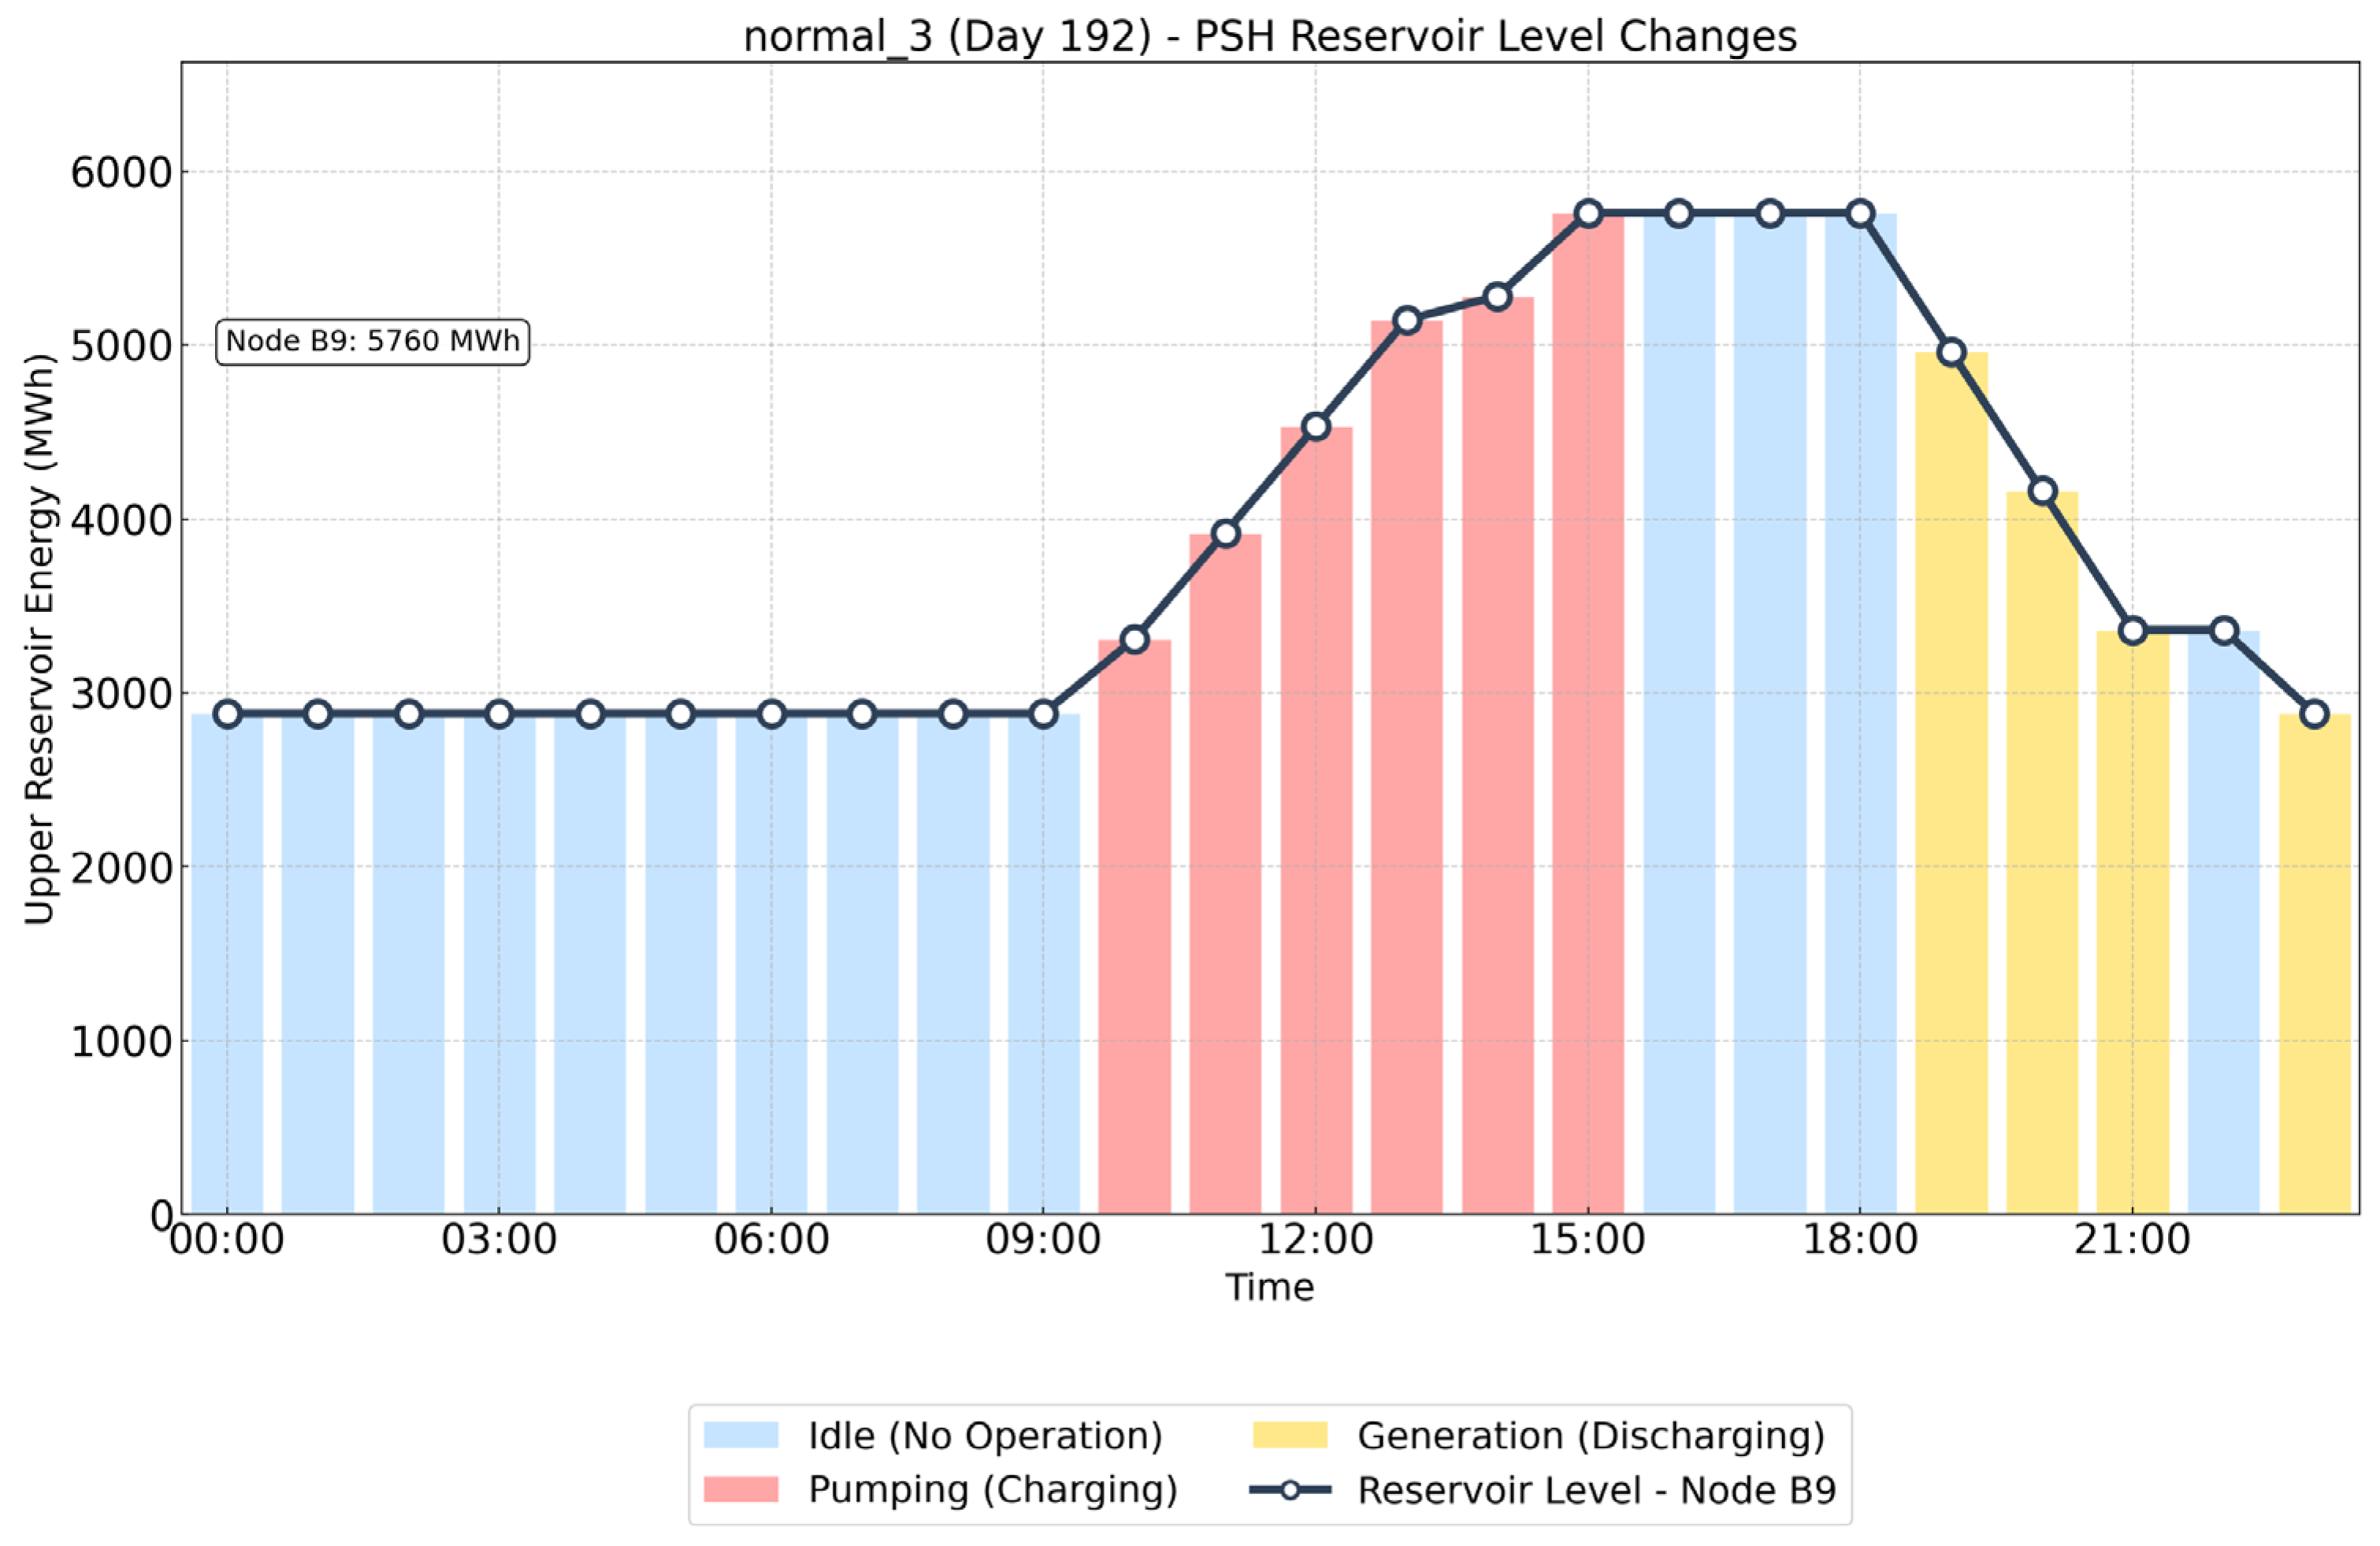
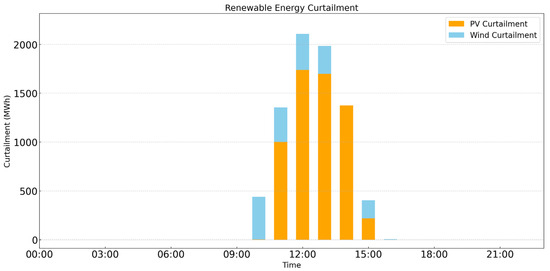
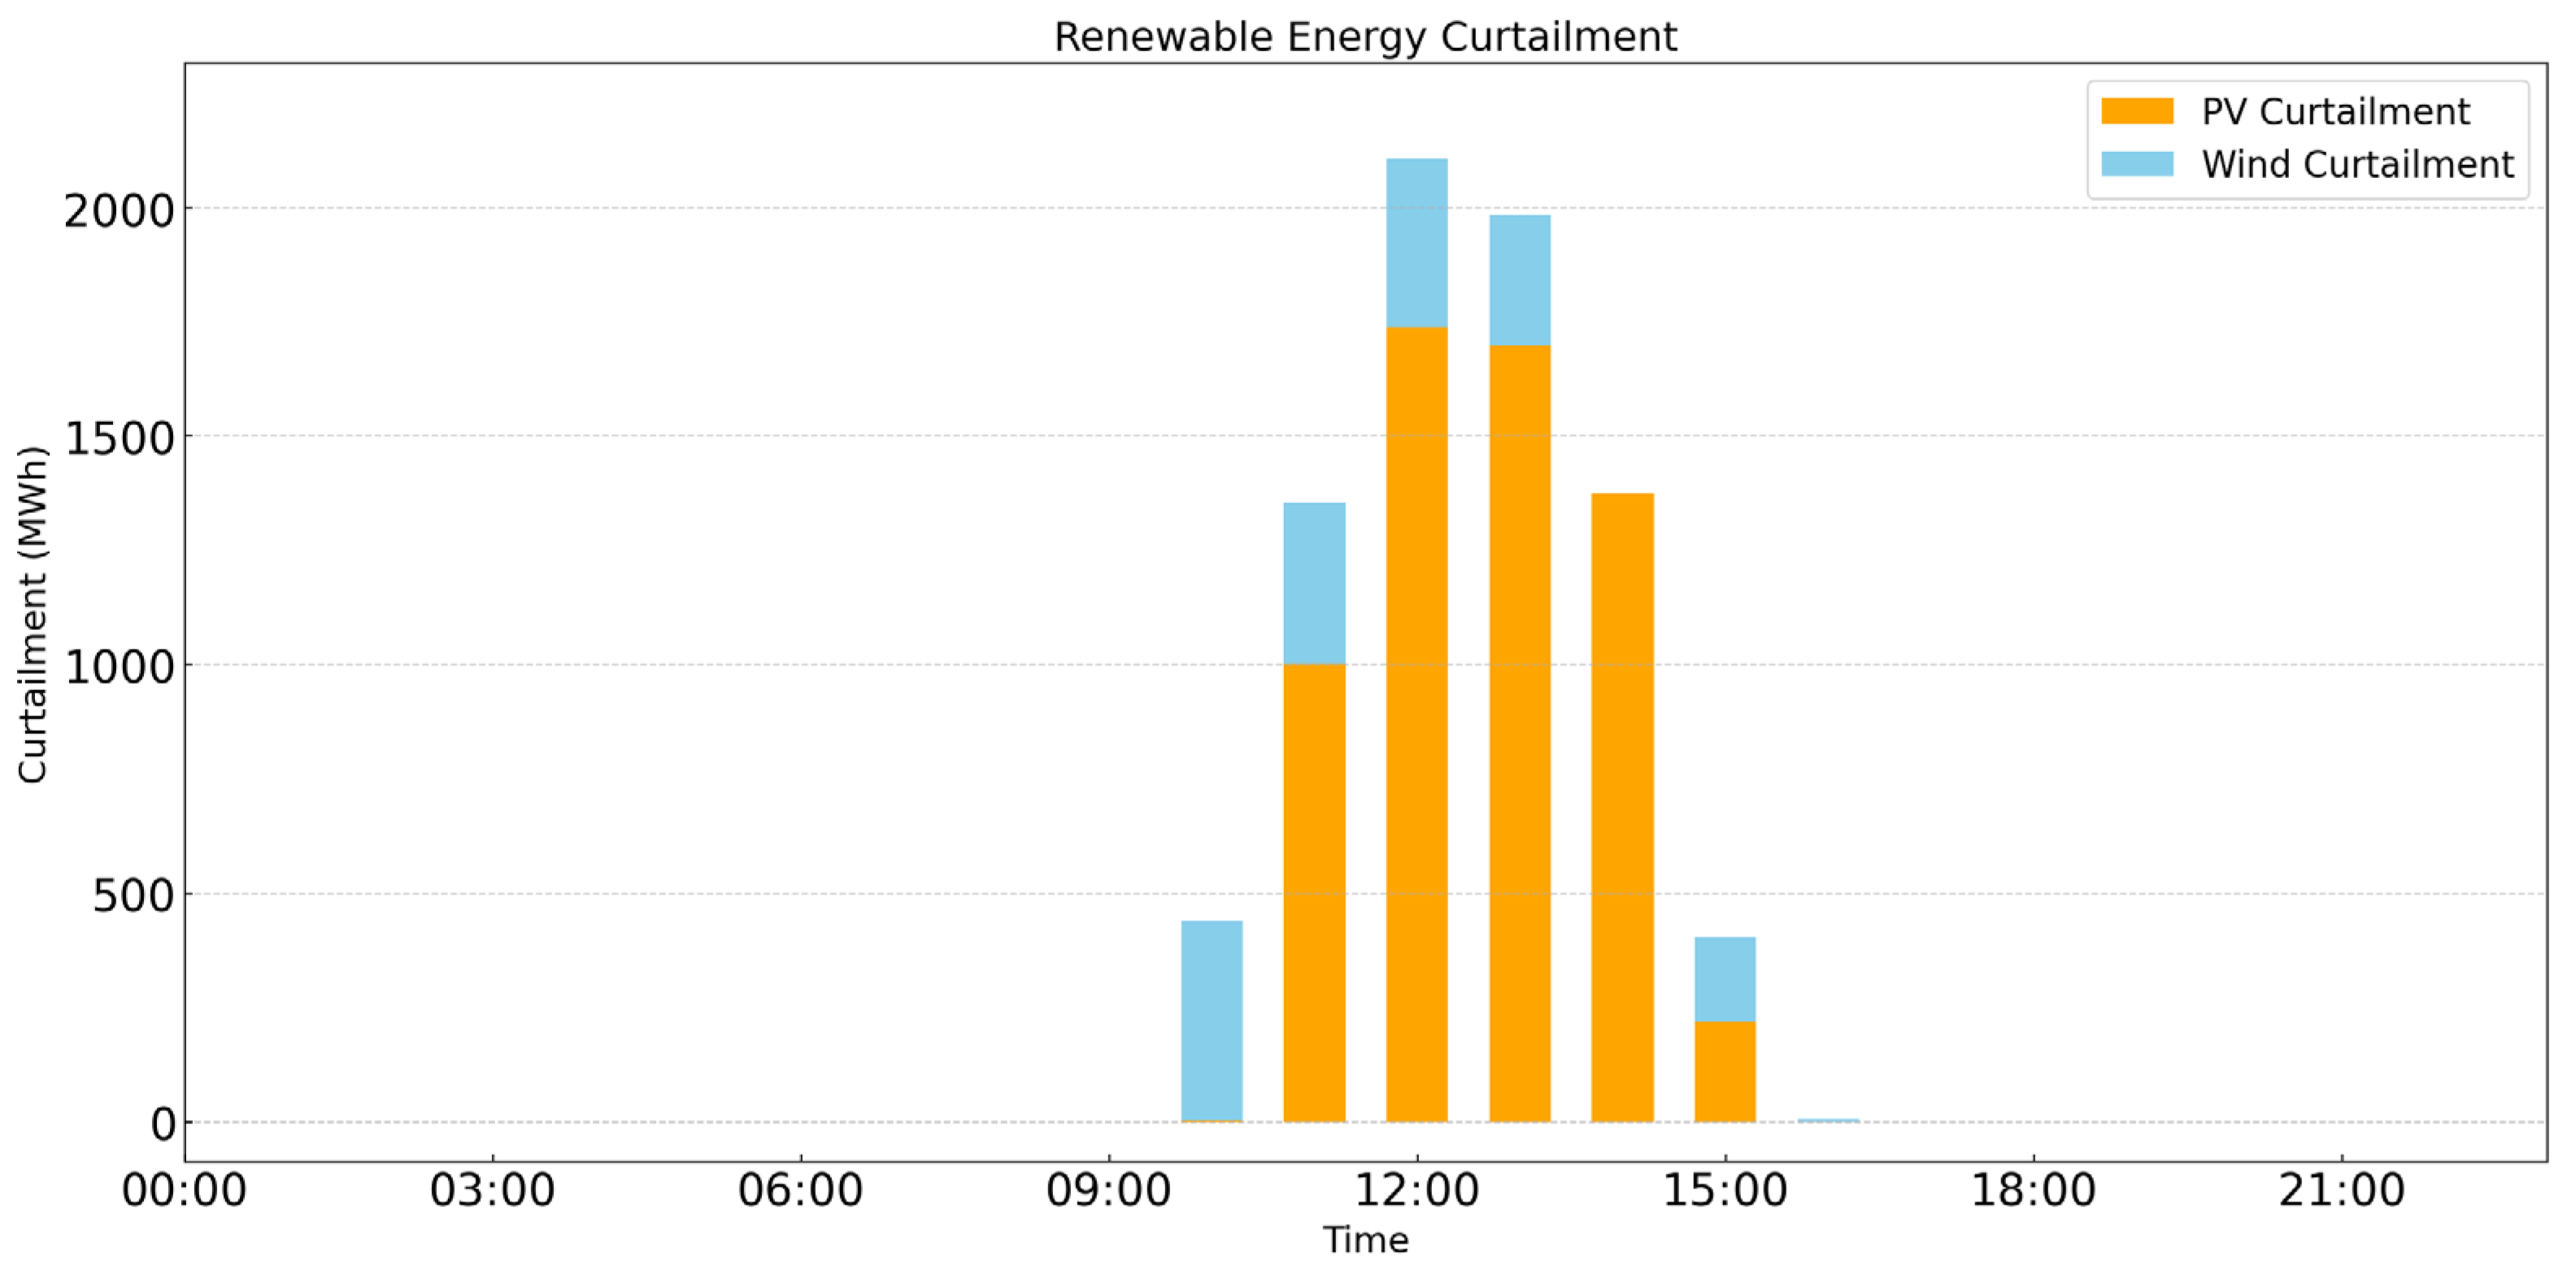
Furthermore, the central sample of Scenario 4 (the 192nd day) was taken as an example. This sample fell in midsummer and represented a sunny, low-wind, PV-dominated day. It clearly demonstrated the unit commitment and dispatch results under the optimal pumped storage investment plan, as shown in Figure 10, Figure 11 and Figure 12.
Figure 10.
Operational Status of Various Units for the Central Sample of Scenario 4 of the origin cluster.
Figure 11.
Effective Usable Energy Curve of the Upper Reservoir for the Central Sample of Scenario 4 of the origin cluster.
Figure 12.
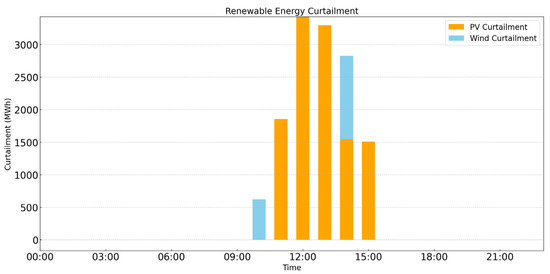
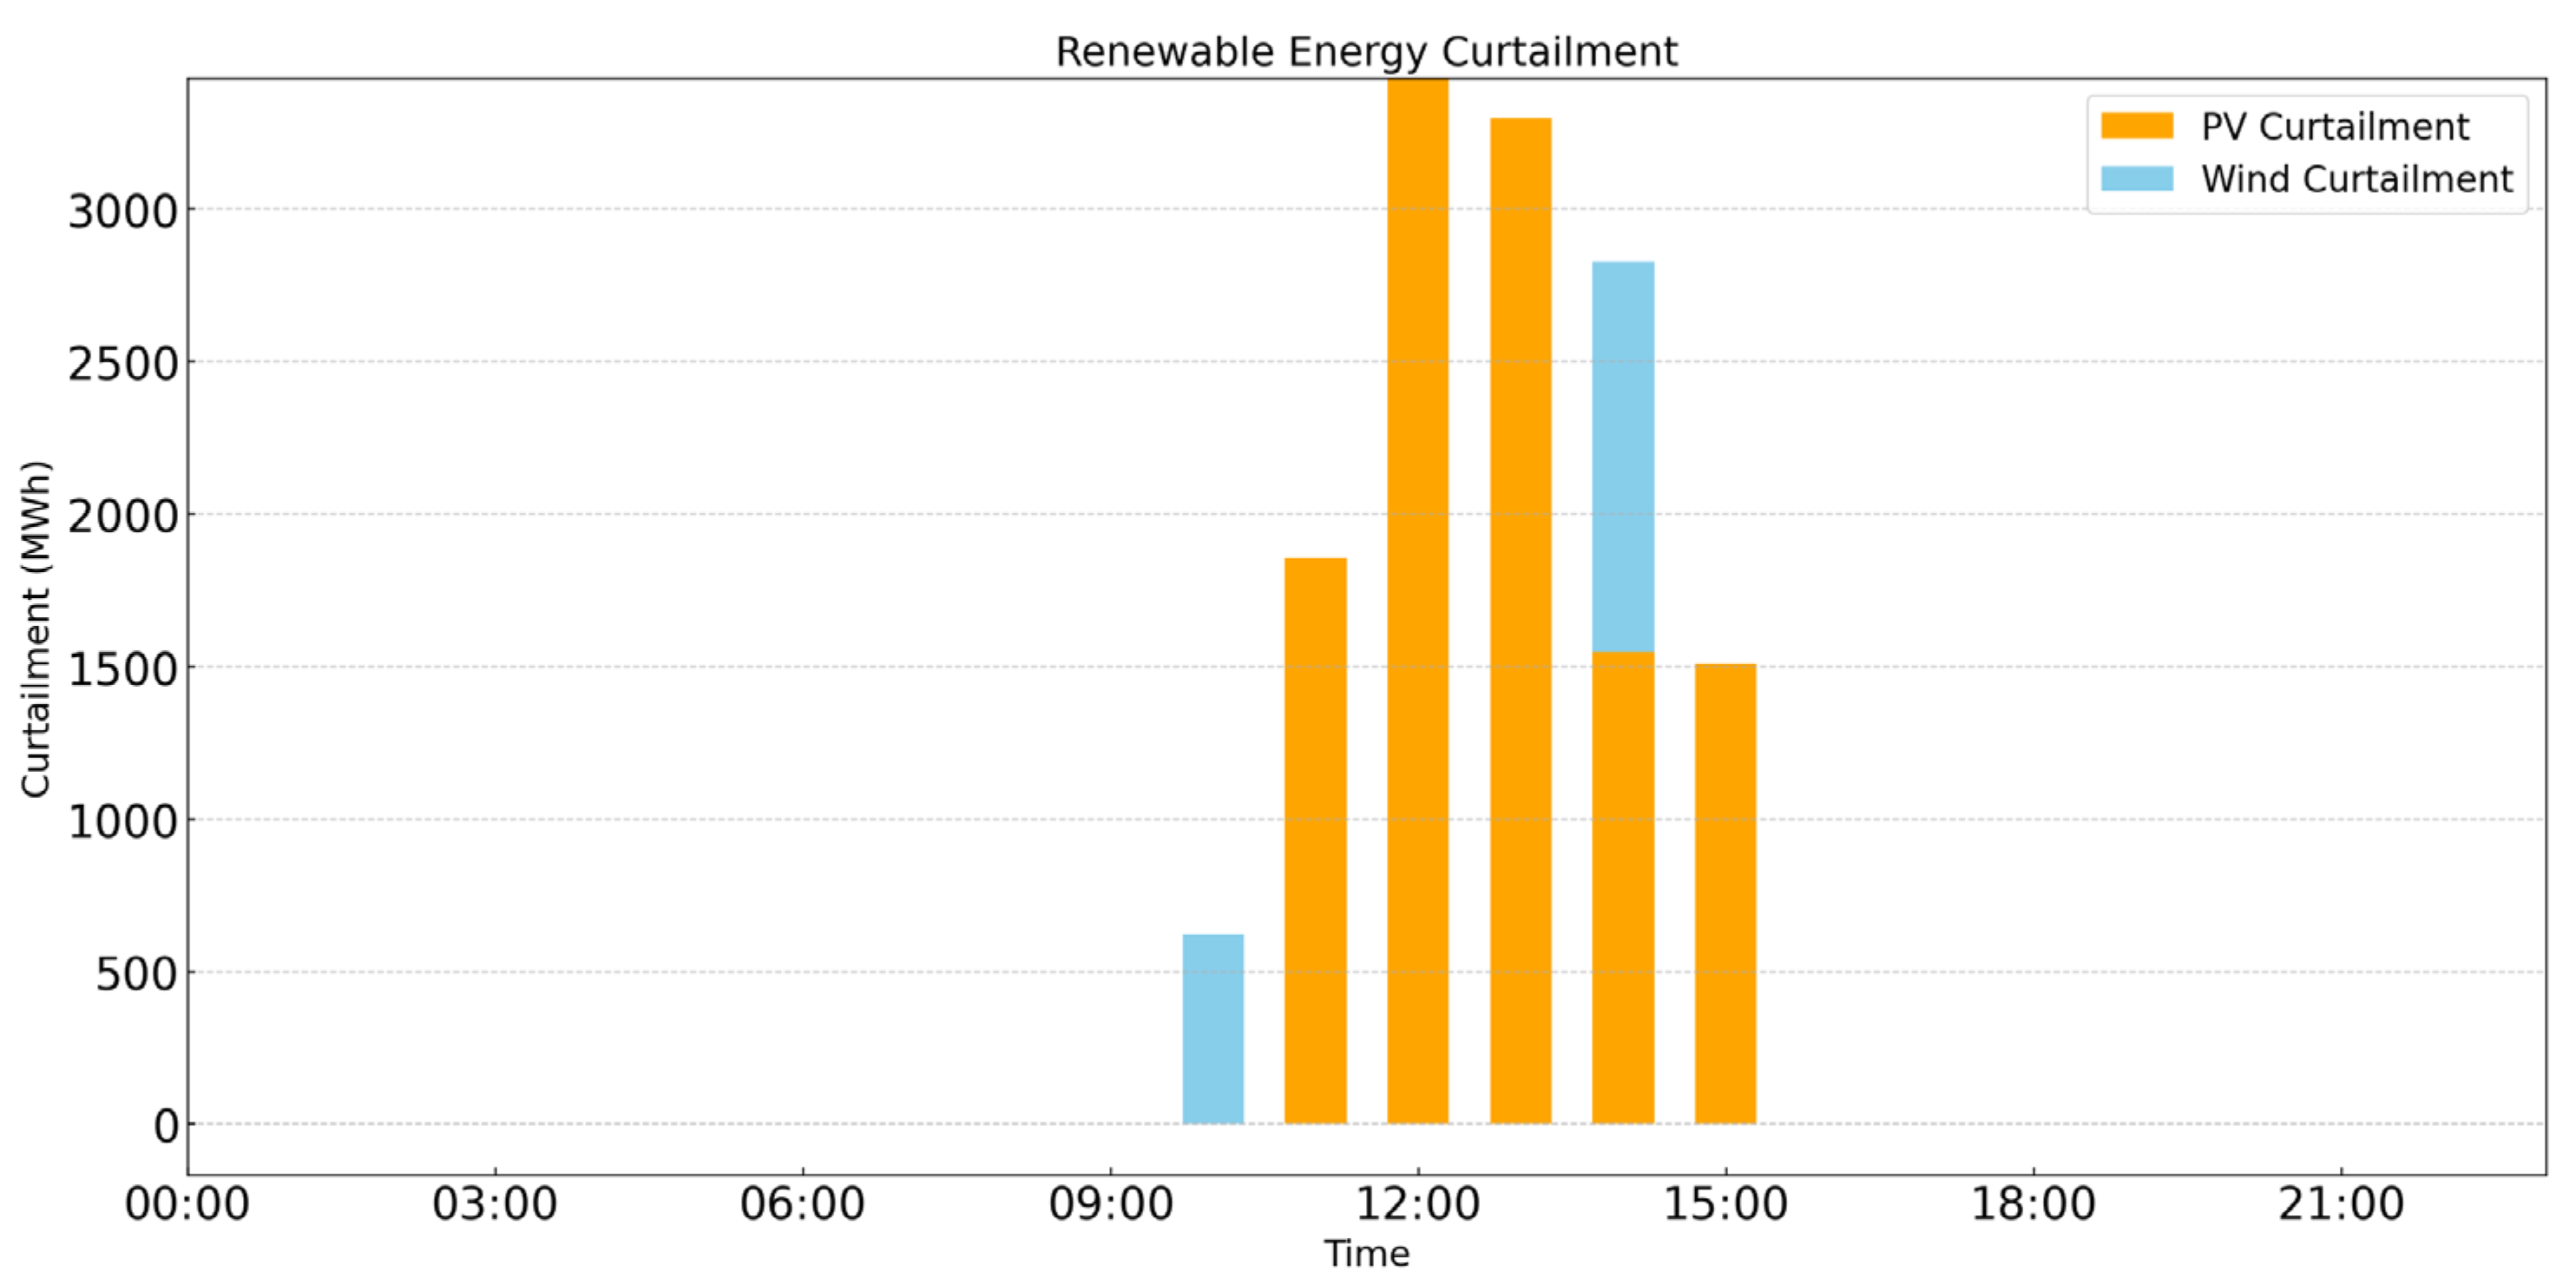
Wind and Solar Curtailment Curves for the Central Sample of Scenario 4 of the origin cluster.
As shown in Figure 10, during the peak PV output period from 09:00 to 16:00 at noon, the output of thermal power units was reduced to the minimum level. During the evening peak period, the system dispatched hydropower and pumped storage units to generate cooperatively, precisely covering the peak load and avoiding the activation of additional high-cost thermal units. During the low-load period at noon, large-scale pumping behavior occurred in the pumped storage system, which effectively utilized the surplus PV power and transferred energy to more valuable time periods.
As indicated in Figure 11, the pumped storage plant filled the gap between the load and PV output valleys. They operated in pumping mode during the midday period of high PV generation to absorb the excess solar energy.
As can be seen from Figure 12, significant PV and wind curtailment occurred between 10:00 and 15:00. This period coincided with the peak PV output when all pumped storage units were already operating at full pumping capacity. This indicates that although the system had dispatched all available energy storage resources to absorb the excess power, the renewable generation during this period still exceeded the total capacity for integration and regulation, resulting in unavoidable curtailment.
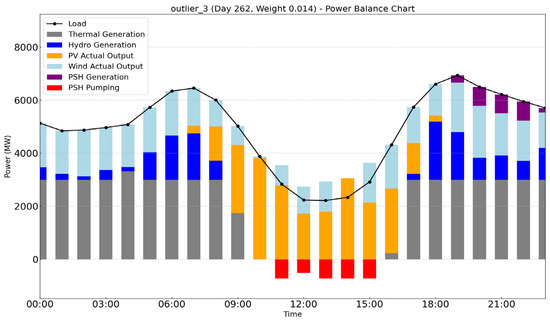
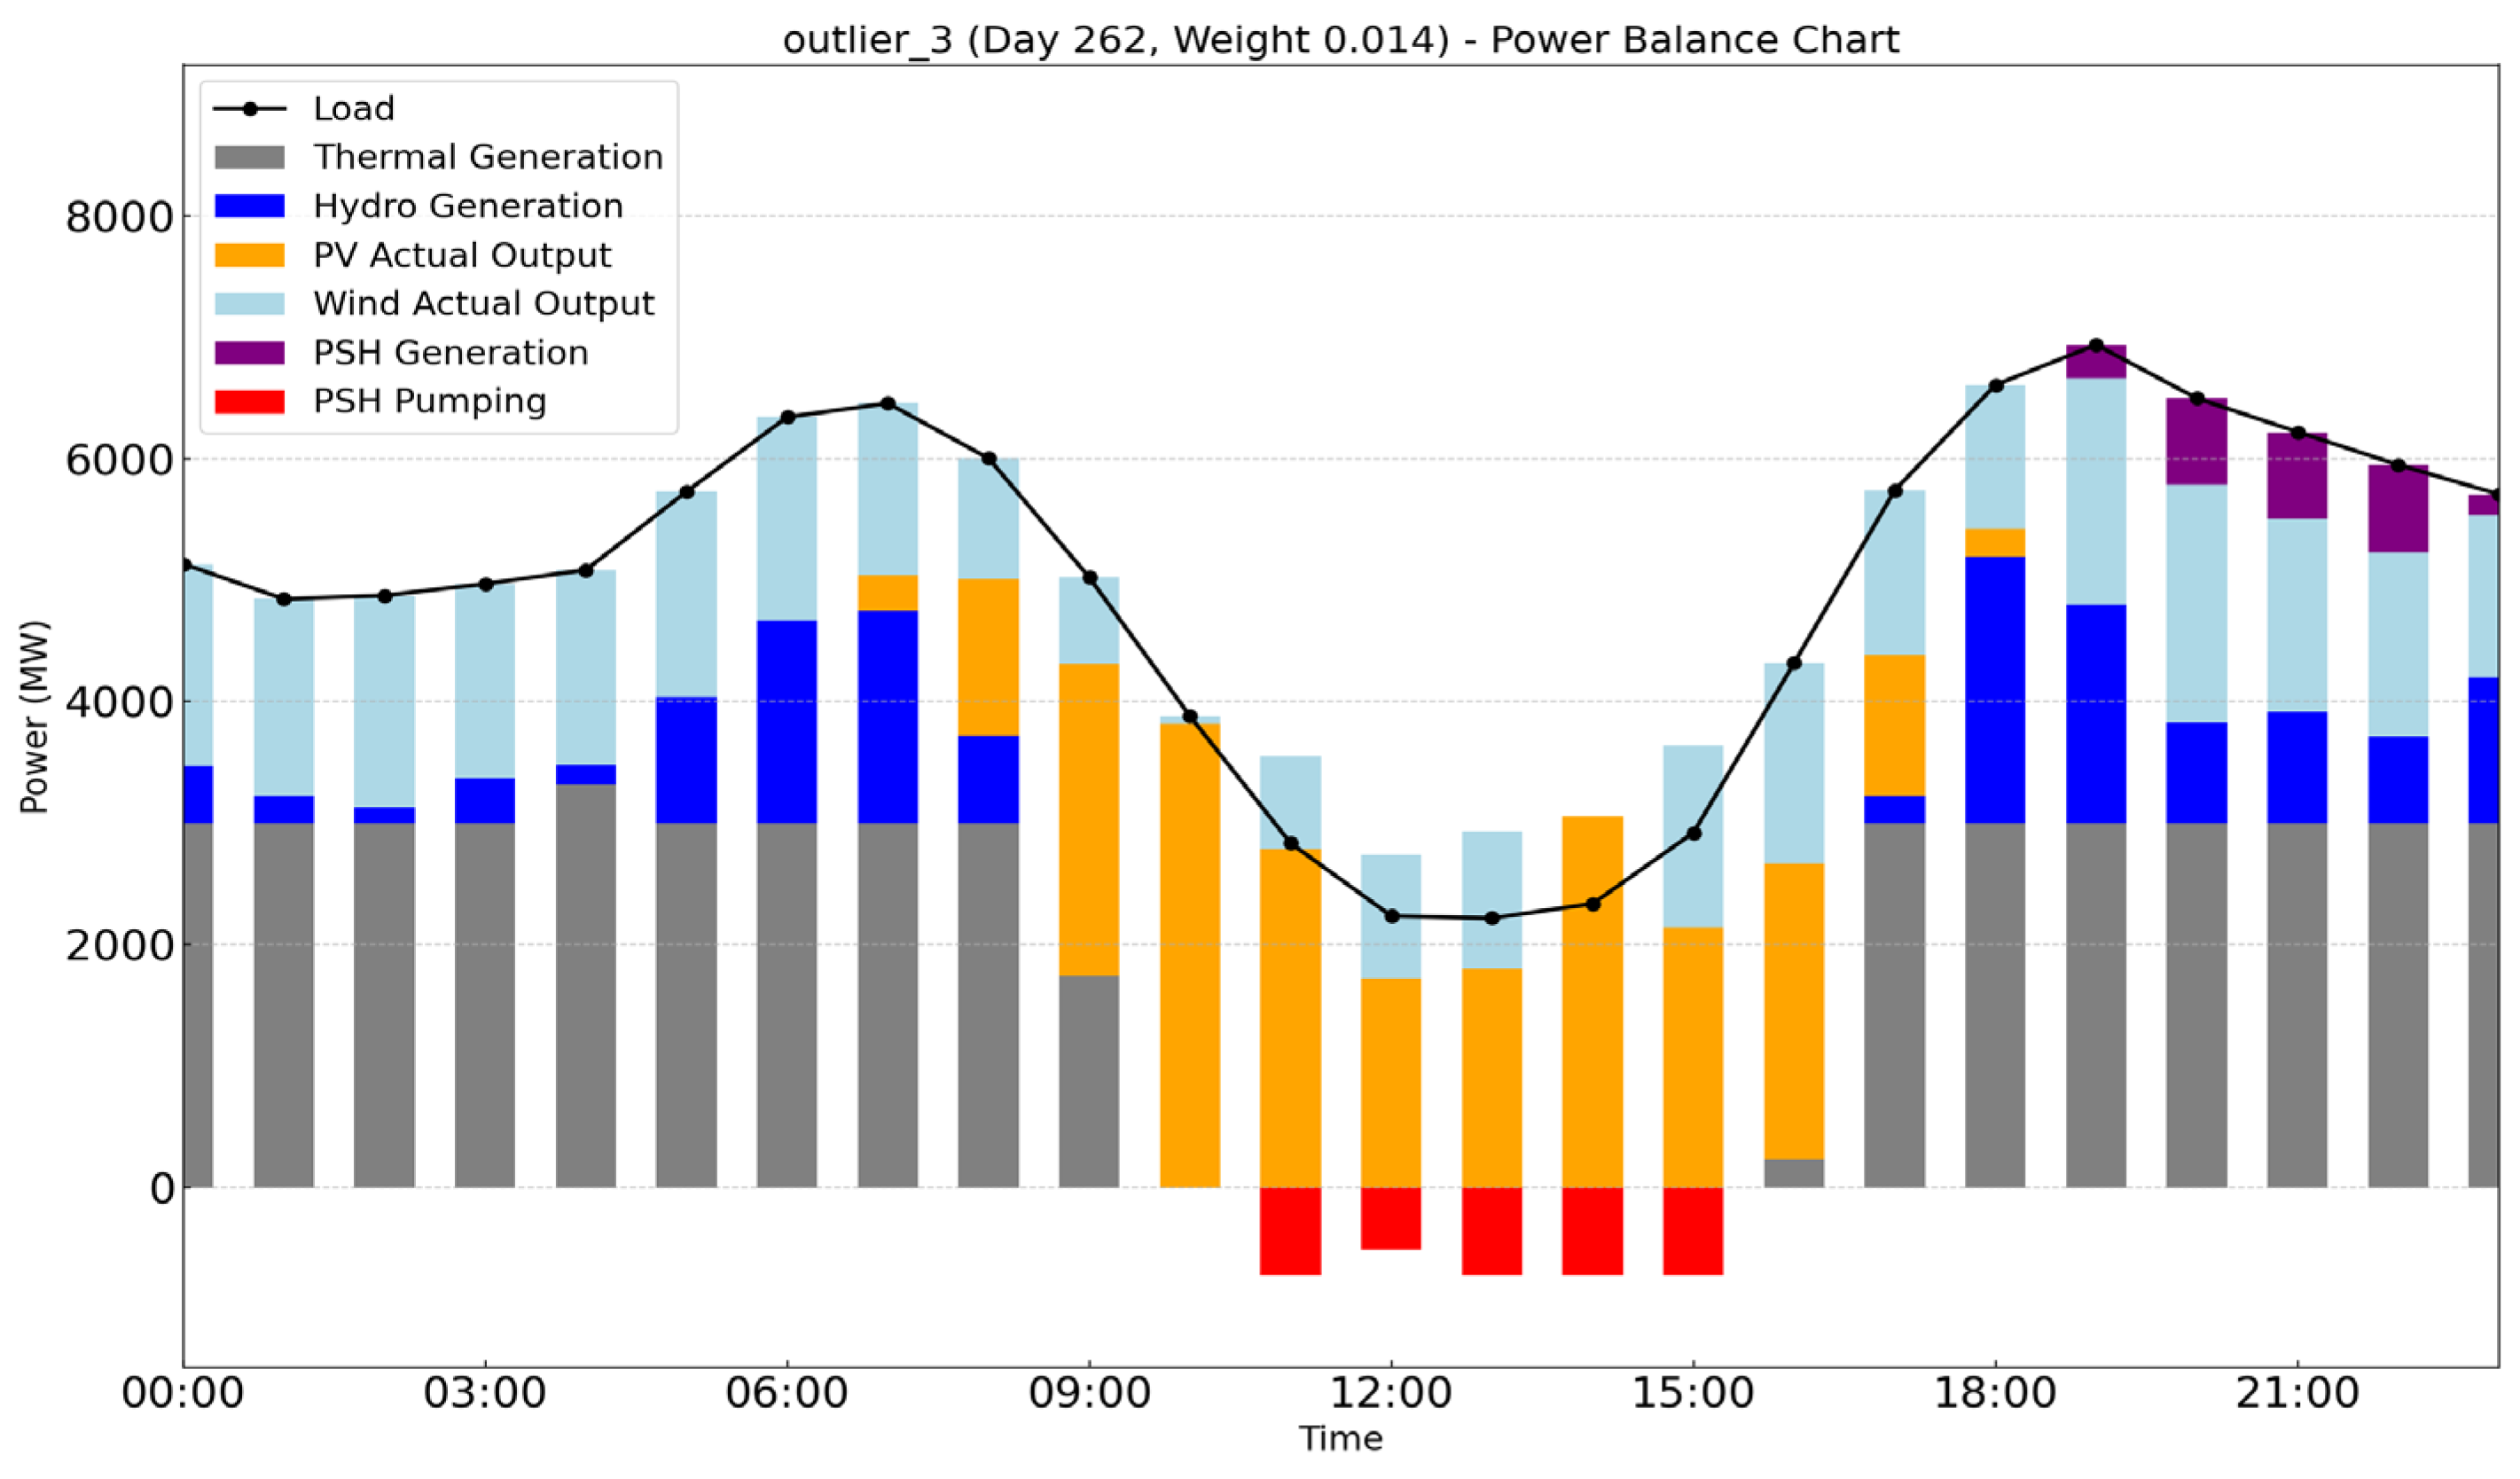
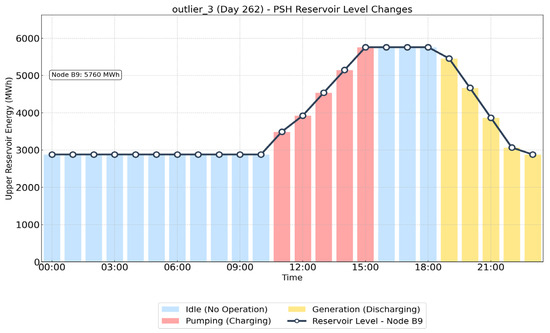
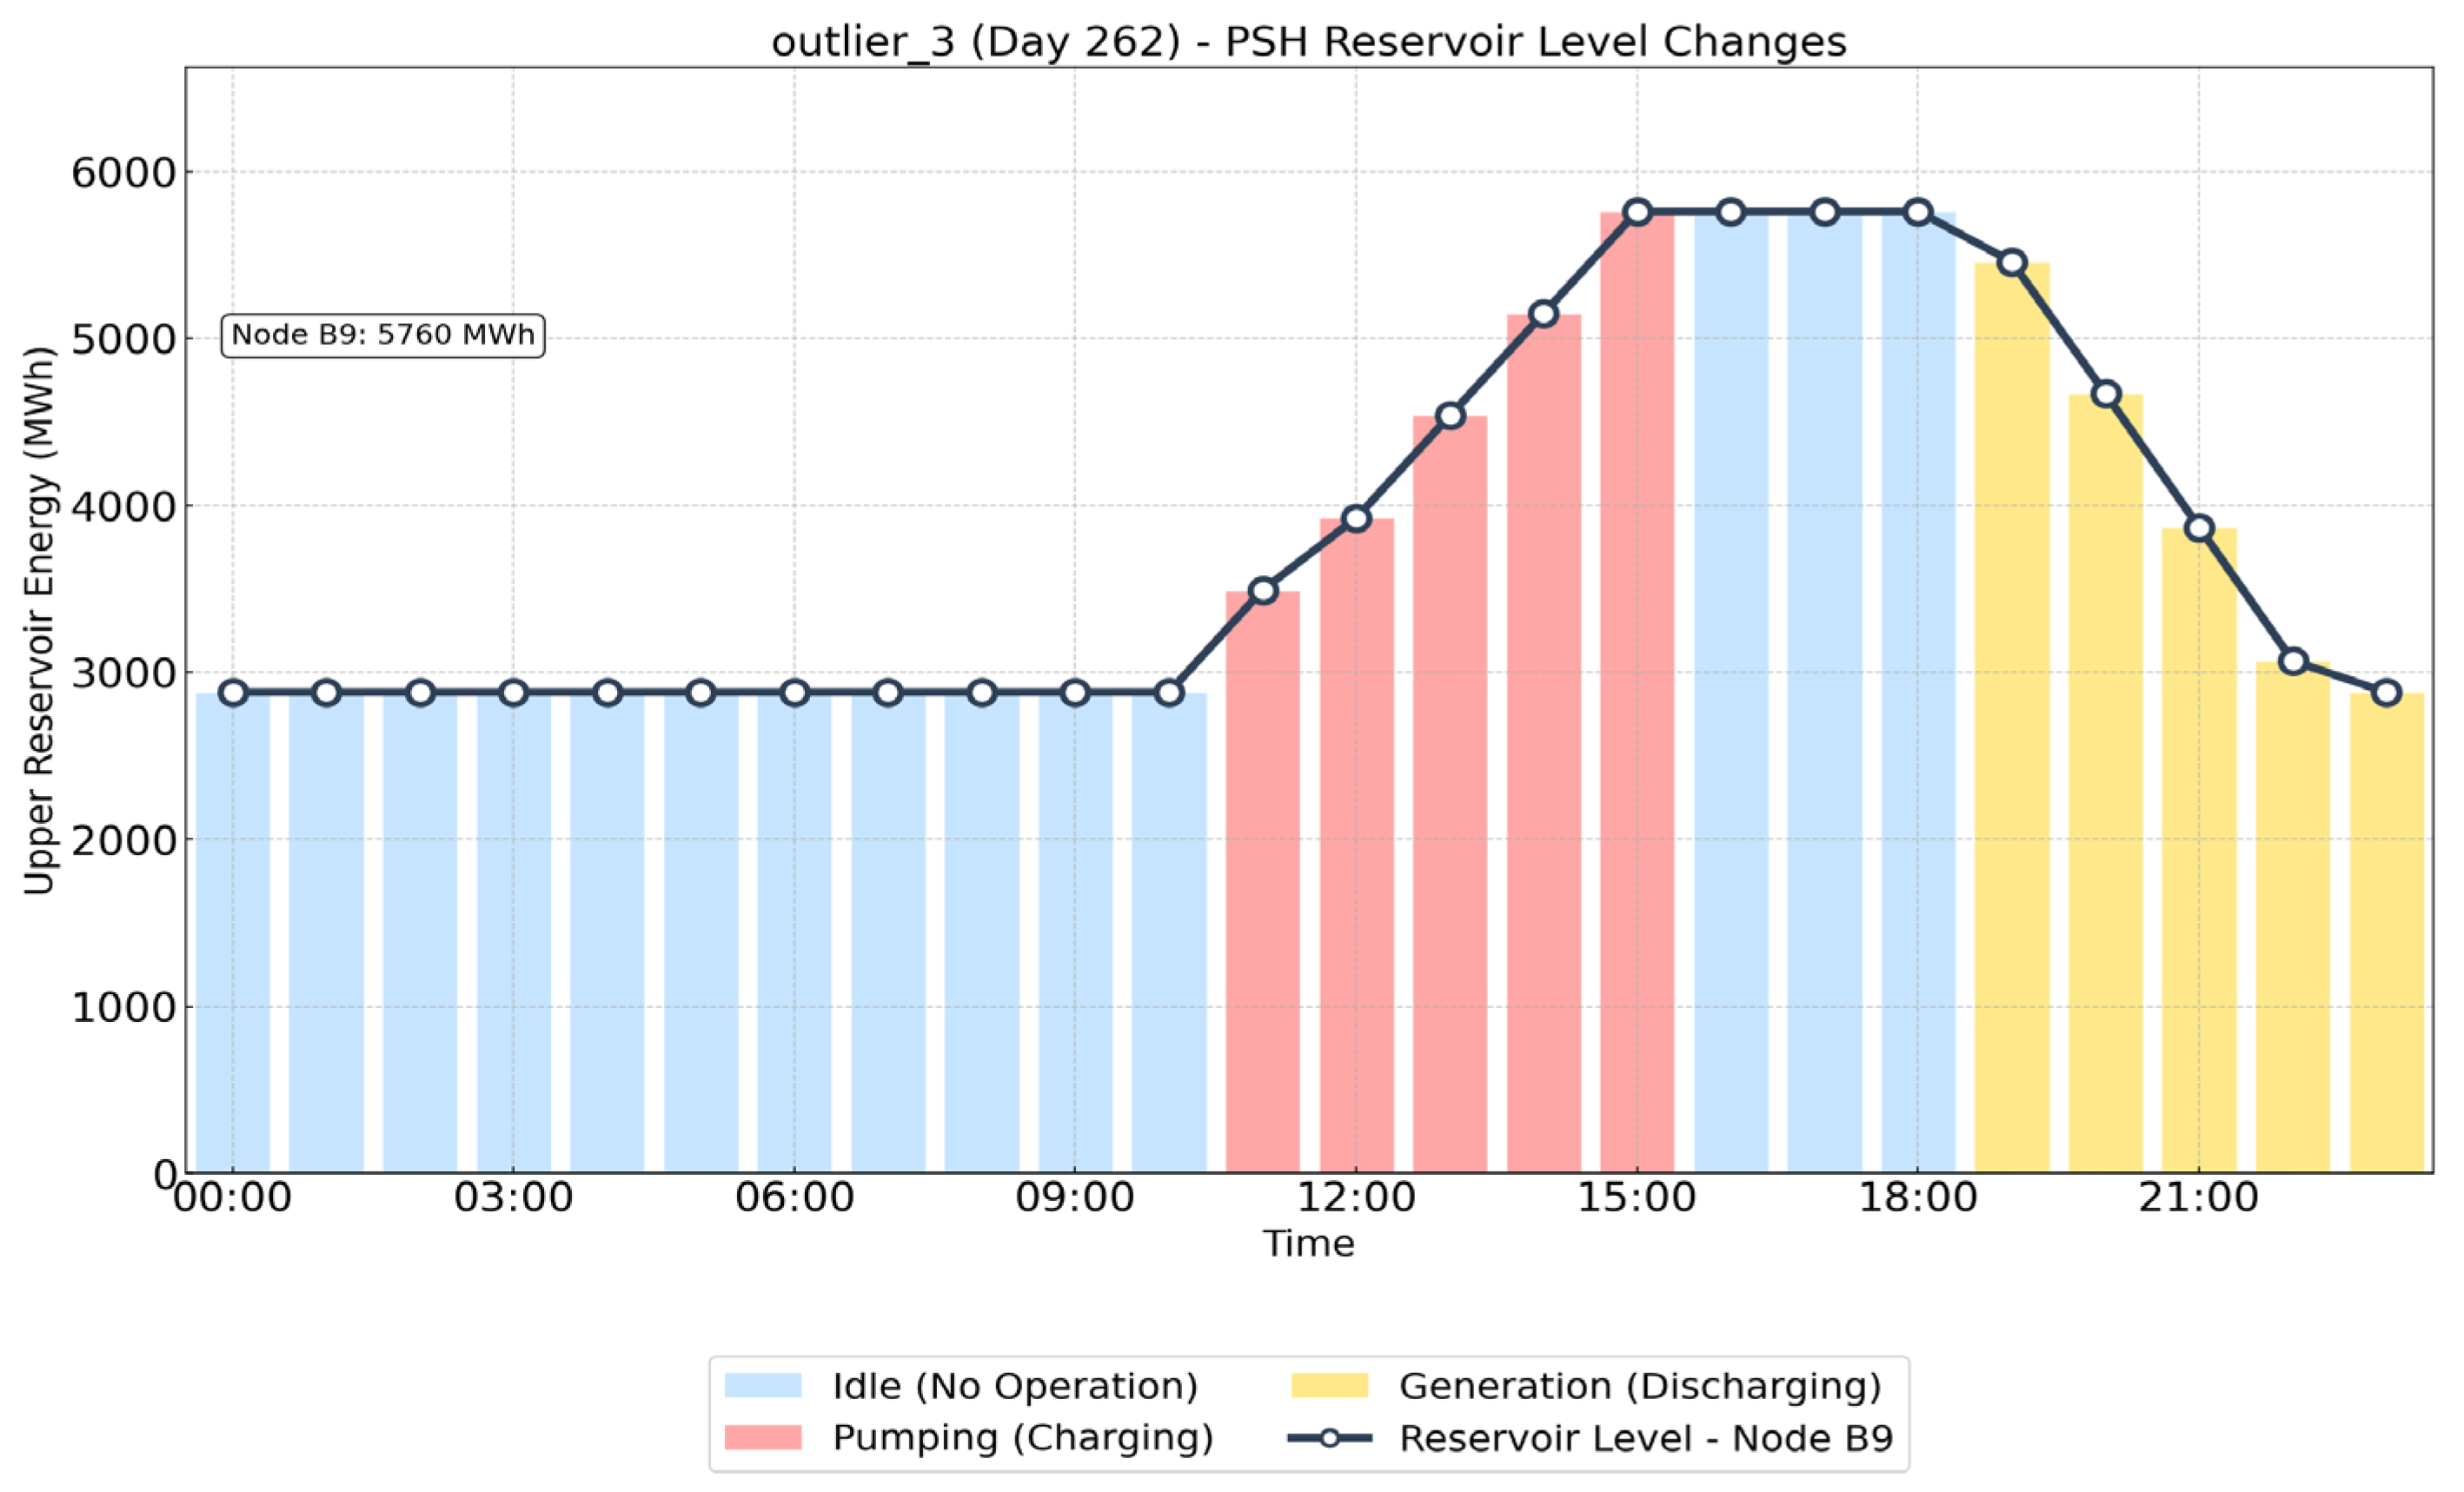
Furthermore, the core sample from outlier detection Scenario 3 (the 262nd day) was taken as an example. This sample occurred during autumn and represented a typical day characterized by clear skies, low wind, and photovoltaic-dominated generation. As shown in Figure 13, Figure 14 and Figure 15, the unit commitment and dispatch results under the optimal pumped storage investment scheme were clearly demonstrated.
Figure 13.
Operational Status of Various Units for the Central Sample of Scenario 3 of the outlier cluster.
Figure 14.
Effective Usable Energy Curve of the Upper Reservoir for the Central Sample of Scenario 3 of the outlier cluster.
Figure 15.
Wind and Solar Curtailment Curves for the Central Sample of Scenario 3 of the outlier cluster.
As shown in Figure 13, during the midday peak photovoltaic output period from 10:00 to 15:00, the output of thermal power units was suppressed to minimum levels. During the evening peak load period, the system dispatched hydropower and pumped storage units to generate cooperatively, precisely covering the peak load and avoiding the activation of additional high-cost thermal units. Throughout the midday low-load period, the pumped storage system exhibited large-scale pumping behavior, which effectively absorbed the surplus photovoltaic power and transferred energy to more valuable time periods.
Figure 14 indicates that the pumped storage plant filled the gap between load demand and photovoltaic output valleys. The plant maintained a continuous pumping operation during the period of high photovoltaic generation at midday, fully absorbing the excess solar energy.
As can be seen from Figure 15, significant photovoltaic and wind curtailment occurred between 10:00 and 15:00. This period coincided with the peak photovoltaic output when all pumped storage units were already operating at full pumping capacity. This demonstrated that although the system had dispatched all available energy storage resources to absorb the excess power, the renewable generation during this period still exceeded the system’s integration and regulation capacity, resulting in unavoidable curtailment.
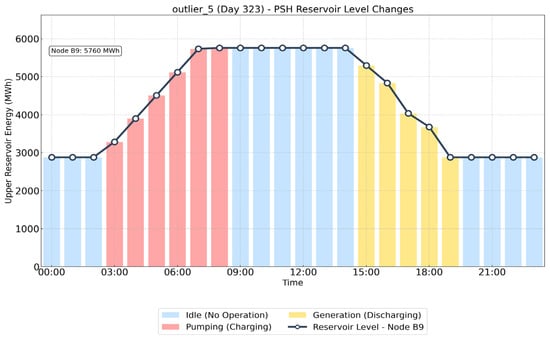
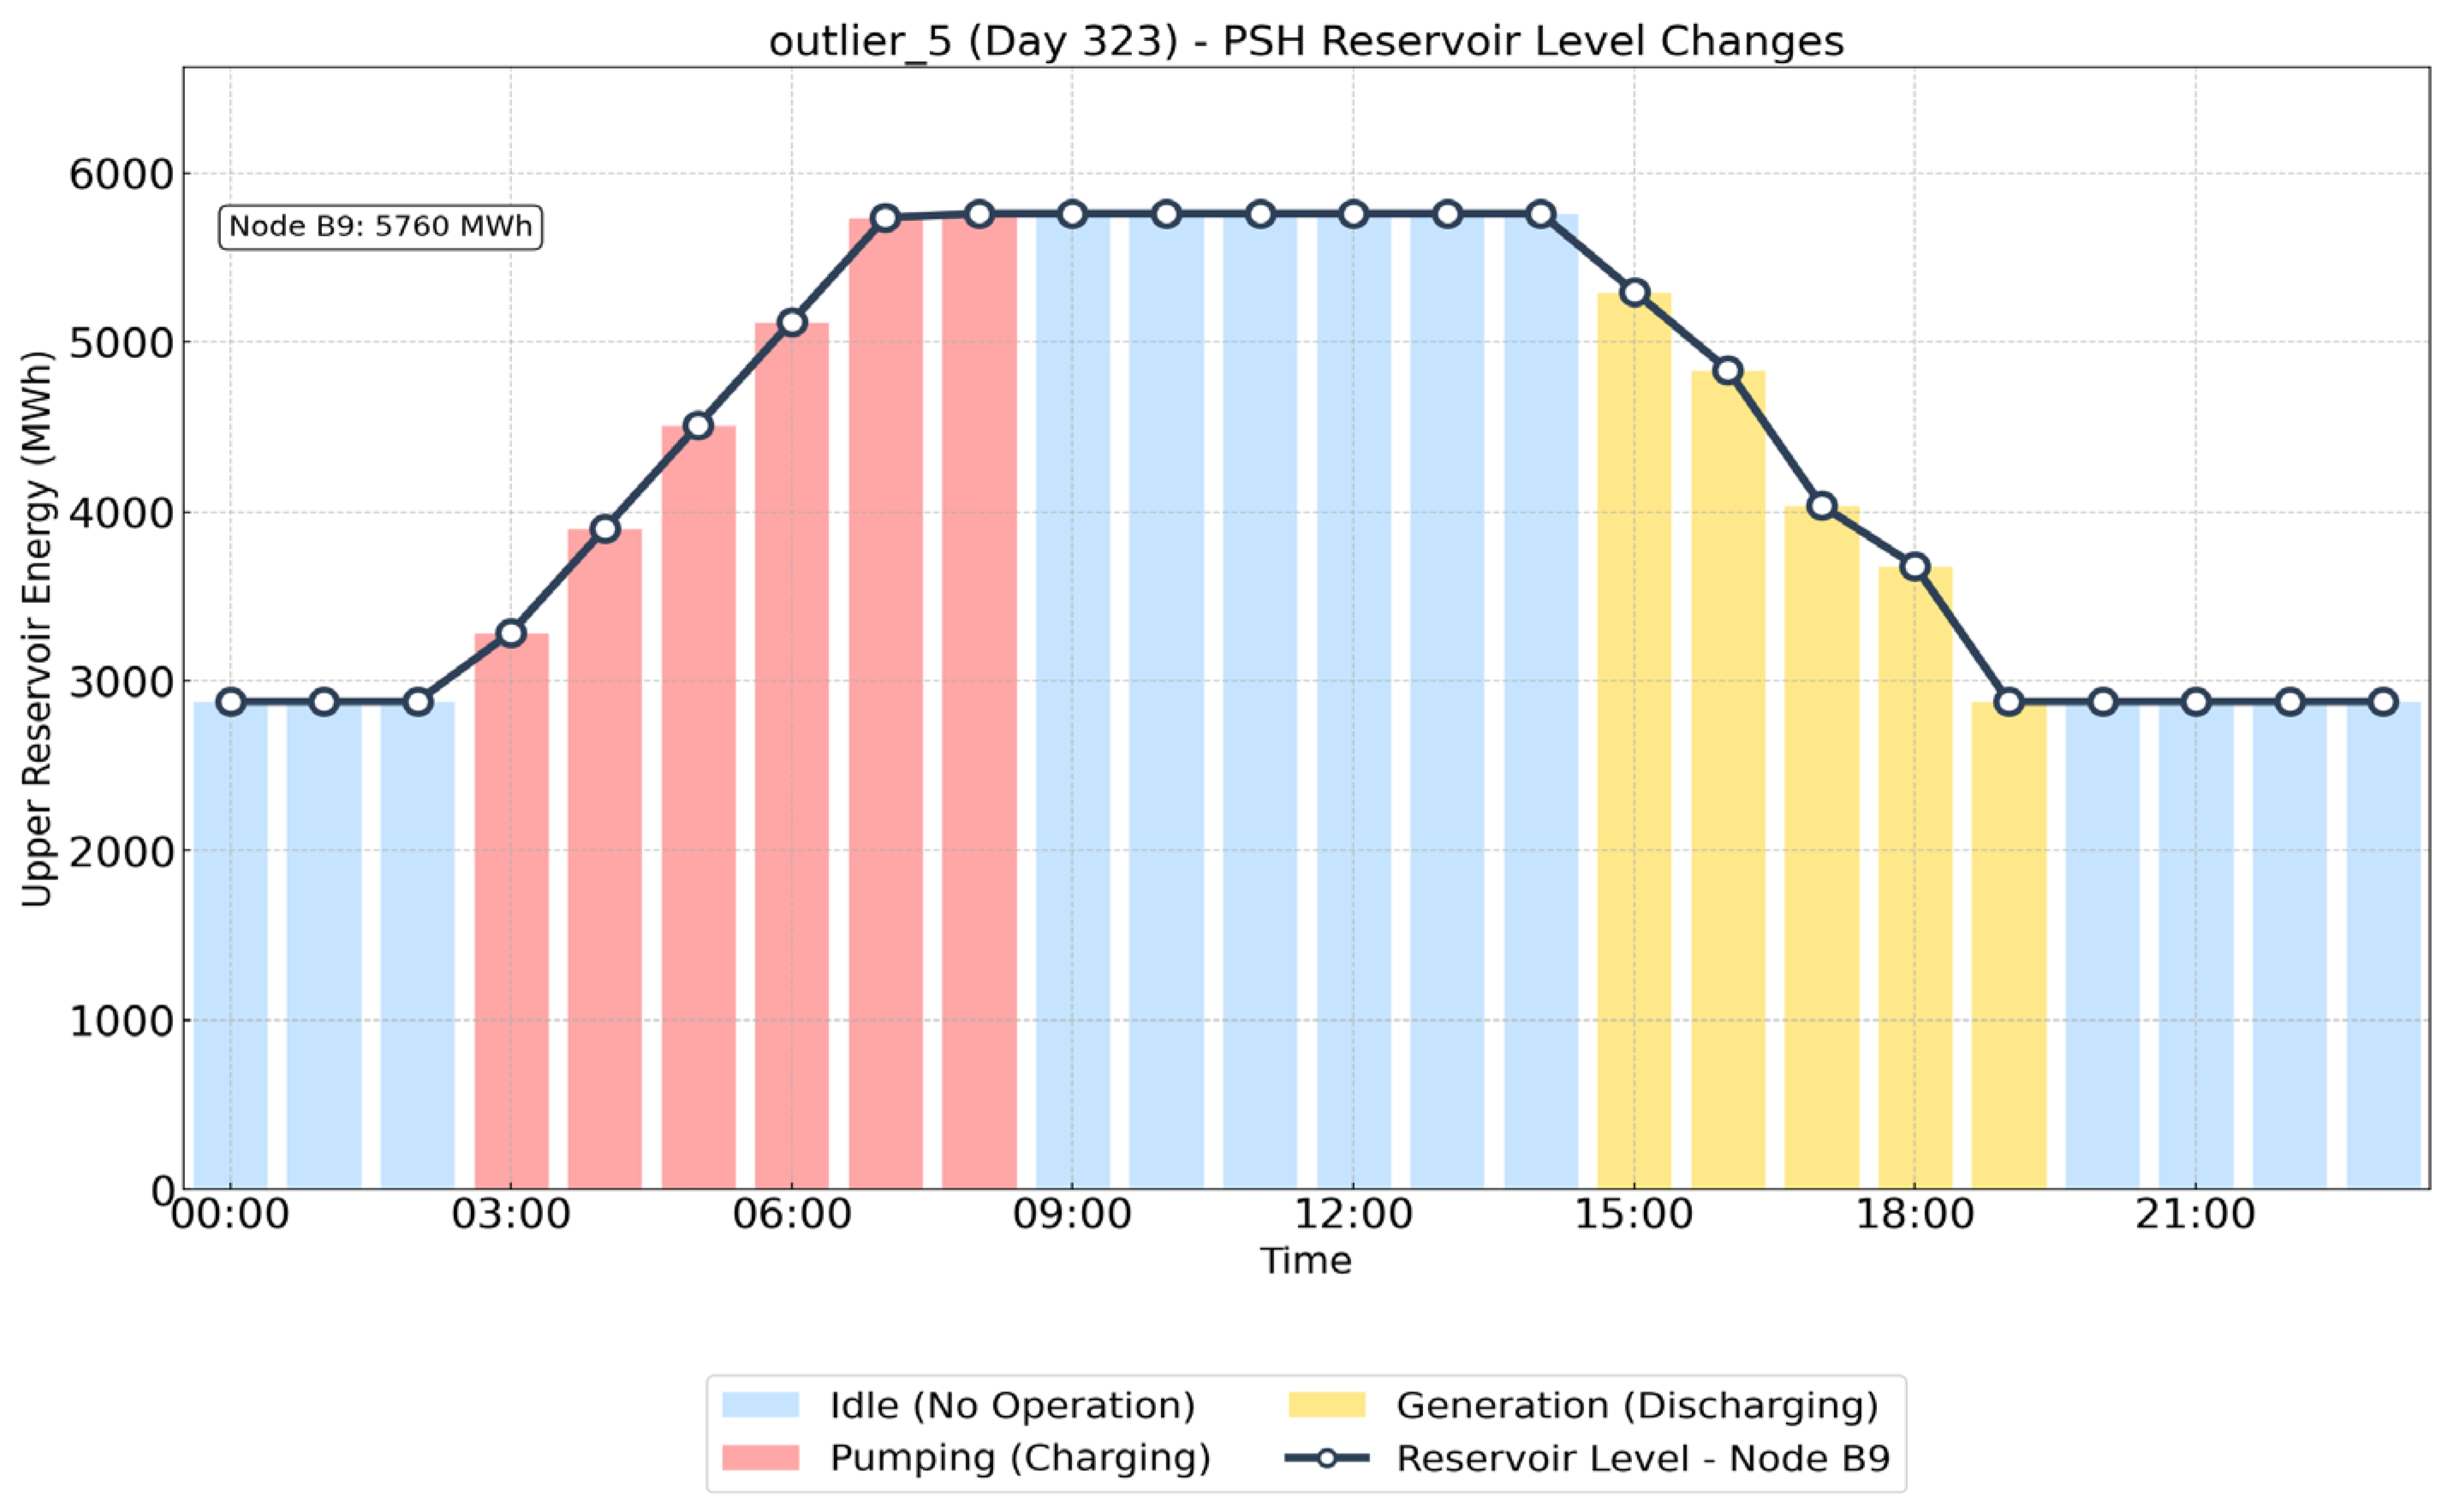
Similarly, taking Scenario 6 (Day 323) in outlier detection as an example, this sample represented a windy and rainy “wind-power-dominated” day. Due to the overcast and rainy weather, photovoltaic output remained extremely low throughout the day. However, wind resources were exceptionally abundant. Wind power output stayed very high, serving as the primary power source. The unit commitment simulation results under the optimal pumped storage investment scheme are shown in Figure 16 and Figure 17.
Figure 16.
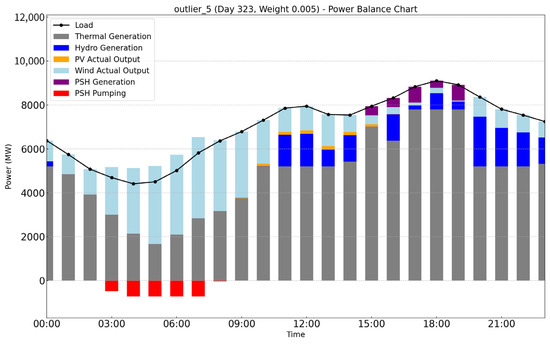
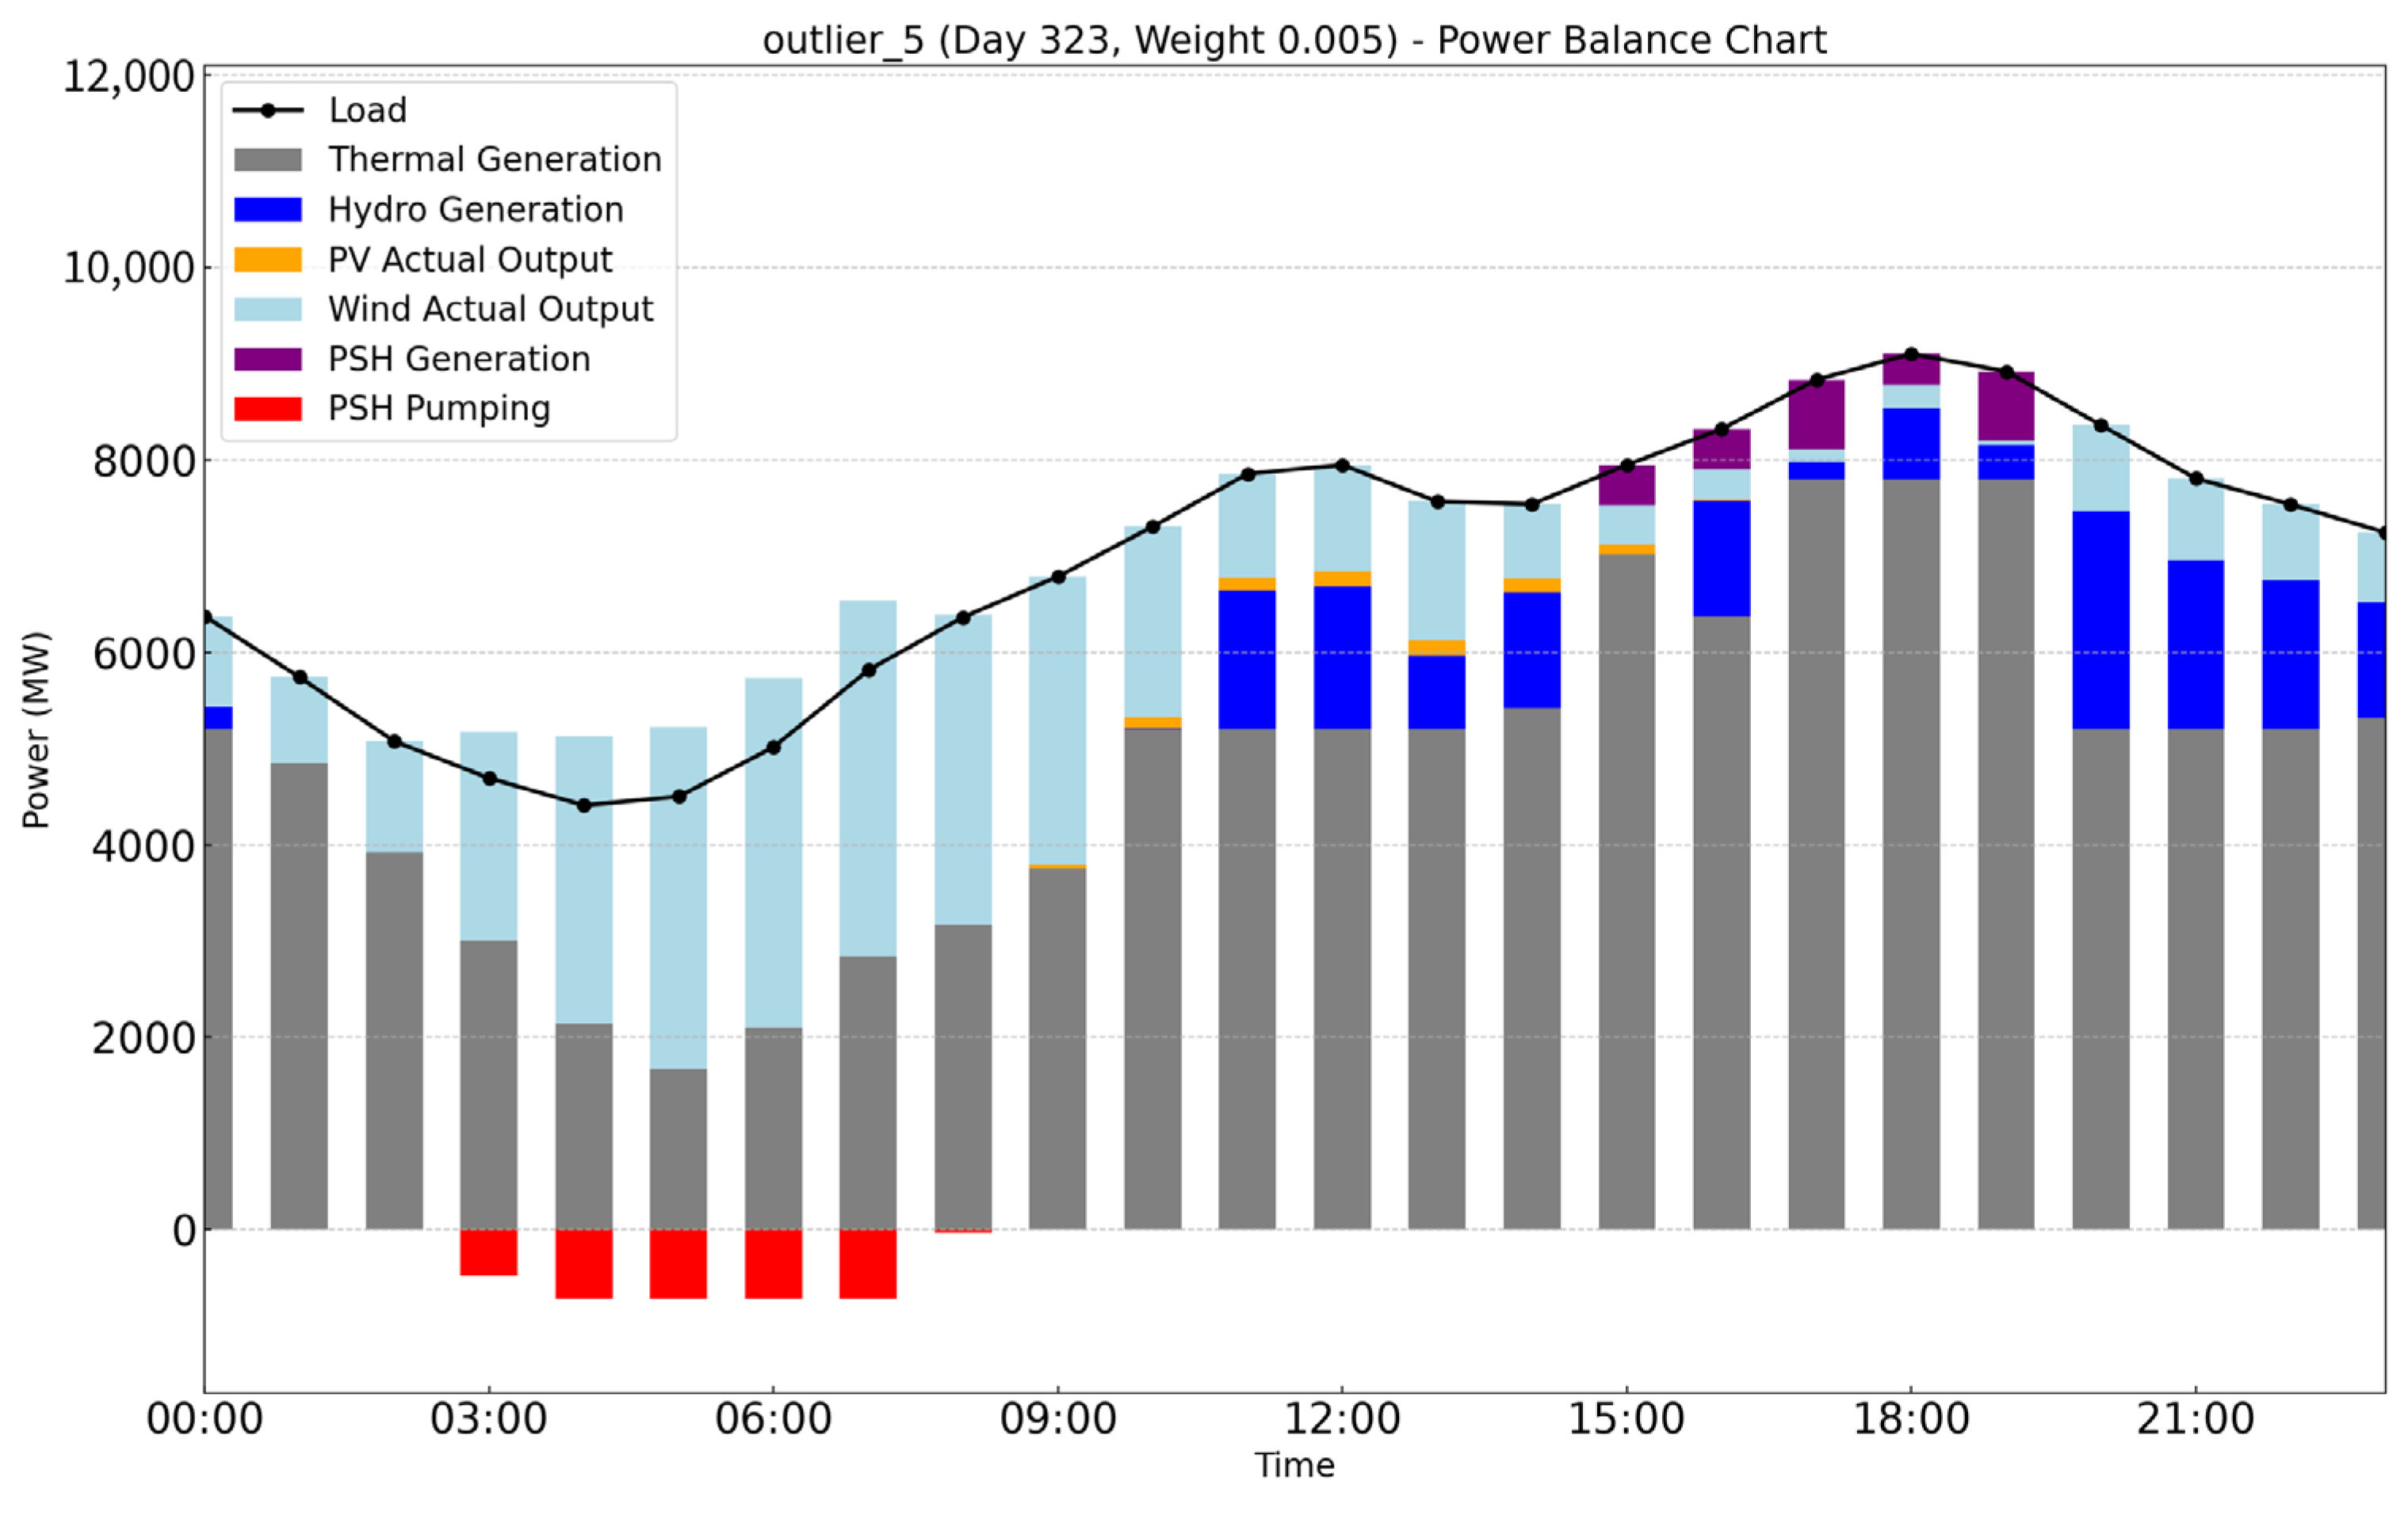
Operational Status of Various Units for the Central Sample of Scenario 6 of the outlier cluster.
Figure 17.
Effective Usable Energy Curve of the Upper Reservoir for the Central Sample of Scenario 6 of the outlier cluster.
As illustrated in Figure 1, wind power output peaked from 03:00 to 09:00. Thermal power was reduced to its minimum. The system load was also low during this period. Consequently, the system dispatched pumped storage units for pumping. This action effectively utilized the surplus wind energy. During the evening peak, hydro and pumped storage units were dispatched jointly. They precisely covered the peak load, avoiding the activation of more costly thermal units.
As shown in Figure 17, the pumped storage plant played a crucial role in balancing the system by filling the valley between the load and wind power generation. During the high-wind period from 03:00 to 09:00, the plant operated at full pumping capacity to absorb the excess wind energy that would otherwise have been curtailed. The stored energy was then discharged from 15:00 to 19:00 to support the system during the peak load period, effectively covering the supply-demand gap. Thanks to the flexible operation of the pumped storage plant, the excess renewable energy was fully utilized during low-load hours while ensuring a reliable power supply during peak demand. This two-phase operational strategy resulted in zero wind and solar curtailment and avoided any load shedding, demonstrating the effectiveness of pumped storage in achieving high renewable energy integration while maintaining system reliability.
5. Discussion
To validate the universality of the method proposed in this paper, the following analyses were conducted under different system configurations.
- 1.
- In the IEEE9 system with reduced transmission capacity between buses 8-9 and 9-4, the configured energy storage at B9 demonstrated a capacity of 6912.0 MWh and a power rating of 864.0 MW. The system achieved a renewable utilization rate of 94.69%, with PV and wind curtailment rates recorded at 6.02% and 4.75%, respectively. The comparison with the previous results was shown in Table 2.Table 2. Comparison of Line Capacity Reduction with the Original Plan.
- 2.
- Under a modified renewable penetration scenario in the IEEE9 system featuring 70% PV and 20% wind penetration, two storage facilities were deployed: B1 with 4000.0 MWh capacity and 500.0 MW power, and B2 with 7943.9 MWh capacity and 993.0 MW power. This configuration resulted in an improved renewable utilization rate of 95.91%, while PV and wind curtailment levels were maintained at 5.7% and 1.2%, respectively. The comparison with the previous results was shown in Table 3.Table 3. Comparison of the renewable energy penetration rate changes with the original plan.
- 3.
- In the IEEE39 system with balanced 60% PV and 60% wind penetration, a single storage unit at B36 (6912.0 MWh capacity, 864.0 MW power) supported the highest renewable utilization rate of 96.93% among all scenarios. The corresponding curtailment levels were observed at 7.5% for PV and 0.8% for wind power, demonstrating effective renewable integration under high penetration conditions. The comparison with the previous results was shown in Table 4.Table 4. Comparison of different penetration rates under the IEEE 39-node system with the original plan.
Simultaneously, this paper had certain limitations, suggesting directions for further research in the future:
- Future research will further integrate pumped storage with other energy storage systems and demand response mechanisms for collaborative optimization, aiming to explore the optimal flexibility portfolio at the system level.
- The method proposed in this paper could be further validated and applied in more complex power system environments in the future.
- The simulation calculations in this paper were conducted using only data from Belgium for the year 2024. Further research is needed for other regions worldwide with different loads and renewable generation characteristics.
6. Conclusions
This paper addressed the planning of pumped storage power stations in power systems with a high penetration of renewable energy. A bi-level stochastic planning model that considers both normal and abnormal operating scenarios is proposed, along with an efficient solution algorithm. The final outcome was a pumped storage planning scheme that synergistically enhances system economy, power supply reliability, and renewable energy integration capability. The main research conclusions were as follows:
- A “clustering—anomaly detection—re-clustering” scenario combination optimization framework was proposed. Based on historical data from Belgium in 2024, the Affinity Propagation (AP) clustering algorithm was first used to objectively identify conventional operating conditions of wind, solar, and load. Furthermore, potential abnormal operating days were identified and extracted using the Isolation Forest algorithm. Ultimately, a comprehensive scenario set that fully characterizes system operational uncertainty was constructed, comprising 6 scenarios from conventional clustering and 6 scenarios from abnormal clustering, resulting in a total of 12 typical operating scenarios.
- Based on the above comprehensive scenario set, a bi-level stochastic planning model integrating investment decision-making for pumped storage power stations with multi-scenario operational simulation was constructed. The outer-level model aimed for the investment economy, considering constraints such as the construction capacity of the pumped storage power station. The inner-level model adopted a Max–Min bi-level structure: the Max layer generated a scenario set covering all types of operational characteristics through scenario combination optimization under the condition of maximizing scenario dissimilarity; the Min layer aimed to minimize system operating costs, renewable energy curtailment, and load shedding, while considering constraints such as line power flow, unit operational security, renewable energy integration, and power supply reliability.
- An improved Benders decomposition algorithm was proposed, which incorporates a heuristic feasible cut update mechanism to enhance solution efficiency. This algorithm was applied to solve the above multi-scenario planning model for pumped storage. The final solution determined the construction of a pumped storage power station at node B9 with a capacity of 5760 MW. Optimization results indicate that the system’s renewable energy integration rate can reach 96.73%, with a solar curtailment rate of 6.6% and a wind curtailment rate of 0.7%. No active load shedding occurred throughout the year, demonstrating good comprehensive operational performance.
This research provides important technical support for the sustainable development of power systems with high renewable energy penetration through its innovative planning methodology. The proposed multi-scenario planning framework effectively enhances the system’s adaptability to extreme weather and operational uncertainties, significantly improving renewable energy integration and power supply reliability. These contributions are highly aligned with global energy transition and climate resilience goals. The research not only advances the theory and tools for clean energy planning but also offers practical solutions for achieving the United Nations Sustainable Development Goals, demonstrating significant practical value for building resilient and sustainable energy systems.
Author Contributions
Conceptualization, X.J., J.D. and Y.Y.; Writing—original draft, X.L. (Xiao Li) and T.Z.; Writing—review and editing, B.L. and F.T.; Funding acquisition, X.L. (Xu Ling) and Y.W. All authors have read and agreed to the published version of the manuscript.
Funding
This research was supported by the State Grid Corporation Headquarters Science and Technology Project “Research on Safety Impact, Resource Allocation, and Market Mechanisms of Ultra-Large-Scale Pumped Storage Bases Supporting Regional New Power Systems” (Grant No. 529925250006-037-ZN).
Institutional Review Board Statement
Not applicable.
Informed Consent Statement
Not applicable.
Data Availability Statement
The data utilized in this paper were sourced from 366 days of operational data for the year 2024, publicly provided by Elia, the Belgian electricity transmission system operator.
Conflicts of Interest
Authors Xu Ling and Wang Ying are employed by the company State Grid Corporation of China, Central China Branch. The remaining authors declare that the research was conducted in the absence of any commercial or financial relationships that could be construed as a potential conflict of interest.
Abbreviations
The following abbreviations are used in this manuscript:
| load hosting capacity | |
| solar PV hosting capacity | |
| wind power hosting capacity | |
| value of the i sample in the j feature dimension | |
| denotes the standard deviation of the j feature dimension | |
| denotes the mean of the j feature dimension | |
| represents the standardized value | |
| daily sample set index | |
| total number of scenarios | |
| centroid sample of scenarios | |
| the total cost | |
| set of composite scenarios | |
| set of power system buses | |
| unit investment cost of pumped hydro storage at bus | |
| a continuous variable denoting the capacity of pumped hydro storage invested and constructed at bus | |
| total number of days in the planning period | |
| probability or weight of scenario s | |
| expected daily operating cost under scenario s given investment decision | |
| minimum allowable investment capacities for pumped storage at bus b | |
| maximum allowable investment capacities for pumped storage at bus b | |
| a binary variable that equaled 1 if a decision was made to invest in and construct pumped storage at bus b, and 0 otherwise | |
| a binary variable that equaled 1 if bus b was determined to be a candidate node for pumped storage construction, and 0 otherwise | |
| investment decision from the previous iteration | |
| optimal operational cost under scenario s for that investment decision | |
| dual variable associated with the pumped storage capacity constraint in the subproblem | |
| feasibility cut amplification factor | |
| iteration number | |
| total investment reference value | |
| relative error | |
| absolute error | |
| relative tolerance | |
| absolute tolerance | |
| comprehensive cost | |
| active power output of thermal unit i at time t | |
| generation cost coefficient of thermal unit i | |
| penalty costs for wind and solar curtailment in time period t | |
| penalty costs for load shedding in time period t | |
| active power output of hydropower unit h at time t | |
| actual grid-injection power of photovoltaic plant pv at time t | |
| actual grid-injection power of wind turbine wt at time t | |
| generation power of the pumped storage plant at bus b at time t | |
| pumping power of the pumped storage plant at bus b at time t | |
| net load power at b at time t | |
| load shedding power at b at time t | |
| power flowe (b, n) leaving node b at time t | |
| lower output limits of thermal unit i | |
| upper output limits of thermal unit i | |
| ramping power limit of thermal unit i | |
| total daily energy generation of hydropower unit h | |
| effective stored energy of the upper reservoir at bus b and time t | |
| storage capacity coefficient of the pumped storage plant | |
| invested effective capacity of pumped storage at bus b | |
| maximum pumping power of the pumped storage plant | |
| generating power of the pumped storage plant | |
| binary variables representing the generating statuses | |
| binary variables representing the pumping statuses | |
| the maximum allowable daily number of pumping start-ups | |
| the maximum allowable daily number of generating start-ups | |
| wind power curtailment | |
| utility-scale photovoltaic power curtailment | |
| minimum allowable integration rate | |
| maximum allowable load shedding rate |
References
- Ma, C.; Lu, L. Optimal capacity configuration of hydro-wind-PV hybrid system and its coordinative operation rules considering the UHV transmission and reservoir operation requirements. Renew. Energy 2022, 198, 637–653. [Google Scholar] [CrossRef] [Scilit]
- Medium- and Long-Term Development Plan for Pumped Storage Energy (2021–2035). Available online: https://zfxxgk.nea.gov.cn/2021-09/17/c_1310193456.htm (accessed on 31 August 2025).
- Zisos, A.; Sakki, G.K.; Efstratiadis, A. Mixing renewable energy with pumped hydropower storage: Design optimization under uncertainty and other challenges. Sustainability 2023, 15, 13313. [Google Scholar] [CrossRef] [Scilit]
- Refaat, M.M.; Al-Gahtani, S.F.; Bassi, H.; Ali, Z.M.; Aleem, S.H.A. Optimizing power network expansion with pumped hydro energy storage using a multi-objective enhanced spider wasp optimizer approach. Sci. Rep. 2025, 15, 13409. [Google Scholar] [CrossRef] [Scilit]
- Castorino, G.A.M.; Dahlquist, E.; Kyprianidis, K.; Losi, E.; Manservigi, L.; Pinelli, M.; Renuke, A.; Spina, P.R.; Venturini, M. Optimization of sizing and operation of pumped hydro storage plants under current and future economic scenarios. J. Energy Storage 2025, 119, 116130. [Google Scholar] [CrossRef] [Scilit]
- Zhang, Y.; Hua, Q.S.; Sun, L.; Liu, Q. Life Cycle Optimization of Renewable Energy Systems Configuration with Hybrid Battery/Hydrogen Storage: A Comparative Study. J. Energy Storage 2020, 30, 101470. [Google Scholar] [CrossRef] [Scilit]
- He, T.; Cao, Y.; Zhou, K.; Ma, Y.; Si, F. Thermodynamic analysis and multi-objective optimization of a compressed carbon dioxide energy storage system coupled with a coal-fired power plant. J. Energy Storage 2026, 141, 119276. [Google Scholar] [CrossRef] [Scilit]
- An, Y.; Feng, B.; Li, M.; Gao, X.; Wang, H.; Li, J. Research on peak-valley optimization of distributed photovoltaic energy storage systems based on an improved particle swarm algorithm. Int. J. Thermofluids 2025, 30, 101443. [Google Scholar] [CrossRef] [Scilit]
- He, M.; Chen, X. Anomaly detection algorithm for big data based on isolation forest algorithm. J. Comput. Methods Sci. Eng. 2025, 25, 4143. [Google Scholar] [CrossRef] [Scilit]
- Saremi, M.; Hezarkhani, A.; Mirzabozorg, S.A.A.S.; DehghanNiri, R.; Shirazy, A.; Shirazi, A. Unsupervised Anomaly Detection for Mineral Prospectivity Mapping Using Isolation Forest and Extended Isolation Forest Algorithms. Minerals 2025, 15, 411. [Google Scholar] [CrossRef] [Scilit]
- Fazlollahi, S.; Bungener, S.L.; Mandel, P.; Becker, G.; Maréchal, F. Multi-objectives, multi-period optimization of district energy systems: I. Selection of typical operating periods. Comput. Chem. Eng. 2014, 65, 54–66. [Google Scholar] [CrossRef] [Scilit]
- Xu, Q.; Shi, T.; Jing, H.; Yao, W.; Mo, S.; Zhao, H.; Wen, J. Joint Planning of Transmission Network and Distributed Variable Speed Pumped Storage for New Power System. Power Syst. Prot. Control 2024, 52, 128–137. [Google Scholar]
- Chen, Y.; Xu, Z.; Wang, J. A Two-Stage Robust Transmission Expansion Planning Model Considering Extreme Weather Events. IEEE Trans. Power Syst. 2023, 38, 485–498. [Google Scholar] [CrossRef] [Scilit]
- Zatti, M.; Gabba, M.; Freschini, M.; Rossi, M.; Gambarotta, A.; Morini, M.; Martelli, E. k-MILP: A novel clustering approach to select typical and extreme days for multi-energy systems design optimization. Energy 2019, 181, 1051–1063. [Google Scholar] [CrossRef] [Scilit]
- Kantor, I.; Robineau, J.L.; Bütün, H.; Marechal, F. A mixed-integer linear programming formulation for optimizing multi-scale material and energy integration. Front. Energy Res. 2020, 8, 49. [Google Scholar] [CrossRef] [Scilit]
- Yuan, H.; Xie, L.; Li, Y. A Strengthened Benders Decomposition for AC Optimal Power Flow Integrated in Distribution Network Planning. IEEE Trans. Power Syst. 2024, 39, 1234–1247. [Google Scholar]
- Pecci, F.; Jenkins, J.D. Regularized benders decomposition for high performance capacity expansion models. IEEE Trans. Power Syst. 2025; early access.
- de Oliveira, E.J.; de Paula, A.N.; de Oliveira, L.W.; Honório, L.D.M. Block-Based Multicut Benders Decomposition Algorithm for Transmission and Energy Storage Co-Planning. Int. Trans. Electr. Energy Syst. 2022, 2022, 6289475. [Google Scholar] [CrossRef] [Scilit]
- Chen, X.; Kang, C.; O’Malley, M. Solving Integrated Electricity-Gas System Planning via a Stochastic Benders Decomposition Approach. Appl. Energy 2024, 355, 122301. [Google Scholar]
- Open Data. Available online: https://opendata.elia.be/explore (accessed on 28 August 2025).
- Frey, B.J.; Dueck, D. Clustering by passing messages between data points. Science 2007, 315, 972–976. [Google Scholar] [CrossRef] [Scilit]
- Wang, C.; Zhang, K.; Liu, Y. Anomaly Detection for Photovoltaic Power Generation Based on Isolation Forest and Spectral Clustering. IEEE Trans. Sustain. Energy 2023, 14, 1229–1240. [Google Scholar]
- Chen, S.; Li, P.; Wu, Z. Detection of Abnormal Energy Consumption in Integrated Energy Systems Using an Enhanced Isolation Forest Model. Appl. Energy 2023, 331, 120386. [Google Scholar]
- Witzig, J.; Berthold, T.; Heinz, S. Computational aspects of infeasibility analysis in mixed integer programming. Math. Program. Comput. 2021, 13, 753–785. [Google Scholar] [CrossRef] [Scilit]

Disclaimer/Publisher’s Note: The statements, opinions and data contained in all publications are solely those of the individual author(s) and contributor(s) and not of MDPI and/or the editor(s). MDPI and/or the editor(s) disclaim responsibility for any injury to people or property resulting from any ideas, methods, instructions or products referred to in the content. |
© 2025 by the authors. Licensee MDPI, Basel, Switzerland. This article is an open access article distributed under the terms and conditions of the Creative Commons Attribution (CC BY) license (https://creativecommons.org/licenses/by/4.0/).