Abstract
The demand for a reliable power supply is growing. Non-linear loads are becoming more numerous, so supply cables must be carefully selected to consider the skin effect. This article calculates the power losses and cable temperature for different cable arrangements supplying non-linear loads. Power losses are determined using the fast Fourier transform (FFT) of the distorted current signal and the current penetration depth method. The temperature distribution is then calculated using finite element analysis (FEA) for selected cases. The results show that cable bundles can be used instead of single cables with a large cross-sectional area because of lower conductor temperatures, lighter cable arrangements, and reduced installation costs. These aspects are important for the sustainable development of the economy, particularly with regard to material usage.
1. Introduction
In today’s world, electricity and power supply have become pivotal. The energy transition, which involves the increased use of renewable energy sources (RES) and the integration of non-linear loads, has led to a growing demand for infrastructure investigation to address these challenges. In the current era of sophisticated optimization techniques and rapid advancements in AI technology across diverse scientific and technological domains, leveraging infrastructure to its full potential has become imperative. A significant amount of scientific research has been dedicated to the study of power cables, with particular emphasis on their temperature distribution, current capacity, and laying arrangements. The key factors influencing cable capacity are the environmental conditions, such as the ground, air, or seabed, and the configuration, including whether the cable is flat or trefoil. These issues are defined in the IEC 60364-5-52 [] or IEEE [] standards and allow the selection of derating factors and the correct selection of cables.
The scientific literature contains a few articles investigating the possibilities of cable ampacity in relation to the backfill used in the ground. In recent years, the Finite Element Method (FEM) has become increasingly popular in various fields of research. The standard [] provides a comprehensive overview of the fundamentals of its application in cable ampacity calculations. In [], the results of research carried out to verify ground parameters and cable arrangements in non-standard situations are presented. The authors implement an algorithm in a commercially available software program (CYMCAP) and calculate the external thermal resistance (T4) in comparison with the Neger–McGrath method [] and its improvements [,,]. The temperature distribution in cables is verified in a single cable per phase formation [] or in bundles []. As outlined in reference [], FEM methods have been employed to analyze skin and proximity effects in cable current distribution, incorporating both electromagnetic and mechanical phenomena. It has been noted that local hot spots are present in certain cable bundles. The skin effect is increasingly being considered due to the growing proportion of non-linear loads and current distortion, not only in internal industrial supply lines but also in distribution and transmission power systems. The following methods can be used to analyze this effect:
- -
- IEC-60287-1-1:2006 + A1:2014 [],
- -
- Bessel functions [,]
- -
- Current Penetration Depth (CPD) [].
IEC-60287-1-1 [] is a widely accepted standard that is frequently referenced in a variety of publications. Cardoso et al. in [] proposed an iterative method to calculate the skin effect in cylindrical conductors using Feynman’s approach. In addition to the simplified method, the authors demonstrated the relationship between the cross-sectional area (CSA) and frequency-dependent resistance and inductance. However, in [], simulations based on the IEC standard, Bessel functions, and the proposed CPD method were compared. This allows the effective area for each harmonic order current to be calculated based on the current depth. In this area, the resulting resistance can be set, and the sum of each current harmonic power loss can be calculated. For large CSA cables, the CPD method proved to be the most accurate. For smaller cables, the results obtained from each method were very similar. As outlined in reference [], a novel approach has been proposed for calculating the resultant resistance of the conductor, considering increasing current frequencies. The cube root of the frequency can be used to determine the resistance value for each harmonic order. The results of the paper indicate that the values obtained from this method align with the IEC standard model []. As demonstrated in references [,], there are several calculation methods available for low-voltage cables supplying non-linear loads. In [], the authors conducted a study exploring the impact of current harmonics on cable operating temperature. Low-voltage cables were tested in wet and dry ground for distorted and sinusoidal currents. The primary conclusion drawn from this analysis was that dry ground can support higher loads than wet ground. The presence of harmonics resulted in higher operating temperatures and a reduction in current capacity.
Optimization of cable ampacity is a topic that has been widely investigated by scientists. In [], the results of the interdependencies between cable ampacity, cable placement, convective thermal conductivity, and different environmental conditions are presented. Reference [] utilized Particle Swarm Optimization (PSO) to calculate the minimum cost of underground power cables, incorporating the use of thermal backfills. The author asserts that the proposed methodology has the potential to contribute to the cost minimization of cable lines. As outlined in [], a comparable study employs the Jaya and MJaya algorithms for multiobjective optimization.
Cable current capacity remains a significant topic of global scientific interest, as evidenced by the findings of numerous researchers. However, to the best of the author’s knowledge, there is no study related to cable design, including the number of conductors per phase, current distortion, cable mechanical parameters, and costs. As mentioned, the specified parameters can influence not only the correct functioning of the installations, but they can also be relevant in the context of sustainable development systems. Therefore, the following issues are considered in this paper:
- ○
- power losses in different cable formations,
- ○
- distorted current’s impact on the power losses,
- ○
- mechanical and economic aspects of investment and operating conditions,
- ○
- thermal operating conditions of each cable arrangement,
- ○
- material use and sustainable development of power systems.
An increasing number of installations are required to meet the specifications for supplying non-linear loads. The primary contribution is thus to analyze the means by which high-power non-linear loads can be supplied in order to reduce the skin effect in cables and ensure a safe power supply without exceeding maximum allowable temperatures. The power can be delivered to the load using one large cable per phase, or a bundle of several small cables can be used. This paper provides a balanced assessment of the pros and cons of these cable arrangements (comparison of electrical, thermal, and mechanical properties). All electrical requirements and parameters of the cable arrangement are analyzed in terms of the material used and the sustainable design and realization of the installations. As one can see, the same power delivered via different cable arrangements can cause overheating of one cable, while the temperature of the cable bundle is lower than the limit. Also, the total mass of a bundle may be lighter than a single cable with a great CSA, which results in cost reduction.
This article is organized as follows: first, it provides a description of the skin effect and the method of power loss calculation. Second, it sets out the parameters of the investigated cable systems and the non-linear load. The subsequent section presents the results of power loss and cable temperature simulations, and in the following chapter, these results are analyzed and interpreted. The final section of the report will present the conclusions.
2. Skin Effect and Power Losses
The skin effect is caused by an alternating current (AC) and results in different current densities throughout the cable cross-section. For the purposes of this article, this phenomenon has been analyzed using the CPD methodology []. The applied algorithm enables power losses (ΔP) to be calculated for each harmonic current considered. The fundamental equation is given in Equation (1):
where: —effective resistance of the conductor for given harmonic h, Ω.
—current of the h—harmonic order, A.
Effective resistance is a parameter, which uses the effective surface of the cable’s conductor that transfers current. It may be calculated using (2):
where: —cable’s core radius, mm.
—current penetration depth, mm.
The value of the current penetration depth indicates how deeply a given harmonic current penetrates the cable core when viewed from the outside. This value depends on certain physical parameters of the conductor and is expressed as follows:
where: —harmonic order, -.
—fundamental frequency, Hz.
—vacuum permeability, Vs/Am.
—relative permeability, -.
—conductivity of core material, .
For the copper core, the CPD changes as it is depicted in Figure 1.
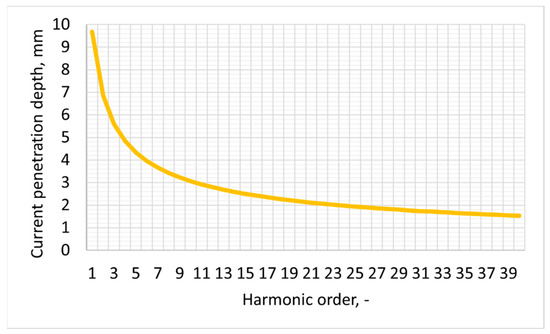
Figure 1.
CPD changes according to the current harmonic order for the copper core.
The power losses are calculated based on the above equations in the following paragraphs. These losses are essential for preparing the temperature distribution in any cable arrangement according to Equation (4):
where: —temperature value, K.
—thermal conductivity, .
—coordinates of a specific location, m.
—heat flux, .
For the cable insulation, outer sheath, and surrounding environment, the heat flux is assumed to be zero, and only the k value of the material changes.
If the cable is buried directly in the ground, convection phenomena can be omitted. However, for installations in air, convection phenomena must be considered and analyzed using Equation (5) []:
where: —direction normal to the boundary, m.
—heat transfer coefficient, .
—ambient cooling fluid temperature, K.
3. Materials and Methods
The skin effect in power cables is a complex issue involving electrical and thermal phenomena. The following methodology has therefore been developed in this paper.
- Definition of the current signal (RMS value, harmonic spectrum) and assumption of the cable arrangement.
- Power losses calculation according to the chosen method.
- Temperature distribution calculation in FEM software.
- Power losses recalculation according to cable temperature variation.
- Temperature distribution recalculation.
The whole process may take several iterations (points 4 and 5). It is completed when the temperature change is less than the assumed threshold.
The material parameters required to perform the calculations according to the assumed methodology are given in Table 1.

Table 1.
Material and environmental parameters used in FEM calculations.
Calculations were first performed in MATLAB (version 24.2) using FFT analysis to determine the current signal and to calculate power loss, and then in FEMM software (femm 4.2) using a 2D thermal analysis to solve the problem. Each cable arrangement was considered as a formation placed in the air. The boundary conditions were set according to Dirichlet conditions at 30 °C, and the boundary was placed far from the cable formation to minimize its effect. No metallic routes, such as trays, trunks, or ladders, were simulated in order to perform a pure calculation of cable dependencies from current and the harmonic spectrum, as well as the formation. Figure 2 shows an example excerpt of the FEM model with the mesh structure for the 5 × 50 cable formation. The other bundle formations were prepared in an analogous way.
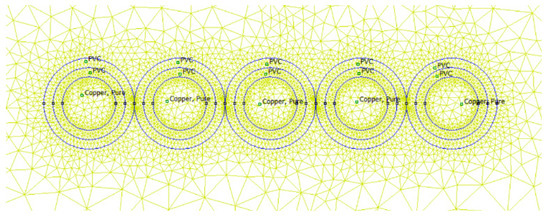
Figure 2.
Excerpt from the FEM model with a calculating mesh for a 5 × 50 cable formation.
To validate the prepared cable models in FEMM, the time heating constants were calculated. The air temperature was set at 30 °C, and the rated current was applied. The temperature increments were then recorded to achieve the time heating constants for each cable size. The results of the cable models’ validation are collected in Table 2. Additionally, this table shows the mesh sizes for each model. Refining the mesh size, e.g., from 70,473 to 133,090 nodes, did not noticeably improve the temperature distribution results (the values differed by hundredths or thousandths).

Table 2.
Values of time heating constants calculated in the FEMM software and the manufacturer’s data.
In this work, the radiation effect from the outer surface of the cable is neglected. Obviously, in real conditions, both radiation and convection occur; however, when both of these phenomena were selected, the cable surface temperature changed only about 1.5% and the core temperature about 2% during the initial tests. Such results are caused by relatively small areas in the cable arrangements considered and relatively low temperatures. In the case of higher operating temperatures, each one has to take into account the radiation phenomenon.
To verify the quality of the mesh and confirm that for the relatively simple geometry of the arrangement chosen, the mesh is sufficient, two different cases were analyzed. For the meshes with 225,634 and 689,048 nodes, the calculated values did not differ more than 0.5 °C from the base case with the mesh defined in Table 2.
4. Parameters
This study contains an analysis of the cable supply system for a high-power non-linear load. Due to the multi-criteria approach, which takes into account electrical, thermal, mechanical, and economic aspects, the calculations are divided into sections relating to each group.
- A.
- Electrical properties
To analyze the skin effect on high-power loads with a highly distorted current waveform, a rectifier-equipped load was chosen as an example. This three-phase load has a rated power of 514 kW, a rated voltage of 400 V, and a resulting phase current of 742 A. The calculations assume that the nominal supply voltage at the terminals of the load remains constant. The resulting voltage value at the switchgear busbars and the voltage drop are analyzed in the next paragraph.
The THD of the load current is 76%. The harmonic spectrum is shown in Figure 3, and the harmonic percentage values in Table 3. The fundamental frequency of 50 Hz is a reference value, so its value is 100% and the rest of the harmonics are related to it. In a second variation, a pure sine wave with an RMS value of 742 A is considered.
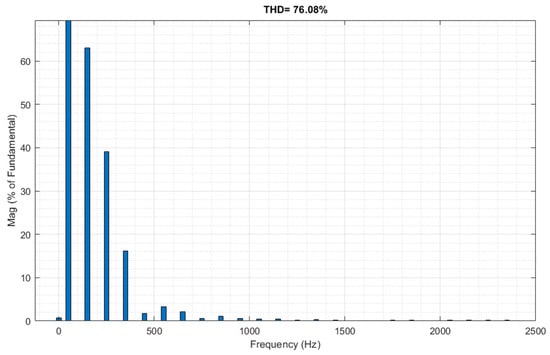
Figure 3.
Harmonic spectrum of the load current assumed in calculations.

Table 3.
Current harmonic spectrum presented as a percentage in relation to the fundamental one.
It is evident that all considered cables are composed of a copper core and are of a round shape, with polyvinyl chloride (PVC) insulation and an outer sheath (see Figure 4). The electrical parameters of cables with a copper core are outlined in Table 4.

Figure 4.
Low-voltage cable construction used in the study.

Table 4.
Parameters of low-voltage cables given by the manufacturer [].
In accordance with the stipulations set out in IEC 60364-5-52 [], the resultant current capacity of each cable or cable bundle can be calculated, with the proviso that the installation method and the number of cables forming one phase are taken into account. The reduction factor Cg for cables grouped in a flat configuration in contact is as follows:
- -
- 2 cables—Cg = 0.88,
- -
- 3 cables—Cg = 0.82,
- -
- 4 cables—Cg = 0.77,
- -
- 5 cables—Cg = 0.75.
Based on the above data, the cable arrangements are selected and shown in Table 5.

Table 5.
Current capacity of each cable arrangement.
As shown in Table 5, all cable arrangements fulfill the condition of cable selection (current capacity ≥ load current).
- B.
- Mechanical parameters
In addition to the electrical parameters, the mechanical parameters are also important and should be considered. For the purposes of this article, however, maximum forces and loads will be omitted, and only mass and bending radius will be considered. The cable parameters are summarized in Table 6.

Table 6.
The construction parameters of selected cables.
- C.
- Economic costs
According to the prices from the online shop [] and the currency exchange rate of US dollar and Polish złoty equal to 3.92 USD/PLN, the following prices of one meter of single-core cables are adopted in further analysis:
- 1 × 50—7.17 USD,
- 1 × 70—10.19 USD,
- 1 × 120—17.2 USD,
- 1 × 150—20.36 USD,
- 1 × 400—59.07 USD.
5. Research Results
This chapter presents the numerical calculations for the cases considered. All values are given for a unit length of 1 m. Table 7 contains the results of the steady-state temperature of the cable core for a single cable from the formation.

Table 7.
Calculated values of power losses and cable core average temperature of a single cable.
According to Table 7, the temperature of the 400 mm2 cable exceeds the acceptable level for the distorted signal. The other case remains within an acceptable temperature range. The lower the cross-sectional area (CSA), the lower the power dissipation, and the smaller the difference between the normal and distorted cases. This is due to the skin effect, which is more pronounced in larger CSAs due to their larger radius and lower current penetration depth. Therefore, even though the RMS value of the current is lower than its rated capacity, the cut-off temperature is exceeded. Figure 5 shows the temperature field distribution for the single 1 × 400 mm2 cable. In both cases, the plots are symmetric, so only half of them are shown (from the axis of symmetry).
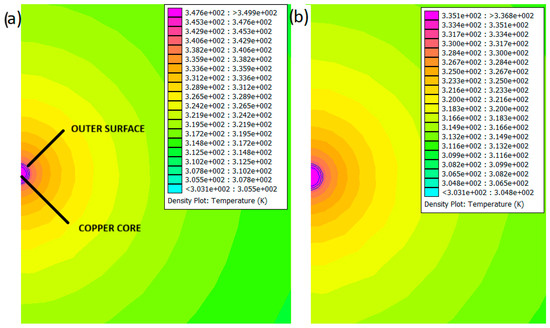
Figure 5.
Temperature distribution for 1 × 400 cable: (a) distorted current, (b) sinusoidal current.
Each formation should also be analyzed in terms of voltage drops. The total voltage drop values are included in Table 8 and in Figure 6. The voltage drops, including the real and imaginary parts, may be different because they depend on the power factor value and the phases of the current harmonics. Therefore, in this manuscript, only the complex number modulus is presented as a general case.

Table 8.
Voltage drops on the line (length 200 m).
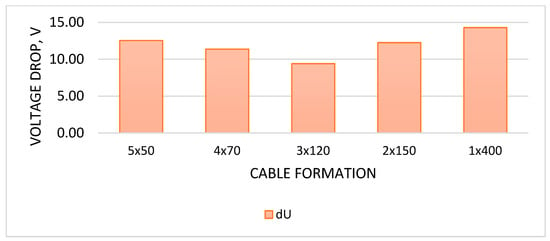
Figure 6.
Comparison of voltage drops according to the cable formations.
The data in Table 9 should be analyzed in relation to cable trays and the possibilities of each arrangement on them. On straight sections, the 5 × 50 model takes up the most space, while the 1 × 400 model takes up the most space on bends because of its large bending radius (Figure 7). In terms of installation mass, 5 × 50 is the lightest and 1 × 400 is the heaviest. This directly affects the current and unitary mass ratio of the copper core and the PVC parts. The copper core of a 5 × 50 mm2 bundle is utilized most efficiently, while the 2 × 150 mm2 and 1 × 400 mm2 cores are utilized least efficiently. The opposite dependency is visible in the case of PVC use. However, the greatest and smallest values of density for copper and PVC are as follows: 1.79 for the 5 × 50 and 1 × 400 copper cores, and 1.24 for the 2 × 150 and 5 × 50 PVC cores. These values show that the bundle allows the conductor materials to be used more efficiently, despite the slightly greater share of PVC.

Table 9.
Geometrical and mass parameters of the considered formations.
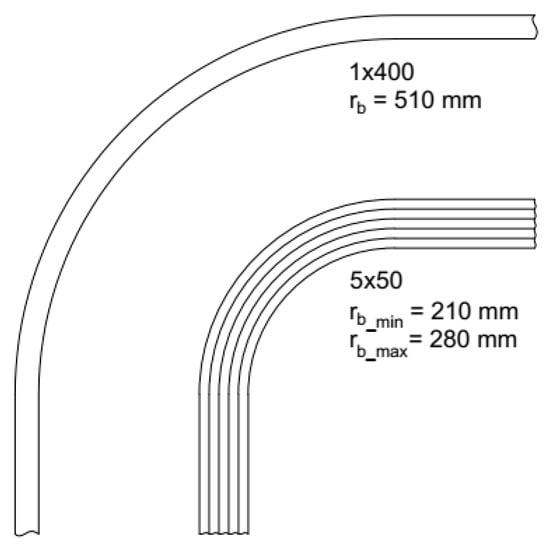
Figure 7.
Comparison of the bending radius of a single cable 1 × 400 and flat arrangement of 5 × 50 (rb—bending radius).
The analysis of installation and steady-state operating conditions shows that there are advantages and disadvantages to each cable formation. However, this study also considers emergency conditions, such as damage to a cable within a bundle. In the case of a 1 × 400 arrangement, for example, cable damage would result in a complete loss of supply and interruptions to the industrial process. Such a study can be carried out in other cases. For the purposes of this analysis, the following conditions are assumed:
- the starting point of work in the N-1 state is taken from Table 7 for a distorted current wave,
- the maximum permissible temperature of the cable is 70 °C (it is the value of the copper core temperature).
The heating time in Table 10 is the time it takes to reach a maximum temperature of 70 °C in the cable core. The difference between current waveform cases depends on the cross-sectional area (CSA). The results obtained are very similar for the smallest cables; for larger ones, such as 150 mm2, the difference reaches 7.5%. The more cables that make up a phase, the longer the permissible N-1 working time before exceeding 70 °C. Even with a 5 × 50 configuration, the maximum temperature is 66 °C and 67 °C for sinusoidal and distorted currents, respectively. This is due to the group derating factor Cg, which is used to select the configuration in accordance with the standards. The relationship between heating time and the load current in one cable from the bundle is confirmed according to the last column of Table 10. The case of N-1 allows it to operate in some time range; however, it should be underlined that it cannot be used permanently due to the risk of cable overheating and, as a result, faster insulation aging or even damage and fire. Additionally, protective devices can release in case of an N-1 condition, due to higher currents than in normal operation. If a single cable from the bundle has its own protection, as it is described in [,,], the overcurrent resulting from the N-1 work may lead to the next exclusions.

Table 10.
Calculated parameters of N-1 cables work.
6. Discussion
Designing and constructing low-voltage cables in different arrangements offers several advantages, depending on the aspects considered. First, the 3 × 120 configuration offers the most favorable operating temperature characteristics for each cable core. This is due to the cable’s current capacity, which is the largest in terms of the load current flowing through each cable (the load current is equal to 77% of the permissible current capacity). In the case of an ideal sinusoidal current wave, the maximum temperature is never exceeded. There is also a relationship between the load current and the ratio of cable current capacity to maximum temperature. However, in the case of a distorted wave, the issue is more complex because, although the current ratio does not change, the power losses are greater due to the skin effect. The 1 × 400 cable formation has a temperature of 77 °C. This is unacceptable, even though the load current is 84% of the cable’s current capacity. The high temperature results from additional power dissipation due to the skin effect. As the 1 × 400 configuration has the largest cross-sectional area (CSA), the current penetration depth has a greater effect than in other cases, as the effective area of the core is smaller for higher harmonic orders. By contrast, the 5 × 50 configuration has a lower operating temperature, with the load current providing 93% of the cable capacity. In this formation, the smaller core radius does not reduce the effective area of the core, so power losses due to the skin effect do not increase. For high-power non-linear loads, it is better to use N parallel cables forming one phase than a large single cable. Taking power losses in each line into account, the 5 × 50 arrangement results in the highest losses and is therefore the worst case. For sinusoidal current, the 1 × 400 arrangement has the lowest power losses. For distorted current, the 3 × 120 arrangement is the best solution. Table 11 and Figure 8 summarize the current ratios and power losses.

Table 11.
Load current and current capacity of each formation and power losses for the considered cases.
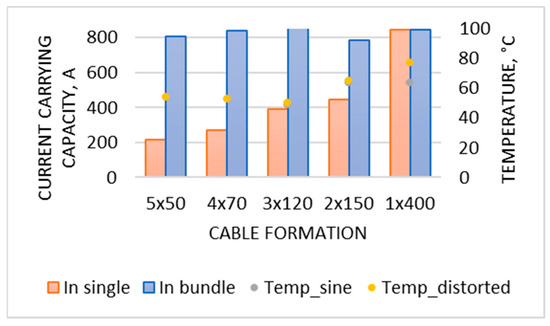
Figure 8.
Nominal current capacity of a single cable (red), current capacity of the bundle (blue), and temperatures of sine (grey markers) and distorted wave (yellow markers).
To provide a short preview of the influence of the convection factor, the single cable 1 × 400 and a bundle 3 × 120 were modeled for three different convection factors. The results are displayed in Table 12. As expected, convection has an important influence on the operating temperature of the cable.

Table 12.
Influence of convection heat coefficient for sine current.
Arranging N parallel cables per phase allows for greater flexibility in emergency situations. If one cable is damaged, the rest of the formation can continue to work and guarantee the power supply. However, if there is only one cable per phase, failure of that cable results in a power cut. Regarding N-1 operating conditions, any formation made up of more than one cable can be overloaded. 2 × 150 reaches the maximum allowable temperature (70 °C) relatively quickly: 75 and 57 s for sinusoidal and distorted cases, respectively. The more cables in a bundle, the longer it takes to reach 70 °C. For a 5 × 50, the maximum operating temperature is not reached. This shows that the 4 × 50 formation could be used for longer if only one cable is damaged. It should be noted that the 5 × 50 configuration was chosen in accordance with the standard’s requirements (derating factors for grouped configurations). Moreover, some derating factors seem relatively strict for certain arrangements. This research shows that a deeper analysis is needed to verify the derating factors in bundles consisting of small CSA cables (e.g., 25 or 50 mm2) and large ones (e.g., 240 or 400 mm2). In addition, replacing the cable in a 1 × 400 case is more complicated than in a 1 × 50 or 1 × 70 case, due to the lower unit mass and bending radius. Bundling also allows for the possibility of overloading the supply cables for a short period, whereas with 1 × 400, the cables are overloaded due to distorted current (and therefore maximum temperature). Electrical conditions, such as voltage drop on the lines, are also checked. The values of the real and imaginary parts of the voltage drop are given in Table 8. Low-voltage cables without a metal screen (with only polyvinyl chloride insulation and an outer sheath) have little influence on mutual inductance, so this value can be omitted. Changes in the voltage drop character are visible from the parameters given by the cable manufacturer (unitary resistance and inductance). The smaller the cable, the lower the resulting reactive inductance and imaginary voltage drop (2.7 V for 5 × 50 and 11.7 V for 1 × 400). The real part of the voltage drop is highest for the 5 × 50 formation and lowest for the 1 × 400 formation. The voltage drop ratios are calculated considering the steady-state core temperature (see Table 10).
The unit cost of one meter of each complete arrangement varies from USD 35.85 (5 × 50) to USD 59.07 (1 × 400). Therefore, the economic analysis of the project indicates that the bundle is a more cost-effective solution than the individual cable. The economic analysis of installations and cable formations also includes the cost of cable routes (e.g., cable trays or ladders). Please refer to Table 9, which details the unit mass and total width of each arrangement. The 5 × 50 mass is the smallest, while the 1 × 400 mass is the largest. In sustainably and responsibly developed economies, it is important to verify the material use. Despite the fact that the insulation and outer sheath mass is slightly greater for bundles than for single cables, the differences are relatively small. As shown in Table 10, the addition of copper utilization gives the bundles a clear advantage in this context. This results in an increase in the cost of cable trays, because the heavier the formation, the greater the load-bearing capacity of the structure. This option incurs an additional cost. In addition to investment costs, it is essential to compare running costs. For 5 × 50 and 4 × 70 formations, the difference in power losses between sinusoidal and distorted cases is negligible. However, for 1 × 400, the increase in power loss due to the skin effect is approximately 39.2% compared to the sine wave. For the 5 × 50 configuration, the power losses are approximately 12.2% and 56.1% higher than for the 1 × 400 configuration for distorted and ideal sinusoidal currents, respectively.
If in Poland the average price of 1 MWh of electricity is 134 USD, the unitary operating costs of energy losses per one hour work are in the range from 0.0061 (5 × 50) to 0.0039 USD (1 × 400) for a sine wave, and 0.0061 (5 × 50) to 0.0043 USD (3 × 120) for the distorted case. Figure 9 presents how it depends on costs during the investment stage and then during operation (only power losses costs included). The values from Figure 9 are calculated for 1 m of the cable bundle and for 1 h in a week of work during a 15-year horizon. So, if the load is working X hours per day, the OPEX values would increase to X multiplied by line length. As mentioned above, as the mass and geometric parameters increase, so too must the supporting construction be built stronger, and finally, the costs increase as well.
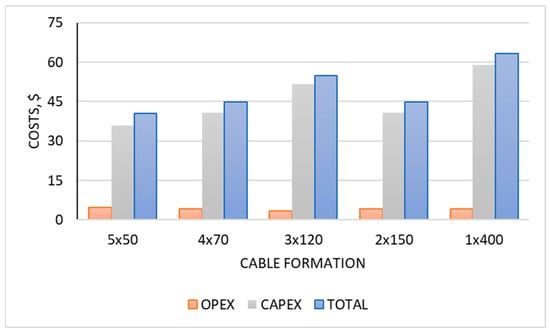
Figure 9.
Comparison of the CAPEX and OPEX costs for each formation.
7. Conclusions
A full analysis of the steady-state operating conditions of different cable formations was performed, including power dissipation and temperature distribution calculations. Each formation was selected based on the anticipated load current and the formation’s current capacity. For each configuration, the pure sine wave and distorted wave cases were analyzed with equal RMS values. The analysis demonstrated that for the sine wave, each formation enables the load to be supplied without exceeding the temperature. In contrast, the distorted case has a temperature of 77 °C for a 1 × 400 cable. The analysis of the temperature calculations has concluded that the optimal operating conditions are for the 3 × 120 formation. In this instance, the minimum temperature is significant. It is also guaranteed that stable operation will be maintained with the 4 × 70 and 5 × 50. Conversely, if we assume that the N-1 arrangement is effective and analyze the fault in the cable, we can conclude that 5 × 50 offers the possibility of working without overheating. It is important to note that the fewer the number of conductors forming a phase, the lower the temperature of 70 °C.
In terms of mechanical parameters, the smallest CSAs of cables (formed in flat bundles) give the smallest bending radii and are also the lightest, which has a direct impact on the supporting structures. Following a thorough review of the total material usage, it was determined that the smaller CSA cable bundles require less core and insulation materials. The 5 × 50 and 4 × 70 formations also have the lowest investment costs, while the 1 × 400 formations have the lowest operating costs due to power losses. As previously outlined, all the aforementioned issues have a significant impact on the sustainable development of the industrial installations. It is becoming increasingly apparent that these issues, which may at first seem obvious, are of great importance in today’s world. This is due to the responsible approach of businesses to environmental safety.
In addition to the issues, the multi-cable formation per phase ensures a certain flexibility of work in case of damage. This allows individual cables to be prepared and replaced from the bundle without interrupting the industrial process. These observations allow us to verify which formations are more reliable. The study demonstrates that high-power non-linear loads can be reliably supplied by N single cables connected in parallel, effectively eliminating the skin effect in cases of small cable CSA. As demonstrated by the selected formations in accordance with the established standards, it is imperative to undertake a thorough examination of the derating factors associated with grouped formations. Such an investigation could be an important and improving step in the better cable formation analysis, including engineers’ solutions (including derating factors for the bundles with distorted currents).
Funding
This research received no external funding.
Data Availability Statement
Dataset available on request from the author.
Conflicts of Interest
The author declares no conflicts of interest.
Abbreviations
The following abbreviations are used in this manuscript:
| CSA | Cross-sectional area |
| CPD | Current penetration depth |
| RES | Renewable energy sources |
References
- IEC 60364-5-52:2009; Low-Voltage Electrical Installations—Part 5-52: Selection and Erection of Electrical Equipment—Wiring Systems. IEC: Geneva, Switzerland, 2009.
- IEEE Std 835-1994; IEEE Standard Power Cable Ampacity Tables. IEEE: Piscataway, NJ, USA, 1994; pp. 1–3151.
- IEC TR 62095:2003; Electric Cables—Calculations for Current Ratings—Finite Element Method. IEC: Geneva, Switzerland, 2003.
- de Leon, F.; Anders, G.J. Effects of Backfilling on Cable Ampacity Analyzed with the Finite Element Method. IEEE Trans. Power Deliv. 2008, 23, 537–543. [Google Scholar] [CrossRef]
- Neher, J.H.; McGrath, M.H. The calculation of the temperature rise and load capability of cable systems. AIEE Trans. Part III—Power App. Syst. 1957, 76, 752–772. [Google Scholar] [CrossRef]
- El-Kady, M.A.; Anders, G.J.; Horrocks, D.J.; Motlis, J. Modified values for geometric factor of external thermal resistance of cables in ducts. IEEE Trans. Power Deliv. 1988, 3, 1303–1309. [Google Scholar] [CrossRef]
- Tarasiewicz, E.; El-Kady, M.A.; Anders, G.J. Generalized coefficients of external thermal resistance for ampacity evaluation of underground multiple cable systems. IEEE Trans. Power Deliv. 1987, 2, 15–20. [Google Scholar] [CrossRef]
- Sellers, S.M.; Black, W.Z. Refinements to the Neher-McGrath model for calculating the ampacity of underground cables. IEEE Trans. Power Deliv. 1996, 11, 12–30. [Google Scholar] [CrossRef]
- Rerak, M.; Ocłoń, P. Thermal analysis of underground power cable system. J. Therm. Sci. 2017, 26, 465–471. [Google Scholar] [CrossRef]
- Li, Z.; Zhong, X.; Xia, J.; Bian, R.; Xu, S.; Cao, J. Simulation of Current Distribution in Parallel Single-Core Cables Based on Finite Element Method. In Proceedings of the 2015 Fifth International Conference on Instrumentation and Measurement, Computer, Communication and Control (IMCCC), Qinhuangdao, China, 18–20 September 2015; pp. 411–415. [Google Scholar] [CrossRef]
- Cywiński, A.; Chwastek, K. Modeling of Skin and Proximity Effects in Multi-Bundle Cable Lines. In Proceedings of the 2019 Progress in Applied Electrical Engineering (PAEE), Koscielisko, Poland, 17–21 June 2019; pp. 1–5. [Google Scholar] [CrossRef]
- IEC Standard 60287-1-1:2006+A1:2014; Electric Cables—Calculation of the Current Rating—Part 1: Current Rating Equations (100% Load Factor) and Calculation of Losses—General. International Electrotechnical Commission: Geneva, Switzerland, 2014.
- Mohos, A.; Ladányi, J.; Divényi, D. Methods to ascertain the resistance of stranded conductors in the frequency range of 40 Hz–150 kHz. Electr. Power Syst. Res. 2019, 174, 105862. [Google Scholar] [CrossRef]
- Benato, R.; Forzan, M.; Marelli, M.; Orini, A.; Zaccone, E. Harmonic Behaviour of HVDC Cables; IEEE PES T&D: New Orleans, LA, USA, 2010; pp. 1–9. [Google Scholar]
- Rozegnał, B.; Albrechtowicz, P.; Mamcarz, D.; Rerak, M.; Skaza, M. The Power Losses in Cable Lines Supplying Nonlinear Loads. Energies 2021, 14, 1374. [Google Scholar] [CrossRef]
- Cardoso, J.R.; Salles, M.B.C.; Pereira, R.F.; Costa, E.C.; Sguarezi Filho, A.J. Iterative formulation for the skin effect on cylindrical conductors based on the Feynman’s approach. Int. J. Numer. Model. 2020, 33, e2662. [Google Scholar] [CrossRef]
- Manusov, V.Z.; Khripkov, V.V. Comparative Analysis of Mathematical Models for the Coefficient of Conductor Resistance Increase Due to Higher Harmonics. In Proceedings of the 2018 XIV International Scientific-Technical Conference on Actual Problems of Electronics Instrument Engineering (APEIE), Novosibirsk, Russia, 2–6 October 2018; pp. 133–136. [Google Scholar] [CrossRef]
- Topolski, L.; Warecki, J.; Hanzelka, Z. Calculating Power Losses In LV Cables Loaded with Nonsinusoidal Currents. In Proceedings of the 19th International Conference Computational Problems of Electrical Engineering, Banska Stiavnica, Slovakia, 9–12 September 2018; pp. 1–4. [Google Scholar] [CrossRef]
- Topolski, L.; Warecki, J.; Hanzelka, Z. Methods for determining power losses in cable lines with non-linear load. Przeglad Elektrotechniczny 2018, 94, 87–92. [Google Scholar] [CrossRef]
- Gouda, O.E.; Dein, A.Z.E. Enhancement of the thermal analysis of harmonics impacts on low voltage underground power cables capacity. Electr. Power Syst. Res. 2022, 204, 107719. [Google Scholar] [CrossRef]
- Che, C.; Yan, B.; Fu, C.; Li, G.; Qin, C.; Liu, L. Improvement of cable current carrying capacity using COMSOL software. Energy Rep. 2022, 8 (Suppl. 15), 931–942. [Google Scholar] [CrossRef]
- Ocłoń, P. The effect of soil thermal conductivity and cable ampacity on the thermal performance and material costs of underground transmission line. Energy 2021, 231, 120803. [Google Scholar] [CrossRef]
- Ocłoń, P.; Rerak, M.; Rao, R.V.; Cisek, P.; Vallati, A.; Jakubek, D.; Rozegnał, B. Multiobjective optimization of underground power cable systems. Energy 2021, 215, 119089. [Google Scholar] [CrossRef]
- Xiong, L.; Chen, Y.; Jiao, Y.; Wang, J.; Hu, X. Study on the Effect of Cable Group Laying Mode on Temperature Field Distribution and Cable Ampacity. Energies 2019, 12, 3397. [Google Scholar] [CrossRef]
- NKT Cable Calatogue. Low Voltage Cables and Wires; NKT S.A.: Warszowice, Poland, 2017. [Google Scholar]
- Available online: https://onninen.pl/produkty/Kable-i-przewody/Kable-elektroenergetyczne/Kable-ziemne-w-izolacji-PVC-do-1KV/Kable-miedziane-PVC?query=/atrybut:liczba%20%C5%BCy%C5%82%5C%3D1 (accessed on 31 May 2024).
- Książkiewicz, A.; Batura, R. Calculation of minimal short-circuit current in parallel arrangement of cables for a three phase shortcircuit fault. Przegląd Elektrotechniczny 2019, 95, 126–130. [Google Scholar] [CrossRef]
- Albrechtowicz, P.; Biesaga, B. The short-circuit analysis in multi-parallel single cable lines. Przegląd Elektrotechniczny 2024, 100, 183–187. [Google Scholar] [CrossRef]
- Ryszard, Z. Aktualne Problemy Pracy Systemów Elektroenergetycznych; Wydawnictwo Politechniki Gdańskiej: Gdańsk, Poland, 2023; ISBN 978-83-7348-900-4. [Google Scholar]
Disclaimer/Publisher’s Note: The statements, opinions and data contained in all publications are solely those of the individual author(s) and contributor(s) and not of MDPI and/or the editor(s). MDPI and/or the editor(s) disclaim responsibility for any injury to people or property resulting from any ideas, methods, instructions or products referred to in the content. |
© 2025 by the author. Licensee MDPI, Basel, Switzerland. This article is an open access article distributed under the terms and conditions of the Creative Commons Attribution (CC BY) license (https://creativecommons.org/licenses/by/4.0/).