


Abstract
As a new engine for promoting the high-quality development of China’s foreign trade, digital trade provides new opportunities for enterprises’ low-carbon transition. Based on samples of export industrial enterprises listed in China from 2010 to 2023, this paper uses the digital trade policy represented by the cross-border e-commerce (CBEC) comprehensive pilot zone as a quasi-natural experiment and employs a multi-period difference-in-differences (DID) model to empirically analyze the policy effect of digital trade development on firms’ carbon emission intensity. This research finds that (1) digital trade policies represented by the pilot policy can significantly reduce firms’ carbon emission intensity and (2) the pilot policy can achieve the emission intensity reduction effect through dual paths of “internal innovation deepening” and “external environment optimization”. The internal innovation deepening refers to the green awareness formation and green production implementation of enterprises. External environment optimization refers to financial support resources for enterprises and institutional safeguards for innovation rights of enterprises. (3) Further analysis indicates that the policy effects are more pronounced in firms with higher risk preference, with larger scale, in heavily polluting and high-tech industries, and in the central and northeastern regions. Additionally, the policy demonstrates synergistic effects with the Belt and Road Initiative and exhibits significant spatial spillover effects, benefiting neighboring non-pilot areas.
1. Introduction
In 2024, China’s State Council General Office unveiled the Work Plan for Accelerating the Construction of the Dual-control System for Carbon Emissions, explicitly proposing the implementation of a carbon emissions dual-control mechanism that prioritizes intensity control while supplementing with total quantity control. Consequently, the 15th Five-Year Plan has established carbon emission intensity (CO2 emissions per GDP unit) as a mandatory target for national socioeconomic progress. This metric effectively aligns China’s economic expansion with its ecological sustainability objectives. According to China’s national development strategy, the country carbon emission intensity needs to be reduced by 18% during the 14th Five-Year Plan period. Calculated based on this, the annual average reduction in carbon emission intensity should be about 3.9%. However, data shows that in the first three years of the 14th Five-Year Plan, the national carbon emission intensity decreased by 3.8%, 0.8%, and remained flat year-on-year, respectively. Currently, the year 2025 marks the final year of the 14th Five-Year Plan period, yet there remains a gap in achieving its energy-saving and carbon reduction targets. Therefore, China’s 2024–2025 Energy Conservation and Carbon Reduction Action Plan emphasizes the need to make every possible effort to fulfill the binding objectives set for this period. Notably, research from the China Academy of Industrial Internet indicates that industrial activities contribute roughly 70% of national carbon emissions. This structural feature determines that industrial enterprises reducing carbon intensity and initiating low-carbon transformation are the key breakthroughs to achieve the dual-control goals of carbon emissions [1,2].
Against this background, the new digital trade format centered on cross-border e-commerce (CBEC) is profoundly reshaping the low-carbon transformation path of Chinese industrial enterprises. In recent years, cross-border e-commerce, as a typical representative of digital trade, has experienced explosive growth. According to statistics from the General Administration of Customs, China’s total import and export volume of CBEC reached CNY 2.63 trillion in 2024, making it a new engine driving the high-quality development of foreign trade. Digital trade has not only reshaped the global value chain division of the labor system but has also significantly impacted firms’ carbon intensity through its inherent advantages in digital technology and the dividends of institutional openness [3]. To promote the deep integration of digital trade and green development, as of 2024, the State Council established 165 CBEC pilot zones, forming a policy network covering 90% of industrial bases nationwide. The establishment of CBEC pilot zones has undoubtedly greatly accelerated the development of digital trade. The existing studies have confirmed the environmental benefits of the digital economy and e-commerce at the macro level [4,5]. However, there remains a research gap regarding how specific digital trade policies affect corporate green transition through micro-level channels. Against this backdrop, this paper takes China’s CBEC pilot zone policy as a quasi-natural experiment to address the following key questions: Can digital trade policy effectively reduce the carbon emission intensity of industrial export enterprises? If so, what are the underlying transmission mechanisms? Do enterprises with different characteristics, in different industries, and across different regions exhibit heterogeneity in carbon emission intensity during this process? By addressing these questions, this study will not only fill the evidence gap in the “policy–micro mechanisms–corporate carbon intensity reduction” chain but also provide new policy insights for emerging economies in implementing targeted digital trade policies to achieve synergistic development of the economy and the environment.
The paper is structured as follows. Following this introduction, Section 2 synthesizes existing scholarship on CBEC growth and firms’ carbon intensity. Section 3 contextualizes policy background and hypothesis formulation. Section 4 introduces the research methodology, including sample selection and methodology. Section 5 reports and interprets the empirical results and discussion. In Section 6, the dual paths of internal innovation and external environment optimization are explored. Section 7 conducts further heterogeneity and extended analyses. The final section summarizes key findings, proposes targeted policy recommendations based on the research conclusions, and discusses the limitations of the present work.
2. Literature Review
Current research on the environmental impacts of the digital economy has yielded substantial findings. Chen and Xing [4] noted that the digital economy, via its penetrative, platform-based, and sharing traits, accelerates traditional industries’ integration with green low-carbon development, with more pronounced benefits in core cities and eastern regions. Luo et al. [6] further showed, using urban-level data, that the digital economy drives green innovation through economic openness and potential market expansion, alongside spatial spillover effects, while its marginal promoting effect fades as mechanisms mature. As an important manifestation of the digital economy [7], the environmental impact of e-commerce has also attracted widespread attention. For instance, Siragusa and Tumino [5], by comparing the environmental impacts of online and offline grocery purchasing processes in Italy, found that online channels offer greater green advantages. From the perspective of product returns, Oláh et al. [8] indicated that e-commerce helps reduce resource waste in the production process, thereby lowering lifecycle environmental costs and air pollutant emissions.
Under the conditions of an open economy, the digital economy and e-commerce will manifest in the mode of digital trade. This paper specifically investigates cross-border e-commerce as a representative form of digital trade, with its analyses centered on three aspects: the trade promotion effect, the social welfare effect, and environmental impact. First, digital trade overcomes geographical and temporal barriers inherent in conventional commerce [9,10], reduces information asymmetry between trading parties [11], and thus lowers firms’ information search costs [12]. Meanwhile, CBEC provides more efficient services for enterprises in the zone in key links of cross-border trade, such as settlement and payment, warehousing and logistics, and customs clearance [13], promoting industrial agglomeration and facilitating the formation of industry-scale effects [14,15], which significantly reduces firms’ production costs [16]. From a social welfare perspective, CBEC development provides a favorable policy environment and technological support for entrepreneurs, increasing residents’ income levels by promoting labor employment [17]. Meanwhile, the growth of CBEC drives the optimization of the human capital structure [18] and narrows the internal income gap within firms [19]. Additionally, CBEC attracts more high-quality enterprises through a series of preferential policies, intensifying market competition. To promote R&D and innovation, firms are willing to retain talents with higher salaries, thereby increasing the income share of workers [20]. Finally, regarding environmental impacts, most studies focus on the macro level. For example, Jiang et al. [21] demonstrated that CBEC enhances the urban green innovation capacity with particular emphasis on eco-technological advancement, with more pronounced effects observed in coastal cities possessing developed green finance systems and strong governmental environmental commitment. Song et al. [3], using prefecture-level city data, concluded that CBEC can reduce sulfur dioxide emissions. Despite CBEC’s recognized role in promoting sustainable trade, micro-level investigations examining its influence on firms’ carbon intensity remain substantially underexplored in the academic literature.
In addition, the existing literature has extensively investigated the determinants of firms’ carbon emission intensity through two primary dimensions: external policy interventions and internal organizational characteristics. From the perspective of external policies, the regulatory effects of tax instruments are relatively prominent. Tong et al. [22] used a quasi-natural experiment approach examining export tax rebate reform for “high-energy-consuming, high-polluting, and resource-based” products, revealing that a reduction in tax rebate rates effectively suppresses firms’ carbon emission intensity through improved energy efficiency and cleaner export structures, with stronger effects on technology-intensive and large firms. Parallel research by Song et al. [23] on the business tax to VAT reform demonstrated that input tax deduction mechanisms can reduce manufacturing sector emissions by facilitating specialized R&D outsourcing and enabling the mobility of environmental professionals. Meanwhile, the strengthening of environmental regulations, such as the vertical management of environmental protection agencies [24], the implementation of clean production standards [25], and the pilot carbon emission trading schemes [26], can also reduce firms’ carbon intensity. From the internal characteristic perspective, institutional investor shareholding [27], CEO personal traits [28], and gender diversity on the board of directors [29] can all influence carbon emission intensity. In addition, enterprises’ digital transformation reduces carbon emission intensity by improving factor allocation efficiency [30], optimizing production structures [31], and alleviating financing constraints [32]. However, some scholars have argued that digital transformation requires reallocating previous business operations and usually involves significant expenditures, which impose financial pressure on firms and may crowd out investment in green production, potentially exacerbating emission intensity [33].
This review of the existing literature reveals that while prior studies provide an important foundation for this research, several questions still remain unaddressed. First, although macro-level studies have confirmed the positive role of digital trade in emissions reduction, research on how digital trade policies specifically affect the carbon emission intensity of micro-level enterprises remains absent. Second, the specific pathways through which these policies influence firms have yet to be systematically examined and verified. Third, the heterogeneity of policy effects across different contexts and the underlying causes warrant in-depth investigation. In response to these gaps, this paper provides the following three marginal contributions. First, by treating the CBEC pilot zone policy as a quasi-natural experiment, this study examines the impact of CBEC policy on carbon emission intensity at the firm level, providing a valuable supplement to existing research. Second, it moves beyond a “single-pathway” analytical paradigm by constructing a dual-path framework that integrates “internal innovation”, based on the Resource-Based View (RBV) and Dynamic Capability Theory (DCT), and “external environment”, based on the Porter Hypothesis, thereby offering a clearer theoretical lens for understanding the transmission mechanisms of digital trade policy. Third, this paper systematically analyzes the differential effects of digital trade policy on firms’ carbon emission intensity from multiple perspectives, while also considering the synergistic effects of the “Belt and Road” Initiative, as well as the spatial spillover effect of the CBEC pilot zone. These findings provide a theoretical basis for governments and enterprises to adopt targeted measures in reducing firm-level carbon emission intensity.
3. Policy Background and Hypothesis Formulation
3.1. Policy Background
The rise of global digital trade has exposed structural challenges in traditional foreign trade, including escalating transaction costs and inefficient intermediate processes. CBEC has emerged as a pivotal solution for stabilizing trade growth and enhancing efficiency through its streamlined, disintermediated supply chain architecture. In March 2015, China’s State Council established the first pilot zone for CBEC in Hangzhou, primarily to break down institutional barriers hindering CBEC development—such as traditional trade hurdles in customs supervision and tax collection—and explore an innovative model of “liberalized online transactions and integrated offline comprehensive services.” Building on the successful experience of the Hangzhou pilot zone, the State Council has promoted eight rounds of expansion in phases. Currently, the total number of CBEC pilot zones in China has reached 165, covering all 31 provinces and municipalities, with a diversified layout including coastal, inland, and border regions.
Aligned with deepening CBEC pilot zones’ development, green and low-carbon transition has become a key strategic direction in this field. China’s 14th Five-Year Plan for the development of e-commerce clearly proposes to comprehensively accelerate green transformation. It guides CBEC enterprises to proactively adapt to green development requirements, establish green development concepts, and fulfill social responsibilities for ecological protection. CBEC pilot zones have also responded to national policies by deeply integrating the concept of sustainable development into industrial plans. For example, the Hangzhou pilot zone took the lead in establishing a green certification standard system for CBEC, issuing “green e-commerce” certification labels to enterprises using degradable packaging and new energy transport vehicles and providing logistics cost subsidies, which has reduced packaging waste by 30% in the region. The Shenzhen pilot zone has developed a full-chain carbon footprint tracking platform through digital technologies, enabling consumers to monitor product emissions via QR codes and incentivizing enterprises to optimize supply chains. More than 200 leading CBEC enterprises have accessed the platform, achieving quantifiable and visualized carbon emission reductions. Against this policy backdrop, this paper focuses on how CBEC pilot zones influence firms’ carbon emission intensity, offering empirical insights for sustainable digital trade policies.
3.2. The Direct Impact of Digital Trade on Firms’ Carbon Emission Intensity
As an innovative practice integrating cross-border trade and the digital economy, CBEC pilot zones provide a new pathway for firms to reduce carbon emission intensity through their trinity development advantages of digitization, efficiency, and internationalization, supporting firms to reach sustainability targets. First, at the digital level, pilot zones actively deploy digital infrastructure, promoting the widespread application of cutting-edge technologies such as big data analytics, AI systems, and blockchain networks in cross-border trade [13]. This empowers zone enterprises, logistics service providers, and information processing centers to explore environmentally friendly operation models featuring efficient resource utilization and waste recycling, thereby reducing firms’ unit carbon emissions during operations. Second, in terms of efficiency, pilot zones have deepened delegation, regulation, and service reform, constructing an intelligent government service system and implementing a 24 h intelligent approval system to achieve efficient approval—completing business license processing within one working day. Meanwhile, relying on the “single window” platform for international trade, they have enabled collaborative offices among customs, taxation, and foreign exchange departments, significantly reducing the use of paper documents and personnel mobility and directly lowering carbon emission intensity in trade activities. Third, in terms of internationalization, pilot zones align with high-standard global trade rules, helping the integration of firm into the global green trade system. They guide enterprises to align with international low-carbon standards in raw material procurement, manufacturing, and logistics, achieving green upgrading of the entire industrial chain [34]. Additionally, digital trade development has strengthened global collaboration and technical knowledge transfer, facilitating the dissemination and sharing of low-carbon technologies, green concepts, and innovative models in cross-border trade [35] and thereby promoting reductions in firms’ carbon emission intensity.
Drawing from the above discussion, this paper posits the subsequent theoretical hypothesis:
H1:
The development of digital trade contributes to the reduction in firms’ carbon emission intensity.
3.3. Impact Mechanism of Digital Trade on Firms’ Carbon Emission Intensity
The reduction in firms’ carbon emission intensity relies on the synergistic effect of internal innovation and external environment optimization. Digital trade, exemplified by the CBEC pilot zones, precisely influences firms’ emission reduction pathways by driving these two dimensions. In terms of internal innovation deepening, the CBEC pilot policy can guide enterprises to form green awareness and carry out green production activities, decreasing firms’ energy usage and emission outputs. In terms of external environment optimization, the CBEC pilot policy can provide financial support and protect innovation rights, offering an external impetus for enterprises’ low-carbon transformation. These two pathways are complementary. The internal innovation deepening reduces carbon emissions per unit of output at the source, while external environment optimization provides institutional guarantees and resource support, jointly driving down carbon intensity. Accordingly, this paper analyzes the mechanism through which the CBEC pilot policy affects firms’ carbon emission intensity from two dimensions: the internal paths of “green awareness formation” and “green production implementation” and the external paths of “financial support improvement” and “innovation rights safeguard”, as specifically shown in Figure 1.
Figure 1.
Dual-pathway impact mechanism diagram.
3.3.1. The Path of Deepening Internal Innovation
Based on the Resource-Based View (RBV) and Dynamic Capability Theory (DCT), a firm’s sustainable advantage fundamentally stems from its ability to build and renew unique resources. The CBEC pilot zone policy precisely activates this intrinsic capacity within enterprises, thereby driving the deepening of their green transformation. The policy first enhances managers’ perception of green opportunities through information spillovers and competitive effects, guiding firms to develop green awareness and proactively allocate resources to green initiatives. Based on this, firms further leverage the digital tools provided by the pilot zones to optimize production processes and improve energy efficiency, translating green concepts into tangible green production capabilities. This pathway—from awareness shaping to action transformation—enables firms to establish new competitive advantages in low-carbon development. The specific impact pathways are as follows.
Firstly, policy guidance has led to a change in firms’ mindset. The introduction of the pilot zones has guided enterprises to form green awareness, thus cutting carbon emission intensity. The enhancement of green management capabilities is a direct reflection of the deepening of firms’ green awareness and serves as an internal driving force for low-carbon transformation. To start with, the pilot zones’ preferential policies facilitate the clustering of green industries, forming an industrial ecosystem. This has attracted numerous professionals specializing in green technology and management. These talents brought cutting-edge green technological concepts and innovative thinking to enterprises. Through systematic environmental training within the enterprise, the green governance concept has gradually permeated from the management level to grassroots employees. In addition, as an innovative model combining “digital economy and cross-border trade,” CBEC lowers international trade barriers while exposing enterprises to increasingly stringent global low-carbon standards like the EU Carbon Border Adjustment Mechanism, compelling proactive improvements in green management. Next, the improvement of green management capabilities means that enterprises fully integrate the concepts of environmental protection, resource conservation, and social responsibility into their production and business activities. This drives enterprises to pay more attention to ecological and social benefits during their operations [36]. Specifically, green management steers enterprises in curtailing both resource utilization and waste generation during the production phases through measures such as setting environmental protection goals, implementing environmental audits, and establishing environmental management systems [37].
Secondly, the policy promotes changes in firms’ behavior. The introduction of the pilot zones drives the optimization of enterprises’ green production efficiency, thus cutting firms’ carbon emission intensity. As a key driver of green production efficiency, the improvement of green total factor productivity (GTFP) offers significant support for firms’ low-carbon transition. To start with, CBEC platforms accelerate the growth of big data and digital technologies. Their application enables enterprises to better manage production processes. With the internet and artificial intelligence, companies can monitor production line operations in real-time, adjust plans promptly, avoid equipment idling and material waste, and enhance productivity [38]. Moreover, the pilot zones’ resource-sharing platforms boost collaborative innovation between enterprises and partners like overseas suppliers and logistics service providers. Companies can access the latest international green technologies and product information, upgrade their internal industrial structure, and further improve GTFP [39]. Next, higher GTFP means that enterprises can achieve higher green output with fewer resource inputs. The improved resource utilization efficiency directly reduces energy consumption per unit of output, promoting greener production and playing a crucial role in lowering carbon intensity [40]. Usually, efficiency gains are linked to technological and process innovations, which can introduce cleaner production methods and renewable energy [41], further reducing carbon emissions. In addition, higher GTFP often comes with optimized production organization, creating a resource-saving and eco-friendly production model [42]. This combined effect enables enterprises to stay competitive while continuously reducing environmental loads per unit of output.
Drawing from the above discussion, this paper posits the subsequent theoretical hypothesis:
H2a:
The development of digital trade can reduce carbon intensity by spurring firms to deepen internal innovation, that is, fostering firms’ green awareness and driving green production implementation.
3.3.2. The Path of External Environment Optimization
Based on the Porter Hypothesis, appropriately designed environmental regulations can stimulate corporate innovation and generate innovation compensation effects. The CBEC pilot zone policy, as an environmental regulation that combines “market-pull” and “innovation-driven” mechanisms, establishes an innovation compensation cycle through dual pathways of “resource empowerment” and “institutional guarantee”: On the resource front, the pilot zones provide targeted financial support, alleviating corporate financing constraints and enabling enterprises to sustain long-term emission reduction projects. On the institutional front, strengthened intellectual property protection ensures the appropriability of returns from green innovation, transforming environmental pressures into foreseeable profit opportunities. Together, these mechanisms ignite corporate motivation for green innovation and construct a synergistic low-carbon development support system characterized by “financial support–innovation protection.” The specific impact pathways are as follows.
Firstly, the policy brings resource support. The establishment of CBEC pilot zones reduces firms’ carbon emission intensity by enhancing financial support for them. The alleviation of firms’ financing constraints, a key manifestation of improved financial support, provides financial resource backing for enterprises’ low-carbon transformation. To start with, the pilot zones enhance the efficiency of cross-border fund settlement, allowing enterprises to net off overseas marketing and warehousing expenses against export proceeds and simplifying foreign exchange procedures for small and micro-enterprises, thereby improving cash flow management and reducing capital occupation pressure. Meanwhile, through data sharing and regulatory innovation, the pilot zones enhance financial institutions’ credit assessment capabilities for CBEC enterprises, mitigate information asymmetry, and further improve financing efficiency [43]. In addition, tax incentive policies within the pilot zones can improve enterprises’ cash flow conditions, thereby reducing their reliance on high-leverage operations. They can also attract more enterprises to innovate and enhance market competitiveness and the bargaining power of upstream and downstream players, thus alleviating financing constraints [44]. Next, financing constraints are an important factor restricting enterprises from upgrading industrial structures and undertaking green transformation. The alleviation of financing constraints can enhance enterprises’ long-term investment capabilities, create favorable conditions for formulating more strategic and systematic green transformation plans, and effectively promote low-carbon economic development [31]. Specifically, the alleviation of financing constraints provides enterprises with a relatively stable fund guarantee, enabling them to plan and execute long-term green strategies. For example, with a fund guarantee, enterprises can increase investment in the R&D of green products and market promotion efforts and facilitate the creation of ecologically sustainable goods that cater to green demand while systematically lowering production-related emissions across the value chain [45].
Secondly, the policy provides institutional guarantees. The establishment of CBEC pilot zones reduces firms’ carbon emission intensity by safeguarding their innovation rights. Enhanced intellectual property (IP) protection, a key manifestation of safeguarded innovation rights, provides institutional guarantees for enterprises’ low-carbon transformation. To start with, IP protection is listed as one of the key tasks in CBEC pilot zones. By improving the IP protection mechanism, the pilot zones ensure that enterprises’ innovative achievements are effectively protected. Chinese policy documents state that foreign trade enterprises should be encouraged to leverage new trade forms such as CBEC to explore international markets and build independent brands. Meanwhile, it is required to accelerate the formulation of IP protection norms for CBEC and guide relevant enterprises to strengthen IP risk prevention and control. Governments in many regions have actively responded to national policies. Key cities including Hangzhou, Shenzhen, and Shanghai took the lead in carrying out special actions for IP protection in CBEC, such as strengthening supervision over e-commerce platforms to crack down on counterfeit goods and establishing CBEC IP protection workstations to provide rights protection assistance for enterprises. Next, as important intangible assets of enterprises, IP rights can enhance their competitive advantages and promote green transformation [46]. The improvement of the IP protection system not only reduces enterprises’ costs in patent application, rights protection, and other aspects but also suppresses imitation behavior by increasing the cost of infringement, thereby enhancing enterprises’ willingness to invest in low-carbon technologies such as energy-efficient utilization technologies, clean production technologies, and waste recycling technologies [47]. Simultaneously, since enterprises do not need to frequently invest resources in technical rights protection or deal with unfair competition, they can concentrate more resources on the R&D of environmentally friendly products and services, further promoting green transformation and sustainable development.
Drawing from the above discussion, this paper posits the subsequent theoretical hypothesis:
H2b:
The development of digital trade can reduce firms’ carbon emission intensity by leading the optimization of their external environment, that is, it provides financial support resources and offers an institutional safeguard for innovation rights.
4. Research Design
4.1. Sample and Data
To avoid the impact of the 2008 global financial crisis and account for the fact that China surpassed Germany to become the world’s largest exporter in 2009, the starting point of the sample is set at 2010. This ensures that the study covers the period during which China has maintained its position as the global export leader, while also considering data availability. Therefore, this paper utilizes listed export-oriented industrial enterprises from the Shanghai and Shenzhen A-share markets from 2010 to 2023 as the research sample. To mitigate potential biases from anomalous entities, the following data processing procedures were implemented: ① ST, *ST, and PT companies were excluded; ② enterprises registered in Xinjiang, Tibet, Inner Mongolia, Hong Kong, Macao, and Taiwan regions were excluded; ③ financial companies were excluded; ④ samples with only one year of observation were excluded; ⑤ the application of linear interpolation was used to address partial data gaps; ⑥ the linear interpolation method was used to complete part of the missing data; ⑦ this paper performed bilateral tailing at 1% on both sides for all continuous variables. After the above treatments, a total of 19,739 observations were obtained. The control variables at the enterprise level in this paper mainly come from the China Stock Market and Accounting Research Database (CSMAR), the patent data comes from the China Research Data Service Platform (CNRDS), the industry’s main business costs and energy consumption data come from the China Statistical Yearbook, and the city-level data mainly come from the China Urban Statistical Yearbook.
4.2. Variable Measurement and Description
4.2.1. Explained Variable: Firms’ Carbon Emission Intensity (CI)
During the process of collecting corporate carbon emission data, it was observed that voluntary disclosure of such data by enterprises is relatively scarce. To enhance the credibility of the results as much as possible, this study adopts two methods to measure corporate carbon emission intensity.
In the first method, the industry carbon emission estimation is used to indirectly derive corporate carbon emissions. Drawing on the research approach of Yang et al. [2] and Xu et al. [33], industry-level carbon emissions are first calculated by multiplying the energy consumption of each industry by the corresponding carbon dioxide conversion coefficient based on national energy conversion standards. Corporate carbon emission is then estimated using the proportion of the firm’s main business cost to the total industry cost. Corporate carbon emission intensity () can be calculated by dividing the carbon emissions by the firm’s main business revenue, as specified in Equation (1).
where and denote the core business costs at the enterprise and industry levels, respectively. is the industry energy consumption, is the carbon dioxide conversion coefficient, and is the firms’ main business income.
In the second method, following the methodology of Wang et al. [48] and Sun et al. [49], a data mining approach is employed to extract various types of energy consumption information from corporate sustainability reports, social responsibility reports, environmental reports, and investor relations activities. For enterprises that directly disclose carbon emission data, the figures are standardized and directly applied. For those that do not disclose such data, their consumption of petroleum, coal, and electricity is converted into standard coal equivalents, which are then multiplied by the carbon emission conversion coefficient to derive their carbon emissions. Then, carbon emission intensity () is calculated by dividing the carbon emissions by the firm’s main business revenue.
Given that the first method is widely used in academia and relies on stable and reliable data sources, while the second method is subject to variations in data disclosure quality and significant data gaps, this study primarily employs the first method for core analysis. The second method is used only as supplementary verification in the baseline regression to enhance the robustness of the research conclusions.
4.2.2. Explanatory Variable: CBEC Pilot Policy ()
China’s CBEC pilot zones were established in 2015, 2016, 2018, 2019, 2020, and 2022. Considering the timeliness of policy implementation, this paper restricts the sample to municipalities designated during the initial five implementation phases. This policy dummy variable serves as the core explanatory indicator, reflecting whether a city established a CBEC comprehensive pilot zone in a given year. Enterprises are matched based on their registered address and city. If an enterprise is registered in a prefecture-level city included in the CBEC pilot zones, it is coded 1 starting from the intervention year onward; otherwise, it is coded 0 for years before approval or in non-approved cities.
4.2.3. Control Variables
To lower potential confounding effects from internal firms’ characteristics and city-level economic development characteristics on firms’ carbon emission intensity, following the methodological precedents set by Song et al. [3] and Cheng et al. [26], this paper incorporates the following control variables. At the enterprise level, we include executive compensation level (Econ_sal), enterprise assets (Assets), proportion of the top ten shareholders (TOP10), Tobin’s Q value (TobinQ), intangible asset ratio (IAR), return on net assets (ROE), and total asset turnover (TAT); at the city level, the control variables selected are financial development degree (DFD), industrial structure advancement (ISU), and urbanization rate (Urban). The measurement methods of specific control variables are presented in Table 1.
Table 1.
Definitions and explanations of control variables.
4.3. Descriptive Statistical Analysis
Table 2 presents the results of the descriptive statistics for the variables. The data indicate significant variations in carbon emission intensity among firms calculated using the two methods, which may stem from disparities in energy use efficiency and the uneven application of environmental protection technologies across firms. Meanwhile, the mean value of the CBEC pilot policy reaches 0.466. This indicates that during the research period, approximately 46.6% of the enterprises are located in cities where the CBEC pilot zones have been established. This proportion shows that the coverage of the pilot zones is relatively wide, providing a sufficient sample size for evaluating the policy effects. In addition, some enterprises still exhibit a high carbon intensity, reflecting their inadequate adoption of low-carbon technologies. It is urgent to improve this situation through policy guidance and technology diffusion, further highlighting the necessity of this research.
Table 2.
Descriptive statistics.
4.4. Model Construction
This study employs a quasi-experimental research design, leveraging the phased implementation of the CBEC pilot policy as an exogenous policy shock, to empirically examine the causal effect of digital trade on firms’ carbon emission intensity. Specifically, we implement a multi-period difference-in-differences (DID) framework that compares treated and control groups before and after policy implementation, with the formal model specification presented below:
In the above equation, and represent the enterprise and the year, respectively; is the core explained variable of this paper, representing the carbon emission intensity of enterprise in year ; represents the policy effect brought by the CBEC pilot zones; represents the set of control variables; , , and represent the individual fixed effects, time fixed effects, and the residual term, respectively.
5. Results and Discussion
5.1. Baseline Regression Results
Table 3 presents the baseline regression outcomes across four specifications. Column (1) displays uncontrolled estimates, column (2) incorporates only fixed effects, and column (3) includes control variables without fixed effects. The coefficients of the key explanatory variable remain statistically significant at the 1% level throughout. Most importantly, in columns (4) and (5), which include control variables while also controlling for year and firm fixed effects, the coefficient of the core explanatory variable remains statistically significant at the 1% level for both carbon emission intensity measures. This preliminarily proves that the establishment of CBEC pilot zones can significantly lower the carbon emission intensity of enterprises.
Table 3.
Baseline estimation tests.
5.2. Parallel Trend Test
The validity of our multi-period difference-in-differences (DID) framework hinges on satisfying the parallel trends assumption. This diagnostic test examines whether the firms’ carbon emission intensity in pilot zones and non-pilot zones follows a similar trend before the implementation of the CBEC pilot policy. If their trends are identical before the policy implementation, the post-policy differences can be attributed to the policy itself. Given the long time span of the research sample, we categorize samples taken less than 5 years before the policy implementation into the 5th year prior and those taken more than 6 years after into the 6th year post. Here, the −5 period is set as the base period, as specified in Equation (3). For clarity, the new interaction terms are graphically presented in Figure 2.
Figure 2.
Parallel trend test plot.
The results show that prior to the policy’s implementation, the estimated coefficients fail the significance test. This confirms there is no notable distinction in carbon emission intensity between the experimental and control groups before the introduction of the CBEC pilot policy. During and immediately after the pilot zones were set up, the coefficients were negative, yet statistically insignificant. This may be because Hangzhou was the only pilot city at that time, and the limited policy coverage made it hard to fully demonstrate effects in the short term. However, as the CBEC pilot zones expand over time, the coefficients show a clear downward trend and become significant at the 5% level. This suggests that the CBEC pilot policy successfully lowers firms’ carbon intensity, providing preliminary validation for hypothesis H1.
5.3. Robustness Tests
5.3.1. Placebo Test
Although this paper has controlled for firm-level individual effects and time effects, considering potential omitted variable issues and interference from accidental factors, we adopt the methodology outlined by Liu and Lu [50] to randomly generate a false list of CBEC pilot zones, simulating the randomness of policy implementation. Specifically, we construct virtual treatment groups through 1000 repeated samplings and re-estimate the model parameters. Figure 3 displays the kernel density estimation curve of the estimated coefficients for the pseudo-policy dummy variables and the corresponding p-value distribution. It can be seen that the estimated coefficients peak near 0 and approximate a normal distribution. Most p-values are higher than the significance level, and the actual estimated coefficients significantly deviate from the central region of the kernel density estimation curve.
Figure 3.
Placebo test diagram.
5.3.2. PSM-DID Test
The implementation of the policy is not random but may be based on selective criteria tied to regional economic foundations and industrial profiles, which results in notable disparities in company attributes between pilot and non-pilot areas. To mitigate potential selection bias, the analysis utilizes propensity score matching (PSM) to re-construct comparable control groups for treated firms. Specifically, we applied a 1:1 nearest neighbor matching without replacement and matching covariates align with baseline regression controls, maintaining a characteristic balance across treatment and comparison samples and thereby eliminating systematic bias. As shown in Figure 4, the standard deviations of all covariates after matching are close to zero, indicating that the selection bias is effectively controlled. Subsequently, this paper re-conducts the multi-period DID regression based on the matched samples. The outcomes in column (1) of Table 4 show that the estimated coefficient of the CBEC pilot policy is −4.647 with 99% confidence. This further confirms the robustness of the original model, demonstrating that the potential bias from sample selection has not significantly impacted the study’s conclusions.
Figure 4.
Results of propensity score matching.
Table 4.
Robustness test results.
5.3.3. Replacement of Explained Variable
To validate the robustness of the conclusions, this research employs the environmental rating (E) from the HuaZheng ESG rating system as an alternative indicator for the effectiveness of firms’ carbon emission management. The environmental rating (E) comprehensively assesses an enterprise’s performance in energy use efficiency, pollutant emissions, resource utilization, and other aspects, which can more comprehensively reflect the enterprise’s impact on the environment [1]. Referencing the approach of Zhao et al. [51], this paper assigns values from one to nine to the nine environmental rating (E) levels from C to AAA, where a higher score signifies superior environmental performance and a lower score indicates poorer performance. These regression results in column (2) of Table 4 reveal that the coefficient of interaction term is 0.952, which is statistically significant at the 1% level, suggesting that the introduction of the policy is conducive to enhancing firms’ environmental performance. This further bolsters the trustworthiness of research conclusions.
5.3.4. Exclusion of Concurrent Policy Interference
During the sample research period, the national government successively implemented policies such as the Low-Carbon City Pilot and the Broadband China Pilot. Among these, the Low-Carbon City Pilot policy directly focuses on carbon emission management and may indirectly affect enterprises’ energy use efficiency by adjusting urban energy consumption structures [52]. Meanwhile, the Broadband China Pilot policy influences corporate carbon emissions by promoting the development of digital infrastructure [53]. To mitigate potential interference from the overlapping effects of these policies, this study introduces the urban energy consumption structure and digital infrastructure level as control variables. Specifically, following the method of Song et al. [54], the urban energy consumption structure (UEC) is measured by the proportion of coal consumption to total energy consumption. Regarding the measurement of urban digital infrastructure levels, this study draws on the methodology of Li et al. [38] by extracting the frequency of digital-infrastructure-related keywords from each city’s government work report. Selected keywords include 51 terms such as “networking,” “information infrastructure,” “mobile payment,” and “internetization.” The final measurement is constructed as the proportion of these keywords’ frequency to the total word count of the government work report. The results in column (3) of Table 4 show that after controlling for the above variables, the estimated coefficient of CBEC pilot zones on carbon intensity remains significantly negative. This indicates that although other policies may have some impact on firms’ carbon intensity, the CBEC pilot policy still has an independent and significant effect in promoting the low-carbon transformation of enterprise.
5.3.5. Modification of the Study Sample
First, as municipalities directly under the Central Government (Beijing, Shanghai, Tianjin, and Chongqing) often enjoy more policy support and resource allocation, such as the large-scale construction of national-level new areas and layout of cutting-edge industrial pilot projects, their economic development, industrial structure, and digital infrastructure are generally superior to those of other cities. Additionally, municipalities primarily focus on service industries and high-tech sectors, with technological standards, environmental protection investments, and implementation criteria typically higher than other cities. This particularity may cause enterprises located in these municipalities to exhibit distinct trends in carbon emission intensity compared to other cities. Excluding municipalities can avoid the interference of these special factors on regression results, making research conclusions more generalizable. Second, considering that the first () estimation method based on industry-level carbon emissions may overlook individual variations in carbon emissions due to differences in technological advancement and management efficiency, this study additionally conducted a robustness test using a subsample of enterprises that voluntarily disclosed carbon emission data directly. The regression results, presented in columns (4) and (5) of Table 4, show that the coefficients of the core explanatory variables remain significant, confirming the robustness of the conclusions drawn in this study.
5.3.6. Counterfactual Test
To address potential confounding from unobservable external factors and validate the robustness of our findings, this paper performs a counterfactual test by altering the implementation time of the CBEC pilot policy. Specifically, this research constructs a new interaction term by combining a dummy variable that advances the CBEC pilot zones’ implementation by two years with the treatment group and tests the baseline model. If the effect of the policy on carbon intensity remains significant, it may imply that the baseline regression results may be interfered with by other factors. Conversely, it indicates the conclusion is robust. As shown in column (6) of Table 4, after advancing the policy implementation time by two years, the new interaction variable shows insignificant influence on enterprise carbon intensity, implying that the policy effect is only significant within the actual implementation time-frame.
5.3.7. Double Machine Learning
The multi-temporal DID design identifies treatment impacts by leveraging the variation in exposure timing across treatment and control units, and its validity relies on the parallel trend assumption. However, empirical applications may suffer from methodological challenges, including unobserved confounders or non-random sampling. By introducing the double machine learning (DML) approach, we can flexibly control high-dimensional covariates, overcome the “curse of dimensionality”, and capture potential nonlinear relationships or interaction effects, thereby permitting more precise quantification of the policy’s net impact [55]. Accordingly, the paper employs a random forest algorithm as the baseline model and initially sets the sample splitting ratio at 1:4. To verify the stability of empirical findings, on one hand, this paper adjusts the splitting ratios to 1:2 and 1:6, respectively, for re-estimation; on the other hand, it systematically replaces the prediction algorithms, successively using a neural network (Nnet) and LASSO regression (Lassocv) to verify whether the estimation results are influenced by the selection of specific algorithms. The above-mentioned estimation outcomes are presented in Table 5. The estimated policy impact on carbon intensity demonstrates numerically plausible variations, thus confirming the robustness of primary regression findings.
Table 5.
Robustness tests of machine learning.
5.4. Endogeneity Tests
This study enhances the credibility and robustness of the research findings by introducing instrumental variables. Adopting the analytical approach developed in Jiang and Huang [21], this paper utilizes the distance from a city to the nearest port as an instrumental variable. The specific reasons are as follows. As key nodes of international trade, coastal ports have inherent logistic hub advantages. Regions around them can integrate into the global trade system more efficiently by virtue of lower transportation costs, a higher level of trade facilitation, and more complete infrastructure. These advantages make cities closer to coastal ports inclined to be chosen as pilot areas for CBEC pilot zones. In addition, due to their geographical advantages, coastal port cities tend to exhibit greater attractiveness to international capital flows, technological transfers, and skilled migration, thus providing better basic conditions for the operation of the CBEC pilot policy. However, the distance between a city and a coastal port is a geographical feature mainly determined by natural conditions and historical development and exhibits no statistically significant causation with the current carbon emission intensity of enterprises, which just meets the relevance and exogeneity requirements of instrumental variables. Since the instrumental variable has no time characteristics, this paper lags the number of internet users by one period and then forms an interaction term with the reciprocal of the distance from firms’ registered municipality to the nearest maritime terminal the as instrumental variable. The results in Table 6 show that the Anderson LM statistic is 239.28, rejecting the null hypothesis of underidentification at the 1% significance level. Furthermore, the Cragg–Donald Wald F statistic is 211.38, substantially exceeding the Stock–Yogo critical value of 16.38 at the 10% maximal bias level, indicating no weak instrument problem. In the first stage, the instrumental variable shows a significantly positive correlation with the pilot zone policy. The second-stage results demonstrate that the coefficient of the interaction term remains significantly positive at the 1% level, further validating the robustness of our previous findings.
Table 6.
Endogeneity tests.
To further examine the exclusion restriction of the instrumental variable, this study follows the approach of Liu et al. [56], conducting indirect tests from the following two aspects. First, using the sample of cities that had never established CBEC pilot zones as of the study period, we examine whether the distance from a city to the nearest port still exerts a systematic impact on corporate carbon intensity. If the instrumental variable satisfies the exclusion restriction, its effect should be insignificant in this subsample, indicating that the influence of port distance must operate through the policy channel of “being selected as a pilot zone” to take effect. Second, we conduct additional tests using the pre-policy implementation sample (2010–2014). If port distance shows no significant impact on corporate carbon intensity before policy implementation, this would suggest that the post-policy effects stem from the policy shock itself rather than inherent city characteristics associated with port proximity. The results in columns (3) and (4) of Table 6 show that the estimated coefficients of the instrumental variable are both small and statistically insignificant in these two subsamples. This indicates that city–port distance is unlikely to affect corporate carbon intensity through channels other than the establishment of pilot zones, thereby supporting the exclusion restriction of the instrumental variable.
6. Dual Pathways Exploration
The above robustness tests have demonstrated that the digital trade policy, represented by CBEC pilot zones, can lower firms’ carbon intensity. Next, based upon the previous research hypotheses, this paper verifies the internal and external mechanism of influence from digital trade on firms’ carbon emission intensity through two paths: internal paths of “green awareness formation” and “green production implementation” and external paths of “financial support improvement” and “innovation rights protection”. The specific mediating models are set as follows:
In the above equations, represents four mediating variables.
6.1. Internal Conceptual Path: Green Awareness Formation
The enhancement of green management capability is a direct manifestation of the formation and deepening of enterprises’ green awareness. This paper uses green management capability (GMC) to characterize the level of enterprises’ green awareness formation. For the measurement of GMC, referring to the approach of Zhao and Chen [57], a comprehensive indicator system is constructed based on environmental disclosure information in the CSMAR database. Specifically, this paper evaluates companies based on their achievement of environmental targets, development of environmental management systems, engagement in environmental education and training sessions, involvement in targeted environmental protection initiatives, formulation of environmental contingency protocols, and receipt of environmental accolades. After summing these indicators, adding 1 and taking the logarithm are performed to address the skewness of data distribution, thus obtaining the GMC indicator. However, considering that the method of environmental information disclosure may itself be influenced by corporate “greenwashing” motivations [58], this study additionally employs the text analysis method of Ding et al. [59] to supplement the measurement of green management capability using executive green perception (EGP). This indicator reflects the level of green management awareness among corporate executives by counting the frequency of green development keywords in annual reports. The regression results are shown in columns (1) to (4) of Table 7. It can be observed that regardless of the measurement methods used, the coefficients of the CBEC pilot policy on corporate green management capability are significantly positive, indicating that the establishment of the pilot policy can enhance enterprises’ actual green management capability. Furthermore, when both green management capability and the pilot policy are included in Equation (5), the coefficient of the pilot policy on corporate carbon emission intensity remains significantly negative but decreases in magnitude, while the coefficient of green management capability is also significantly negative. These results have further passed both the Bootstrap test and Sobel test, demonstrating that green management capability plays a significant mediating role between the CBEC pilot policy and corporate carbon emission intensity, thereby validating hypothesis H2a.
Table 7.
Pathway test results I.
6.2. Internal Behavioral Path: Green Production Implementation
The improvement of corporate green total factor productivity (GTFP) is a key driver of green production efficiency. This study uses GTFP to represent the level of corporate green production enhancement. For the measurement of GTFP, following the method of Wu et al. [60], this paper adopts the non-radial SBM-ML index method to estimate the GTFP of listed companies. The input factors are the number of employees, net fixed assets, and converted industrial electricity consumption, while the desired output is the company’s operating revenue, and the undesired output is the standardized emission of industrial wastewater, waste gas, and solid waste based on the proportion of employees in urban employment. The regression results are shown in columns (5) and (6) of Table 7. First, the estimated coefficient of the pilot policy on corporate GTFP is significantly positive, indicating that the establishment of the pilot policy can enhance corporate GTFP. Second, when both GTFP and the pilot policy are included in Equation (5), the coefficient of the pilot policy on corporate carbon emission intensity remains significantly negative but decreases in magnitude, while the coefficient of GTFP is significantly positive. Furthermore, these results have passed both the Bootstrap test and Sobel test, demonstrating that the CBEC pilot policy can further reduce corporate carbon emission intensity by improving corporate green total factor productivity, thereby validating hypothesis H2a.
6.3. External Resource Path: Financial Support Improvement
The alleviation of firms’ financing constraints is an important manifestation of improved financial support. This paper employs financing constraints to gauge the extent of obstacles businesses encounter when seeking outside funding. For the measurement of financing constraints (SA), following the methodology developed by Guo et al. [61], this study applies the SA index to assess firms’ funding difficulties. To mitigate potential biases from numerical scaling effects in estimation outcomes, this study processes the SA index by taking its absolute value. The metric’s magnitude exhibits a positive correlation with the severity of firms’ financing constraints—higher SA index values correspond to more pronounced financing difficulties. This is shown in columns (1) and (2) of Table 8. First, the negative coefficient for the pilot zone’s effect on firms’ financing constraints is statistically significant, suggesting that the pilot policy efficiently mitigates the financial strain on businesses by improving the financial environment. Second, when the SA index and the pilot policy are simultaneously included in Equation (5), it is found that the pilot policy effect on carbon intensity remains significantly negative but with a reduced value, and the SA index coefficient is positive. Moreover, the above results have passed both the Bootstrap test and Sobel test, demonstrating that the establishment of the pilot zones can reduce corporate carbon emission intensity by alleviating corporate financing constraints, thereby validating hypothesis H2b.
Table 8.
Pathway test results II.
6.4. External Institutional Path: Innovation Rights Safeguard
The strengthening of intellectual property (IP) protection levels is a crucial manifestation of safeguarding innovation rights. This paper uses the IP protection level to characterize the degree of institutional guarantee for enterprises’ innovation rights. For measuring the intellectual property protection level (IPRP), following the approach of Fan et al. [62], an urban-level IP protection intensity index is constructed based on the PKU law database. Specifically, the ratio of the number of concluded intellectual property cases in each city to the local GDP was used as the measure. This is because the number of concluded intellectual property cases in a region directly reflects the “output” and “efficiency” of its judicial system in handling intellectual property disputes. A higher number of concluded cases indicates more sufficient investment of judicial resources in this field and greater accessibility for intellectual property owners to seek judicial remedies, thereby signaling the effective operation of the regional intellectual property judicial protection system. This approach eliminates the impact of differences in city scale, making comparisons between cities of different sizes more feasible. Therefore, a higher value of this indicator represents a stronger level of intellectual property protection and vice versa. The corresponding regression results are shown in columns (3) and (4) of Table 8. First, the coefficient of the pilot zone for the intellectual property protection level is significantly positive, implying that the establishment of the CBEC pilot policy can enhance the IP protection level for enterprises. Second, when both the IP protection level and CBEC pilot policy are included in Equation (5), regression outputs demonstrate that policy influence on firms’ carbon emission intensity remains significantly negative but with a reduced value, and IP protection maintains robust negative estimates. Moreover, these results have passed both the Bootstrap test and the Sobel test, demonstrating that CBEC pilot zones can lower carbon intensity by strengthening IP protection for enterprises, thereby validating hypothesis H2b.
7. Further Analysis
7.1. Heterogeneity Analysis
To further clarify the heterogeneity of the impact of digital trade policy on firms’ carbon emission intensity, this paper reveals the differentiated effects of the CBEC pilot policy on firms’ carbon emission intensity under different enterprise characteristics, industry attributes, and regional environments from three levels: micro, meso, and macro. This aims to provide more precise theoretical support and practical guidance for policy formulation and implementation. In terms of statistical testing, this paper employs Fisher’s permutation test to examine the differences in coefficients between groups, with the number of Bootstrap replications set to 1000.
7.1.1. Enterprise Characteristics: Executive Risk Preference
According to the Upper Echelons Theory, senior managers’ preferences, thinking patterns, and values significantly influence firms’ strategic decisions. Executives with high risk tolerance can typically overcome myopic thinking—they are more willing to assume the potential risks of green transformation and reduce the negative impact of R&D investments through the mental accounting of high-return risky investments. This adventurous spirit prompts enterprises to increase investments in green technologies and sustainable development projects to enhance their environmental image. In contrast, executives with low risk tolerance may prefer to maintain the status quo and avoid investing in uncertain environmental protection projects [63]. Therefore, the effect of this pilot policy on firms’ carbon intensity may vary depending on the risk preference of enterprise executives. Based on this, referring to the method of Chen and Shu [64], this paper uses the ratio of enterprise risk assets to total assets as a proxy variable for executive risk preference and then divides it into a high-executive-risk preference group and a low-executive-risk preference group in accordance with the median. The regression results are shown in columns (1) and (2) of Table 9. The intergroup coefficient difference is significant at the 1% level, indicating that the pilot policy has a more pronounced effect in reducing corporate carbon emission intensity among enterprises with a higher executive risk appetite. This further verifies that risk-preferring executives are more likely to fully utilize policy dividends, actively invest in emission reduction technologies and clean energy, and promote enterprises to pursue green transformation while maintaining development.
Table 9.
Results of heterogeneity analysis I.
7.1.2. Enterprise Characteristics: Scale Differences
A firm’s asset size largely determines its resource base, market strategy, and risk response capabilities. These differences further influence the choices firms make in digital decarbonization pathways, potentially leading to varying impacts on carbon intensity. To explore this, the sample is divided into large-scale and small-to-medium-scale enterprise groups based on the median number of employees, and regression analyses are conducted separately for each group. The regression results, as shown in columns (3) and (4) of Table 9, indicate that the intergroup coefficient difference is significant at the 1% level, with the interaction term coefficient being larger in the large-scale enterprise sample. This suggests that the pilot zone’s suppressive effect on carbon intensity is stronger for large-scale enterprises compared to small- and medium-sized enterprises. The reason for this disparity may lie in the fact that large enterprises generally possess more robust financial support and R&D capabilities, enabling them to effectively absorb the green technology spillovers brought by digital trade and translate them into tangible energy efficiency improvements and emission reduction outcomes. In contrast, resource-constrained small- and medium-sized enterprises, while also benefiting from the policy, often prioritize allocating limited resources to survival and short-term profitability in practice. As a result, their technological investments and strategic focus on decarbonization are somewhat constrained, leading to a relatively smaller reduction in carbon intensity. However, we acknowledge that this estimated effect could be a little bit upwardly biased, given that larger firms inherently possess a greater capacity to respond to such policies.
7.1.3. Industry Attributes: Technological Differences
High-tech industries, by virtue of their inherent technological advantages, generally exhibit higher energy efficiency, with more intelligent and intensive production processes and management models. In contrast, non-high-tech industries, predominantly concentrated in manufacturing and labor-intensive sectors, often rely heavily on traditional high-energy-consuming production methods. When adopting low-carbon technologies, these industries may face higher technical barriers and transformation risks, leading to greater emission reduction costs during green transitions. Such cost disparities influence enterprises’ policy acceptance and implementation effectiveness, necessitating separate evaluations. This paper classifies the research samples into high-tech and non-high-tech industries corresponding to the National Bureau of Statistics’ classification standards for high-tech industries. The results in columns (1) and (2) of Table 10 show that in high-tech industries, CBEC pilot policy implementation leads to a 1% level significant reduction in firms’ carbon intensity, while the impact is insignificant in non-high-tech industries. This discrepancy may stem from high-tech enterprises’ strong R&D capabilities and innovative edge, facilitating their ability to efficiently leverage policy dividends. Through green technological innovation and energy structure optimization, they significantly reduce carbon emission intensity. In contrast, non-high-tech industries, dominated by traditional manufacturing, rely on high-carbon production methods and struggle to fully absorb the technological spillover effects of CBEC pilot zones in the short term, thus demonstrating lagged or limited policy responsiveness.
Table 10.
Results of heterogeneity analysis II.
7.1.4. Industry Attributes: Pollution Intensity
Against China’s unique regulatory backdrop, there are significant disparities in carbon emission intensity across industries. Heavily polluting industries typically face stricter policy pressures and environmental supervision. The government sets explicit emission limits based on their carbon emissions per unit of output and implements regular monitoring and assessment mechanisms. This results in distinct carbon emission structures and mitigation potentials between heavy-pollution and non-heavy-pollution industries. Such differential regulation may heighten the policy sensitivity of heavy-pollution enterprises. Therefore, the mechanism and effectiveness of the CBEC pilot policy on firms’ carbon emission intensity may vary by industry characteristics. Particularly, heavy-pollution industries may exhibit stronger responsiveness to policy-driven technological upgrades and green transformations. When evaluating the policy effects of pilot zones, it is crucial to account for varying environmental regulation intensities and policy sensitivities across industries to avoid estimation biases. Drawing on the Guidelines for Environmental Information Disclosure of Listed Companies, firms are grouped into non-heavy-pollution and heavy-pollution industries. The grouped regression results, presented in columns (3) and (4) of Table 10, show that the intergroup coefficient difference is significant at the 1% level. This indicates heterogeneity in the policy effects across industries with varying pollution intensities. Specifically, the pilot zone policy significantly suppresses the carbon emission intensity of heavy-polluting industries, while its effect is not significant in non-heavy-polluting industries. This result suggests that the environmental benefits of the policy are closely linked to the institutional pressure faced by industries and their inherent transformation needs. For heavy-polluting firms, the pilot policy, building upon existing environmental regulations, further provides key transition resources and feasible upgrading pathways by introducing digital technologies and expanding international market access. This finding dynamically integrates institutional theory with the Resource-Based View, revealing the boundary conditions under which digital trade policies yield significant environmental benefits: they are most effective for firms that are under intense institutional pressure and possess substantial potential for improvement.
7.1.5. Regional Environment: Geographic Location
Regional development imbalance is a fundamental situation in China’s current development. Studying the differences in the influence of CBEC pilot policy on carbon emission intensity when implemented in different regions helps to combine the characteristics of the economic structure, resource endowments, and policy environment of each region and take targeted measures to optimize the policy implementation effect. According to the distinctive features of China’s regional development, this paper divides the total sample into four regions according to the location of enterprises: eastern, northeastern, central, and western. The results are shown in Table 11. The intergroup coefficient differences are all significant at the 10% level, indicating that the effect of the pilot policy on reducing corporate carbon emission intensity varies across regions. Specifically, the significance in the eastern region is relatively weak, mainly because its economy is developed, the technical level is relatively high, the base of firms’ carbon intensity is relatively low, and the marginal effect of the policy effect is small. The northeastern region shows relatively significant results, indicating that although the share of conventional industries in this region is comparatively high, the implementation of the CBEC pilot policy has also produced tangible results in advancing enterprise industrial transformation and system reform, contributing positively to the decrease in firms’ carbon intensity. The central region is significant at the 1% level, mainly benefiting from its ability to make good use of policy dividends in the process of undertaking the industrial transfer from the east. Through industrial structure adjustment and technological innovation, it has effectively reduced firms’ carbon emission intensity. However, the regression results for the western region are not significant, reflecting the structural obstacles faced in policy implementation. On one hand, the western region is constrained by the “lock-in effect” of its high-carbon energy and industrial structure, with enterprises predominantly concentrated in carbon-intensive industries, which limits their alignment with the low-carbon orientation of cross-border e-commerce. On the other hand, the region suffers from a “digital-green” synergy gap, characterized by weak digital infrastructure and human capital, which restricts the enabling effects of leveraging the pilot zone for green transformation [65].
Table 11.
Results of heterogeneity analysis III.
7.2. Extended Analyses
7.2.1. Synergy Research Between the CBEC Pilot Policy and the Belt and Road Initiative
The strategic positioning and core objectives of the pilot zones lie in deeply integrating them into the nation’s overall opening-up framework, particularly by leveraging “Silk Road E-commerce” cooperation to actively align with the Belt and Road Initiative. This enables them to fully leverage their pivotal role in digital trade and their exemplary leadership in advancing green development. Serving as a key instrument for the nation’s advancement towards extensive openness, the CBEC pilot scheme strategically complements fundamental aspects of the Belt and Road Initiative, including enhanced infrastructure links, seamless trade, and financial cohesion via innovative institutional and model reforms. It can be seen that promoting the synergistic integrated development of the CBEC pilot policy and the Belt and Road Initiative is an important path for building a new international digital trade system. Accordingly, this study develops a triple difference model (6) to examine if the convergence of the two can significantly contribute to lowering firms’ carbon emission intensity.
In the above equation, is defined by referencing the approach of Du and Zhang [66], taking 2013 as the policy node for the Belt and Road Initiative. Core cities impacted by the Initiative are assigned a value of 1 for 2013 and subsequent years, while control group cities not affected are assigned 0. Other variables remaining conform to the prior description.
Empirical evidence from column (2) of Table 12 demonstrates that the Belt and Road Initiative notably amplifies the carbon-reducing impact of CBEC pilot zones. This indicates that the CBEC pilot zone strategy and the Belt and Road Initiative have formed a positive policy synergy, mutually promoting and deeply integrating to generate a “1 + 1 > 2” amplification effect.
Table 12.
Results of extended analysis.
7.2.2. Test of the Spatial Spillover Effect of the CBEC Pilot Zone
As discussed earlier, the establishment of the pilot zone has significantly reduced the carbon emission intensity of enterprises within the pilot cities. It is also noteworthy that the pioneering practices of the pilot zone in areas such as green logistics and clean energy technology application can provide replicable experiences for neighboring cities. Through technology spillover and competition–imitation effects, these practices may inspire broader corporate emission intensity reduction initiatives. To identify whether such spillover effects exist, this paper constructs the following model:
In the above equation, indicates whether a city adjacent to the registered location of enterprise in year has established a CBEC pilot zone. If such a pilot zone exists, the value is assigned as 1; otherwise, it is 0. Taking Wuhu City in Anhui Province as an example, Wuhu City is adjacent to Tongling City. Wuhu City was approved as a cross-border e-commerce comprehensive pilot zone in 2019. Thus, enterprises located in Tongling City are assigned a value of 1 from 2019 onward. If no adjacent city has ever established a pilot zone, the value remains 0. It is worth noting that, first, the adjacency relationship between cities where enterprises are located is identified based on a geographic contiguity matrix. Second, the focus of this model is on surrounding non-pilot cities. Therefore, the estimation sample does not include enterprises located in cities that have already established pilot zones.
Column (3) of Table 12 presents the results of the model. The findings indicate that the carbon emission reduction effect of the CBEC pilot zone has a radiating and driving impact. Specifically, the establishment of the pilot zone not only achieves local emission reductions but also significantly reduces the carbon intensity of enterprises in surrounding non-pilot cities through channels such as supply chain collaboration and technology diffusion. This further demonstrates that the policy plays a positive role in promoting regional green and low-carbon coordinated development, rather than being confined solely to the pilot zones themselves.
7.2.3. Comparative Analysis of Exporting and Non-Exporting Industrial Enterprises
To assess the universality of the policy impact of the CBEC pilot zone, this study expands the analysis to include non-exporting industrial enterprises and compares them with the sample of exporting enterprises. Descriptive statistics in Table 13 indicate that the carbon intensity of non-exporting enterprises is generally higher than that of exporting enterprises. The regression results for the non-exporting enterprise sample, as shown in column (4) of Table 12, reveal that the coefficient remains significantly negative at the 10% level, though its absolute value is smaller compared to that of the exporting enterprise subsample in column (1). This suggests that the carbon intensity reduction effect of the pilot zones is not exclusive to exporting enterprises but also applicable for those non-exporting enterprises. This may be attributed to the industrial synergy and agglomeration effects brought about by the pilot policy, which create more accessible channels for green technologies, equipment, and services for enterprises within the region. Such inclusive green resource spillovers enable non-exporting enterprises to undergo green upgrades at lower costs. Meanwhile, the difference in the magnitude of the effects reflects that the policy may have a more direct impact on exporting enterprises. As exporting enterprises face international green trade barriers and environmental standards directly, they are more motivated to leverage the pilot zones’ platform to adopt advanced low-carbon technologies and management models, thereby achieving a greater reduction in carbon intensity.
Table 13.
Descriptive statistics of carbon intensity for exporting and non-exporting industrial enterprises.
8. Conclusions, Policy Recommendations, and Limitations
Based on a sample of export enterprises listed on China’s Shanghai and Shenzhen A-share markets from 2010 to 2023, this paper empirically analyzes the impact of digital trade policies, represented by the CBEC pilot policy, on firms’ carbon emission intensity. The study’s outcomes are as follows. First, the digital trade policy demonstrates a statistically significant negative impact on firms’ carbon intensity, with this causal relationship robust to parallel trend diagnostics and extensive robustness tests. Second, the mechanism analysis reveals the functioning of dual pathways: grounded in the Resource-Based View (RBV) and Dynamic Capability Theory (DCT), the pilot policy stimulates enterprises’ endogenous motivation to build green competitive advantages, achieving internal innovation deepening from “shaping green awareness” to “enhancing green production efficiency.” Simultaneously, in accordance with the Porter Hypothesis, by constructing a synergistic empowerment system of “financial support–innovation protection,” they create an optimized external environment that drives low-carbon transformation. Third, based on multidimensional heterogeneity analysis, this study reveals distinct patterns across different dimensions. At the enterprise level, the policy effects are not only more pronounced in firms with a higher risk appetite but also more significant in large-scale enterprises, reflecting the dual influence of corporate resource endowment and strategic decision-making capacity on policy responsiveness. At the industry level, heavily polluting industries and high-tech sectors exhibit differentiated response mechanisms, among which the former demonstrates the coercive effect of regulatory pressure while the latter highlights the driving role of innovation capability. At the regional level, the eastern region shows diminishing marginal effects due to its relatively advanced development foundation, whereas the western region, constrained by infrastructural and institutional limitations, has yet to fully realize the policy’s potential impact. Fourth, the pilot policy demonstrates significant policy synergy with the Belt and Road Initiative, jointly enhancing carbon reduction effectiveness. The policy also exhibits substantial spatial spillover effects, benefiting both pilot cities and neighboring non-pilot areas. Furthermore, comparative analysis confirms that the policy’s emission intensity reduction impact on non-export enterprises is smaller than that on export enterprises.
Drawing from the conclusions above, this study offers subsequent policy suggestions.
Firstly, China should implement “mechanism-oriented” targeted empowerment to deepen the driving role of the dual pathways. Internally, China can explore the establishment of the “Green Capability Certification” system. Local governments and relevant institutions should jointly develop standards to grant the title of “Pilot Zone Green Benchmark Enterprise” to companies that proactively implement carbon accounting, utilize digital energy management systems, and achieve energy efficiency improvements. These certified enterprises should receive substantive support in platform credit ratings and traffic allocation, directly translating green performance into market competitiveness. Externally, China can establish a specialized support system. Addressing the identified pathways of financial support and innovation incentives, local governments could create a green transition fund to provide low-cost financing for corporate low-carbon technology upgrades. Simultaneously, a fast-track review channel for green technology patents and a one-stop platform for handling infringement disputes should be established to reduce corporate costs in safeguarding their rights.
Secondly, China should carry out “stratified and categorized” targeted measures to accommodate the heterogeneous characteristics of enterprises. At the corporate level, for large-scale enterprises with strong innovation capabilities, local governments can encourage them to play the role of “chain leaders” in driving the green transformation of the entire industrial chain. For small- and medium-sized enterprises (SMEs) with weaker risk tolerance, local governments can encourage banks to establish “green digital transformation special loans” for them and develop carbon accounting and emission reduction technology service platforms suitable for asset-light enterprises, thereby reducing their costs and barriers to participating in carbon reduction. At the industry level, governments can put into practice differentiated management for heavily polluting and high-tech industries. For heavily polluting industries, the focus should be on “pressure transmission,” such as requiring them to regularly disclose environmental information through the pilot zone platform and linking emission reduction performance with policy measures like customs facilitation. For high-tech industries, the emphasis should be on “capability release,” supporting them in accessing international green technologies through the platform and transforming their technological advantages into green export competitiveness. At the regional level, China should promote coordinated development between the eastern and western regions, guiding the comprehensive “seepage” of technology, capital, and market resources from the eastern region to the western and northeastern regions. For enterprises in the western region, efforts should focus on both “soft and hard environments.” In terms of the “soft environment,” the government should increase tax incentives and subsidies to attract enterprises to participate in the construction of green supply chains. In terms of the “hard environment,” the government should improve digital infrastructure to enhance the operational efficiency of cross-border e-commerce and reduce transaction costs.
Thirdly, China should establish a “collaborative and synergistic” policy framework to amplify comprehensive governance effectiveness. On one hand, interdepartmental policy coordination should be enhanced. It is recommended that commerce authorities collaborate with development and reform departments to design corresponding green digital trade initiatives aligned with key national strategies such as the Belt and Road Initiative. Through the comprehensive pilot zone platform, this would facilitate the global expansion of China’s green products, technologies, and standards, achieving effective integration between national strategies and local pilot programs. On the other hand, regional coordinated development should be promoted. Given the significant positive spillover effects observed, established pilot zone cities should form “green cross-border e-commerce cooperation mechanisms” with neighboring regions. By jointly developing shared platforms for green digital elements and resource sharing, the benefits of pilot policies can extend to broader areas, driving regional green and low-carbon transformation. This approach transforms standalone pilot policies into strategic tools for regional collaborative development.
Although this study has made some progress in identifying the policy effects of digital trade policies on firms’ carbon emission intensity and their mechanisms, several limitations still exist. First, the mechanism analysis may involve post-treatment variables, which introduces a degree of uncertainty into the interpretation of the results. Therefore, the discussion of mediating pathways in this paper should be regarded as a preliminary exploration of potential transmission mechanisms, aimed at inspiring future research rather than drawing definitive conclusions. Second, in measuring corporate carbon emission intensity, this study relies primarily on proxy variables derived from industry-level data estimations and voluntary corporate disclosures, both of which are subject to certain measurement errors. Although cross-validation and other methods have been employed in robustness checks, this inherent measurement limitation may still affect the precision of the coefficient estimates.
Author Contributions
Conceptualization, X.G. and J.Z.; methodology, X.G. and J.Z.; software, X.G. and J.Z.; resources, X.G. and S.H.; data curation, X.G. and J.Z.; writing—original X.G. and J.Z.; writing—review and editing, X.G.; supervision, X.G. and S.H.; funding acquisition, X.G. and S.H. All authors have read and agreed to the published version of the manuscript.
Funding
This research was funded by the Humanities and Social Science Research Project of Chongqing Municipal Education Commission China, 23SKGH195, the Chongqing Postgraduate Scientific Research Innovation Project of China, CYS25679, and the Humanities and Social Science Research Project of Chongqing Municipal Education Commission China, 22SKGH250.
Institutional Review Board Statement
Not applicable.
Informed Consent Statement
Not applicable.
Data Availability Statement
The data presented in this study are openly available from the China Stock Market & Accounting Research Database (CSMAR), China Research Data Service Platform (CNRDS), China Statistical Yearbook, China City Statistical Yearbook, and PKU law database.
Conflicts of Interest
The authors declare no conflicts of interest.
References
- Dong, H.; Chen, J.; Zhang, L. Can servitization strategy improve corporate environmental, social, and governance (ESG) performance? Empirical evidence from listed manufacturing enterprises in China. Discret. Dyn. Nat. Soc. 2025, 2025, 8847322. [Google Scholar] [CrossRef] [Scilit]
- Yang, Y.; Mukhopadhaya, P.; Yu, Z. How does enterprise digitalization affect corporate carbon emission in China: A firm-level study. China Econ. Rev. 2024, 88, 102285. [Google Scholar] [CrossRef] [Scilit]
- Song, L.; Yuan, J.; Li, T. Harmonizing digital trade for sustainable stride: Unveiling the industrial pollution reduction effect of China’s cross-border E-commerce comprehensive pilot zones. J. Environ. Manag. 2024, 370, 122834. [Google Scholar] [CrossRef] [Scilit]
- Chen, Z.; Xing, R. Digital economy, green innovation and high-quality economic development. Int. Rev. Econ. Financ. 2025, 99, 104029. [Google Scholar] [CrossRef] [Scilit]
- Siragusa, C.; Tumino, A. E-grocery: Comparing the environmental impacts of the online and offline purchasing processes. Int. J. Logist. Res. Appl. 2022, 25, 1164–1190. [Google Scholar] [CrossRef] [Scilit]
- Luo, S.; Yimamu, N.; Li, Y.; Wu, H.; Irfan, M.; Hao, Y. Digitalization and sustainable development: How could digital economy development improve green innovation in China? Bus. Strategy Environ. 2023, 32, 1847–1871. [Google Scholar] [CrossRef] [Scilit]
- Zhang, D.; Bai, D.; Wang, C.; He, Y. Distribution dynamics and quantile dynamic convergence of the digital economy: Prefecture-level evidence in China. Int. Rev. Financ. Anal. 2024, 95, 103345. [Google Scholar] [CrossRef] [Scilit]
- Oláh, J.; Kitukutha, N.; Haddad, H.; Pakurár, M.; Máté, D.; Popp, J. Achieving sustainable e-commerce in environmental, social and economic dimensions by taking possible trade-offs. Sustainability 2018, 11, 89. [Google Scholar] [CrossRef] [Scilit]
- Valarezo, Á.; Pérez-Amaral, T.; Garín-Muñoz, T.; García, I.H.; López, R. Drivers and barriers to cross-border e-commerce: Evidence from Spanish individual behavior. Telecommun. Policy 2018, 42, 464–473. [Google Scholar] [CrossRef] [Scilit]
- Ma, S.; Liang, Y.; Zhang, H. Destination country’s institutional quality and Chinese E-commerce exports. J. Int. Trade Econ. Dev. 2024, 34, 726–757. [Google Scholar] [CrossRef] [Scilit]
- Jiang, Y.; Usman, A. How do energy technology innovation, financial inclusion, and digital trade help to achieve carbon neutrality targets? Environ. Sci. Pollut. Res. 2023, 30, 102853–102861. [Google Scholar] [CrossRef] [Scilit]
- Lendle, A.; Olarreaga, M.; Schropp, S.; Vézina, P.L. There goes gravity: eBay and the death of distance. Econ. J. 2016, 126, 406–441. [Google Scholar] [CrossRef] [Scilit]
- Carballo, J.; Chatruc, M.R.; Santa, C.S.; Martincus, C.V. Online business platforms and international trade. J. Int. Econ. 2022, 137, 103599. [Google Scholar] [CrossRef] [Scilit]
- Ma, S.; Guo, J. How do Institutional Innovations Affect China’s Cross-border E-commerce Exports? Evidence from the Establishment of Cross-border E-commerce Comprehensive Pilot Area. J. Manag. World 2022, 38, 83–102. [Google Scholar]
- Ni, W. Online and offline integration development of Yiwu cross-border e-commerce in digital economy era. Proc. Comput. Sci. 2022, 202, 307–312. [Google Scholar] [CrossRef] [Scilit]
- Guo, X.; Ma, S.; Zhang, H. Does cross-border e-commerce improve China’s imported product quality?—A quasi-natural experiment based on the establishment of cross-border e-commerce comprehensive pilot zones. J. Int. Trade Econ. Dev. 2024, 34, 1333–1356. [Google Scholar] [CrossRef] [Scilit]
- Cai, L.; Du, Q.; Bao, L.; Boateng, A.; Li, Z. Does cross-border e-commerce development promote the improvement of residents’ income level? Evidence from China. Res. Int. Bus. Financ. 2025, 77, 102907. [Google Scholar] [CrossRef] [Scilit]
- Zhou, K.; Lu, F.; Ruan, Y.; Jiang, X.; Yu, L. Research on the influence and mechanism of cross-border E-commerce on the quality of agricultural products exported by China. J. Glob. Inf. Manag. 2023, 31, 1–23. [Google Scholar] [CrossRef] [Scilit]
- Martincus, C.V.; Carballo, J.; Cusolito, A. Roads, exports and employment: Evidence from a developing country. J. Dev. Econ. 2017, 125, 21–39. [Google Scholar] [CrossRef] [Scilit]
- Xu, B.; Yan, W. Study on the Effect of the Establishment of Cross-border E-commerce Comprehensive Pilot Area on Improving the Labor Income Share. Intertrade 2023, 8, 83–95. [Google Scholar]
- Jiang, J.; Huang, S. Influence of New Trade Forms on Green Technology Innovation: Based on the Evidence of Cross-border E-commerce Comprehensive Pilot Area Policy. Quant. Technol. Econ. 2024, 41, 133–154. [Google Scholar]
- Tong, J.; Feng, X.; Zhao, S. The impact of export tax rebate policy on carbon emission intensity of Chinese enterprises: A quasi-natural experiment based on export tax rebate policy reform of high-energy, high-pollution and resource-based products. Mod. Financ. Econ. J. Tianjin Univ. Financ. Econ. 2023, 43, 3–14. [Google Scholar]
- Song, H.; Li, C.; Gong, F. Tax Reform and Carbon Emission Reduction in Manufacturing Enterprises: A Quasi-natural Experiment from the ‘Replacing Business Tax with Value-added Tax’. Macroeconomics 2023, 7, 35–48. [Google Scholar]
- Du, Y.; Qi, B.; Xue, Z. Vertical Management Reform of Local Environmental Protection Departments and Firm Carbon Emissions. J. Manag. Sci. 2024, 37, 109–125. [Google Scholar]
- Sun, B.; Zheng, S. Synergistic Effect of Pollution Reduction and Carbon Reduction of Environmental Regulation—Evidence from the Quasi-Natural Experiment of Cleaner Production Standards Implementation. China Econ. Q. 2024, 24, 624–642. [Google Scholar]
- Fang, K.; Zhang, Q.; Song, J.; Yu, C.; Zhang, H.; Liu, H. How can national ETS affect carbon emissions and abatement costs? Evidence from the dual goals proposed by China’s NDCs. Resour. Conserv. Recycl. 2021, 171, 105638. [Google Scholar] [CrossRef] [Scilit]
- Azar, J.; Duro, M.; Kadach, I.; Ormazabal, G. The big three and corporate carbon emissions around the world. J. Financ. Econ. 2021, 142, 674–696. [Google Scholar] [CrossRef] [Scilit]
- Garel, A.; Petit-Romec, A. CEO exposure to abnormally hot temperature and corporate carbon emissions. Econ. Lett. 2022, 210, 110156. [Google Scholar] [CrossRef] [Scilit]
- Konadu, R.; Ahinful, G.S.; Boakye, D.J.; Elbardan, H. Board gender diversity, environmental innovation and corporate carbon emissions. Technol. Forecast. Soc. Change 2022, 174, 121279. [Google Scholar] [CrossRef] [Scilit]
- Feng, S.; Mao, Y.; Li, G.; Bai, J. Enterprise digital transformation, biased technological progress and carbon total factor productivity. J. Environ. Plan. Manag. 2025, 68, 154–184. [Google Scholar] [CrossRef] [Scilit]
- Cheng, X.; Zhang, Z.; He, D.; Quan, C. Digital Transformation and Corporate Carbon Emissions: Evidence from China’s Listed Companies. Sustainability 2025, 17, 3944. [Google Scholar] [CrossRef] [Scilit]
- Acemoglu, D.; Akcigit, U.; Hanley, D.; Kerr, W. Transition to clean technology. J. Polit. Econ. 2016, 124, 52–104. [Google Scholar] [CrossRef] [Scilit]
- Xu, P.; Ye, P.; Jahanger, A.; Huang, S.; Zhao, F. Can green credit policy reduce corporate carbon emission intensity: Evidence from China’s listed firms. Corp. Soc. Responsib. Environ. Manag. 2023, 30, 2623–2638. [Google Scholar] [CrossRef] [Scilit]
- Marin, G.; Zanfei, A. Does host market regulation induce cross-border environmental innovation? World Econ. 2019, 42, 2089–2119. [Google Scholar] [CrossRef] [Scilit]
- Guo, X.; Chen, X. The impact of digital transformation on manufacturing-enterprise innovation: Empirical evidence from China. Sustainability 2023, 15, 3124. [Google Scholar] [CrossRef] [Scilit]
- Trujillo-Gallego, M.; Sarache, W.; de Sousa Jabbour, A.B.L. Digital technologies and green human resource management: Capabilities for GSCM adoption and enhanced performance. Int. J. Prod. Econ. 2022, 249, 108531. [Google Scholar] [CrossRef] [Scilit]
- Li, Z.; Rasool, S.; Cavus, M.F.; Shahid, W. Sustaining the future: How green capabilities and digitalization drive sustainability in modern business. Heliyon 2024, 10, e24158. [Google Scholar] [CrossRef] [Scilit]
- Li, Y.; Zheng, Z.; Zhao, M.; Liu, Z. How does digital trade impact urban carbon emissions efficiency? Evidence from China’s cross-border e-commerce pilot zones. J. Clean. Prod. 2024, 456, 142363. [Google Scholar] [CrossRef] [Scilit]
- He, Y.; Zheng, H. How does environmental regulation affect industrial structure upgrading? Evidence from prefecture-level cities in China. J. Environ. Manag. 2023, 331, 117267. [Google Scholar] [CrossRef] [Scilit]
- Ma, H.; Shen, G.; Zou, J. Does excess capacity strengthen firms’ dependence on the polluting path? Evidence from Chinese iron and steel firms. Econ. Transit. Inst. Change 2024, 32, 971–1000. [Google Scholar] [CrossRef] [Scilit]
- Merín-Rodrigáñez, J.; Dasí, À.; Alegre, J. Digital transformation and firm performance in innovative SMEs: The mediating role of business model innovation. Technovation 2024, 134, 103027. [Google Scholar] [CrossRef] [Scilit]
- Bian, Y.; Song, K.; Bai, J. Market segmentation, resource misallocation and environmental pollution. J. Clean. Prod. 2019, 228, 376–387. [Google Scholar] [CrossRef] [Scilit]
- Ma, S.; Lin, Y.; Pan, G. Does cross-border e-commerce contribute to the growth convergence?: An analysis based on Chinese provincial panel data. J. Glob. Inf. Manag. 2021, 29, 86–111. [Google Scholar] [CrossRef] [Scilit]
- Dai, B.; Min, S. Can cross-border E-commerce reform reduce supply chain risks? Quasi-natural experiment based on cross-border E-commerce comprehensive pilot zone. J. Knowl. Econ. 2024, 15, 14998–15026. [Google Scholar] [CrossRef] [Scilit]
- He, L.Y.; Chen, K.X. Digital transformation and carbon performance: Evidence from firm-level data. Environ. Dev. Sustain. 2023, 27, 23639–23664. [Google Scholar] [CrossRef] [Scilit]
- Zhong, T.; Ma, F.; Sun, F.; Li, J. Can green finance reduce corporate carbon risk? Financ. Res. Lett. 2024, 63, 105234. [Google Scholar] [CrossRef] [Scilit]
- Wang, S.; Liu, Y. Digital Inclusive Finance, Intellectual Property Protection, and Corporate Carbon Emission Reduction. Financ. Res. Lett. 2025, 81, 107504. [Google Scholar] [CrossRef] [Scilit]
- Wang, H.; Liu, J.; Zhang, L. Carbon Emissions and Asset Pricing: Evidence from Chinese Listed Firms. China Econ. J. 2022, 9, 28–75. [Google Scholar] [CrossRef] [Scilit]
- Sun, L.; Liu, Z.; Cai, L. Data Element Utilization and Corporate Carbon Emission Performance: An Empirical Analysis Based on Data of Listed Companies in China. J. Chongqing Univ. Technol. (Soc. Sci.) 2025, 39, 29–43. [Google Scholar]
- Liu, Q.; Lu, Y. Firm investment and exporting: Evidence from China’s value-added tax reform. J. Int. Econ. 2015, 97, 392–403. [Google Scholar] [CrossRef] [Scilit]
- Zhao, Y.; Zhou, Y.; Yang, Q.; Gong, Y. Technology Empowerment, Digital Transformation, and Enhancing Corporate ESG Performance. Int. Rev. Econ. Financ. 2025, 101, 104239. [Google Scholar] [CrossRef] [Scilit]
- Sun, W.; Shen, J. The impact of low-carbon city pilot on carbon emissions of high-polluting enterprises− Based on financing constraint perspective. Energy Rep. 2024, 12, 762–774. [Google Scholar] [CrossRef] [Scilit]
- Wei, R.; Xia, Y.; Yu, Z. The Impact of Digital Infrastructure on Corporate Carbon Emissions: Evidence from the “Broadband China” Pilot. Pol. J. Environ. Stud. 2024, 33, 6409–6421. [Google Scholar] [CrossRef] [Scilit]
- Song, M.; Tao, W.; Wang, J. Does the construction of comprehensive demonstration cities for energy conservation and emission reduction fiscal policy promote the dual structural transformation of energy and industry? J. Nat. Resour. 2025, 40, 1773–1794. [Google Scholar] [CrossRef] [Scilit]
- Xi, M.; Jin, Y.; Xia, R. Research on the Impact of Intelligent Transformation on the New Quality Productive Forces of Enterprises: Evidence from Policy of Intelligent Manufacturing Pilot. J. Macro-Qual. Res. 2025, 13, 31–45. [Google Scholar]
- Liu, C.; Wang, W.; Xie, B.; Bo, S. Knowledge Elites, Technology Transfer and Economic Transformation: The Impact of Overseas Students on Industrial Development in Modern China. China Econ. Q. 2025, 25, 1–17. [Google Scholar]
- Zhao, N.; Chen, W. How can artificial intelligence adoption enhance manufacturing firms’ green management capability? Financ. Res. Lett. 2025, 81, 107475. [Google Scholar] [CrossRef] [Scilit]
- Zhu, J.; Feng, T.; Lu, Y.; Jiang, W. Using blockchain or not? A focal firm’s blockchain strategy in the context of carbon emission reduction technology innovation. Bus. Strat. Environ. 2024, 33, 3505–3531. [Google Scholar] [CrossRef] [Scilit]
- Ding, X.; Xu, Z.; Petrovskaya, M.V.; Wu, K.; Ye, L.; Sun, Y.; Makarov, V.M. Exploring the impact mechanism of executives’ environmental attention on corporate green transformation: Evidence from the textual analysis of Chinese companies’ management discussion and analysis. Environ. Sci. Pollut. Res. 2023, 30, 76640–76659. [Google Scholar] [CrossRef] [Scilit]
- Wu, J.; Xia, Q.; Li, Z. Green innovation and enterprise green total factor productivity at a micro level: A perspective of technical distance. J. Clean. Prod. 2022, 344, 131070. [Google Scholar] [CrossRef] [Scilit]
- Guo, J.; Fang, H.; Liu, X.; Wang, C.; Wang, Y. FinTech and financing constraints of enterprises: Evidence from China. J. Int. Financ. Mark. Inst. Money 2023, 82, 101713. [Google Scholar] [CrossRef] [Scilit]
- Fan, H.; Yin, J.; Usman, M.; Li, Z. Intellectual property protection and total factor productivity of enterprises: A quasi-natural experiment of intellectual property courts. Financ. Res. Lett. 2024, 70, 106236. [Google Scholar] [CrossRef] [Scilit]
- Lewis, B.W.; Walls, J.L.; Dowell, G.W. Difference in degrees: CEO characteristics and firm environmental disclosure. Strat. Manag. J. 2014, 35, 712–722. [Google Scholar] [CrossRef] [Scilit]
- Chen, J.; Shu, W. The Influence of Management’s Risk Preference on Enterprise Innovation—Based on the Internal Control of Regulation. Soft Sci. 2021, 35, 76–82. [Google Scholar]
- Chen, M.; Su, Y.; Piao, Z.; Zhu, J.; Yue, X. The green innovation effect of urban energy saving construction: A quasi-natural experiment from new energy demonstration city policy. J. Clean. Prod. 2023, 428, 139392. [Google Scholar] [CrossRef] [Scilit]
- Du, J.; Zhang, Y. Does one belt one road initiative promote Chinese overseas direct investment? China Econ. Rev. 2018, 47, 189–205. [Google Scholar] [CrossRef] [Scilit]
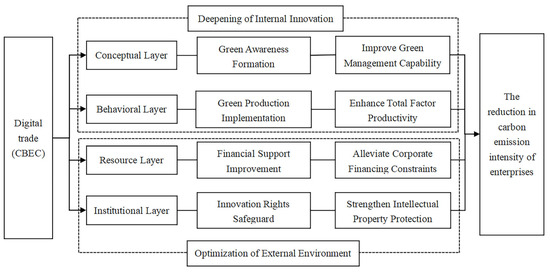
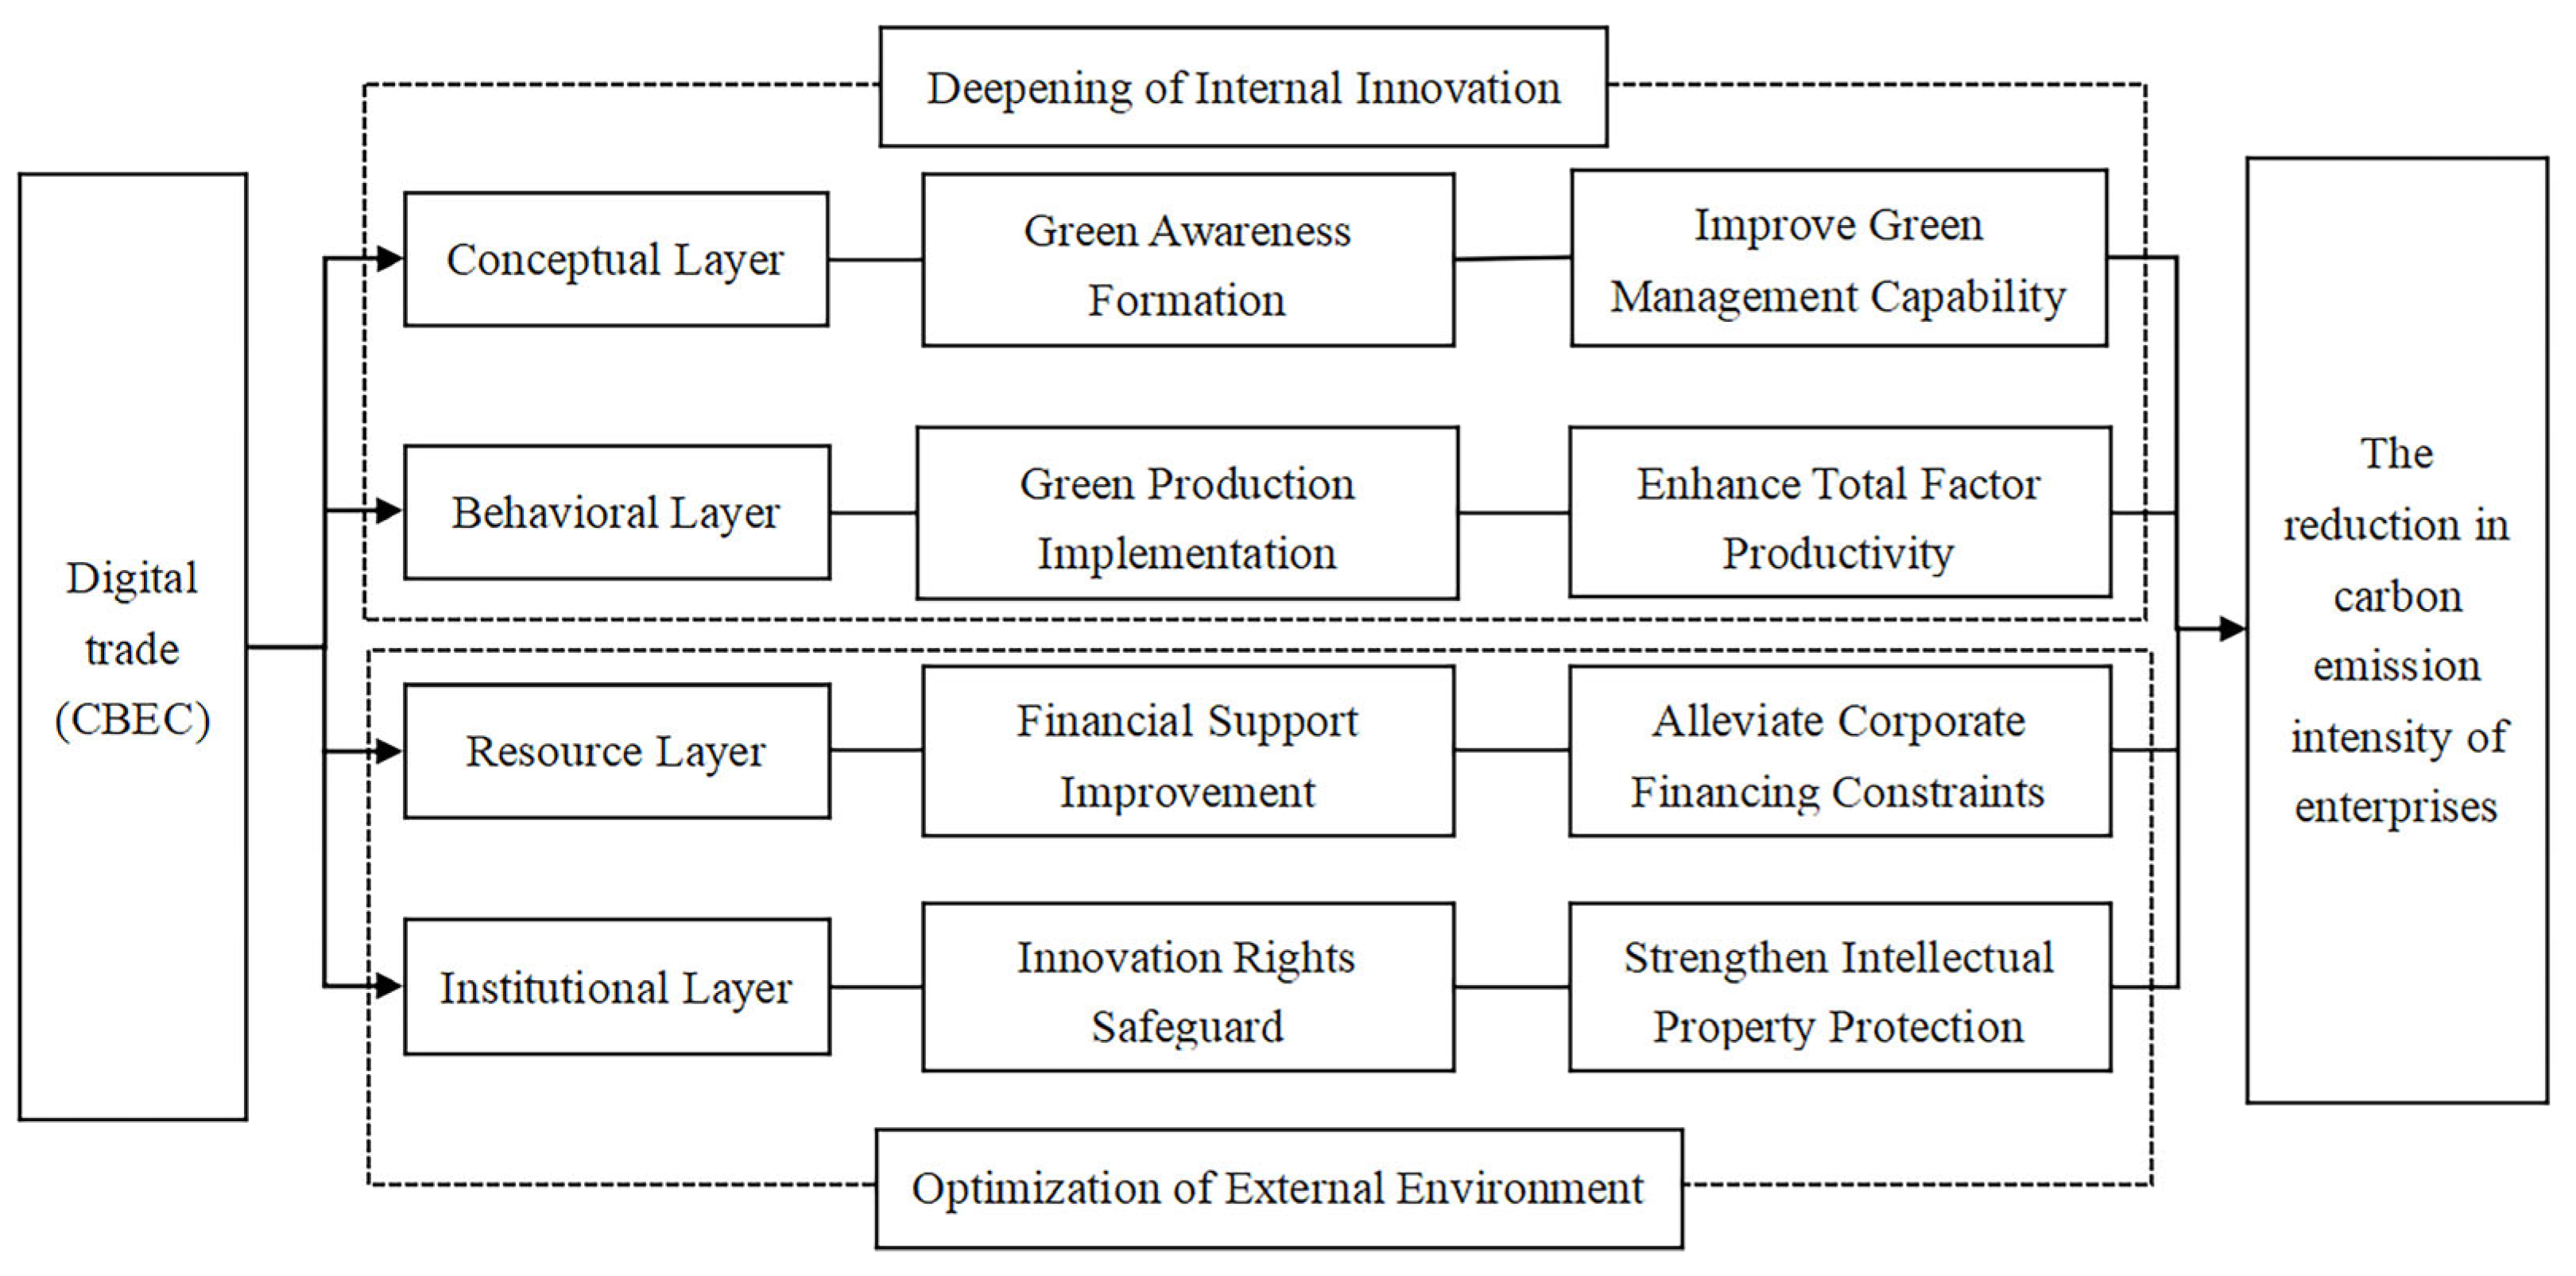
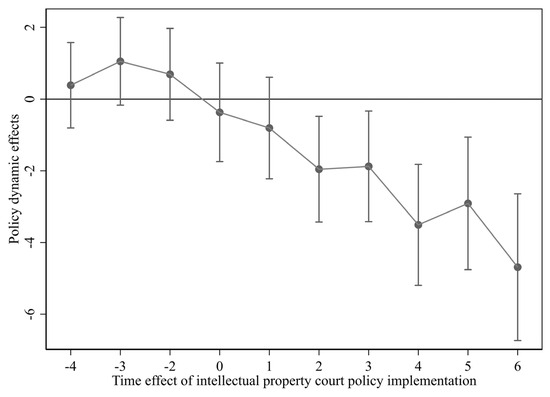
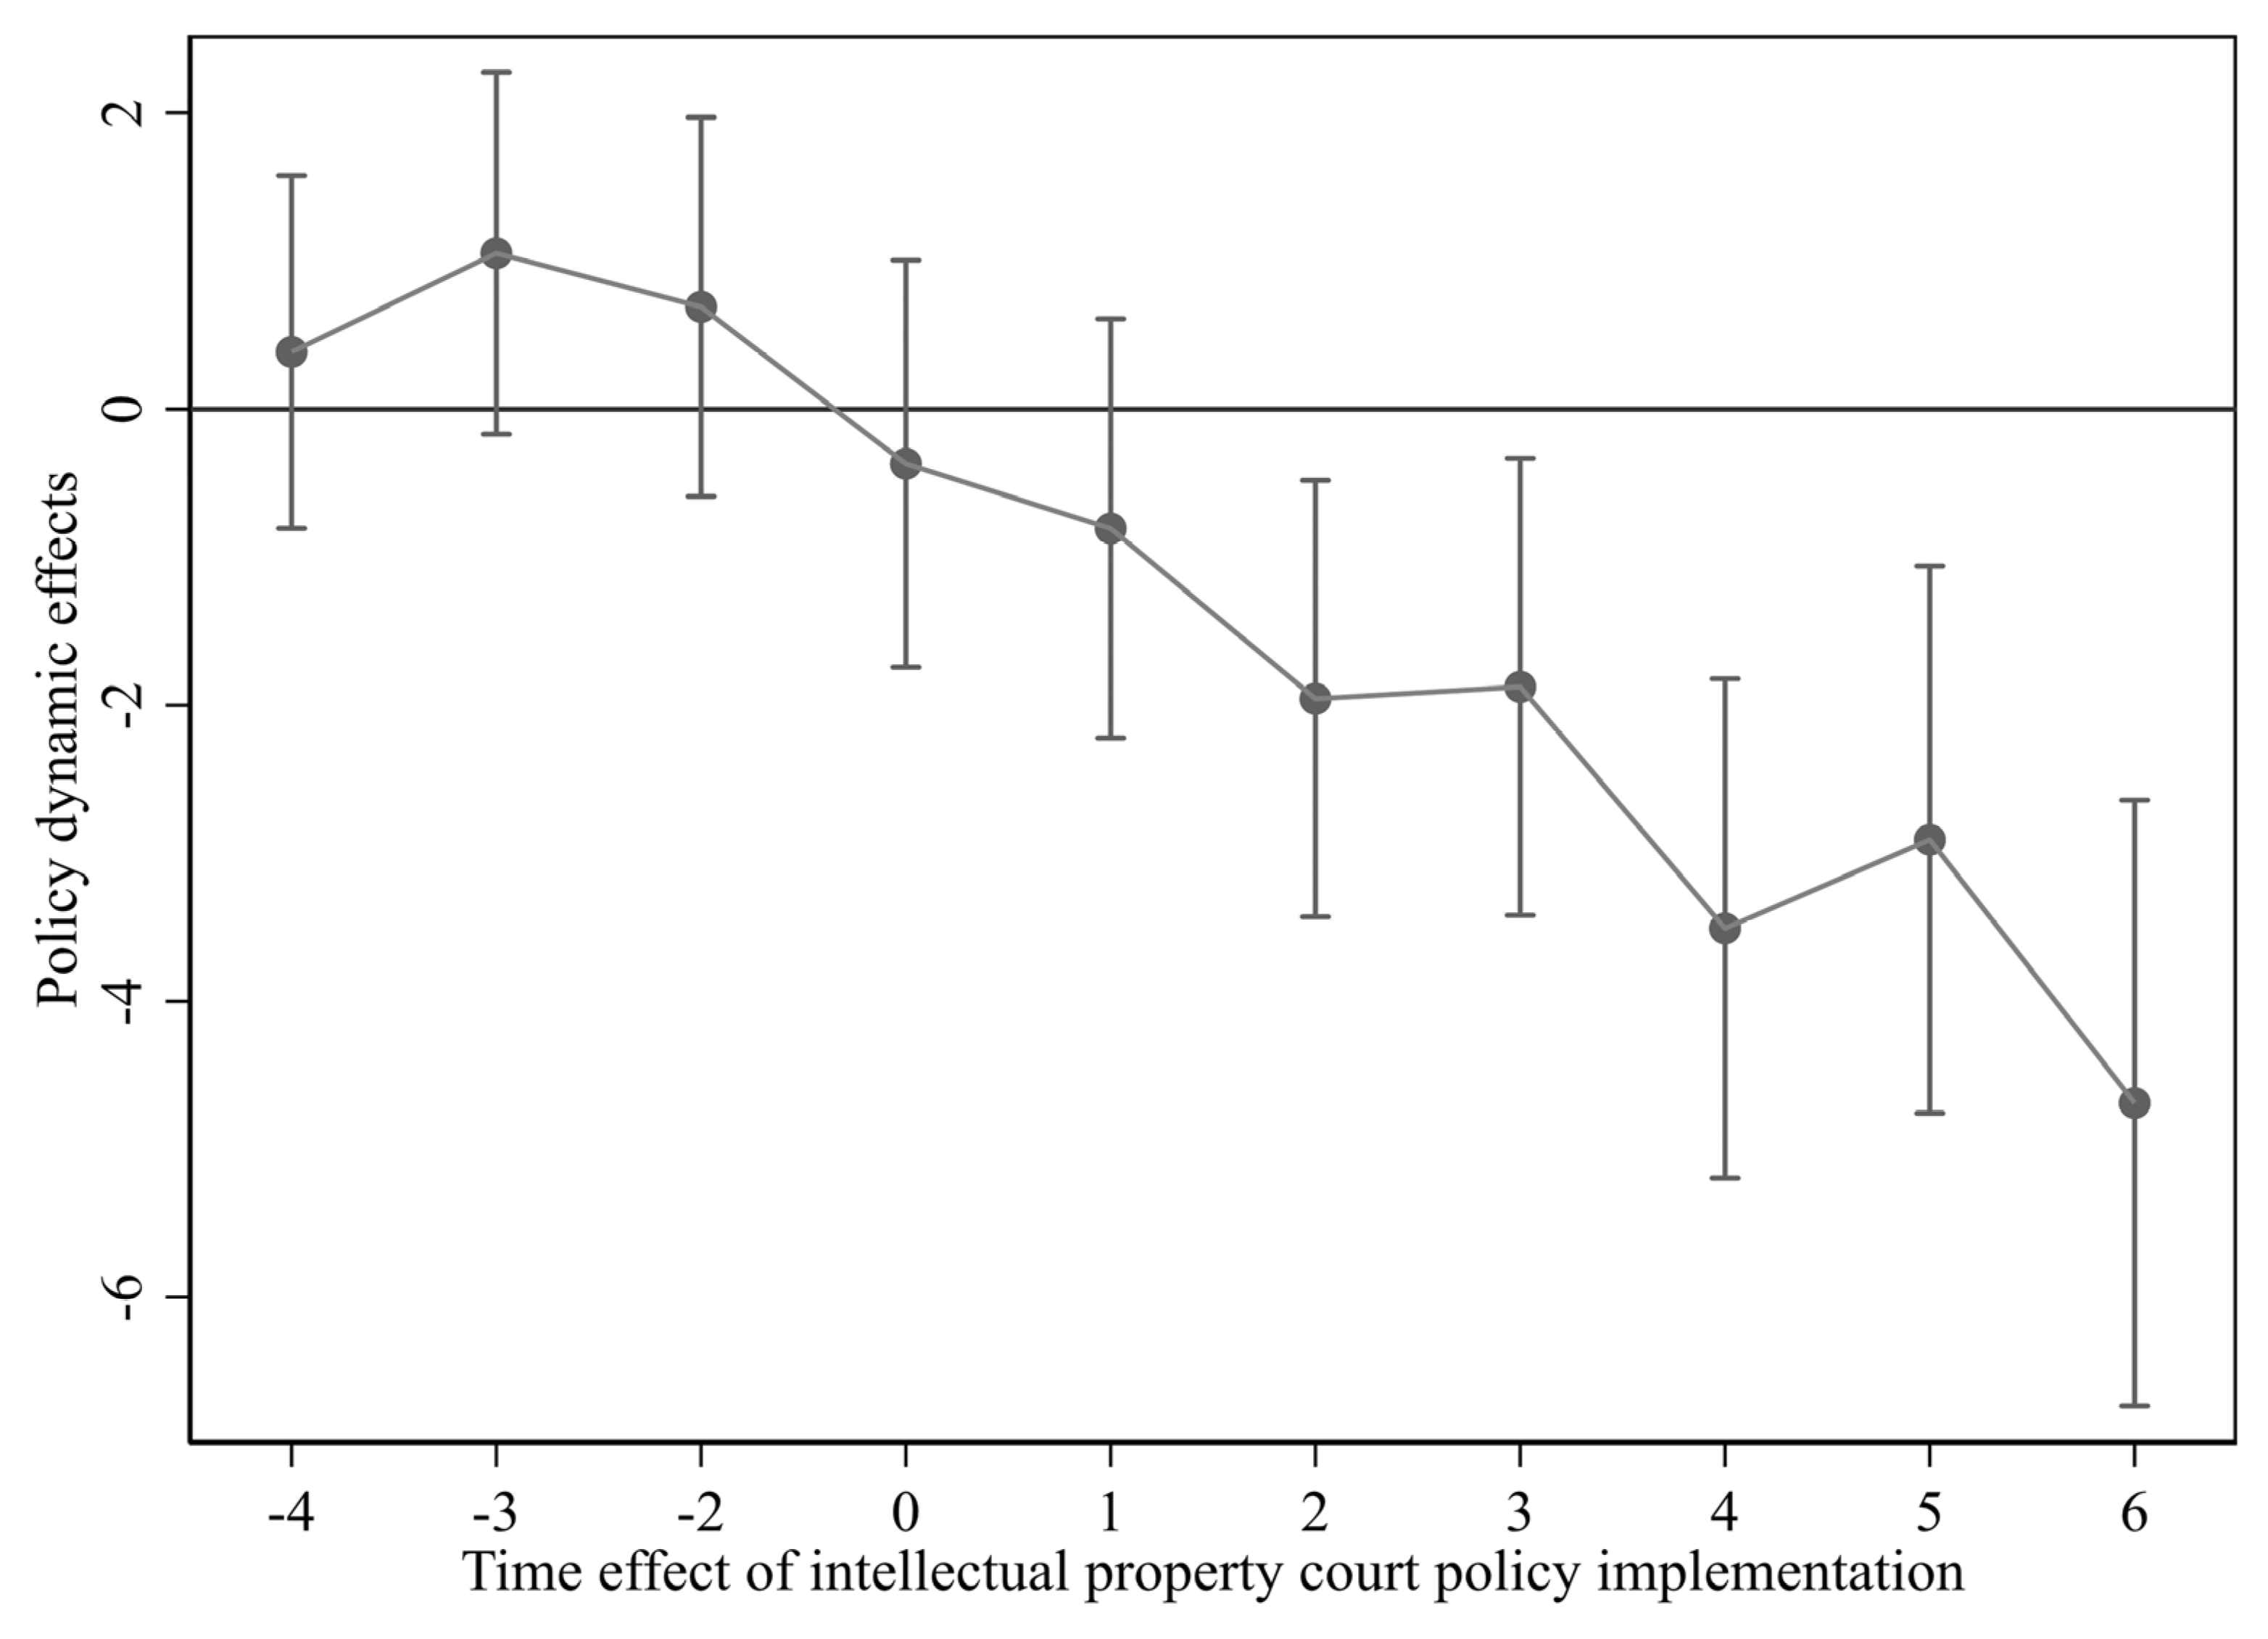
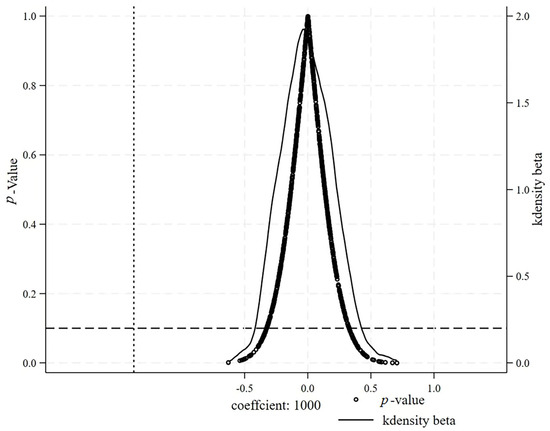
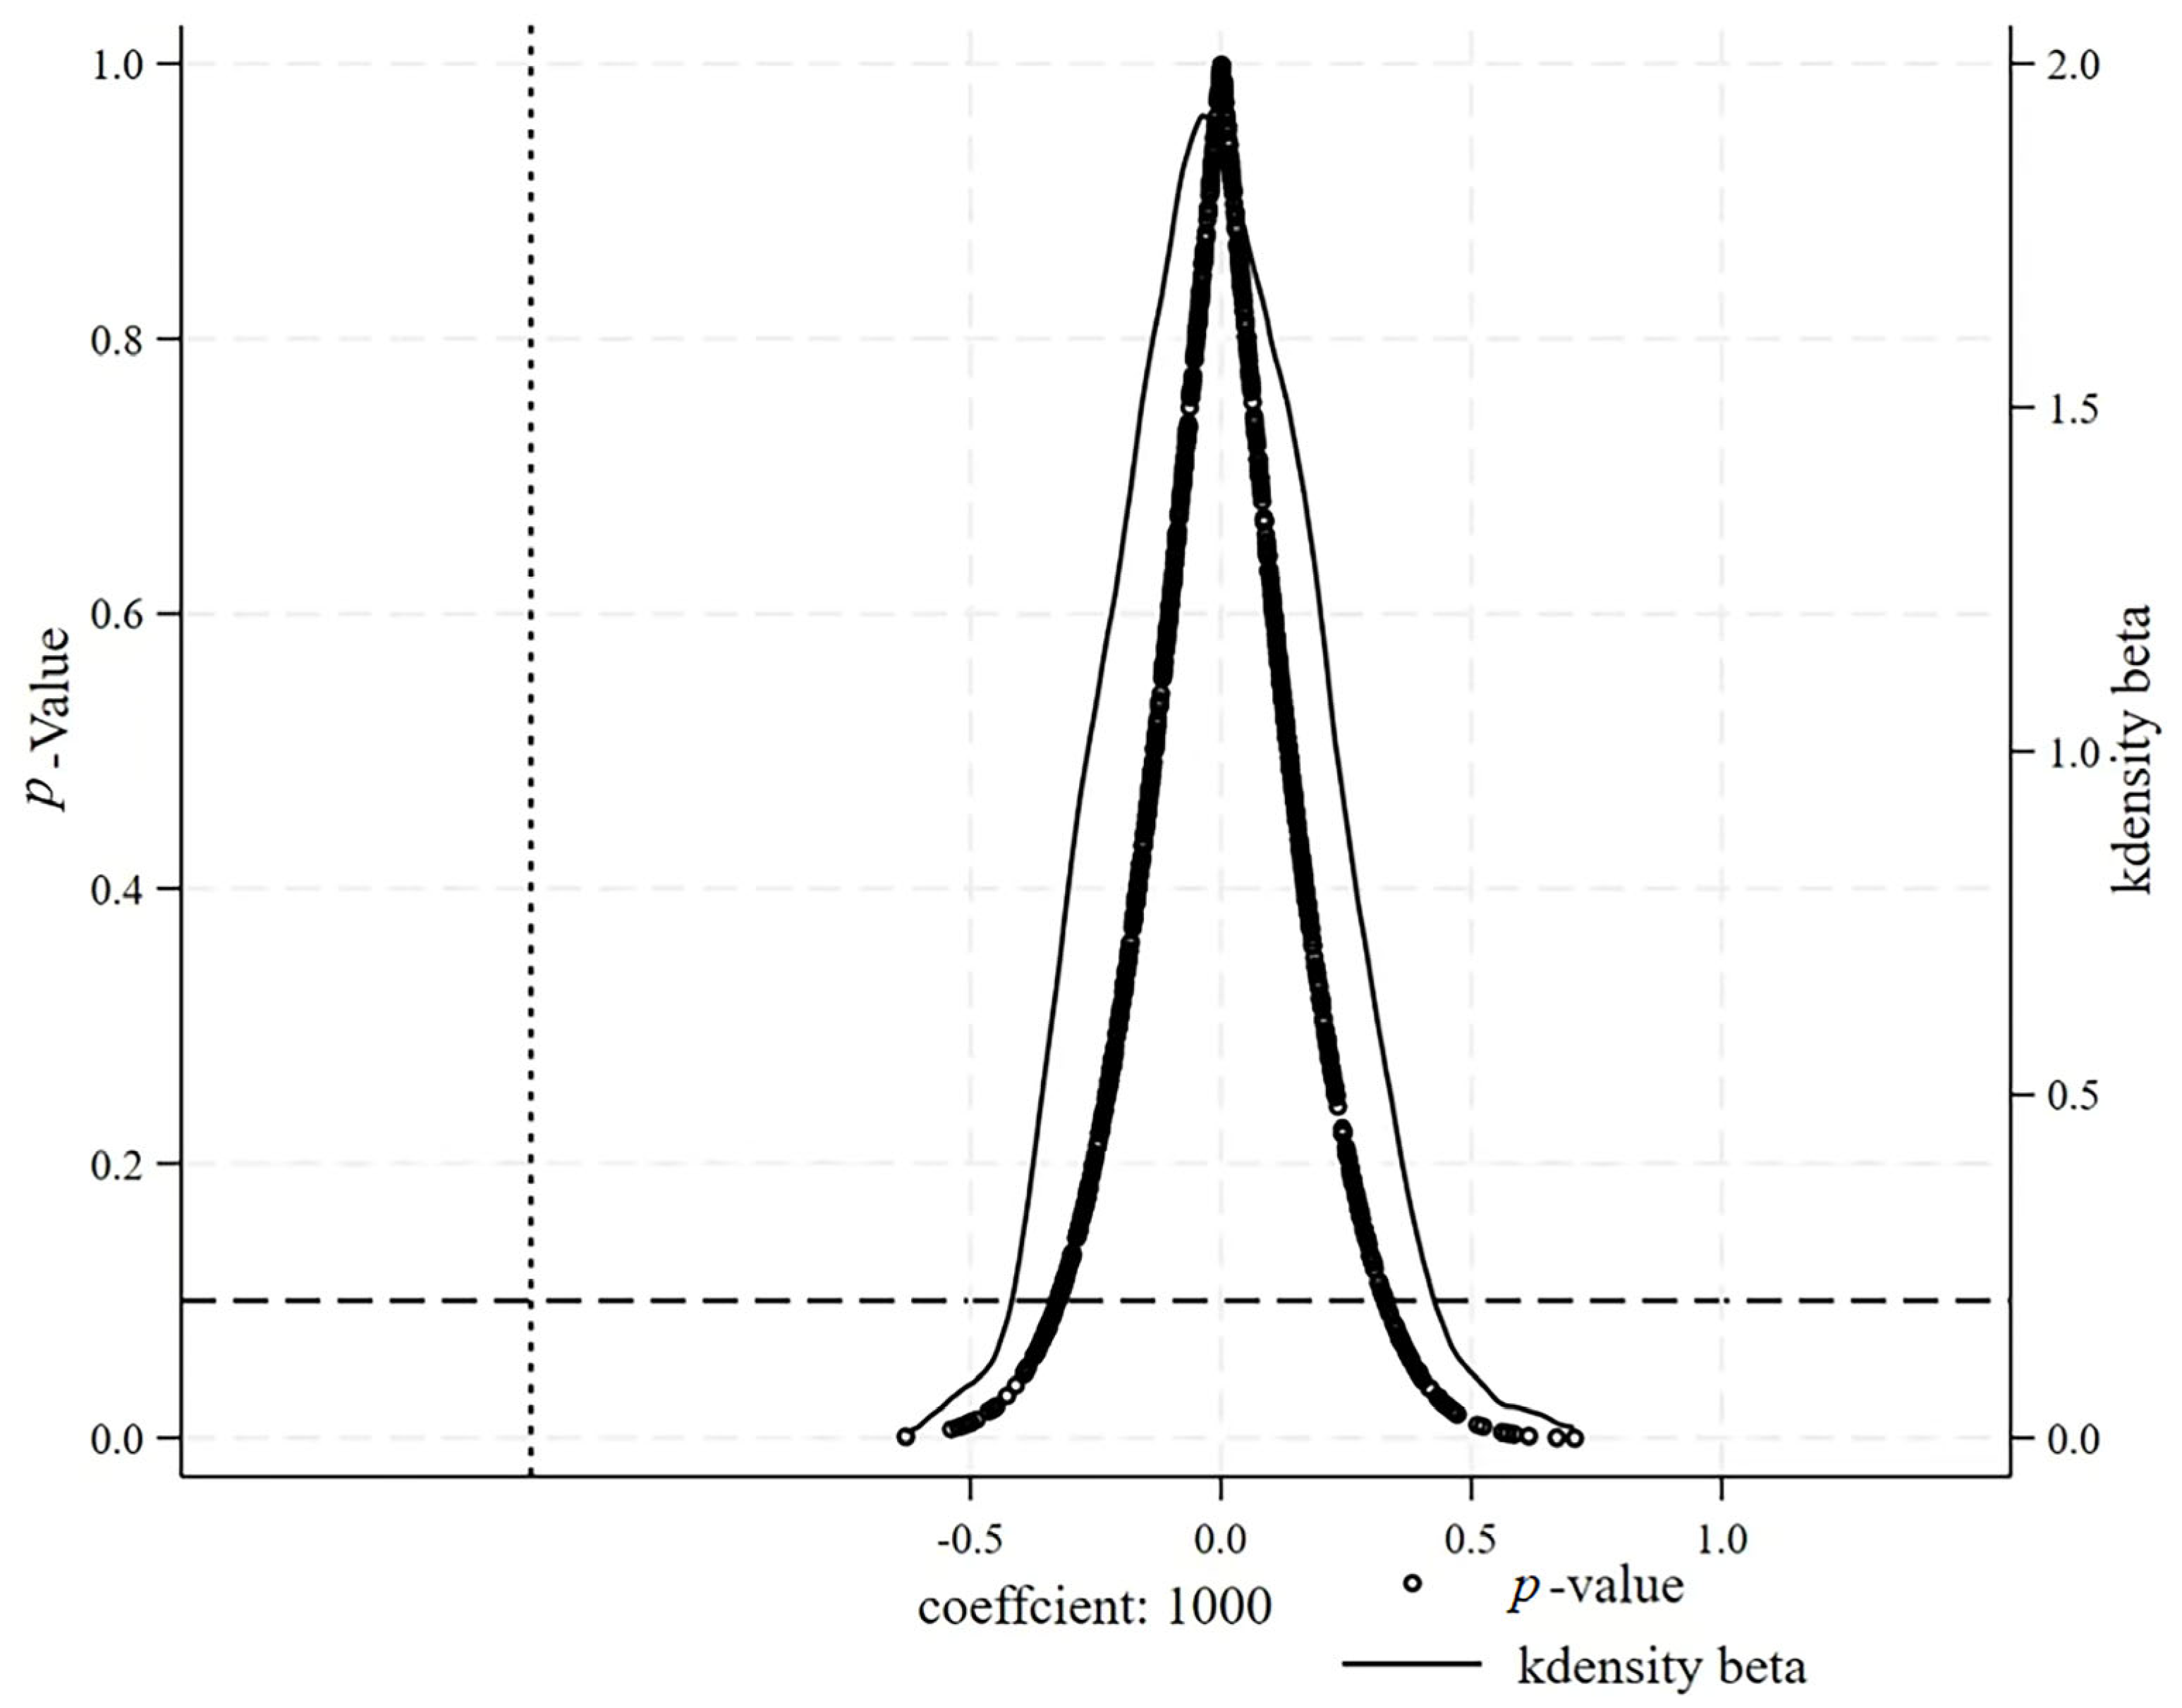
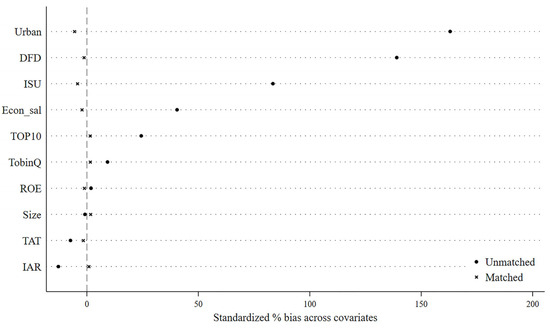
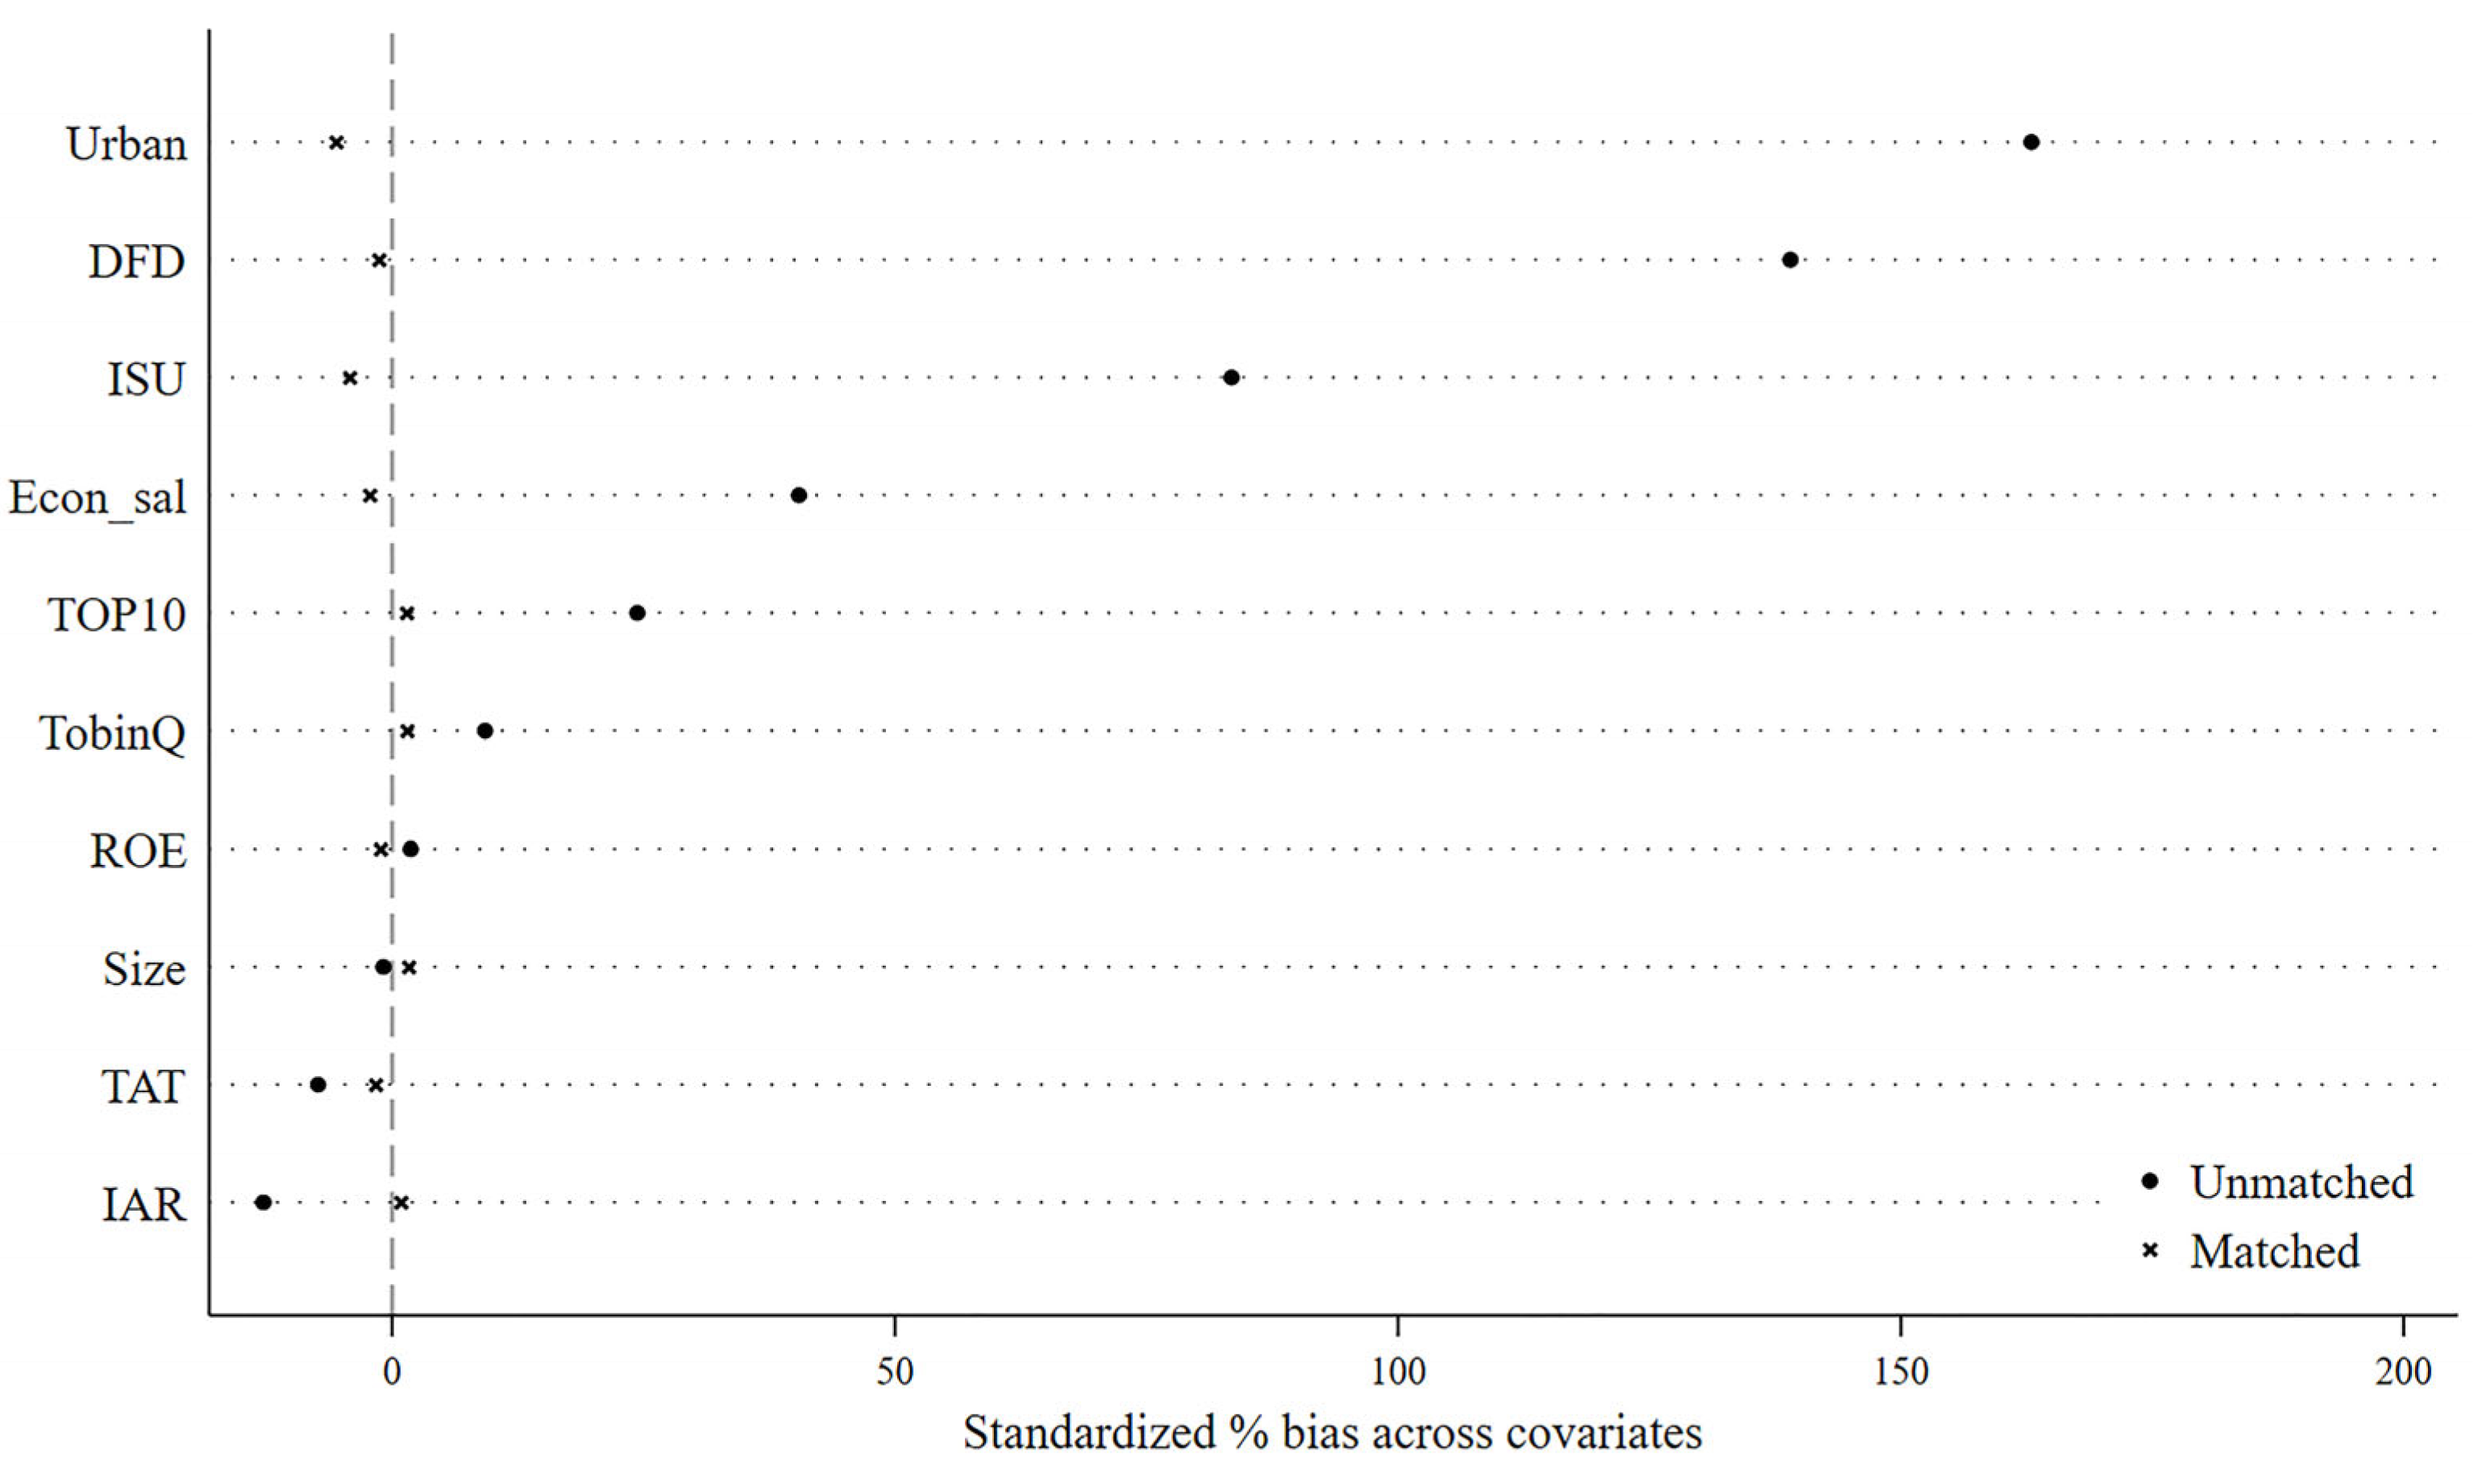

Disclaimer/Publisher’s Note: The statements, opinions and data contained in all publications are solely those of the individual author(s) and contributor(s) and not of MDPI and/or the editor(s). MDPI and/or the editor(s) disclaim responsibility for any injury to people or property resulting from any ideas, methods, instructions or products referred to in the content. |
© 2025 by the authors. Licensee MDPI, Basel, Switzerland. This article is an open access article distributed under the terms and conditions of the Creative Commons Attribution (CC BY) license (https://creativecommons.org/licenses/by/4.0/).