Abstract
With growing global demand for sustainable decarbonization, hydrogen energy systems have emerged as a key pillar in achieving carbon neutrality. This study assesses the greenhouse gas (GHG) reduction efficiency of Republic of Korea’s hydrogen ecosystem from a life-cycle perspective, focusing on production and utilization stages. Using empirical data—including the national hydrogen supply structure, fuel cell electric vehicle (FCEV) deployment, and hydrogen power generation records, the analysis compares hydrogen-based systems with conventional fossil fuel systems. Results show that current hydrogen production methods, mainly by-product and reforming-based hydrogen, emit an average of 6.31 kg CO2-eq per kg H2, providing modest GHG benefits over low-carbon fossil fuels but enabling up to a 77% reduction when replacing high-emission sources like anthracite. In the utilization phase, grey hydrogen-fueled stationary fuel cells emit more GHGs than the national grid. By contrast, FCEVs demonstrate a 58.2% GHG reduction compared to internal combustion vehicles, with regional variability. Importantly, this study omits the distribution phase (storage and transport) due to data heterogeneity and a lack of reliable datasets, which limits the comprehensiveness of the LCA. Future research should incorporate sensitivity or scenario-based analyses such as comparisons between pipeline transport and liquefied hydrogen transport to better capture distribution-phase impacts. The study concludes that the environmental benefit of hydrogen systems is highly dependent on production pathways, end-use sectors, and regional conditions. Strategic deployment of green hydrogen, regional optimization, and the explicit integration of distribution and storage in future assessments are essential to enhancing hydrogen’s contribution to national carbon neutrality goals.
1. Introduction
Escalating concerns over global warming and climate change have underscored the urgent need for a profound transformation of global energy systems, placing accelerated and structured decarbonization of greenhouse gas (GHG) emissions at the forefront of international agendas [1]. The continued reliance on fossil fuels for energy remains a primary contributor to rising atmospheric GHG levels, necessitating innovative and sustainable transition pathways to meet the 2050 net-zero emission target [2].
Hydrogen has emerged as a cornerstone of the transition toward carbon neutrality, but its importance extends beyond a single characteristic. First, from an energy systems perspective, hydrogen offers a high gravimetric energy density, zero on-site emissions at the point of use, and cross-sectoral applicability across power generation, industry, and transport. These features distinguish hydrogen from other low-carbon options and make it indispensable in the portfolio of decarbonization technologies [3,4]. Second, from a policy and societal perspective, hydrogen represents more than an alternative fuel; it is a symbol of systemic change, enabling countries to reduce dependence on fossil resources and accelerate industrial restructuring toward sustainable pathways. Third, from a technological perspective, hydrogen’s potential is conditioned by its practical limitations. Its low volumetric energy density, approximately 5.6 MJ·L−1 at 700 bar compared with ~32 MJ·L−1 for gasoline, requires energy-intensive processes such as compression or liquefaction, consuming about 5–20% and over 30% of its lower heating value, respectively [5,6]. Furthermore, storage and long-distance transport are complicated by boil-off losses, infrastructure constraints, and hydrogen embrittlement in pipelines [7].
Taken together, these opportunities and challenges demonstrate why hydrogen’s decarbonization role cannot be understood solely from a theoretical or technical standpoint. Instead, a life-cycle perspective is needed to capture its complete environmental profile, spanning production, storage, transport, and utilization [8,9]. Such an approach avoids simplistic generalizations—acknowledging that gray hydrogen from fossil fuels without carbon capture may exceed the emissions of conventional fuels, whereas green hydrogen produced from renewable-powered electrolysis delivers substantial GHG reductions [10].
The global movement toward “hydrogen cities” illustrates both the transformative vision and the practical diversity of hydrogen deployment. A hydrogen city is an urban energy supply system that uses hydrogen as a fuel to deliver electricity, heat, and mobility services by integrating production, storage, distribution, and utilization infrastructures and governance [11]. Industrial direct use of hydrogen as a chemical feedstock or reducing agent lies outside the scope of a hydrogen city. In Germany, Hannover is linked to the European Hydrogen Hub project, operating more than ten hydrogen refueling stations and fuel cell buses, while demonstrating green hydrogen production via electrolysis at wastewater treatment plants [12]. Heidelberg advances similar efforts through projects such as H2Rhein-Neckar and H2Rivers, expanding hydrogen use in public transport, waste collection, and drone applications [12]. In the UK, Aberdeen has become a leader in hydrogen mobility, operating more than 15 hydrogen buses, fuel cell-powered trucks, and boats, while managing the integrated Aberdeen Hydrogen Hub [13]. Japan’s Fukushima Hydrogen Energy Research Field (FH2R), the world’s largest renewable-based hydrogen production facility, features a 10 MW solar-powered electrolyzer that supplies hydrogen to vehicles, buildings, and mobile generators in Tokyo and surrounding areas [14]. In the Netherlands, Groningen’s HEAVENN project has created Europe’s largest hydrogen ecosystem, linking wind-powered hydrogen production with supply for residential, industrial, and transport applications [15]. Similarly, Republic of Koreais advancing hydrogen city pilots in Ulsan, Gwangju, and Ansan, embedding full-cycle hydrogen ecosystems—production, storage, supply, and utilization—into urban infrastructure [16].
While hydrogen-related infrastructures for production, distribution, and utilization are rapidly expanding worldwide, the environmental performance of these systems exhibits substantial variability depending on the energy source, technology, and supply chain configuration [4]. Akhtar et al. (2021) demonstrated that pipeline transportation of hydrogen yields the lowest GHG emissions among seven transportation and storage pathways, whereas liquid organic hydrogen carriers (LOHCs) and ammonia-based chains are comparatively more carbon-intensive [17]. Elgowainy et al. highlighted how U.S. production pathways vary widely depending on the power mix and boundary definitions [18]. Ocko and Hamburg showed that although green hydrogen has the potential to achieve nearly 100% GHG reduction, the outcome is sensitive to leakage rates and the carbon intensity of electricity supply [10]. Rinawati et al., through a meta-analysis of 21 Life cycle assessment (LCA) studies, emphasized that methodological choices such as boundary setting, inclusion of transport/storage stages, and consideration of equipment manufacturing and disposal significantly alter results [13].
In Republic of Korea, growing policy interest in hydrogen ecosystems has not yet been matched by extensive empirical, data-driven LCA studies. While hydrogen is often labeled a “clean” energy source, its life-cycle emissions vary significantly depending on the technology applied at each stage. Hydrogen derived from fossil fuels without carbon capture can exceed the footprint of conventional fuels, whereas renewable-powered hydrogen offers genuine reductions. Furthermore, differences in storage method (compression, liquefaction, chemical carriers), transportation mode (tube trailers, pipelines), and utilization sector (mobility, industry, buildings) introduce further variability. Therefore, it is inappropriate to define the carbon intensity of hydrogen with a single value.
Against this backdrop, this study adopts a comprehensive life-cycle perspective on the hydrogen ecosystem, integrating national statistical data with existing research findings to independently analyze multiple key stages; production, utilization (power generation, and mobility). By encompassing all major stages rather than isolating a single one, the analysis identifies stage-specific contributions to overall GHG emissions and enables detailed comparisons with fossil fuel-based systems. The results provide a robust scientific basis for shaping carbon neutrality policies, evaluating their effectiveness, and guiding infrastructure investment decisions.
2. Hydrogen Ecosystem Overview
2.1. Key Components
A comprehensive life-cycle evaluation of GHG reduction efficiency in the hydrogen ecosystem necessitates a detailed and systematic assessment of its three core phases: production, distribution, and utilization [19]. GHG emissions and reduction potentials vary significantly depending on the hydrogen production method, the technologies used for storage and transport, and the specific application sectors. Therefore, a quantitative analysis supported by an integrated system-wide view is required [10]. These three interconnected phases form the foundation of the hydrogen value chain in Republic of Korea, as illustrated in Figure 1.
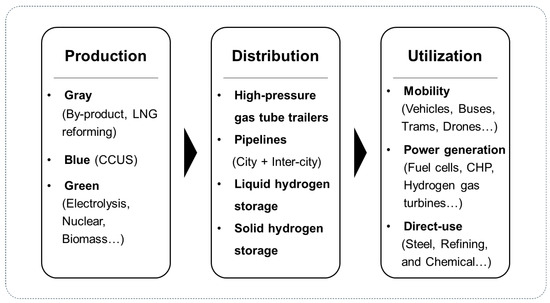
Figure 1.
Three-Phase Hydrogen Value Chain in Republic of Korea.
The production phase marks the starting point of the hydrogen life-cycle and includes various methods such as green hydrogen (electrolysis powered by renewable energy), blue hydrogen (natural gas reforming with carbon capture, utilization, and storage; CCUS), and gray hydrogen (steam methane reforming without carbon capture) [20]. For green hydrogen, electrolysis technologies utilizing solar and wind energy are central. The life-cycle GHG emissions of this method are reported to range from 0.8 to 4.6 kg CO2-eq per kg of hydrogen [21]. In the case of blue hydrogen, the application of CCUS technologies aims to minimize residual CO2 emissions and fugitive methane releases. Despite the implementation of CCUS, production-phase emissions can still range from 1.2 to 9.2 kg CO2-eq per kg H2, depending on capture efficiency (60–98%) and methane leakage rates (0.01–5.4%) [10,19].
In the distribution phase, a variety of technologies are applied, including high-pressure gaseous storage (200–700 bar), liquefied hydrogen at −253 °C, tube trailer distribution, and the development of nationwide hydrogen pipeline infrastructure [12]. Given hydrogen’s low volumetric energy density and high flammability, the storage and transport phase poses significant technical and safety challenges. This phase can contribute 10–30% of total life-cycle GHG emissions, with leakage during storage and transport accounting for up to 60% of overall hydrogen loss [22]. For instance, pipeline transport over 1000 km may emit up to 1.5 kg CO2-eq per kg H2, and over 5000 km, emissions may rise to 5.2 kg CO2-eq per kg H2. Additionally, storage infrastructure designed for three days of hydrogen capacity can contribute up to 0.5 kg CO2-eq per kg H2 in emissions [23].
In the utilization phase, hydrogen is employed across diverse sectors including mobility (hydrogen vehicles, buses, trains and urban air mobility), power generation (fuel cells and hydrogen gas turbines), direct-use (steel, refining, and chemical production), and residential and commercial buildings (household-scale fuel cells). In the power generation sector, hydrogen gas turbines integrated with CCS technology emit approximately 59 g CO2-eq per kWh, achieving an 84% reduction compared to coal-fired power generation at 369 g CO2-eq per kWh. In the mobility sector, hydrogen fuel cell vehicles can achieve 75–90% lower emissions than diesel vehicles. Within industrial applications, replacing gray hydrogen with clean hydrogen can lead to over 50% reductions in GHG emissions [22]. In Republic of Korea, new demand creation through household fuel cells and urban air mobility (UAM) is establishing a decarbonization foundation, while the expansion of stationary fuel cell deployment and the transition to clean hydrogen in industrial processes have been identified as key mid- to long-term policy objectives [21]. However, in this study, the direct-use sector was excluded from the quantitative analysis for two main reasons: (1) the absence of standardized and reliable LCA data under Korean conditions; and (2) the fact that direct-use applications—such as hydrogen-based direct reduced iron (H-DRI), ammonia synthesis, and petrochemical processes—consume hydrogen as a chemical feedstock or reducing agent rather than combusting it as an energy source. Consequently, these applications do not align with the combustion-based GHG reduction assessment framework applied in this research.
Ultimately, maximizing the GHG reduction efficiency of the hydrogen ecosystem depends not only on optimizing each individual phase—production, distribution, and utilization—but also on ensuring that these stages are interoperable and cohesively managed across the entire life-cycle [19]. For example, even if green hydrogen is produced with minimal emissions, leakage during storage and transport can significantly undermine the overall mitigation effect [22]. Therefore, conducting rigorous LCA and simultaneously addressing technical and institutional improvements in each phase are essential to enhance the real-world climate benefits of hydrogen systems [19].
2.2. Korea Hydrogen Roadmap Framework
Republic of Korea’s hydrogen ecosystem policy has been structurally designed to position hydrogen as a core resource in the national energy system. Since 2019, three major policy instruments—the “Hydrogen Economy Promotion Roadmap” (2019) [24], the “First Basic Plan for the Implementation of the Hydrogen Economy” (2021) [25], and the “Next-Level Hydrogen City 2.0 Strategy” (2024) [26]—have been sequentially introduced to promote the life-cycle-wide expansion and internalization of the hydrogen value chain. These policies serve complementary roles across technology development, institutional reform, and local deployment, while collectively encompassing the full life-cycle of hydrogen—production, distribution, utilization, infrastructure, and governance. Together, they establish a unified and integrated framework for a national hydrogen ecosystem.
Initially, Republic of Korea’s hydrogen production strategy prioritized gray hydrogen sources, including by-product hydrogen from petrochemical plants and reformed hydrogen from liquefied natural gas (LNG), to ensure early-phase supply stability and economic viability. The 2019 roadmap set forth an ambitious target of increasing annual hydrogen production to over 5.26 million tons by 2040, with green hydrogen comprising more than 70% of the total supply. The Hydrogen City 2.0 strategy further localizes this transition by introducing diversified, region-specific production models. Buyeo, for example, employs solar and wind power-linked electrolysis; Boryeong utilizes CO2-captured blue hydrogen; and Uljin is piloting nuclear-based high-temperature hydrogen production. Additionally, cities like Namyangju and Dangjin are deploying biomass-to-hydrogen technologies, while Gwangyang and Dangjin are exploring thermochemical hydrogen recovery from waste plastics. These initiatives collectively represent a structural transition from centralized, fossil-based production to decentralized, carbon-neutral systems, fostering regional energy autonomy and deeper integration of energy and industrial infrastructures. Demonstration projects at the municipal level are anticipated to serve as scalable prototypes for national deployment.
The distribution phase of the hydrogen value chain is being advanced through both technical innovation and regulatory development, with an emphasis on full life-cycle safety and economic optimization. While initial transport relied heavily on high-pressure gaseous storage and tube trailers, current efforts focus on the expansion of intra-city hydrogen pipelines and inter-city backbone networks. According to the Hydrogen City 2.0 strategy, the country plans to construct 280 km of urban pipelines and connect four major regional clusters by 2040. Concurrently, storage technologies are diversifying to include liquefied hydrogen, solid-state carriers, and modular refillable tanks. These developments are expected to enhance delivery efficiency while minimizing leakage risks and lifecycle costs. To ensure comprehensive safety oversight, the government will expand regional Integrated Hydrogen Safety Operation Centers to 30 by 2040 and establish a centralized national control center for real-time monitoring across the entire production-to-utilization continuum.
Hydrogen utilization in Republic of Korea has evolved from its early focus on mobility to more comprehensive applications across industrial, residential, welfare, and cultural domains. The 2019 roadmap projected the deployment of 6.2 million hydrogen vehicles, 1200 refueling stations, and 15 GW of fuel cell power generation capacity by 2040, positioning mobility and power generation as dual pillars of the hydrogen economy. The Hydrogen City initiative operationalizes these goals at the urban scale, with hydrogen fuel cells now being installed not only in residential buildings and public offices, but also in facilities such as silver towns, smart farms, industrial complexes, and hydrogen-themed parks. Advanced mobility infrastructure is simultaneously being rolled out to accommodate hydrogen trams, drones, and heavy-duty trucks. Notably, cities are increasingly adopting co-generation models that enable the simultaneous production of electricity and heat from hydrogen in multi-use facilities such as recycling centers, youth cultural halls, and village community centers. In industrial clusters, hydrogen refueling stations and logistics hubs are being connected to hydrogen-powered forklifts and autonomous equipment. In some cases, hydrogen is even being tested in specialized applications such as maritime transport and aerial cargo systems. This spatial and functional diversification of hydrogen use signifies a paradigmatic shift not only in urban energy systems but also in the decarbonization of regional economies.
In summary, the flow from hydrogen production to transport and utilization reflects a transition from fragmented, sector-specific interventions to a life-cycle-integrated hydrogen ecosystem. The hydrogen city model functions as a consolidated platform where these interconnected elements are physically and institutionally realized. Republic of Korea’s hydrogen roadmap presents a strategically coherent blueprint that links technological advancement, institutional design, and empirical infrastructure development, aiming to establish a sustainable and nationally embedded hydrogen economy.
3. Methodology
3.1. Definition of GHG Reduction Efficiency
The hydrogen supply chain analysis should encompass all three stages: production, distribution, and utilization. This enables a comprehensive evaluation of greenhouse gas (GHG) emission characteristics over the full life cycle, that is, a well-to-wheel (WtW) assessment. A hydrogen city is defined as an urban energy supply system that uses hydrogen as a fuel to deliver electricity, heat, and mobility services. Accordingly, direct-use applications that consume hydrogen as a chemical feedstock or reducing agent fall outside the scope of a hydrogen city because they do not provide energy services.
The GHG Reduction Efficiency (RE) is calculated as
Here, denotes the life-cycle GHG emissions (kg CO2-eq) of the fossil-fuel-based scenario, and denotes the life-cycle GHG emissions (kg CO2-eq) of the hydrogen-based scenario under the same functional unit.
Total GHG emissions for each scenario are computed as the sum of activity-data and emission-factor products:
In Equation (2), i indexes individual activities or unit processes within each stage, such as electricity consumption, fuel use, raw material input, and transport distance. represents the quantitative magnitude of each activity, for example, kWh, Nm3 or km. is the corresponding GHG emission factor, expressed in t CO2-eq per unit. Emission factors were derived from the Korea Environmental Industry & Technology Institute (KEITI) life-cycle inventory (LCI) database registered in the Global Life Cycle Assessment Data Network(UN GLAD), and from the widely used international database ecoinvent 3.11.
We use the national grid-average emission factor for all electricity-related calculations. Korea operates a single, fully interconnected power grid, and official statistics do not report region-specific grid emission factors. Accordingly, we apply the national grid-average consistently across scenarios. References to specific regions (e.g., Sejong and Gyeonggi) provide case contexts for discussing how the generation mix and the participation of hydrogen fuel cells in electricity supply influence interpretation, and they do not imply regional variation in grid emission factors.
3.2. Scenario Design
3.2.1. Hydrogen Production
The hydrogen production stage is a critical phase within the hydrogen supply chain and exerts the most significant influence on life-cycle GHG emissions associated with hydrogen energy systems [27,28]. In this study, two representative and commercially viable hydrogen production pathways were selected for analysis: by-product hydrogen, and production-based hydrogen that includes both reforming-based and electrolysis-based methods. These categories reflect the structural characteristics of Republic of Korea’s current hydrogen supply system [5].
By-product hydrogen is recovered from hydrogen that is incidentally generated during high-energy industrial processes such as petrochemical refining and steel manufacturing. Because this pathway does not require additional feedstock input or distinct reaction processes, it typically results in relatively low resource consumption and lower GHG emissions per unit of energy produced.
Production-based hydrogen involves deliberate hydrogen generation through either fossil fuel reforming or water electrolysis. Reforming-based hydrogen is primarily produced through steam methane reforming (SMR), in which methane (CH4) reacts with high-temperature steam to produce hydrogen and carbon dioxide (CO2). Electrolysis-based hydrogen is generated by splitting water (H2O) using electricity supplied from renewable sources such as solar and wind power. As of 2023, reforming and electrolysis represent the principal means of dedicated hydrogen production in Republic of Korea.
For comparative purposes, a reference scenario was constructed from fossil fuel systems capable of delivering the same amount of useful energy, expressed on a lower heating value (LHV) basis, as the hydrogen produced in Republic of Korea in 2023. The selected fossil fuels, namely anthracite, diesel, gasoline, kerosene, and liquefied natural gas (LNG), represent the country’s major primary energy sources. For each fuel, the required input quantity and associated life-cycle GHG emissions were estimated to match the functional energy output of the hydrogen system.
The functional unit is defined as “the total amount of useful energy (MJ, LHV basis) provided by the hydrogen produced in Republic of Korea in 2023.” This enables consistent and quantitative comparison between the hydrogen and fossil fuel scenarios. The system boundary was set to a cradle-to-gate scope, encompassing processes from raw material extraction to hydrogen (or fuel) purification and compression. The analysis was limited to the production stage, and all comparisons were conducted under harmonized functional units and system boundaries to ensure methodological consistency.
To ensure comparability across fuels, inputs are normalized so that each scenario delivers the same useful energy (LHV basis). The required input mass of a comparison fuel is determined as:
Here, is the useful energy provided by the hydrogen reference (functional unit), (MJ kg−1) is the lower heating value of the comparison fuel, is the representative energy conversion efficiency of the comparison fuel’s end-use system, and (kg) denotes the mass of the comparison fuel required to match the hydrogen reference’s useful energy.
3.2.2. Hydrogen Distribution
The ‘distribution’ (storage and transport) phase was methodologically excluded from the system boundary of this LCA-based analysis. This delineation was necessitated by the study’s methodological framework, which is defined by a strict reliance on high-fidelity national statistical data to ensure robustness.
While the production and utilization phases are underpinned by established national statistical data, the distribution sector currently lacks comparable datasets. This data gap is a result of the sector’s high operational heterogeneity, encompassing various modalities (e.g., tube trailers, nascent pipelines, liquefaction) for which standardized, representative national statistics are not yet established.
To preserve the methodological consistency and data fidelity of the analysis, and to avoid introducing significant, unquantifiable uncertainties, this stage was intentionally omitted.
3.2.3. Hydrogen Utilization
Quantitative evaluation of GHG emissions in the hydrogen utilization phase is essential for assessing the actual environmental performance of hydrogen-based systems and for formulating strategic technologies and policies for carbon neutrality. This study analyzes the GHG emission characteristics of hydrogen utilization from a life-cycle perspective and compares them with conventional fossil fuel-based systems to derive the GHG reduction efficiency of hydrogen systems. The analysis is divided into the power generation and mobility sectors. For each sector, clear system boundaries and functional units were established, and emission factors and statistical data from both domestic and international sources were applied to ensure methodological reliability.
In the energy sector, hydrogen fuel cell power generation serves as the representative application. The analysis utilized activity data from the Korea Energy Agency’s “2023 Regional Statistics on Hydrogen Fuel Cell Deployment.” The system boundary covers the entire process from hydrogen production to electricity generation via fuel cells. The functional unit is the annual electricity output (in MWh or kWh), and the corresponding GHG emissions are compared to fossil fuel-based power systems that provide equivalent output. Hydrogen production pathway examined include grey hydrogen (via steam methane reforming). Emission factors were drawn from the KEITI LCI database. The national average grid emission factor served as the comparative baseline.
For mobility, the study compares the full life-cycle GHG emissions of fuel cell electric vehicles (FCEVs) and internal combustion engine vehicles (ICEVs). The assessment encompasses fuel production (Well-to-Tank, WTT), vehicle operation (Tank-to-Wheel, TTW), and vehicle component manufacturing (Cradle-to-Gate). The functional unit is the total annual driving distance (km/year) of all hydrogen vehicles newly registered in the target year, representing equivalent transport service delivery.
In the fuel production stage, fuel consumption was calculated based on vehicle registration numbers, average daily driving distance, and fuel economy (hydrogen: km/kg, fossil fuels: km/L). GHG emissions were estimated by multiplying these with respective emission factors.
Operational emissions were calculated based on the respective characteristics of each vehicle type. FCEVs were treated as zero-emission vehicles (ZEVs) with no direct tailpipe emissions, while ICEV emissions were estimated from fuel consumption rates and distance-based emission factors. Emissions from the production of key vehicle components—such as fuel cell stacks and internal combustion engines—were calculated by multiplying the number of units by per-unit manufacturing emission factors.
Statistical data on vehicle registrations and driving distances were sourced from the Ministry of Land, Infrastructure and Transport’s “Status of Hydrogen Vehicle Registrations in Korea (2025) [29]” and the Korea Transportation Safety Authority’s “Annual Driving Distance by Vehicle Type, Usage, and Fuel (2023) [30].” These data enabled detailed estimation of emissions by region and vehicle type. Table 1 presents the number of hydrogen vehicles registered in Republic of Korea as of 2024, disaggregated by region, vehicle type, and usage (private/commercial). This table served as a foundational dataset for analyzing regional GHG emission patterns in the mobility sector. Table 2 provides the average annual driving distance by region and vehicle type, allowing more accurate GHG emission estimations reflecting local differences in fuel consumption.

Table 1.
Hydrogen Vehicle Registrations by Region (City/Province), Republic of Korea, 2024. (Unit: Vehicles).
Table 2.
Total Annual Vehicle-Kilometers Traveled (VKT) of hydrogen vehicles by Region (City/Province), Republic of Korea, 2024. (Unit: km/year).
This methodological framework is designed to enable multi-dimensional and quantitative assessment of the GHG reduction potential of hydrogen-based systems by region and vehicle type, offering a scientific foundation for future low-carbon transportation strategies.
4. Results and Discussion
4.1. Hydrogen Production Phase
Hydrogen production is the dominant source of life-cycle GHG emissions in hydrogen energy systems. Consequently, it is a key target for intervention in national carbon neutrality strategies. This section presents a quantitative analysis of GHG emission characteristics across domestic hydrogen production pathways.
Because Republic of Korea has not yet established official life cycle-based emission factors by hydrogen production method, this study employed a hybrid LCI database approach. While emission factors for conventional fuels (anthracite, gasoline, diesel, kerosene, and LNG) were based on the KEITI LCI database (Korea-specific), the hydrogen production pathways were initially sourced from the internationally validated ecoinvent 3.11 database (Global). This approach, however, presented a methodological inconsistency, as the system boundaries and geographic specificities did not align. The ecoinvent ‘production-based hydrogen’ (SMR) process, for instance, defaults to a ‘Rest of World’ (RoW) average for its natural gas feedstock, which is not representative of the Korean supply chain and compromises direct comparison with the KEITI data. To rectify this inconsistency and ensure methodological congruency, a sensitivity analysis was performed to regionalize the feedstock for SMR. We replaced the generic ‘RoW’ LNG input with a ‘Korea-Specific’ feedstock mix. This mix was modeled using official statistics from the Korea Energy Economics Institute (KEEI), published in 2025 (reflecting 2024 data) [31]. The specific import portfolio applied was: Australia (27.2%), Qatar (21.2%), Malaysia (14.6%), USA (13.4%), Oman (11.3%), Indonesia (7.2%), and Russia (5.0%).
This regionalization adjustment increased the ‘production-based hydrogen’ (SMR) emission factor from the original ecoinvent value of 10.7 kg CO2-eq per kg H2 [32] to a corrected, Korea-specific value of 11.2 kg CO2-eq per kg H2.
According to data obtained from the Korea Petroleum Quality and Distribution Authority and the Korea Gas Corporation, total hydrogen production in Republic of Korea in 2023 2,484,437 tons. By-product hydrogen accounted for 1,416,050 tons (57.0%) and production-based hydrogen contributed 1,068,387 tons (43.0%) (Table 3). These figures underscore the predominant role of by-product hydrogen in the national supply, largely attributable to the maturity of domestic heavy industries. At the same time, the limited scalability of by-product hydrogen highlights the importance of expanding clean production-based alternatives, particularly those powered by renewable energy.
Table 3.
Annual Hydrogen Production by Production Method, Republic of Korea, 2023.
A weighted-average emission factor was then calculated based on the production share of each pathway, using the corrected Korea-specific SMR factor. Applying the by-product hydrogen factor of 2.63 kg CO2-eq per kg H2 [33] and the production-based factor of 11.2 kg CO2-eq per kg H2, the resulting production-weighted average for Republic of Korea is 6.31 kg CO2-eq per kg H2. This approach ensures that the LCI for hydrogen production reflects the current national mix and allows for a representative quantification of upstream GHG emissions (Table 4).
Table 4.
Energy Properties and Cradle-to-gate GHG Emission Factors for Hydrogen and Fossil Fuels. Emission factors for hydrogen were derived from ecoinvent 3.11 (global), while those for fossil fuels were based on the KEITI LCI database (Republic of Korea, with LNG reflecting import mix).
As shown in Figure 2, total life-cycle GHG emissions from hydrogen production in 2023 are estimated to be 15.7 Mt CO2-eq (1.57 × 10⁷ t CO2-eq). For comparative analysis, fossil fuel alternatives delivering the same energy content, based on hydrogen’s lower heating value of 120.1 MJ per kg, produced the following GHG emissions: anthracite 68.3 Mt CO2-eq, diesel 5.5 Mt CO2-eq, gasoline 16.5 Mt CO2-eq, kerosene 5.5 Mt CO2-eq, and LNG 8.5 Mt CO2-eq. Under a cradle-to-gate, the relative reduction efficiencies versus hydrogen were 77.0% for anthracite, −183.8% for diesel, 5.2% for gasoline, −185.9% for kerosene, and −85.5% for LNG. Hydrogen therefore offers substantial mitigation potential when displacing high-emission fuels such as anthracite and gasoline. The negative values for diesel, kerosene, and LNG are not calculation errors but a consequence of the chosen boundary. Given the current hydrogen production mix with a production-weighted emission factor of 6.31 kg CO2-eq per kg H2, these fossil fuels exhibit lower production-phase emissions per unit of useful energy than hydrogen. Hence the calculated reduction efficiencies are negative, with diesel and kerosene falling well below −180%. This indicates that, at the production stage alone, the burden of hydrogen remains comparatively large.
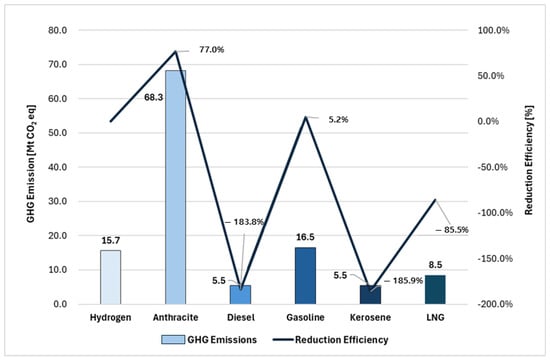
Figure 2.
Life-cycle GHG Emissions and Reduction Efficiencies of Hydrogen- and Fossil Fuel-based Systems. Positive reduction efficiency values indicate the fossil fuel system emits more than the hydrogen system, while negative values indicate the hydrogen system emits more. All values represent cradle-to-gate (production) emissions; tank-to-wheel combustion is excluded.
In summary, the current fossil-based hydrogen production practices in Republic of Korea limit the achievable climate benefits of hydrogen systems. To enhance their environmental performance, a transition toward renewable-powered electrolysis and the development of a low-carbon hydrogen supply chain are urgently required.
4.2. Hydrogen Utilization Phase
4.2.1. Power Generation Application
As of 2023, stationary hydrogen fuel cell systems (SHFCs) have been increasingly adopted within Korea’s stationary power generation sector, gaining recognition for their dual advantages in electricity production and GHG mitigation. This study compiled power generation data from 17 administrative districts, revealing a cumulative electricity output of approximately 6.26 TWh (6.26 × 10⁶ MWh) from SHFCs. Incheon (1.39 TWh) and Gyeonggi Province (1.63 TWh) represented the highest regional outputs, reflecting a spatial concentration of SHFC installations in industrialized and metropolitan regions.
The GHG emissions associated with SHFCs depend on the hydrogen production pathway. According to the KEITI LCI database, the life-cycle emission factor for SHFC-based power generation using grey hydrogen (produced via steam-methane reforming of natural gas) is 0.58 kg CO2-eq per kWh. In contrast, the national grid’s average emission factor is lower, at 0.51 kg CO2-eq per kWh. Utilizing these figures, the annual GHG emissions from SHFC-based power generation are estimated at 3.63 × 10⁶ t CO2-eq, exceeding emissions from grid electricity (3.20 × 10⁶ t CO2-eq) by approximately 4.24 × 10⁵ t CO2-eq.
These findings indicate that SHFCs, under current supply chain conditions, are not inherently carbon-neutral. This is visualized in Figure 3, which illustrates the regional distribution of GHG emissions from SHFC-based power versus conventional grid electricity. Without a transition to low-carbon hydrogen, increased deployment of SHFCs could paradoxically exacerbate GHG emissions.
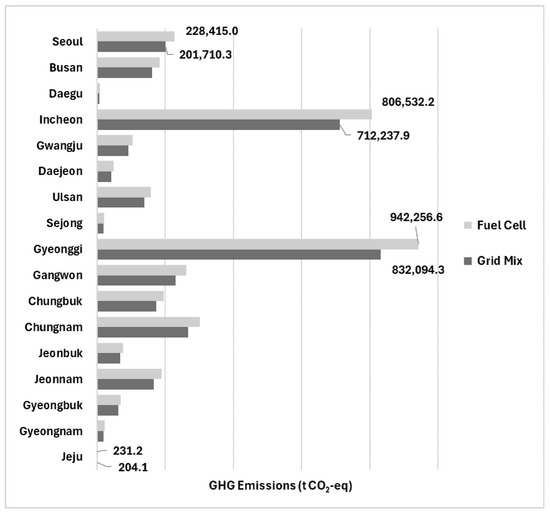
Figure 3.
Regional Distribution of GHG Emissions from Stationary Hydrogen Fuel Cell and Grid Power Systems.
In conclusion, realizing the climate-mitigation potential of SHFC-based power generation necessitates parallel decarbonization of the hydrogen supply chain. Strategically prioritizing green hydrogen adoption is imperative to maximize environmental benefits.
4.2.2. Mobility Application
This study examines, from a life-cycle perspective, of GHG emissions from ICEVs and FCEVs across Korea’s 17 administrative regions. The system boundary includes fuel production (Well-to-Tank), vehicle operation (Tank-to-Wheel), and powertrain manufacturing (ICE engines or fuel cell systems).
Under the ICEV scenario, total annual life-cycle GHG emissions are estimated at 8.58 × 10⁴ t CO2-eq, covering all stages. The FCEV scenario results in emissions of 3.59 × 10⁴ t CO2-eq, mostly from hydrogen production, storage, transport, and fuel cell manufacturing. This indicates an absolute reduction of 5.00 × 10⁴ t CO2-eq, or an average GHG reduction rate of 58.2%.
For ICEVs, the vehicle operation phase accounts for the largest share of total emissions, contributing approximately 67% on average. Fuel production and powertrain manufacturing contribute about 23% and 10%, respectively. For instance, in Seoul, the total life-cycle emissions of ICEVs were estimated at 5.97 × 10³ t CO2-eq per year, with vehicle operation alone accounting for 3.87 × 10³ t CO2-eq, or approximately 64.7% of the total.
In contrast, FCEVs generate zero direct emissions during vehicle operation, resulting in a dramatically different emission structure. On average, approximately 93% of the total GHG emissions from FCEVs are attributed to the fuel production phase, with the remaining emissions stemming from fuel cell system manufacturing. For example, in Gyeonggi Province, the total GHG emissions from FCEVs amounted to 7.61 × 10³ t CO2-eq per year, of which 7.38 × 10³ t CO2-eq originated from hydrogen production and 2.38 × 10² t CO2-eq from fuel cell manufacturing—making fuel production responsible for approximately 96.9% of total emissions.
These findings are detailed in Table 5, which presents the regional life-cycle GHG emissions for both ICEVs and FCEVs, disaggregated by fuel production, vehicle operation, and powertrain manufacturing stages.
Table 5.
Regional Life-Cycle GHG Emissions by Vehicle Type and Stage. (Unit: t CO2-eq/year.)
Emission disparities reflect regional differences in vehicle numbers, mileage, hydrogen consumption, and supply chain carbon intensity. Urban areas show greater absolute reductions due to higher traffic, while less populated regions have relatively higher reduction rates. For instance, in Gyeonggi Province, ICEV-related life-cycle emissions were approximately 1.78 × 10⁴ t CO2-eq per year, which decreased to 7.61 × 10³ t CO2-eq per year under the FCEV scenario, representing a reduction of 1.02 × 10⁴ t CO2-eq and a reduction rate of 57.2%. Similarly, Seoul and Incheon recorded GHG reduction rates of 57.8% and 61.1%, respectively. Notably, medium- and small-sized cities such as Sejong and Jeju achieved the highest reduction rates of 61.0% and 62.8%, respectively.
Given Korea’s single national grid emission factor, the differences primarily reflect operational efficiency and supply chain configurations rather than grid carbon intensity. Accordingly, we propose a multi-criteria spatial framework integrating (i) regional FCEV reduction efficiency, (ii) renewable and green-hydrogen potential, and (iii) infrastructure maturity and demand scale. This framework prioritizes high-efficiency regions (Sejong, Jeju) for early pilots, designates infrastructure-concentrated areas (Ulsan, Incheon) as supply hubs, and expands deployment to large-demand metropolitan zones (Seoul, Busan, Gyeonggi) once green-hydrogen linkages are secured. Deployment based on grey hydrogen should be avoided due to the risk of a rebound in emissions (Figure 4).
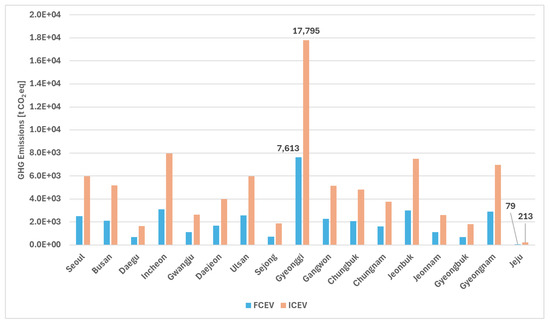
Figure 4.
Regional Analysis of Life-cycle GHG Emissions for ICEVs and FCEVs.
Figure 5 compares regional rankings based on the number of registered FCEVs and their corresponding GHG reduction impacts. The results reveal that FCEV deployment rankings do not exhibit a linear correlation with GHG reduction performance. For example, while Gyeonggi ranked first in FCEV registrations, it placed only 13th in terms of reduction impact. Conversely, Sejong and Jeju, ranking 16th and 17th in vehicle registration, achieved the 4th and 1st highest GHG reduction impacts, respectively. These findings underscore that GHG mitigation effectiveness is not solely dependent on the number of vehicles deployed, but is also shaped by region-specific driving behavior, energy demand profiles, hydrogen supply chain configurations, and production technologies. In Sejong, the low total driving volume combined with an efficient hydrogen distribution system contributed to high GHG mitigation efficiency despite its relatively small fleet size. These results emphasize the necessity of formulating hydrogen vehicle deployment policies that extend beyond numerical expansion and incorporate regionally tailored strategies. In particular, the identification of high-efficiency, low-density regions highlights the potential role of medium- and small-sized cities as strategic hubs for achieving carbon neutrality through localized hydrogen infrastructure optimization.
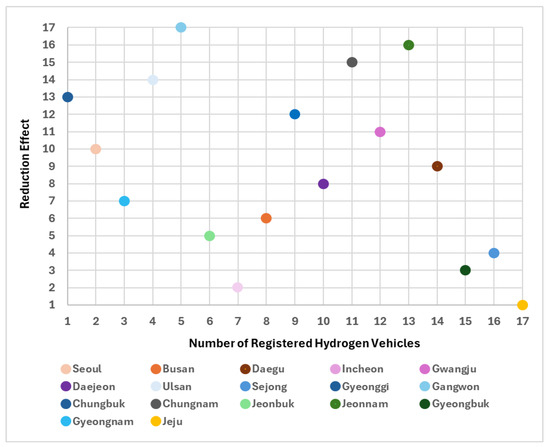
Figure 5.
Hydrogen Vehicle Registration and Life-cycle Emission Reduction Rankings.
5. Conclusions
This study presents a life cycle-based evaluation of GHG emissions associated with hydrogen energy systems in Republic of Korea, comparing them with conventional fossil fuel systems. The assessment focused on the production and utilization phases, drawing upon real-world data such as domestic hydrogen supply sources, FCEVs statistics, driving patterns, and hydrogen power generation levels.
The production phase was found to be the most carbon-intensive part of the hydrogen value chain, largely due to the prevailing dependence on by-product hydrogen and fossil fuel-based reforming. The estimated average life-cycle emission factor of 6.31 kg CO2-eq per kg of hydrogen reflects the limitations of the current supply structure. Nevertheless, hydrogen shows considerable GHG reduction potential—up to 77%—when displacing high-emission fuels like anthracite. This highlights the need to accelerate the transition to low-carbon hydrogen, particularly green hydrogen produced through renewable energy-powered electrolysis.
In the utilization phase, hydrogen fuel cell systems demonstrated meaningful reductions in GHG emissions. Stationary grey hydrogen-based fuel cell systems currently emit more than the national grid average. In the mobility sector, FCEVs outperformed ICEVs, with an average emission reduction of 58.2%. Regional variations were evident, with cities such as Sejong and Jeju exhibiting particularly favorable outcomes. These findings point to the importance of developing hydrogen deployment strategies that are tailored to local characteristics rather than uniformly scaled.
The study also acknowledges several limitations:
- The use of average values for vehicle efficiency and distance traveled does not fully capture the variability among different vehicle types, such as heavy-duty trucks and public transit fleets.
- The analysis was limited to mobility and power applications. Broader assessments are needed to explore hydrogen use in residential and commercial energy systems, hydrogen-based feedstocks for chemical industries, and emerging sectors such as maritime and aviation transport.
- The environmental impact of hydrogen storage and distribution remains underexplored. In this study, the distribution phase was excluded due to heterogeneity in transport routes, infrastructure development, and the absence of reliable datasets. We acknowledge that this omission limits the comprehensiveness of the LCA. Future studies should employ scenario-based or sensitivity analyses comparing pipeline transport, liquefied hydrogen transport, and chemical carrier pathways to quantify distribution-phase emissions and enhance methodological robustness.
The scope is aligned with the hydrogen city’s fuel-based energy supply, and the utilization analysis quantifies power and transport. Feedstock-based industrial direct use is defined as out of scope and excluded. Adding such applications could increase total abatement but also broaden uncertainty due to sensitivities to plant integration, co-product oxygen allocation, electricity carbon intensity, and distribution or leakage assumptions. The policy implication remains the same. Outcomes are determined by the hydrogen production pathway and the decarbonization of the power mix.
Furthermore, as this study’s primary focus was the scientific quantification of GHG impacts based on LCA, it did not extend to proposing specific actionable pathways (such as detailed cost–benefit analyses, scalability models, or policy levers) required to achieve the necessary transition to green hydrogen. This represents a scope limitation that bridges scientific assessment and policy implementation. Based on this study’s findings, which underscore the urgency of transitioning away from grey hydrogen, future policy research must focus on these actionable pathways. Policymakers should urgently consider a comprehensive suite of instruments. This includes supply side policies (e.g., targeted ‘renewable energy subsidies’ and establishing a clear ‘green hydrogen certification system’) [41], regulatory measures (e.g., ‘CCUS mandates’ for blue hydrogen and strengthening ‘carbon pricing’ on grey hydrogen) [42,43], demand-pull mechanisms (e.g., a ‘Clean Hydrogen Portfolio Standard (HPS)’ and ‘public procurement’ programs), and foundational support (e.g., strategic ‘infrastructure investment’ for distribution and storage) [44].
Overall, the climate benefits of hydrogen systems are not inherent, but contingent upon production methods, utilization sectors, and regional contexts. Expanding green hydrogen production, improving deployment efficiency, diversifying applications, and implementing the robust, multi-faceted policy frameworks discussed herein will be pivotal to realizing hydrogen’s potential as a practical contributor to carbon neutrality.
Author Contributions
Conceptualization, J.L.; methodology, J.L.; validation, Y.W.H.; formal analysis, J.L. and I.J.; investigation, S.B.K.; data curation, S.L.; writing—original draft preparation, J.L.; writing—review and editing, J.L., I.J., S.B.K. and S.L.; visualization, S.B.K.; supervision, Y.W.H.; project administration, J.L. All authors have read and agreed to the published version of the manuscript.
Funding
This work is supported by the Korea Agency for Infrastructure Technology Advancement (KAIA) grant funded by the Ministry of Land, Infrastructure and Transport (Grant RS-2024-00417444).
Institutional Review Board Statement
Not applicable.
Informed Consent Statement
Not applicable.
Data Availability Statement
The data presented in this study are available on request from the corresponding author.
Conflicts of Interest
The authors declare no conflicts of interest.
References
- Masson-Delmotte, V.; Zhai, P.; Pirani, A.; Connors, S.L.; Péan, C.; Berger, S.; Caud, N.; Chen, Y.; Goldfarb, L.; Gomis, M.I. Climate Change 2021: The Physical Science Basis. Contribution of Working Group I to the Sixth Assessment Report of the Intergovernmental Panel on Climate Change; Cambridge University Press: Cambridge, UK, 2021; Volume 2, p. 2391. [Google Scholar] [CrossRef]
- Bouckaert, S.; Pales, A.F.; McGlade, C.; Remme, U.; Wanner, B.; Varro, L.; D’Ambrosio, D.; Spencer, T.; International Energy Agency. Net Zero by 2050: A Roadmap for the Global Energy Sector. 2021. Available online: https://trid.trb.org/View/1856381 (accessed on 4 July 2025).
- Osman, A.I.; Al-Muhtaseb, A.H.; Al-Fatesh, A.S.; Rooney, D.W. Life cycle assessment of hydrogen production, storage, and utilization toward sustainability. WIREs Energy Environ. 2024, 13, e526. [Google Scholar] [CrossRef]
- Puig-Samper, G.; Bargiacchi, E.; Iribarren, D.; Dufour, J. Life-cycle assessment of hydrogen systems: A systematic review and meta-regression analysis. J. Clean. Prod. 2024, 470, 143330. [Google Scholar] [CrossRef]
- Staffell, I.; Scamman, D.; Abad, A.V.; Balcombe, P.; Dodds, P.E.; Ekins, P.; Ward, K.R. The role of hydrogen and fuel cells in the global energy system. Energy Environ. Sci. 2019, 12, 463–491. [Google Scholar] [CrossRef]
- Yang, M.; Hunger, R.; Berrettoni, S.; Sprecher, B.; Wang, B. A review of hydrogen storage and transport technologies. Clean Energy 2023, 7, 190–216. [Google Scholar] [CrossRef]
- Hoschke, J.; Chowdhury, M.F.W.; Venezuela, J.; Atrens, A. A review of hydrogen embrittlement in gas transmission pipeline steels. Corros. Rev. 2023, 41, 277–317. [Google Scholar] [CrossRef]
- Martinez, G.E.; Degens, R.; Espadas-Aldana, G.; Costa, D.; Cardellini, G. Prospective Life Cycle Assessment of Hydrogen: A Systematic Review of Methodological Choices. Energies 2024, 17, 4297. [Google Scholar] [CrossRef]
- Maniscalco, M.P.; Longo, S.; Cellura, M.; Miccichè, G.; Ferraro, M. Critical review of life cycle assessment of hydrogen production pathways. Environments 2024, 11, 108. [Google Scholar] [CrossRef]
- Ocko, I.B.; Hamburg, S.P. Climate consequences of hydrogen emissions. Atmos. Chem. Phys. 2022, 22, 9349–9368. [Google Scholar] [CrossRef]
- Jeong, S.; Hyeon, H.; Lee, J.; Kim, Y. Vision and Strategic Planning for Hydrogen City Infrastructure and Hydrogen Grid Technology Development Toward a Future Hydrogen Society. Final Research Report. Korea Institute of Energy Research, Korea Agency for Infrastructure Technology Advancement, Ministry of Land, Infrastructure, and Transport, Republic of Korea. 2021. Available online: https://scienceon.kisti.re.kr/srch/selectPORSrchReport.do?cn=TRKO202100022805 (accessed on 25 October 2025).
- Ayca, S.; Dincer, I. Life cycle environmental impact assessment and review of hydrogen fuels obtained from various sources for vehicles. Int. J. Hydrog. Energy 2025, 127, 265–274. [Google Scholar] [CrossRef]
- Rinawati, D.I.; Permadi, D.A.; Siregar, M.R.; Hasibuan, R.; Nugroho, B.A. Life-cycle assessment of hydrogen utilization in power generation: A systematic review of technological and methodological choices. Front. Sustain. 2022, 3, 920876. [Google Scholar] [CrossRef]
- Yamane, F. Fukushima Hydrogen Energy Research Field in Japan ready for green hydrogen production. Fuel Cells Bull. 2020, 2020, 1. [Google Scholar] [CrossRef]
- Heaven Project. H2 Energy Applications in Valley Environments for Northern Netherlands. Heaven Project. Available online: https://heavenn.org (accessed on 4 July 2025).
- Choi, W.; Kang, S. Greenhouse gas reduction and economic cost of technologies using green hydrogen in the steel industry. J. Environ. Manag. 2023, 335, 117569. [Google Scholar] [CrossRef]
- Akhtar, M.S.; Dickson, R.; Liu, J.J. Life cycle assessment of inland green hydrogen supply chain networks with current challenges and future prospects. ACS Sustain. Chem. Eng. 2021, 9, 17152–17163. [Google Scholar] [CrossRef]
- Elgowainy, A.; Han, J.; Wang, M.; Bafana, A.; Lee, U.; DiVita, V.; Cai, H.; Lohse-Busch, H. Environmental life-cycle analysis of hydrogen technology pathways in the United States. Front. Energy Res. 2024, 12, 1473383. [Google Scholar] [CrossRef]
- Sand, M.; Fuglestvedt, J.S.; Collins, W.J.; Smith, S.J.; O’Connor, F.M. A multi-model assessment of the global warming potential of hydrogen. Commun. Earth Environ. 2023, 4, 203. [Google Scholar] [CrossRef]
- Lee, H.C.; Kim, D.; Kang, M.; Kim, H. Recent advances in photoelectrochemical hydrogen production using I–III–VI quantum dots. Nanoscale 2024, 16, 9295–9310. [Google Scholar] [CrossRef] [PubMed]
- Kim, K.-M.; Kim, D. Life Cycle Assessment of Greenhouse Gas Emissions in Hydrogen Production via Water Electrolysis in South Korea. Sustainability 2024, 16, 11010. [Google Scholar] [CrossRef]
- Cooper, J.; Dubey, L.; Bakkaloglu, S.; Hawkes, A. Hydrogen emissions from the hydrogen value chain—emissions profile and impact to global warming. Sci. Total Environ. 2022, 830, 154624. [Google Scholar] [CrossRef] [PubMed]
- Halder, P.; Hasanuzzaman, M.; Rahim, N.A.; Pandey, A.K. Advancements in hydrogen production, storage, distribution and refuelling for a sustainable transport sector: Hydrogen fuel cell vehicles. Int. J. Hydrog. Energy 2024, 52, 973–1004. [Google Scholar] [CrossRef]
- Government of the Republic of Korea, Ministry of Trade, Industry and Energy (MOTIE). Hydrogen Economy Promotion Roadmap. 2019. Available online: https://www.motie.go.kr/kor/article/ATCLf724eb567/210222/view (accessed on 4 July 2025).
- Government of the Republic of Korea, Ministry of Trade, Industry and Energy (MOTIE). First Basic Plan for the Implementation of the Hydrogen Economy. 2021. Available online: https://h2hub.or.kr/main/yard/video.do?mode=view&articleNo=913&article.offset=0&articleLimit=10 (accessed on 4 July 2025).
- Government of the Republic of Korea, Ministry of Land, Infrastructure and Transport (MOLIT). Next-Level Hydrogen City 2.0 Strategy. 2024. Available online: https://www.korea.kr/briefing/pressReleaseView.do?newsId=156658162 (accessed on 4 July 2025).
- Goita, E.G.; Berrill, P.; Zeng, T. Effect of hydrogen leakage on the life cycle climate impacts of hydrogen supply chains. Commun. Earth Environ. 2025, 6, 160. [Google Scholar] [CrossRef]
- De Kleijne, K.; Gibon, T.; Hertwich, E.G. Worldwide greenhouse gas emissions of green hydrogen production and transport. Nat. Energy 2024, 9, 1139–1152. [Google Scholar] [CrossRef]
- Ministry of Land, Infrastructure and Transport (MOLIT). Status of Hydrogen Vehicle Registrations in Korea. 2025. Available online: https://h2hub.or.kr/main/stat/stat_use_hCar_apply.do (accessed on 4 July 2025).
- Korea Transportation Safety Authority. Automobile Driving Distance Statistics. 2023. Available online: https://kosis.kr/statHtml/statHtml.do?orgId=426&tblId=DT_42601_N003&conn_path=I2 (accessed on 4 July 2025).
- Korea Energy Economics Institute. Natural Gas Imports by Country. Korea Energy Statistics Information System (KESIS). 2025. Available online: https://kesis.keei.re.kr/statHtml/statHtml.do?orgId=339&tblId=DT_KITA_0004&conn_path=I2 (accessed on 30 September 2025).
- Ecoinvent Association. Life Cycle Inventory Dataset: Hydrogen Production, Steam Methane Reforming, Version 3.11; Cut-off System Model; Ecoinvent Database. 2025. Available online: https://ecoquery.ecoinvent.org/3.11/cutoff/dataset/26691/documentation (accessed on 18 August 2025).
- Ecoinvent Association. Life Cycle Inventory Dataset; Hydrogen Production, Gaseous, Petroleum Refinery Operation, Version 3.11; Cut-off System Model; Ecoinvent Database. 2025. Available online: https://ecoquery.ecoinvent.org/3.11/cutoff/dataset/20555/documentation (accessed on 18 August 2025).
- Gulraiz, A.; Liu, C.; Lee, C. Energy advancements and integration strategies in hydrogen and battery storage for renewable energy systems. iScience 2025, 28, 111945. [Google Scholar] [CrossRef] [PubMed]
- Kadhim, M.Q.; Oshchepkov, P.P. Comparative analysis of diesel fuel types on engine performance and emissions. Int. J. Low-Carbon Technol. 2024, 19, 2702–2708. [Google Scholar] [CrossRef]
- Korea Environmental Industry & Technology Institute. Life Cycle Inventory Dataset: Anthracite Coal; Production Mix, at Plant. Global LCA Data Access Network (GLAD). Available online: http://133.186.241.65/datasetdetail/process.xhtml?uuid=436d6928-9fe0-4846-9c99-03d3add503eb&version=00.00.001 (accessed on 18 August 2025).
- Korea Environmental Industry & Technology Institute. Life Cycle Inventory Dataset: Diesel, Mineral Oil; Production Mix, at Plant. Global LCA Data Access Network (GLAD). Available online: http://133.186.241.65/datasetdetail/process.xhtml?uuid=01e8bb45-c8eb-47ed-ba09-f1645372c6ab&version=00.00.001 (accessed on 18 August 2025).
- Korea Environmental Industry & Technology Institute. Life Cycle Inventory Dataset: Gasoline; Production Mix, at Plant. Global LCA Data Access Network (GLAD). Available online: http://133.186.241.65/datasetdetail/process.xhtml?uuid=c6a62851-83b8-41c5-8e5d-aba03b2b3332&version=00.00.001 (accessed on 18 August 2025).
- Korea Environmental Industry & Technology Institute. Life Cycle Inventory Dataset: Kerosene; Production Mix, at Plant. Global LCA Data Access Network (GLAD). Available online: http://133.186.241.65/datasetdetail/process.xhtml?uuid=596644e9-702f-44f7-b0e8-6d2751c07e3c&version=00.00.001 (accessed on 18 August 2025).
- Korea Environmental Industry & Technology Institute. Life Cycle Inventory Dataset: Liquefied Natural Gas, Natural Gas; Production Mix, at Plant. Global LCA Data Access Network (GLAD). Available online: http://133.186.241.65/datasetdetail/process.xhtml?uuid=68cd0f83-d623-4125-80b6-ec2e140f5d3f&version=00.00.001 (accessed on 18 August 2025).
- Hydrogen Council. Policy Toolbox for Low Carbon and Renewable Hydrogen. 2021. Available online: https://hydrogencouncil.com/wp-content/uploads/2021/11/Hydrogen-Council_Policy-Toolbox.pdf (accessed on 25 October 2025).
- Odenweller, A.; Ueckerdt, F. The green hydrogen ambition and implementation gap. Nat. Energy 2025, 10, 110–123. [Google Scholar] [CrossRef]
- Oh, H.; Kim, J.; Park, S.; Lee, M.; Jeong, H. Economic analysis of grey and blue hydrogen for carbon and tax credits. J. Korean Soc. Miner. Energy Resour. Eng. 2023, 60, 78–87. [Google Scholar] [CrossRef]
- IRENA, International Renewable Energy Agency. Green Hydrogen: A Guide to Policy Making. 2020. Available online: https://www.irena.org/-/media/Files/IRENA/Agency/Publication/2020/Nov/IRENA_Green_hydrogen_policy_2020.pdf (accessed on 25 October 2025).
Disclaimer/Publisher’s Note: The statements, opinions and data contained in all publications are solely those of the individual author(s) and contributor(s) and not of MDPI and/or the editor(s). MDPI and/or the editor(s) disclaim responsibility for any injury to people or property resulting from any ideas, methods, instructions or products referred to in the content. |
© 2025 by the authors. Licensee MDPI, Basel, Switzerland. This article is an open access article distributed under the terms and conditions of the Creative Commons Attribution (CC BY) license (https://creativecommons.org/licenses/by/4.0/).