Abstract
This paper pioneers an integrated assessment of human capital (education and skills), managerial capacity, financial development, and gender equality as drivers of the energy transition (ET). Leveraging quarterly observations from 2000Q1 to 2023Q4, we deploy a novel time-varying frequency quantile regression approach to uncover time-varying, frequency-specific, and distribution-sensitive effects. We find that economic growth increasingly hinders ET after ~2010, whereas education and skills, together with managerial capacity, bolster ET across horizons; gender equality remains a positive contributor, peaking at the median quantile and when ET is high. Financial development generally supports ET, though short- to medium-run impacts turn negative around 2010–2016 and taper when complementary capacities are scarce. Trade openness is predominantly negative. Quantile Granger causality indicates regime-dependent leadership, with trade dominating the lower tail, finance underpinning the median, and human capital leading the upper tail—insights that guide the sequencing of skills, governance, and finance reforms. Based on these findings policies, are suggested.
1. Introduction
Brazil has set an ambitious goal to achieve climate neutrality by mid-century, positioning itself as a leader in regional climate action. This target is articulated in Brazil’s nationally determined contribution (NDC) under the Paris Agreement, which outlines strategies to mitigate greenhouse gas emissions across energy, industry, transport, and land-use sectors [1]. Progress toward these goals is monitored and reported regularly, with recent assessments underscoring the need for sustained action on deforestation control and low-carbon industrialization to remain on track. In terms of clean-energy deployment, Brazil has demonstrated significant progress: a rapidly expanding wind and solar base complements long-standing biofuel leadership and ongoing grid modernization [2]. However, challenges remain, particularly emissions linked to land-use change and regional disparities in human capital and managerial quality that affect project execution and system integration. Addressing these issues is crucial for Brazil to meet its long-term decarbonization objectives.
One of the key socio-economic drivers of the energy transition (ET) is education and skills (ES). On the positive side, ES—especially in STEM, vocational training, and digital operations—builds absorptive capacity for renewables, storage, smart-grid technologies, and efficiency solutions, enabling firms, utilities, and municipalities to design, integrate, and maintain low-carbon systems [3,4]. Conversely, skills gaps and uneven training ecosystems can slow adoption, raise integration costs, and widen regional ET disparities [5]. Managerial capacity (MC) likewise plays a substantial role, with strong governance, project selection, and performance monitoring accelerating ET through better incentive alignment and coordination across public–private stakeholders; weak MC, short-termism, or fragmented oversight can delay projects and lock in carbon-intensive assets [6].
Gender gaps (GEN) influence ET through inclusion and governance channels: narrowing GG in education, labor participation, finance access, and leadership broadens the technical talent pool, improves board oversight, and boosts household uptake of clean technologies; persistent gaps can dampen innovation, reduce accountability, and constrain demand-side transitions [7,8]. Finally, financial development (FD) shapes ET by mobilizing capital toward long-duration, intangible-rich green investments via instruments such as project finance, green bonds, and sustainability-linked loans; shallow markets, high risk premia, or weak disclosure standards can steer funds toward high-carbon incumbents and raise the cost of capital for clean projects [9,10]. Thus, the relationship between ES, MC, GG, and FD and Brazil’s ET depends on how capability building, governance quality, inclusion, and financial architecture are structured and directed toward long-term sustainability goals.
Building on the foregoing, this study examines the relationships between the energy transition (ET) and four key drivers—ES, MC, FD, and GEN—across high-, mid-, and low-frequency bands and at quantiles τ = 0.05, 0.50, and 0.95. The work aligns with SDGs 7, 9, 5, and 13, and delivers policy-relevant insights to accelerate ET while safeguarding inclusion and sustainable growth. Guided by these objectives, we ask the following questions:
- (a)
- To what extent do improvements in ES influence ET across various quantiles and periods?
- (b)
- How does MC shape the dynamics of ET across various quantiles and periods?
- (c)
- Does FD impact ET across various quantiles and periods?
- (d)
- What is the effect of GEN on ET across various quantiles and periods?
Key Contributions and Originality of Study
This study advances the evidence base on the ET by jointly examining how ES, MC, GEN, and FD shape low-carbon outcomes. While prior work often treats human capital, governance, inclusion, and finance in isolation, we articulate and test an integrated framework in which ES expands absorptive capacity for clean technologies, MC converts that potential into execution, FD relaxes financing frictions for long-horizon green projects, and narrower GG amplifies each channel through broader talent pools, improved oversight, and demand-side adoption. By using harmonized secondary data and mapping these drivers to multiple ET dimensions (efficiency upgrades, electrification, renewables uptake, and process innovation), this study provides a system-level view of how capability, leadership quality, inclusion, and finance co-evolve to accelerate ET and support SDG targets (notably SDG-7, SDG-9, SDG-5, and SDG-13). The contribution is twofold: conceptually, we posit explicit interaction and moderation effects among ES, MC, GEN, and FD; empirically, we quantify their direct and combined influences on ET across time and distributional states.
- (a)
- Pertaining to theoretical contribution, we bridge human capital and dynamic capabilities perspectives by showing that ES (workforce skills, STEM readiness, and lifelong learning) enhances firms’ ability to search for, absorb, and adapt clean technologies, while MC (strategic discipline, monitoring, and reconfiguration capacity) aligns incentives and resources to implement them. FD (depth, access, and green instruments) lowers the cost of capital for uncertain, intangible-rich ET projects. GG (in education, labor participation, leadership, and finance access) moderates all three channels: smaller gaps increase knowledge diversity, strengthen governance quality, and shift preferences toward reliability and environmental stewardship—thereby amplifying ES- and MC-led transitions and improving the allocation efficacy of FD. This integrated lens moves beyond single-factor narratives and predicts complementary, nonlinear, and state-contingent effects on ET.
- (b)
- Regarding policy contribution, we derive frequency- and quantile-aware levers: (i) scale ES via vocational/tertiary green-skills pipelines and rapid re-skilling where short-run (high-frequency) frictions bind—especially at τ = 0.05; (ii) strengthen MC through governance reforms and performance-linked incentives that sustain medium- to long-run implementation, most salient near τ = 0.50–0.95; (iii) deepen FD (green bonds, sustainability-linked loans, concessional facilities, risk sharing) to unlock long-horizon projects whose effects materialize at lower frequencies and higher quantiles; and (iv) close GG by expanding women’s access to STEM, credit, and leadership—an inclusion lever that improves oversight and household adoption across the distribution but is especially powerful in low-ET regimes (τ = 0.05) where diffusion barriers are steepest. Taken together, these instruments reduce financing frictions, raise project quality, and accelerate diffusion—when and where they matter most.
- (c)
- Lastly, this study makes a methodological contribution by implementing a time-varying, frequency-resolved, quantile-specific strategy: (a) wavelet coherence traces co-movements between ET and each driver across short/medium/long bands; (b) partial wavelet coherence isolates each driver’s net linkage with ET while controlling for the others; (c) multiple wavelet coherence evaluates the joint influence of ES, MC, FD, and GG. Complementarily, quantile regression at τ = 0.05, 0.50, 0.95 maps distributional heterogeneity, while interaction terms capture GG moderation and ES–MC complementarities. This design yields granular, policy-relevant evidence on how impacts evolve over time, which frequency bands dominate, and how effects differ at the 5th, 50th, and 95th percentiles of the ET distribution.
2. Theoretical Framework and Literature Review
2.1. Theoretical Framework
Education and skills (ES) and managerial capacity (MC) shape energy transition (ET) through complementary capability-building mechanisms. From a human capital lens, ES upgrades workers’ technical proficiency and problem-solving, raising firms’ absorptive capacity to identify, acquire, and implement low-carbon technologies [11]. At the organizational level, MC—anchored in the resource-based view and dynamic capabilities theory—coordinates these competencies into coherent decarbonization strategies via sensing transition opportunities, seizing green investment options, and reconfiguring legacy assets [12]. Managers with strong monitoring and control systems can overcome agency frictions that otherwise delay clean-technology adoption, align incentives with long-horizon climate targets, and scale complementary organizational routines [13]. ES and MC thus interact: educated workforces expand the opportunity set for decarbonization, while capable managers translate that potential into measurable ET outcomes—efficiency upgrades, fuel switching, electrification, and circular process redesign [13].
Financial development (FD) conditions these effects by easing collateral and information constraints that typically hinder intangible, high-uncertainty green projects [14]. Deep, well-regulated financial systems mobilize savings into long-duration, risky clean assets; price climate risk; and diffuse innovative instruments such as green bonds and sustainability-linked loans that lower the cost of capital for ET [14]. Gender gaps (GG) in education, labor markets, and corporate leadership modulate all three channels. Narrower GG increases human capital breadth, diversifies knowledge stocks, and improves board oversight of environmental strategy, which is associated with stronger environmental disclosure and performance [15,16]. At the household and community levels, reducing GG in access to finance and skills accelerates clean-energy adoption and demand-side transitions by shifting preferences toward health, reliability, and long-run resource stewardship [3].
2.2. Literature Review
The evidence on managerial control (MC) and the energy transition (ET) is strikingly consistent across diverse institutional settings and methods. Reference [17] for the UK, [18] for the USA, [19] for Chinese listed firms, [20] across seven European countries, [21] for China, and [22] for Brazil all converge on the finding that stronger MC increases ET. Despite methodological heterogeneity—panel regressions, structural equation modeling, and mixed interviews-plus-data approaches—the common mechanism is plausible: tighter governance sharpens target-setting, capital budgeting discipline, and accountability for decarbonization milestones. Where managers face clear oversight and performance incentives, they appear more willing to reallocate toward renewables, electrification, and efficiency. The multi-country alignment also hints that MC’s effect is not culture-bound; it likely operates through universal organizational levers such as risk management, disclosure, and internal carbon metrics.
Education and skills (ES) mostly emerge as accelerators, but not unambiguously so. Reference [23] for India, [24] in a multi-country panel, [25] for the UK/Europe, and [26] for Australia and broader OECD contexts all report ES increasing ET—consistent with human capital channels that raise absorption capacity for clean technologies, improve operations and maintenance of renewables, and expand the pipeline of green entrepreneurs. However, [27], using panel causality for 27 EU states (1990–2020), find ES decreasing ET, a notable outlier. This result may reflect transitional dynamics (e.g., skill upgrading initially feeding higher energy use and legacy sector productivity), measurement choices (general vs. green-specific skills), or timing (education effects can be long-gestation while ET indicators may respond contemporaneously). Taken together, the weight of evidence favors ES as a catalyst, but it also cautions that skills must be aligned to green occupations and complemented by policy signals to avoid reinforcing high-energy incumbency.
Concerning gender, the literature is both directionally unified and conceptually rich. References [16,28,29,30] (in two separate samples) all find that narrowing gender gaps or greater female participation increases ET across cross-country and dynamic panel frameworks. Mechanisms likely include preference channels (greater environmental concern), governance diversity improving board oversight and risk perception, and labor-market effects where women’s participation reallocates human capital toward services and knowledge-intensive sectors that are less carbon-intensive. Importantly, these studies span the late-1990s to late-2010s with global and African samples, suggesting robustness across development levels. The policy implication is that gender-inclusive institutions are not only socially desirable but also functionally instrumental for accelerating ET.
Financial development (FD) similarly shows a robust, positive association with ET. Reference [10] uses NARDL for seven emerging economies to show asymmetric responses; W. [31] employs panel cointegration with FMOLS/DOLS and Dumitrescu–Hurlin causality on a global panel; [32] applies ARDL with bounds tests for Ghana; and [33] analyzes 26 OECD plus 18 non-OECD countries with dynamic panel models. Across these designs, deeper and more efficient financial systems appear to lower the cost of capital for renewables, expand green-bond markets, and improve risk sharing for innovation, thereby increasing ET. Table 1 presents summary of past studies.

Table 1.
Summary of past studies.
2.3. Gap in Literature
This study addresses a clear gap at the intersection of governance, human capital, and the energy transition. Prior work typically examines managerial control (MC) or education and skills (ES) in isolation, relies heavily on primary survey/case evidence, and estimates average (mean) effects with static models—thereby obscuring how the MC–ET and ES–ET relationships evolve over time, differ across short-, medium- and long-run horizons, and vary across the distribution of ET outcomes (e.g., low- vs. high-transition regimes). To our knowledge, this is the first study to use secondary data to jointly investigate the impacts of MC and ES on energy transition and to reveal their heterogeneous, time-varying connections via a time-varying frequency quantile regression framework. By integrating both frequency (time-horizon) and quantile (distributional) heterogeneity, the approach uncovers dynamics that conventional mean-based panel or time-invariant methods miss—such as whether MC is most catalytic during acceleration phases or whether ES matters disproportionately in lower quantiles where transition is sluggish. This dual innovation—secondary-data triangulation and a time-varying frequency quantile design—delivers sharper, policy-relevant evidence on when, for whom, and through which horizons MC and ES most effectively accelerate the energy transition.
3. Data and Methods
3.1. Data
This study examines how education and skills (ES) and managerial capacity (MC) drive the energy transition (ET) and also evaluates the roles of trade openness (TRA), financial development (FD), economic growth (EG), and the gender gap (GEN). ES, MC, and ET are 0–100 indices compiled from the World Development Indicators (WDI, 2025). ET is constructed via PCA using renewable energy consumption (% of total final energy use), renewable electricity output (% of total electricity), access to electricity (% of population), fossil fuel energy consumption (% of total), CO2 emissions (metric tons per capita), and energy use (kg of oil equivalent per capita). MC is constructed via PCA using government effectiveness (estimate), regulatory quality (estimate), rule of law (estimate), and control of corruption (estimate). ES is constructed via PCA using school enrollment, secondary (% gross), school enrollment, tertiary (% gross), adult literacy rate (% ages 15+), expenditure on education (% of GDP), and individuals using the Internet (% of population). FD is proxied by private credit by deposit money banks to GDP (%), TRA is total trade as a share of GDP, GEN is constructed via PCA from female and male labor-force participation rates (ages 15+), and EG is GDP per capita in constant 2015 US dollars. The sample spans 2000Q1–2023Q4. Table 2 presents the data information.
Table 2.
Data source and measurement.
3.2. Empirical Methods
Let be the series at time . With a sliding window of size , the recursive estimate is
Quantile regression [34] models conditional quantiles of given :
Time-varying frequency quantile regression (TVFQR) estimates, within each recursive window as follows:
for . We use a 20-quarter window with a 4-quarter slide to balance stability and adaptability. TVFQR captures evolving dynamics, heterogeneity across quantiles, and frequency-specific effects in a compact, robust framework.
Lastly, the study employs quantile causality tests to identify causal linkages among the variables.
4. Findings and Discussion
4.1. Pre-Estimation Results
Table 3 shows relatively tight ranges for EG (8.825–9.149), ES (3.840–4.491), and especially ET (4.420–4.609), with ET also exhibiting the smallest dispersion (Stdev = 0.042) and FD the largest (0.352). Means and medians are close, but slight mean < median patterns for EG, ES, ET, FD, and MC confirm the negative skewness reported (−0.668, −0.368, −0.932, −0.544, −0.167), while GEN (0.520) and TRA (0.879) are right-skewed. Kurtosis indicates mostly platykurtic shapes (EG, ES, FD, MC < 3), whereas ET (3.864) and TRA (3.439) are mildly leptokurtic and GEN (3.176) is near-normal. Jarque–Bera statistics reject normality at 1% for EG, ES, ET, FD, and TRA; at 5% for MC; and at 10% for GEN, implying non-Gaussian distributions across the board. Practically, these features—low variance for ET, higher variability for FD, and asymmetric and (often) fat-tailed distributions—support using robust/quantile methods and heteroskedasticity-aware inference rather than relying on strict normality assumptions. Figure 1 shows the correlation between ET and its regressors. ET is weakly and uniformly negatively correlated with ES (−0.23), EG (−0.38), and FD (−0.33), and only marginally related to GEN (−0.12), MC (−0.03), and TRA (0.02).
Table 3.
Descriptive statistics.
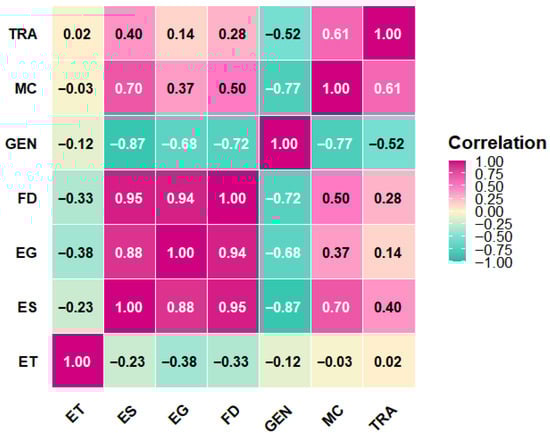
Figure 1.
Correlation estimate.
Table 4 reveals pervasive departures from linearity and independence. In Part A, Terasvirta and White nonlinearity tests are highly significant (p < 0.01) for every series, indicating a neglected nonlinear structure; BDS likewise rejects i.i.d. for all variables, reinforcing the presence of dependence beyond linear AR dynamics. Keenan’s test—which targets specific quadratic-type nonlinearity—is significant only for EG and ES (at 5%), but not for ET, FD, GEN, MC, or TRA, implying that their nonlinearity may be forms Keenan is less sensitive to (e.g., thresholds, asymmetries, regime switches). The Mann–Kendall trend test is significant for ES, EG, FD, GEN, MC, and TRA, pointing to monotonic trends, while ET alone shows no clear monotonic trend (p = 0.114), consistent with a comparatively stable central tendency but still nonlinear per Terasvirta/White/BDS. Part B documents strong non-normality. Shapiro–Wilk rejects normality for all series at 1%, and Robust Jarque–Bera is significant for most variables (often at 5% or 10%), with the component tests showing significant skewness for EG, ET, FD, GEN, and TRA, and excess kurtosis for ES, FD, and MC (leptokurtic), while ET shows borderline kurtosis (10%). The SJ symmetry test flags asymmetry for ET, GEN, and TRA (p < 5%), but not for ES, EG, FD, or MC—suggesting that distributional asymmetry is concentrated in a subset of variables. Part C shows universal heteroskedasticity: both White and ARCH-LM reject homoskedastic errors at 1% for every series. Collectively, these diagnostics justify modeling choices that are robust to nonlinearity, asymmetry, and time-varying volatility—e.g., quantile and frequency quantile methods, heteroskedasticity–robust inference, and, where appropriate, GARCH-type volatility or regime-switching structures—rather than relying on linear Gaussian assumptions.
Table 4.
Diagnostic estimates.
4.2. Stationarity Test Results
Next, we check the stationarity attributes of Quantile ADF and PP tests (see Figure 2a,b), which improve on their conventional counterparts by allowing the persistence of a series to vary across the conditional distribution—capturing tail-specific dynamics, heteroskedasticity, and asymmetric adjustments that standard (mean-based) tests can miss. In Figure 2a, this distribution-aware view shows a clear I(1) pattern overall: at levels (blue), test statistics for EG, ES, FD, GEN, MC, and TRA lie above (i.e., are less negative than) the 5%/1% critical lines for most τ, so the unit root cannot be rejected across much of the distribution; ET is likewise non-stationary at levels, though a few mid-quantiles come closer to the threshold. After first differencing (red), statistics plunge well below the critical lines across nearly all τ for every variable, indicating stationarity of the differences. The quantile lens also reveals heterogeneity, e.g., GEN and MC display slightly stronger mean-quantile stationarity signals than in the tails, while TRA and ET show marginal behavior near the upper quantiles. Overall, the results support treating the variables as I(1) but highlight that persistence is not uniform—tails can be more (or less) persistent than the center—justifying quantile-sensitive cointegration and causality tools.
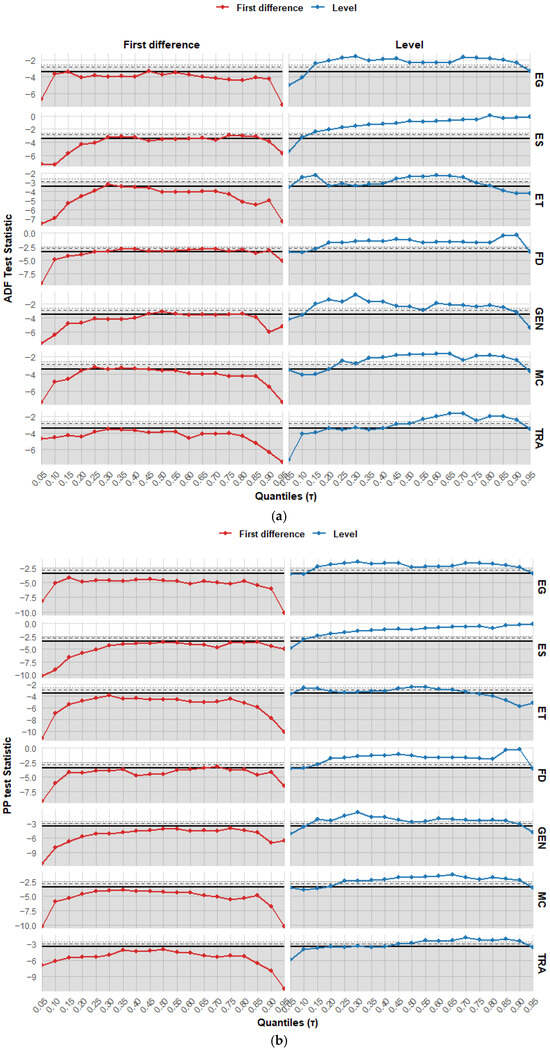
Figure 2.
(a) Quantile ADF estimates. (b) Quantile PP estimates.
4.3. Quantile Cointegration Result
Next, we used the quantile cointegration. Figure 3 shows quantile cointegration between ET and each driver that strengthens in the upper tail and is weak or absent near the center. Using the bounds, at the 10% level, the I(0) critical value is 4.04 and the I(1) critical value is 4.78, at the 5% level, the values are 4.94 and 5.73, and at the 1% level, they are 6.84 and 7.84. For τ around 0.70 to 0.95, the F-statistics for all pairs with ET rise well above even the 1% I(1) bound, with peaks near 16 for ET–FD, about 17 for ET–GEN, roughly 13 for ET–ES and ET–MC, near 14 for ET–TRA, and around 11 for ET–EG, which signals strong long-run linkage when ET is high. For τ below roughly 0.25, the evidence is mixed, with several pairs intermittently clearing the 5% or 10% bounds, which suggests episodic cointegration when ET is unusually low. For τ in the middle range, roughly 0.35 to 0.60, most F-statistics remain below even the 10% I(0) bound, which implies no cointegration around the median. Overall the pattern indicates state-dependent adjustment in which the equilibrium relationship binds most tightly when the energy transition index is in a high regime and only occasionally when it is depressed, while normal conditions display loose or no long-run coupling.
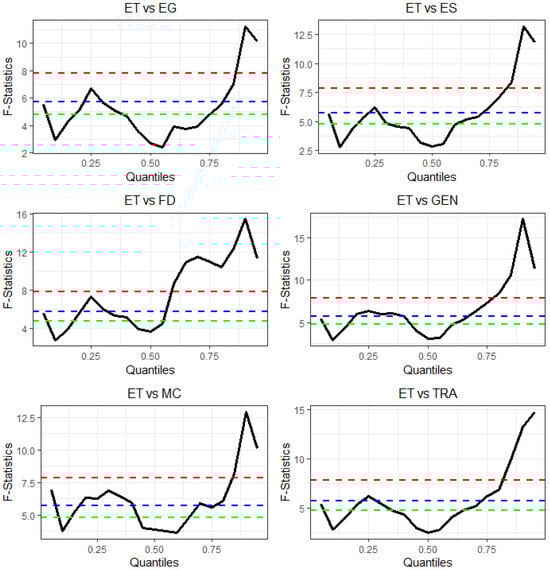
Figure 3.
QPSS bounds test. Green, blue and red denotes 1%, 5% and 10% respectively.
4.4. Time-Varying Frequency Quantile Regression Result
This study applies TVFQR to examine the drivers of Brazil’s energy transition. Figure 4, Figure 5, Figure 6, Figure 7, Figure 8 and Figure 9 report the corresponding results. Figure 4 shows the impact of economic growth (EG) on energy transition (ET). At τ = 0.05, we observed that when the ET is in its lower tail, growth initially aligns with modest improvements in ET at low and mid frequencies in the mid-2000s, then turns predominantly negative across all bands after about 2010. The shift to green shading means that additional growth tends to hinder ET when the transition is weak, both in short-run adjustments and in slower, persistent components. This pattern fits Brazil’s post-2010 development path in which renewable deployment accelerated through wind and solar auctions and the power mix became progressively less tied to the growth cycle, so marginal expansions in output increasingly reflected energy- and carbon-intensive segments of industry and transport rather than additional clean capacity. Documented surges in wind and solar that helped offset drought-related hydro shortfalls support this interpretation, as do power-sector emissions intensity declines after 2016. These structural changes loosened the direct pro-ET effect of growth and made rebound pressures more visible at the lower tail [36,37].
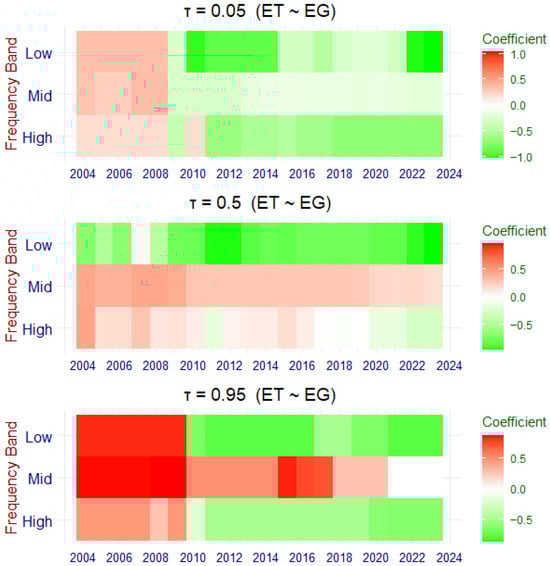
Figure 4.
Impact of EG on ET.
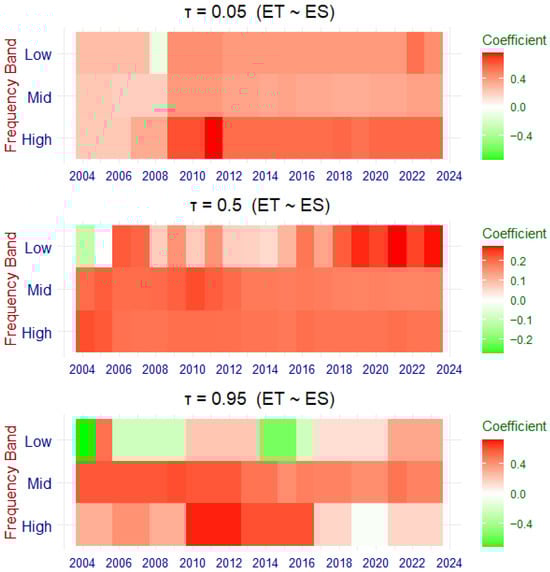
Figure 5.
Impact of ES on ET.
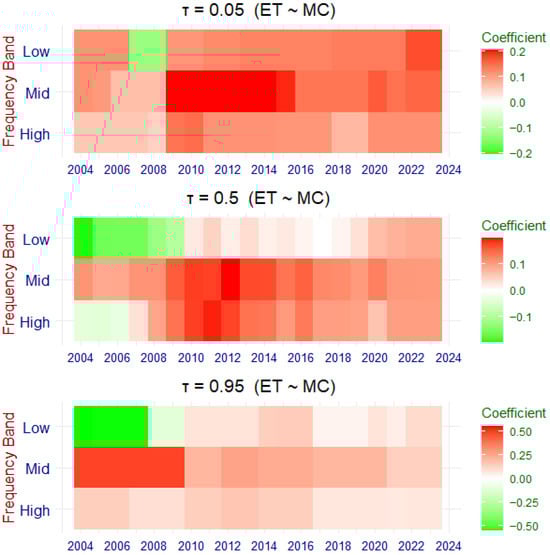
Figure 6.
Impact of MC on ET.
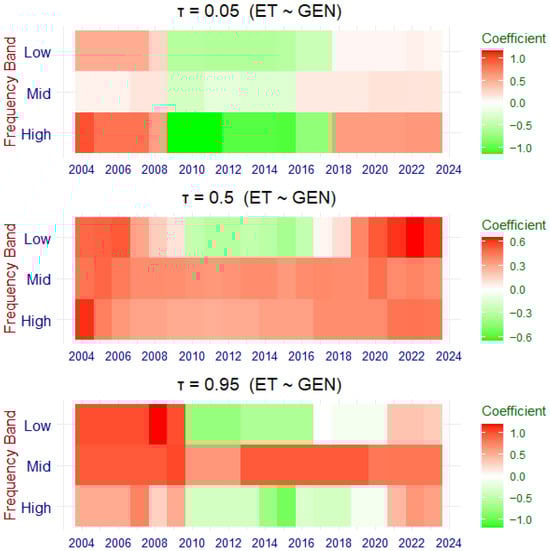
Figure 7.
Impact of GEN on ET.
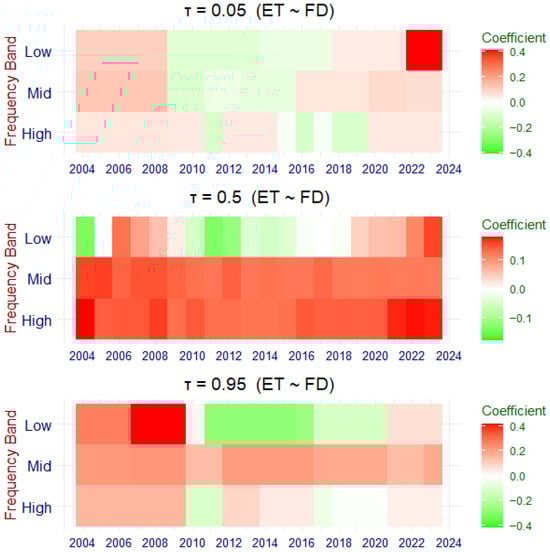
Figure 8.
Impact of FD on ET.
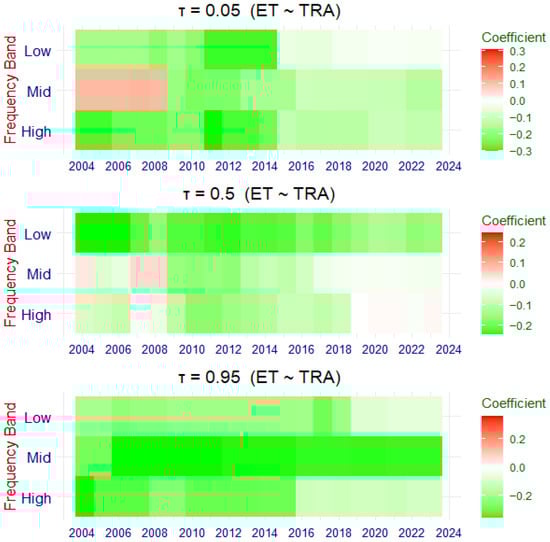
Figure 9.
Impact of TRA on ET.
As we proceed to τ = 0.50 and especially τ = 0.95, the same state dependence is stronger. Around the median, most bands are light to dark green from 2010 onward, implying that in normal conditions, growth generally slows ET in both short- and long-run components. In the upper tail, early years are bright red in the low- and mid-frequency bands, which suggests that during the commodity-boom era, growth and ET rose together as resources and policy support financed grid expansion, biofuels, and renewables. After 2010, the coefficients switch to green and remain negative, consistent with a maturing transition in which wind, solar, and biofuels expand through policy and markets irrespective of cyclical growth, while marginal growth pressures the transport and industrial base [38]. Brazil’s long-standing ethanol program and recent moves on biodiesel and green hydrogen illustrate how the transition increasingly rests on dedicated policy rather than growth itself, and past Brazil-specific studies also report growth–renewable links that vary with technology and policy regimes [39].
Figure 5 shows how education and skills (ES) impact ET. We observed that at τ = 0.05, when Brazil’s energy transition (ET) index sits in its lower tail, the panels are mostly light-red in the mid- and high-frequency bands and only briefly green at the low-frequency edge in the mid-2000s. This means incremental gains in ES already help ET through short- and medium-run channels—think site development, O&M, grid integration, and project management—while the long-cycle effect is initially weak or even slightly negative, consistent with the lag between schooling/training reforms and their payoff in capital-stock turnover. As the sample moves past 2010, red tones persist across bands, indicating that ES increasingly supports ET even when the transition is weak, in line with evidence that renewable deployment in Brazil created sizable skill demand and local employment in wind and solar value chains and that targeted training programs reduce early frictions [40]. These institutional and market channels are also consistent with broader findings that human capital raises clean-energy capability and accelerates the shift toward renewable systems [40].
Furthermore, at τ = 0.50 and τ = 0.95, the story strengthens further. The median panel is red across all bands and deepens after 2015, showing that in “normal” conditions, ES systematically lifts both short-run and persistent components of ET. The upper tail panel shows intense red in mid- and high-frequency bands around 2010–2016, consistent with Brazil’s surge in wind/solar auctions and biofuel mandates, where specialized technicians, engineers, and project managers were pivotal for rapid deployment [41]. Occasional green patches at the low-frequency edge early on likely reflect the multi-year lag between education policy and structural ET outcomes; these fade as a trained workforce scales. External evidence matches this pattern—Brazil’s renewables expansion has been accompanied by strong job creation and an evolving skills base, while some studies such as [42] document that human capital and TVET underpin clean-energy diffusion, reduce energy intensity, and improve environmental performance across emerging economies, including BRICS. Together, the heatmaps imply that education and skills function as an “enabler” of ET in Brazil, with the largest effects appearing when the transition is already advanced and moving quickly [39].
Figure 6 discloses the effect of managerial capacity (MC) on energy transition (ET). The result showed that at τ = 0.05, the panels indicate that when Brazil’s energy transition (ET) is in its lower tail, managerial capacity (MC) already helps ET across bands, with especially strong mid-frequency effects around 2010–2014 and persistent low-frequency gains thereafter (widespread red). This pattern is consistent with the period when Brazil’s auction-led buildout of wind and later solar moved from contracting to execution, making project planning, supply chain coordination, and risk management decisive for on-time delivery and grid integration. Early auction rounds experienced significant implementation delays, pointing exactly to the value of stronger managerial and institutional capabilities in developers and system operators [22]. As these capabilities deepened, ET benefited not just in short-run adjustments (high-frequency) but also in the structural component captured by the low-frequency band. The mechanism aligns with firm-level evidence that better management practices and human-resource systems raise operational performance and facilitate the adoption of greener technologies [43] and with Brazil-focused work linking dynamic capabilities to sustainable innovation outcomes.
Moving to τ = 0.50 and τ = 0.95, the positive MC impact on ET association remains, but its texture varies by frequency. Around the median, red tones dominate all bands and peak in the mid-frequency window circa 2011–2014, reflecting managerial routines that convert policy signals and learning-by-doing into scalable deployment—standardization of EPC processes, improved procurement, and tighter project controls—thereby accelerating ET’s cyclical and medium-horizon components. In the upper tail, the early 2010s show strong mid-frequency gains that taper as the market matures, consistent with evidence that auctions deliver larger renewable additions where the business environment and organizational capabilities are stronger [44]. This implies that managerial capacity as an execution enabler in Brazil’s transition—most powerful when the buildout is rapid and coordination-intensive—matches broader findings that managerial and dynamic capabilities foster green innovation and help firms absorb and reconfigure resources for cleaner production [38].
Figure 7 examines how the gender gap shapes Brazil’s energy transition (ET). When ET sits in its lower tail (), coefficients appear predominantly light red in the low- and mid-frequency bands, alongside a transient high-frequency green zone around 2010–2016. Interpreting higher GEN values as greater gender equality, this configuration indicates that equality improvements generally foster ET through slower-moving, structural channels, while some short-run dynamics in the early 2010s briefly moved in the opposite direction—likely reflecting transitional costs as organizations revised hiring pipelines, expanded training programs, and adjusted project execution. Given Brazil’s male-dominated energy sector and barriers to women’s advancement, positive effects strengthen as reforms take hold; closing gender gaps expands the talent pool and improves organizational performance [29]. At the median (), positive effects dominate across all frequencies and deepen after roughly 2015, signaling a durable complementarity between gender equality and ET under typical conditions. Greater female representation in engineering, management, and policy correlates with faster renewable rollout and smoother grid integration, aligning with evidence that equality supports stronger climate targets, stricter enforcement, and lower emission [15]. At the upper tail (τ = 0.95), low- and mid-frequency effects are mostly positive with brief negatives in the early–mid 2010s. When ET is high, equality reinforces long-run progress, and short dips likely reflect macro or hydrological shocks; greater women’s participation suggests further ET gains as equality rises [15,45].
Figure 8 analyzes how FD shapes Brazil’s ET. At (lower tail), the low-frequency effect of FD is mostly positive and becomes strongly positive only in recent years, while the mid- and high-frequency effects turn negative at times around 2010–2016 before reverting to slightly positive. Under stressed ET conditions, short- and medium-run credit cycles at times hampered progress—consistent with post-2008 and 2014–2016 tightening, project delays, and balance-sheet constraints—while the slow, structural channel grew increasingly supportive as green instruments scaled. The later low-frequency strengthening aligns with BNDES’s expanded green facilities and the rise in long-tenor finance and corporate PPAs that de-risk utility-scale renewables and transmission [38,46]. Around the median (τ = 0.50), FD consistently supports ET—positive at mid/high frequencies with only brief early weakness at low frequencies. This aligns with Brazil’s auction-led model, where project finance and development banks lower capital costs and reduce execution risk. At τ = 0.95, mid-frequency effects remain positive but smaller, while low-frequency turns negative for several years in the 2010s before normalizing—signaling diminishing returns when ET is high and grid, permitting, or supply chain bottlenecks bind. Cross-country evidence [9] shows state-dependent FD, and Brazil’s new climate funds plus offshore-wind and reforestation finance suggest de-risking continues to crowd in private investment.
Figure 9 indicates that higher TRA generally exerts a negative influence on Brazil’s ET. When ET is weak (), mid- and high-frequency responses are durably negative after the late-2000s, consistent with short- to medium-run trade surges hindering progress. At the median (), negative effects span all bands, pointing to a broad drag on both cyclical dynamics and more structural components [47]. Even in the upper tail (), the relationship remains negative, especially at mid-frequency, suggesting that added trade integration often accompanies obstacles to further transition gains. Underlying mechanisms stem from Brazil’s export composition and freight system. Commodity specialization increases energy- and emissions-intensive activity and trucking demand, while the technique channel (cleaner technology adoption) materializes more slowly. A heavy reliance on road freight raises fuel use and emissions, and agro-export expansion has been linked to land-use pressures that offset ET progress. Some positive effects appear early on via imported components and know-how for renewables, but industrial policy limited pure import substitution. The policy implication is not inevitability but leverage: prioritizing rail and waterways, electrifying ports and logistics, enforcing zero-deforestation supply chains, and aligning trade/finance instruments with clean-tech diffusion can shift the TO–ET link toward a positive contribution [48].
We assessed sensitivity to the choice of decomposition by substituting EEMD with MODWT. The MODWT results shown in Appendix A (Figure A1, Figure A2, Figure A3, Figure A4, Figure A5 and Figure A6) exhibit the same directional patterns and comparable magnitudes as the EEMD benchmarks, providing strong confirmation of the findings in Figure 4, Figure 5, Figure 6, Figure 7, Figure 8 and Figure 9.
4.5. Quantile Granger Causality
Next, we employed the Quantile Granger causality (QGC). The QGC (see Figure 10) lets predictability vary with the state of the system, so each panel answers who helps forecast whom when variables sit in the lower tail Q0.05, the middle range Q0.25 to Q0.50, or the upper tail Q0.75 to Q0.95 of their distributions. In the lower tail, the network is sparse and dominated by a few links. In the original panel, movements in ET help forecast EG while MC and TRA each help forecast GEN, which suggests that institutional capacity tends to adjust after operational or market shifts. At Q0.05, TRA is the main transmitter, with EG helping forecast TRA and TRA then helping forecast ES. When the system is stressed, openness shocks appear to pass through real activity before showing up in the skills channel, and most other nodes add little extra predictive content.
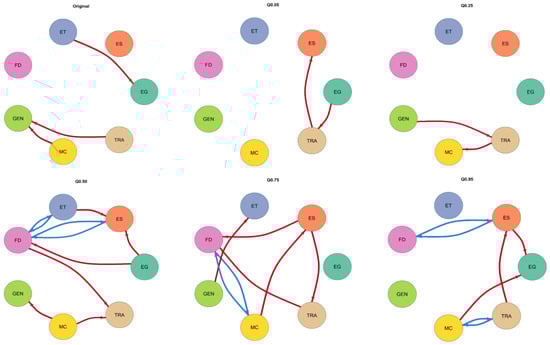
Figure 10.
Quantile Granger causality result.
Around the center, the web of relations thickens and a clear hub emerges. At Q0.25, both GEN and MC help forecast TRA, a pattern that fits governance and managerial routines shaping subsequent trade integration. By Q0.50, financial development becomes the backbone of the system. FD and ET move in a feedback relationship, as do FD and ES, and FD also helps forecast TRA and MC. ES helps forecast EG as well. Taken together, finance and human capital co-evolve with the transition in normal conditions, where deeper finance predicts later gains in the transition and skills, and rising transition or skills also anticipate deeper finance. Spillovers from finance and management to trade point to a finance–capability–openness cycle operating near the median state.
In the upper tail, the structure reorganizes again. At Q0.75, finance still maintains feedback with ET and ES, yet ES becomes the dominant transmitter by helping forecast ET, TRA, and MC. This is consistent with a skill-led phase in which education and training drive rapid deployment and market activity. By Q0.95, the map simplifies to a few strong corridors. ES continues to transmit to EG and TRA, FD keeps two-way ties with ET and ES that provide stabilizing reinforcement, and MC with TRA shows local feedback that reflects close coordination between execution capacity and market openness. Overall the narrative is state-dependent. When ET is weak, trade carries shocks. Near the middle, finance provides the backbone and co-moves with ET and ES. When ET is high, human capital is the main engine while finance and trade sustain and fine-tune momentum.
5. Conclusions and Policy Guidelines
5.1. Conclusions
In this study, we pioneer an investigation into how education, skills, and managerial capacity drive the energy transition, while also examining the roles of trade openness, financial development, and economic growth. Using quarterly data from 2000Q1 to 2023Q4, we apply a suite of wavelet- and quantile-based techniques to address the series’ nonlinearity and non-normality. The results reveal that, after about 2010, economic growth increasingly hinders the energy transition (ET), whereas education and skills—together with managerial capacity—generally support it, and gender equality remains positive with the strongest effects at the median and when ET is high. Financial development is structurally supportive, although short- and medium-horizon effects turned negative around 2010–2016 and diminishing returns emerge when non-financial bottlenecks bind; trade openness is generally negative. Quantile Granger causality indicates shifting hubs, with trade transmitting shocks in the lower tail, finance serving as the backbone near the median, and human capital leading in the upper tail while finance reinforces.
5.2. Policy Implications
Our findings encourage expanding technical and vocational education (TVET) programs tied to renewables EPC, O&M, grid integration, storage, and hydrogen; co-designing curricula with OEMs and developers; and funding paid apprenticeships and rapid “skills bootcamps” in priority regions. To unlock the strongest observed effects, embed gender equality into every skills instrument: recruitment targets for women in TVET cohorts, childcare and safe-transport supports, anti-harassment enforcement, and diversity-weighted scoring in public tenders. Use outcome-based funding—providers earn bonuses for female placement rates in engineering, management, and system-operations roles. Require projects receiving federal support to publish workforce gender metrics and progression plans.
Institutionalize the managerial capacity (MC) gains seen during the 2010–2014 auction execution phase. Create a national PMO toolkit for renewables and transmission with standardized EPC contracts, risk registers, and stage-gate checklists; require readiness scores at auction qualification. Scale “grid-ready zones” with pre-permitted corridors, shared interconnection works, and digital one-stop shops that cut lead times and variance. Mandate ISO-aligned asset management practices for TSO/DSOs and incentivize advanced forecasting, flexibility markets, and storage procurement to reduce curtailment. Tie federal support to on-time energization and availability KPIs, rewarding developers and operators that consistently meet delivery schedules.
Keep financial development (FD) structurally supportive while avoiding the short/medium-run dips observed around 2010–2016. Expand BNDES green windows with longer tenors and revenue-stability features (indexed PPAs, contracts for difference); stand up FX-hedging and offtaker-credit facilities to deepen corporate PPA markets. Issue “Grid and Storage Bonds” for transmission, system services, and utility-scale storage, and allow securitization of operational renewable portfolios to recycle capital. Link concessional terms to bottleneck relief—faster permits, interconnection upgrades, local O&M capacity—and publish a public pipeline so private capital can co-invest. When ET is already high and returns diminish, pivot finance toward integration assets (transmission, storage, demand response) and resilient supply chains rather than additional generation alone.
Since trade openness currently drags on ET, target the scale and composition channels. Accelerate a modal shift to rail and waterways for freight, electrify ports, and yard equipment, and set clear milestones for zero-emission trucking corridors fueled by advanced biofuels and electrification. Enforce zero-deforestation supply chains in agro-exports and align export finance with verified sustainability criteria. Use tariff and credit incentives to speed clean-tech imports where domestic capacity is scarce, while nurturing local manufacturing for components with comparative advantage. Track logistics emissions intensity, deforestation-free export shares, and clean-tech import lead times; success is reflected when these metrics improve and the trade–ET relationship turns neutral and then positive.
5.3. Managerial Implications
Managers can translate these findings into concrete execution gains by investing in people and processes that raise delivery certainty. Prioritize targeted training for EPC, O and M, grid integration, storage, and data engineering; pair this with hiring and promotion practices that expand women’s participation in technical and leadership roles. Standardize project governance with stage gates, risk registers, and earned-value tracking, and embed supply chain resilience through dual sourcing, long-lead procurement, and inventory buffers for critical components. Treat integration as a product in its own right by funding forecasting, flexibility markets, demand response, and storage so assets reach commercial operation on time and operate with high availability. Align incentives around on-time energization, curtailment reduction, and safety so teams internalize system-level outcomes rather than narrow construction milestones.
Finance and market strategy should focus on de-risking bottlenecks and turning trade exposure into advantage. Match project portfolios to stable revenue structures such as indexed PPAs or contracts for difference, lengthen tenors, and use credit enhancements or insurance to stabilize offtaker risk. Direct capital toward transmission readiness, interconnection works, and grid services where returns are tied to solving constraints that limit growth at high ET states. When importing technology or inputs, compress lead times by partnering with logistics providers that can offer rail or waterway options and by pre-clearing port procedures, while building local capabilities where Brazil has comparative strengths. Track a compact set of KPIs that predict value creation in this context, including interconnection lead time, forecast error, availability, female representation in critical roles, and share of revenue from flexibility and storage services, and use these signals to reallocate resources quickly.
5.4. Theoretical Implications
The findings sharpen theories of the energy transition by showing that drivers operate in a state-dependent and frequency-specific manner rather than through uniform average effects. Growth that once appeared beneficial turns hindering as the system matures, which supports directed technical change perspectives and socio-technical transition theory that emphasize shifting bottlenecks over the diffusion path. Positive effects from education, skills, gender equality, and managerial capacity validate human capital and dynamic capabilities theories, but only when matched to the relevant temporal horizon. Short- and medium-horizons capture execution, coordination, and learning-by-doing, while low-frequency components reflect slower institutional and infrastructure adjustments. This layered evidence encourages models that embed heterogeneous effects across quantiles and time scales, replacing single-equation mean responses with state-aware mechanisms that better predict surge, stall, and consolidation phases of transition.
The results also refine finance–environment–trade frameworks by indicating that financial development is structurally supportive until non-financial constraints bind, at which point returns diminish and integration assets, not additional generation, become the margin that matters. Trade openness often depresses progress when scale and composition effects dominate cleaner technique effects, reinforcing theories that the net impact of openness is conditional on logistics, supply chains, and land-use governance. Methodologically, the joint use of time-varying frequency quantile regression and quantile causality supports a move toward theories that treat policy, markets, and capabilities as co-evolving systems whose influence changes with both system state and adjustment speed. Future theoretical work can formalize these co-evolutionary dynamics by linking capability formation, institutional design, and financial de-risking to frequency-specific transition channels and to tails of the outcome distribution.
5.5. Limitations and Future Directions
This study has several limitations that point to clear avenues for future work. First, the analysis uses quarterly, country-level data for 2000Q1–2023Q4, which may mask sectoral and subnational heterogeneity; future research can exploit plant-, firm-, or state-level panels to uncover localized dynamics. Second, key constructs such as education and skills, managerial capacity, gender equality, financial development, and trade openness rely on proxy measures that may introduce measurement error; alternative indicators, composite indices, and microdata can improve construct validity. Third, identification remains observational and state-dependent, so endogeneity cannot be fully ruled out; designs using instruments, policy discontinuities, or shift-share exposure can strengthen causal claims. Fourth, results depend on modeling choices in the time-varying frequency quantile framework, including the decomposition method, band definitions, and rolling window settings; robustness to alternative filters such as MODWT, different quantile estimators, and Bayesian or machine-learning variants would build confidence. Finally, external validity beyond Brazil is uncertain; comparative studies across commodity-intensive and service-oriented economies, as well as policy counterfactuals that simulate de-risking, integration assets, and gender-inclusive skills programs, can translate these findings into generalizable guidance for accelerating the energy transition.
Author Contributions
M.L.: Conceptualization; data collection and curation; formal analysis; methodology; visualization; original draft writing and overall write-up. L.S.: Supervision; critical review; constructive feedback; validation; project administration; review and editing of the manuscript. X.F.: Funding acquisition; resources; data support; additional review; oversight. All authors have read and agreed to the published version of the manuscript.
Funding
This research received no external funding.
Institutional Review Board Statement
Not applicable.
Informed Consent Statement
Not applicable.
Data Availability Statement
Data will be made available upon request to the corresponding authors.
Conflicts of Interest
The authors declare no conflicts of interest.
Appendix A

Figure A1.
Impact of TRA on ET.

Figure A2.
Impact of ES on ET.

Figure A3.
Impact of FD on ET.

Figure A4.
Impact of GEN on ET.

Figure A5.
Impact of MC on ET.

Figure A6.
Impact of EG on ET.
References
- IEA. International Energy Association Brazil. 2023. Available online: https://www.iea.org/countries/brazil (accessed on 24 October 2023).
- Wu, L.; Liu, S.; Liu, D.; Fang, Z.; Xu, H. Modelling and forecasting CO2 emissions in the BRICS (Brazil, Russia, India, China, and South Africa) countries using a novel multi-variable grey model. Energy 2015, 79, 489–495. [Google Scholar] [CrossRef]
- Acheampong, A.O.; Opoku, E.E.O.; Rustagi, N. Gender quota, women in politics, and gender parity in education. Econ. Polit. 2024, 4, 2024. [Google Scholar] [CrossRef]
- David, M.E. Women and Gender Equality in Higher Education? Educ. Sci. 2015, 5, 10. [Google Scholar] [CrossRef]
- Bruns, B.; Macdonald, I.H.; Schneider, B.R. The politics of quality reforms and the challenges for SDGs in education. World Dev. 2019, 118, 27–38. [Google Scholar] [CrossRef]
- Jiang, Y.; Cai, W.; Wang, Y. Change starts within: Does managerial ability matter to green innovation? Humanit. Soc. Sci. Commun. 2024, 11, 827. [Google Scholar] [CrossRef]
- Acheampong, A.O.; Opoku, E.E.O.; Amankwaa, A.; Dzator, J. Energy poverty and gender equality in education: Unpacking the transmission channels. Technol. Forecast. Soc. Change 2024, 202, 123274. [Google Scholar] [CrossRef]
- Lazoroska, D.; Palm, J.; Kojonsaari, A.-R. Gender-based opportunity structure in the energy sector: A literature review on women’s networking and mentoring. Energy Sustain. Soc. 2024, 14, 67. [Google Scholar] [CrossRef]
- Anton, S.G.; Nucu, A.E.A. The effect of financial development on renewable energy consumption. A panel data approach. Renew. Energy 2020, 147, 330–338. [Google Scholar] [CrossRef]
- Lahiani, A.; Mefteh-Wali, S.; Shahbaz, M.; Vo, X.V. Does financial development influence renewable energy consumption to achieve carbon neutrality in the USA? Energy Policy 2021, 158, 112524. [Google Scholar] [CrossRef]
- Cohen, W.M.; Levinthal, D.A. Absorptive Capacity: A New Perspective- on Learning and Innovation. In Strategic Learning in a Knowledge Economy; Routledge: Oxfordshire, UK, 2000. [Google Scholar]
- Teece, D.J. Explicating dynamic capabilities: The nature and microfoundations of (sustainable) enterprise performance. Strateg. Manag. J. 2007, 28, 1319–1350. [Google Scholar] [CrossRef]
- Acemoglu, D.; Aghion, P.; Bursztyn, L.; Hemous, D. The Environment and Directed Technical Change. Am. Econ. Rev. 2012, 102, 131–166. [Google Scholar] [CrossRef]
- Flammer, C. Corporate green bonds. J. Financ. Econ. 2021, 142, 499–516. [Google Scholar] [CrossRef]
- Mavisakalyan, A.; Tarverdi, Y. Gender and climate change: Do female parliamentarians make difference? Eur. J. Polit. Econ. 2019, 56, 151–164. [Google Scholar] [CrossRef]
- Opoku, E.E.O.; Kufuor, N.K.; Manu, S.A. Gender, electricity access, renewable energy consumption and energy efficiency. Technol. Forecast. Soc. Change 2021, 173, 121121. [Google Scholar] [CrossRef]
- Martin, R.; Muûls, M.; De Preux, L.B.; Wagner, U.J. Anatomy of a paradox: Management practices, organizational structure and energy efficiency. J. Environ. Econ. Manag. JEEM 2012, 63, 208–223. [Google Scholar] [CrossRef]
- Boyd, G.A.; Curtis, E.M. Evidence of an ‘Energy-Management Gap’ in U.S. manufacturing: Spillovers from firm management practices to energy efficiency. J. Environ. Econ. Manag. 2014, 68, 463–479. [Google Scholar] [CrossRef]
- Lin, L.; Jiang, Y.; Zhou, Z. Asymmetric spillover and network connectedness of policy uncertainty, fossil fuel energy, and global ESG investment. Appl. Energy 2024, 368, 123432. [Google Scholar] [CrossRef]
- Serrano-García, J.; Llach, J.; Bikfalvi, A.; Arbeláez-Toro, J.J. Performance effects of green production capability and technology in manufacturing firms. J. Environ. Manag. 2023, 330, 117099. [Google Scholar] [CrossRef] [PubMed]
- Zhang, Y.; Yang, J.; Liu, M. Enterprises’ energy-saving capability: Empirical study from a dynamic capability perspective. Renew. Sustain. Energy Rev. 2022, 162, 112450. Available online: https://ideas.repec.org//a/eee/rensus/v162y2022ics1364032122003562.html (accessed on 3 October 2025). [CrossRef]
- Bayer, B.; Berthold, L.; de Freitas, B.M.R. The Brazilian experience with auctions for wind power: An assessment of project delays and potential mitigation measures. Energy Policy 2018, 122, 97–117. [Google Scholar] [CrossRef]
- Nisamudheen, P.P.; Shareef, K.H. The role of human capital in driving renewable energy and sustainable development in India. Util. Policy 2025, 95, 101969. [Google Scholar] [CrossRef]
- Pegkas, P. Energy Consumption and Human Capital: Does Human Capital Stimulate Renewable Energy? The Case of Greece. J. Knowl. Econ. 2024, 15, 17256–17283. [Google Scholar] [CrossRef]
- Bray, R.; Montero, A.M.; Ford, R. Skills deployment for a ‘just’ net zero energy transition. Environ. Innov. Soc. Transit. 2022, 42, 395–410. [Google Scholar] [CrossRef]
- Briggs, C.; Atherton, A.; Gill, J.; Langdon, R.; Rutovitz, J.; Nagrath, K. Building a ‘Fair and Fast’ energy transition? Renewable energy employment, skill shortages and social licence in regional areas. Renew. Sustain. Energy Transit. 2022, 2, 100039. [Google Scholar] [CrossRef]
- Sart, G.; Özekicioğlu, H.; Danilina, M.; Aytemiz, L.; Bayar, Y. The Causal Nexus Among Energy Dependency, Human Capital, and Renewable Energy: An Empirical Analysis for EU Members. Energies 2024, 17, 5305. [Google Scholar] [CrossRef]
- Salamon, H. The effect of women’s parliamentary participation on renewable energy policy outcomes. Eur. J. Polit. Res. 2023, 62, 174–196. [Google Scholar] [CrossRef]
- Ergas, C.; York, R. Women’s status and carbon dioxide emissions: A quantitative cross-national analysis. Soc. Sci. Res. 2012, 41, 965–976. [Google Scholar] [CrossRef]
- Gozgor, G.; Mahalik, M.K.; Demir, E.; Padhan, H. The impact of economic globalization on renewable energy in the OECD countries. Energy Policy 2020, 139, 111365. [Google Scholar] [CrossRef]
- Sun, W.; Zhang, X.; Hazarika, N. Dilemmas of R&D investment risks and sustainability in the clean-tech economy: Evidence from Nasdaq clean edge index components. Int. J. Green Energy 2023, 20, 139–152. [Google Scholar] [CrossRef]
- Prempeh, K.B. The impact of financial development on renewable energy consumption: New insights from Ghana. Future Bus. J. 2023, 9, 6. [Google Scholar] [CrossRef]
- Chen, S.-S.; Lin, T.-Y. Monetary policy and renewable energy production. Energy Econ. 2024, 132, 107495. [Google Scholar] [CrossRef]
- Koenker, R.; Bassett, G. Regression Quantiles. Econometrica 1978, 46, 33–50. [Google Scholar] [CrossRef]
- Wu, Z.; Huang, N.E. Ensemble empirical mode decomposition: A noise-assisted data analysis method. Adv. Adapt. Data Anal. 2009, 1, 1–41. [Google Scholar] [CrossRef]
- Akintande, O.J.; Olubusoye, O.E.; Adenikinju, A.F.; Olanrewaju, B.T. Modeling the determinants of renewable energy consumption: Evidence from the five most populous nations in Africa. Energy 2020, 206, 117992. [Google Scholar] [CrossRef]
- Bekun, F.V.; Alola, A.A. Determinants of renewable energy consumption in agrarian Sub-Sahara African economies. Energy Ecol. Environ. 2022, 7, 227–235. [Google Scholar] [CrossRef]
- Tolmasquim, M.T.; de Barros Correia, T.; Porto, N.A.; Kruger, W. Electricity market design and renewable energy auctions: The case of Brazil. Energy Policy 2021, 158, 112558. [Google Scholar] [CrossRef]
- Hernandez-Cortes, D.; Mathes, S. The Effects of Renewable Energy Projects on Employment: Evidence from Brazil; Social Science Research Network: Rochester, NY, USA, 2023; p. 4626599. [Google Scholar] [CrossRef]
- IRENA. Renewable Energy and Jobs: Annual Review 2023. Available online: https://www.irena.org/Digital-Report/Renewable-energy-and-jobs-Annual-review-2023? (accessed on 3 October 2025).
- Gao, Y.; Yuan, R.; Zheng, S. Effects of Human Capital on Energy Consumption: The Role of Income Inequality. Int. J. Environ. Res. Public. Health 2022, 19, 17005. [Google Scholar] [CrossRef]
- Sezgin, F.H.; Bayar, Y.; Sart, G.; Danilina, M. Impact of Renewable Energy, Business Climate, and Human Capital on CO2 Emissions: Empirical Evidence from BRICS Countries. Energies 2024, 17, 3625. [Google Scholar] [CrossRef]
- Clay, P.M.; Börner, J.; Sellare, J. Institutional and macroeconomic stability mediate the effect of auctions on renewable energy capacity. Energy Policy 2023, 180, 113685. [Google Scholar] [CrossRef]
- World Bank. Promoting Renewable Energy through Auctions: The Case of Brazil. Available online: https://openknowledge.worldbank.org/entities/publication/d9c103c6-a281-533b-b35b-0469796f148d (accessed on 3 October 2025).
- Leduchowicz-Municio, A.; Domenech, B.; Ferrer-Martí, L.; Udaeta, M.E.M.; Gimenes, A.L.V. Women, equality, and energy access: Emerging lessons for last-mile rural electrification in Brazil. Energy Res. Soc. Sci. 2023, 102, 103181. [Google Scholar] [CrossRef]
- Isah, A.; Dioha, M.O.; Debnath, R.; Abraham-Dukuma, M.C.; Butu, H.M. Financing renewable energy: Policy insights from Brazil and Nigeria. Energy Sustain. Soc. 2023, 13, 2. [Google Scholar] [CrossRef] [PubMed]
- Sun, H.; Clottey, S.A.; Geng, Y.; Fang, K.; Amissah, J.C.K. Trade Openness and Carbon Emissions: Evidence from Belt and Road Countries. Sustainability 2019, 11, 2682. [Google Scholar] [CrossRef]
- Bazilian, M.; Cuming, V.; Kenyon, T. Local-content rules for renewables projects don’t always work. Energy Strategy Rev. 2020, 32, 100569. [Google Scholar] [CrossRef]
Disclaimer/Publisher’s Note: The statements, opinions and data contained in all publications are solely those of the individual author(s) and contributor(s) and not of MDPI and/or the editor(s). MDPI and/or the editor(s) disclaim responsibility for any injury to people or property resulting from any ideas, methods, instructions or products referred to in the content. |
© 2025 by the authors. Licensee MDPI, Basel, Switzerland. This article is an open access article distributed under the terms and conditions of the Creative Commons Attribution (CC BY) license (https://creativecommons.org/licenses/by/4.0/).