Abstract
Electric bikes (E-bikes), recognized as a convenient and sustainable mode of transportation, have gained widespread adoption among urban residents. In order to regulate the e-bike industry, China introduced the “Safety Technical Standards for E-bikes” (GB17761-2024), which officially came into effect on 1 September 2025. This study examines residents’ usage behavior and their continued usage intention for e-bikes following the implementation of the new national standards. Using valid data collected from respondents, the ordered logit model is established to analyze the key factors and the mechanisms influencing the continued usage behavior of e-bikes. The results indicate that: (1) A monthly income of 3500–5000 CNY significantly positively influences the continued intention to use electric bikes for both the general population and the courier/food delivery person. (2) Satisfaction with current e-bike usage positively influences the continued usage intention for both the general population and delivery personnel. (3) An increase in usage costs negatively impacts the intention to continue using electric bikes; the reduced bike speed significantly reduces the continued usage intention among delivery persons. The extended battery life does not significantly influence the continued usage intention. Based on the model results, several policy recommendations are proposed to enhance the continued usage intention of e-bikes among residents. The findings could provide theoretical insights and practical suggestions for urban transportation policy optimization and the planning of non-motorized transport systems.
1. Introduction
With the rapid expansion of urban areas and the increasing pressure of commuting travel, motorized transportation modes have alleviated commuting challenges to some extent. However, this convenience has also brought about a series of negative impacts, such as traffic congestion and environmental pollution, which pose significant challenges to urban development. Compared with traditional bikes, which rely on human power and are relatively slow, electric bikes (e-bikes) offer significant advantages, including enhanced flexibility, convenience, wide applicability, environmental sustainability, and extended driving range [1,2,3]. These attributes enable e-bikes to navigate urban streets and neighborhoods with ease, effectively addressing last-mile connectivity challenges and significantly improving travel accessibility [4,5]. As a result, e-bikes have increasingly become an integral part of urban green transportation systems [6]. However, as the number of e-bikes and their usage grow rapidly, problems such as over-speeding and illegal modifications have become more prevalent, which leads to several urban transportation issues. These include mixed traffic flow between motor vehicles and non-motorized vehicles, which reduces road efficiency, as well as disordered traffic behavior and frequent accidents caused by non-standard e-bike driving.
On 31 December 2024, China released the “Safety Technical Standards for E-bikes” (GB17761-2024) [7], and it came into effect on 1 September 2025. The new standard stipulates that compliant e-bikes must have a maximum speed of ≤25 km/h, the total bike weight using lead-acid batteries should be ≤63 kg (the total weight for other types is ≤55 kg), a motor power is ≤400 W, and a battery voltage is ≤48 V, and must be equipped with pedal-assist functionality and pass 3C certification [7]. The new standard regarding speed limits, weight reduction, and functional requirements may decrease commuting efficiency for urban residents over long distances and reduce their ability to carry goods or passengers. Additionally, mandatory parameters may lead to higher prices for compliant bikes and increased maintenance difficulty, which further increases the economic burden of low-income commuters. This could result in the continued use of older, non-compliant bikes, creating safety risks. Under this context, exploring the factors that influence the continued use of e-bikes under the new standard is of significant value for assessing the actual effectiveness of this norm and optimizing urban non-motorized transportation management strategies. Furthermore, it could provide critical insights into the key pain points of commuters during the policy’s adaptation period and offer a basis for traffic authorities to develop differentiated regulatory strategies.
While substantial research has been conducted on the characteristics and influential factors of e-bike usage, most studies have focused on the identification of factors influencing bike usage in general contexts, such as the impact of individual factors (e.g., monthly household income, household car ownership, and age structure) on e-bike usage [8]. The impact of travel behavior factors (e.g., historical travel frequency, travel preferences, perception of traffic safety, and commuting time sensitivity) on residents’ willingness to use e-bikes [9]. However, the current research lacks a deep deconstruction of the decision-making mechanism for urban residents’ continued usage intention of e-bikes in the background of the new standard. Without a comprehensive understanding of how residents make travel decisions in this new environment, policy adjustments may fail to align with actual needs, which would undermine the goal of achieving coordinated development between non-motorized transport and urban environments.
The objective of this study is to explore how various factors influence the usage behavior and continued usage intentions of e-bikes after the implementation of the new national standard for e-bikes. The contributions are as follows. First, in contrast to previous studies that focus on conventional scenarios, this research systematically investigates the direct impact of new national standard policies (e.g., speed limit of 25 km/h, bike weight reduction) on users’ continued usage intentions. Second, the ordered logit model is employed to identify key factors and their mechanisms influencing the sustained usage behavior of electric bike users under the policy constraints, including the general sample and specific subgroups, such as courier/food delivery person and office worker. Finally, the findings reveal a shift in user decision-making focus from traditional performance metrics (e.g., battery range) to new characteristics of policy compliance in the context of the new national standards, which demonstrates the reconstructive influence of policy enforcement on user decisions. This discovery offers a novel perspective for research on policy-driven green mobility and provides a fresh basis for developing differentiated strategies for non-motorized transportation management.
2. Literature Review
2.1. Usage Behavioral Characteristics of E-Bike
The study of residents’ usage behavior of e-bikes is crucial for understanding their travel patterns and demands, and it can provide essential evidence for urban transportation management and the formulation of green mobility policies. Current research primarily focuses on usage purposes, frequency, time of use, trip distance/duration, and mode substitution.
In terms of the usage purpose, in an online survey, MacArthur et al. [10] found that in North America, 45% of respondents used e-bikes primarily for commuting to work or school, followed by local trips (24%), recreation (20%), and other activities (11%). Based on a survey of 1398 Austrian e-bike owners, Wolf and Seebauer [11] concluded that e-bikes were mainly used for leisure travel, with limited substitution for commuting purposes. A study by Dong et al. [12] in Shenzhen identified commuting (40.3%), visiting family and friends (16.1%), and shopping (15.6%) as the primary trip purposes for e-bike users. Regarding the usage frequency, a North American survey reported that 93% of respondents used e-bikes at least once a week/day [10]. According to the survey in Shenzhen, Zhu et al. [13] found that respondents used e-bikes an average of 5.7 days per week, with daily riding times exceeding 3 h, and more than half of the users rode more than three times daily. As for the time of use, Dong et al. [12] found the peak in e-bike trips between 7:00 and 8:00 AM, accounting for 41.8%, and another peak was between 6:00 and 7:00 PM, with 36.2% of trips occurring during this period. Zhu et al. [13] also observed clear tidal patterns in e-bike usage, with travel concentrated during the morning and evening rush hours, which were highly correlated with the commuting demands of more than half of the users. In terms of trip distance and duration, e-bike trips were generally within 5 km, with 63.5% of trips falling within the 1–5 km range. The typical trip duration was under 1 h, with most trips lasting less than 30 min [12]. Regarding the mode substitution, Bigazzi and Wong [14] reported that e-bikes were most commonly used to replace public transportation (33%), followed by traditional bikes (27%), cars (24%), and walking (10%). Hagedorn et al. [15] found that owning an e-bike significantly reduced the likelihood of using buses, trams, metro, traditional bikes, cars, or walking in Germany, especially for trips under 15 km. However, for longer distances, the influence of e-bikes on transportation mode choice diminished.
2.2. Factors Influencing Residents’ E-Bike Usage
The adoption of e-bikes is influenced by various factors, such as policy, individual, vehicle, and environmental factors. National policies, through measures such as financial subsidies, infrastructure investment, and regulatory supervision, play a significant role in the popularization of e-bikes. Fiscal subsidies and tax incentives are often identified as key drivers for the rapid growth of e-bike usage. For example, in the Barcelona bike-sharing system, substantial investments in infrastructure and subsidies have led to notable improvements in urban mobility, simultaneously reduced user costs, and fostered the widespread adoption [16]. Fiscal incentives are particularly crucial in areas with limited financial resources. In Palestine, the adoption of e-bikes was slow, yet once fiscal constraints were alleviated, urban residents, especially students, exhibited a marked preference for them [17].
At the individual level, socio-economic attributes, personal awareness, and social influences are important determinants. Students showed a high potential for adoption, as they prioritized speed, ease of use, pleasurable experiences, and independence from public transport, and the primary barrier was the high costs [18]. For individuals aged 60 and above, whose travel was predominantly recreational, the commuting substitution effect was limited [11]. Women, driven by caregiving responsibilities, tended to adopt multi-purpose travel modes, which significantly increased their likelihood of using e-bikes [19]. Income levels were linked to travel mode choices, with low-income households being more dependent on e-bikes [13]. The availability of household transportation also affected the usage; higher ownership of e-bikes was strongly correlated with sustained usage intentions [20,21]. Behavioral habits also play a role; individuals with prior cycling experience exhibited lower interest in e-bikes, while those with limited cycling experience showed a significantly higher willingness to purchase after an experience [22,23]. Personal awareness is crucial for sustained adoption. Users who perceived e-bikes as beneficial to urban transport were more likely to continue using them, while anxiety or prior accidents could reduce future adoption rates [21,24,25]. Subjective norms are a key predictor of e-bike usage intention, and parking anxiety and lack of knowledge had negative impacts [26]. Social recognition, peer recommendations, and social influence significantly enhanced the adoption rates of e-bikes [24].
The performance and cost-effectiveness of the bike itself are central to user choice and usage. Currently, e-bikes primarily use lead-acid and lithium batteries, with lead-acid batteries being more widely adopted due to their lower cost and higher discharge rates [13]. Purchase cost, range, charging efficiency, durability, and safety (including braking systems and frame strength) directly impacted the user experience, and frequent bike malfunctions or safety risks significantly increased the likelihood of substitution [17,20]. Vendor pricing strategies, product performance, and after-sales service also play critical roles in influencing user selection and retention. While some users preferred low-cost models, there remained a demand for premium models with longer range and higher safety features, even at a higher price point [21,24]. In practice, functional characteristics and user experience are equally important. Interviews with users in the Greater Sacramento area showed that the speed, low energy consumption, and convenience of e-bikes increased ride frequency, extended travel distances, and even led to a reduction or abandonment of car usage [27]. Compared with cars, e-bikes require less infrastructure and remain more flexible in congested conditions during peak hours, thereby significantly enhancing users’ long-term adoption intentions [21].
Environmental conditions and infrastructure quality are crucial external constraints that influence sustained e-bike use. Insufficient non-motorized lanes led to mixed traffic between e-bikes, cars, and pedestrians, which raised traffic safety risks. The lack of compliant charging facilities also remained a major bottleneck to the safety and widespread adoption of e-bikes [17]. For students and younger populations, the absence of dedicated cycling infrastructure was one of the most significant barriers; the provision of dedicated bike lanes could substantially increase usage probability [28]. The layout of urban bike networks directly impacted the concentration and safety of e-bike travel, and strategic expansion and optimization of bike lanes could improve urban traffic patterns and increase e-bike usage rates [29]. Strengthening infrastructure construction could effectively enhance user adoption, particularly in developing regions such as the Philippines, Nepal, India, and Palestine, where road conditions and infrastructure availability directly influence the appeal of e-bikes [17,30]. Additionally, environmental factors such as weather, terrain, and road conditions significantly affected users’ willingness to use e-bikes [31,32].
2.3. Summary of Existing Research
Although existing studies have extensively examined the characteristics and influential factors of electric bike use, most studies have focused on conventional scenarios and neglected the decision-making mechanisms of urban residents regarding continued use under the constraints of the new national standard (e.g., a 25 km/h speed limit and a 55 kg weight reduction). Also, there is a lack of research on the decision-making behaviors of different user groups in the context of the new standards. Furthermore, current studies predominantly address traditional performance metrics (e.g., battery range), but few have systematically explored the specific impact of “policy compliance” and “user experience” on user decisions during the implementation of the new national standards. These studies overlook the emerging role of policy compliance as a central factor in decision-making following the implementation of the new regulations, a shift that is critical to the successful realization of policy objectives. To accurately capture the usage characteristics and the multi-dimensional influences on the sustained usage intentions of e-bikes under the new regulations, this study adopts an ordered logit regression model to explore the key factors and mechanisms influencing sustained e-bike use under the new national standards, and offers targeted policy recommendations.
3. Data
3.1. City Context
Nanjing, the capital of Jiangsu Province, is located in the southwestern part of the province and serves as a comprehensive transportation hub in China, as shown in Figure 1. As of the end of 2024, the city’s permanent population reached 9.57 million, and its GDP reached 1.85 trillion CNY [33]. By 2024, Nanjing’s metro system had expanded to 13 lines, covering a total length of 473 km, and the number of private cars had reached 2.67 million [33]. Additionally, the registered electric two-wheelers (including electric bikes and motorcycles) exceed 7 million, the majority of which are electric bikes [34]. Nanjing’s development in terms of population, economy, and transportation is ahead of other cities in China, and its e-bike sector has become a representative case. This study primarily focuses on elucidating the mechanisms of policy influence and identifying the factors affecting the continued intention to use electric bikes under the new regulations. The findings provide valuable insights and offer a reference for policy implementation and urban mobility planning for similar cities.
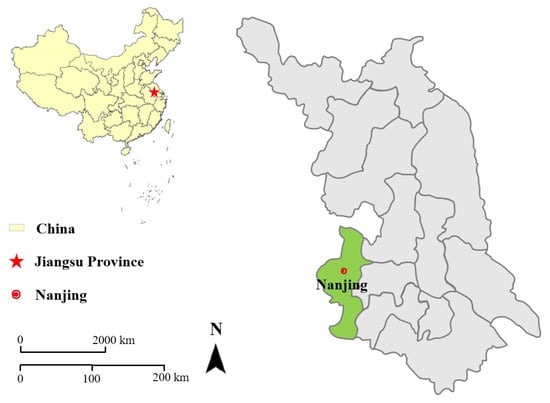
Figure 1.
Location of the survey city.
3.2. Survey Design and Data Source
Refer to the previous research, this study seeks to gather data through a questionnaire survey to investigate the factors that influence urban residents’ continued intention to use e-bikes under the new national standards. The questionnaire is divided into two main sections: the first section collects data on the individual attributes (such as gender, age, occupation, and monthly income) and travel attributes (including usage frequency, travel purposes, current satisfaction with e-bikes, and the need for e-bike replacement under the new national standards). The second section focuses on residents’ perceptions of e-bike functionality following the implementation of the new national standards, including aspects such as increased usage costs, reduced bike speed, limited bike choice, enhanced safety, strengthened regulation, improved environmental performance, extended battery life, and continued usage intention in the future. Responses are evaluated using a five-point Likert scale, where 1 represents strongly disagree, 2 represents disagree, 3 represents neutral, 4 represents agree, and 5 represents strongly agree. The specific questionnaire can be found in Appendix B.
Prior to the formal survey, a pre-test was conducted to identify ambiguities and logical flaws in the questionnaire design, in order to ensure its validity and reliability. During the pre-test, several issues were identified, such as an excessive number of problematic items and incomplete question settings. After engaging with participants, the questionnaire was revised to eliminate uncertainties and potential biases in expression, resulting in a refined version used for the formal survey. To ensure comprehensive and authentic data, both online and offline survey methods were employed. The survey was conducted in Nanjing, China. Offline questionnaires were primarily distributed in residential areas, shopping malls, parks, schools, and hospitals. The online survey was distributed via links and QR codes shared on social platforms, such as WeChat, QQ, Weibo, and Xiaohongshu, with the aim of engaging urban residents of Nanjing to participate in the survey. To address potential selection bias inherent in the “online + offline” hybrid sampling method, several measures were implemented during the study. (1) Online samples were distributed across multiple social media platforms to ensure sample diversity. (2) The offline survey covered 11 administrative districts and a variety of locations, including residential areas, shopping malls, and parks, where people commonly gather. (3) A comparison was made between the survey sample and overall statistical data, confirming the representativeness of the sample (as shown in Table 1).

Table 1.
Respondent’s attribute statistics.
The official survey was conducted from 7 April to 20 April 2025, over a two-week period, during which a total of 780 questionnaires were collected. To ensure data quality, survey samples were screened based on the following criteria: response times of less than 1 min, identical answers to attitude-related questions, responses from residents who do not use electric bikes, and incomplete questionnaires with missing options. After excluding these responses from invalid data, 692 valid questionnaires were retained, with an effective response rate of 88.72%.
3.3. Respondent’s Basic Attribute Analysis
Table 1 shows the respondents’ basic attribute results. A comparison was made between the survey data and the population census data of Nanjing. Overall, the survey sample exhibits a similar distribution in terms of gender and income. The respondent sample comprises 58.05% male and 41.91% female participants. In terms of age, the largest group of respondents is concentrated in the 26~45, accounting for over 60%, while those aged 46 and above make up only 13.73%. As for occupation, e-bike usage is predominantly reported by delivery riders and couriers, office workers, self-employed individuals, and students, representing 32.37%, 19.94%, 18.35%, and 17.34%, respectively. This distribution correlates with the specific socio-economic demands of their professions. Monthly income data reveal that 36.56% of respondents earn below 3500 CNY, while 29.48% earn between 3500 and 5000 CNY, and a minority (2.75%) earn over 12,000 CNY. This might be due to the fact that higher-income individuals tend to have more diverse transportation options.
In terms of usage frequency, the largest proportion of respondents reported they used e-bikes one to two times and over six times daily. This trend aligns with the higher representation of delivery personnel, office workers, and students, who rely on e-bikes for work, commuting, or study purposes [35,36]. A majority of users expressed a positive experience with e-bikes, with over half reporting high satisfaction, and 28.03% indicating general satisfaction. Regarding continued usage intentions, most respondents stated they would continue using e-bikes, indicating strong loyalty. However, despite the high satisfaction and intention to continue use, 80% of users will need to replace their e-bikes to comply with the new national standards. This underscores that while users are generally content with their current bikes, regulatory changes are driving the demand for product upgrades.
4. Methodology
4.1. Theoretical Framework
The Technology Acceptance Model (TAM) is a theoretical model proposed by Davis et al. based on the Theory of Reasoned Action, which is used to explain people’s behaviors and attitudes when accepting new technologies [37]. It posits that behavior is determined by behavioral intention, which is influenced by individuals’ attitudes toward and perceived usefulness of new technologies or products.
Building upon the core logic of TAM, this study constructs a theoretical framework tailored to the context of urban residents’ continued use of electric bikes under the new policy environment, as shown in Figure 2. This framework incorporates key factors such as individuals’ socio-economic characteristics, travel attributes, attitudes toward electric bikes, and policy perception. These factors influence residents’ psychological perceptions and behavioral intentions regarding electric bikes, with the moderating effect of the new policy, ultimately elucidating the mechanisms behind urban residents’ continued use of electric bikes.
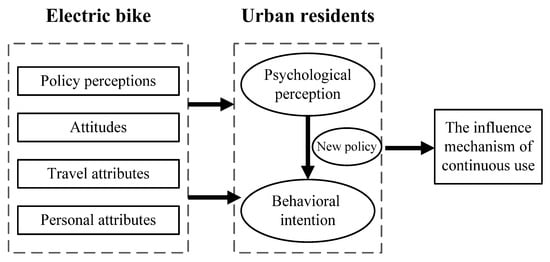
Figure 2.
Theoretical framework.
4.2. Ordered Logit Model
The ordered logit model is a statistical approach employed to examine the relationship between an ordinal dependent variable and multiple independent variables. In the context of this study, the willingness of urban residents to continue using e-bikes under the new national standards is an ordinal categorical variable, with levels ranging from “very unwilling” to “very willing”. Given the nature of this ordinal variable, the ordered logit model is deemed an appropriate method for its analysis. In contrast, Bayesian models and mixed models, while capable of handling complex nonlinear relationships and varying distributions, tend to be more intricate and less interpretable. One advantage of the ordered logit model is its ease of interpretation, typically expressed as the change in probability for each category relative to the baseline category. This allows researchers to clearly understand how each independent variable affects the different categories of the dependent variable. Furthermore, marginal effect analysis can quantify the probability changes of each category caused by the alteration of independent variables, thus enhancing the interpretability of the model results [38]. The ordered logit model with J levels of the ordinal dependent variable is expressed as follows:
where is the set of independent variables, including individual socio-economic attributes, travel characteristics, and attitude perceptions; is the set of dependent variables, which is residents’ continued usage intention of e-bikes under the new national standards; is the intercept of the jth rank, j = 1, 2, …, J; is the regression coefficient of the kth independent variable; is the kth independent variable, k = 1,2, …, K; is the cumulative probability, and .
The probabilistic model for the ordered logit model is the following:
4.3. Model Construction Procedure
The process for developing the ordered logit model is as follows.
- (1)
- The validity of the questionnaire data is first evaluated through reliability and validity tests. Reliability is assessed using Cronbach’s alpha coefficient, while validity is determined through the KMO (Kaiser–Meyer–Olkin) index and Bartlett’s test of sphericity.
- (2)
- Before constructing the ordered logit model, all variables should be appropriately defined and calibrated. In this study, the dependent variable in the ordered logit regression is the willingness of individuals to continue using e-bikes in the future under the new national standards. The independent variables consist of individual attributes, travel attributes, and attitude perceptions, as defined in the questionnaire. The calibration results for these variables are provided in Table 2.
Table 2. Variables calibration.
- (3)
- Multicollinearity refers to the strong linear correlation among multiple explanatory variables, which complicates the accurate differentiation of their individual effects in regression model estimation, leading to potential biases in the results. In this study, collinearity tests were conducted to exclude highly correlated independent variables. Based on established practices in the literature, variables with a Variance Inflation Factor (VIF) greater than 5 are considered to exhibit multicollinearity and were therefore removed from the model [39].
- (4)
- The ordered logit model is then established for parameter estimation. The parallel lines assumption is tested to assess the model’s appropriateness. If the p-value of the test exceeds 0.05, the parallel lines assumption is considered valid [40].
- (5)
- A likelihood ratio test is performed to evaluate the goodness of fit of the ordered logit model. If the p-value is less than 0.05, the model’s fit is significantly better than the null model with only constant terms.
- (6)
- Parameter estimates from the ordered logit model are used to interpret the specific effects and influences of various factors on residents’ continued usage intention of e-bikes.
5. Model Results and Discussion
5.1. Model Results
The validity of the questionnaire data is assessed using the KMO value and Bartlett’s test. The Cronbach’s α for this study is 0.827, indicating satisfactory data reliability as it exceeds the 0.7 threshold. The KMO value is 0.895, well above the 0.6 benchmark, and Bartlett’s test of sphericity shows a significance level below 0.05, suggesting the adequacy of the data’s validity. In the existing studies, numerous studies treat these attitudinal perception variables as single items and incorporate them into models to explore their specific influence on travelers’ behavioral decision-making [41,42]. Furthermore, the VIF for all independent variables is less than 5, confirming the absence of multicollinearity, and empirical research can be conducted.
To investigate the factors influencing the continued use intention of electric bikes across different demographic groups, ordered logit models were developed for the full sample as well as for two specific subgroups: courier/food delivery person and office worker. Table 3 presents the results of the ordered logit models for the three groups—urban residents (all sample), courier/food delivery persons, and office workers. Table A1 provides the confidence intervals for the coefficient estimates of the three models, and Table A2, Table A3 and Table A4 present the marginal effect analysis results of the three models. As for the likelihood ratio tests for the three models, −2 log-likelihood values are 1197.481, 423.791, and 191.227, with corresponding Chi-square values of 67.094, 61.243, and 24.599. Moreover, compared with the model containing only the intercept, the −2 log-likelihood value of the established model is smaller. The significance levels of the first two likelihood ratio tests are both less than 0.01, indicating that the explanatory power of the ordered logit models is much better than that of the null models, and the model fits well. Regarding pseudo R2, the Cox and Snell values are 0.092, 0.239, and 0.163; the Nagelkerke values are 0.110, 0.270, and 0.206; and the McFadden values are 0.053, 0.126, and 0.114. Generally, a McFadden value of 0.2 indicates a rather good model fit. Parallelism tests for the three models yielded Chi-square values of 152.793, 93.123, and 47.823, with significance levels all exceeding 0.01, confirming the validity of the parallelism assumption. Overall, the results of the parameter estimation are reliable.
Table 3.
Parameter estimates of the ordered logit model for urban residents’ continued use of e-bikes under the new national standard.
Regarding the model estimation results, in general, individual characteristics such as occupation and monthly income significantly affect the intention to continue using electric bikes. Travel attributes, including daily usage duration, trip purpose, current satisfaction with the electric bike, and the need for replacement, also have significant impacts on continued usage intention. Regarding attitudinal perceptions, increased usage costs and reduced bike speed significantly affect the continued use intention.
5.2. Discussions
In terms of individual attributes, the monthly income variable shows a significant positive effect on the continued use intention of electric bikes for both the general urban resident population and the courier/food delivery person group, particularly for those earning between 3500 and 5000 CNY per month. The coefficients for these two groups are 1.227 and 1.825, respectively, with odds ratios of exp(1.227) = 3.409 and exp(1.825) = 6.202. This indicates that for every unit increase in the likelihood of monthly income falling within the 3500~5000 CNY range, while holding other model variables constant, the odds of a high versus low continued use intention are 3.409 times higher for the general population and 6.202 times higher for courier/food delivery person [43,44]. Electric bikes have low purchase costs, relatively inexpensive maintenance, and economical operating costs, making them an affordable and convenient transportation choice for individuals in the 3500~5000 CNY income range during daily travel in cities. This finding aligns with Cherry and Cervero’s survey results in Kunming and Shanghai, which suggest that lower-income groups exhibit higher reliance on electric bikes, and they position them as an affordable and higher-quality alternative to public transport for general consumers [20]. For the courier/food delivery person, electric bikes provide a fast and efficient means of delivery, which is crucial for enhancing work productivity and income. However, as income levels rise, this positive effect diminishes and becomes statistically insignificant. This is because, as income levels gradually rise, high-income groups pay more attention to travel comfort, efficiency, or social image, and they may be more inclined to choose alternative travel methods such as motor vehicles [13], and reduce their reliance on electric bicycles. The marginal effect analysis further elucidates this trend: an increase of one unit in the likelihood of monthly income falling within the range of 3500 to 5000 CNY results in a 26.7% and 35.6% increase in the probability of “very willing” to continue using electric bikes for the general population and courier/food delivery person, respectively. In terms of occupational variables, compared with office workers, courier/food delivery person exhibits a significant negative impact on their willingness to continue using electric bikes. Specifically, when the probability of an individual being employed in an office worker’s job increases by one unit, the likelihood of being “very willing” to continue using electric bikes decreases by 13.4%. A plausible explanation for this is that the new policy’s speed limits, weight reduction requirements, and functional constraints may reduce the efficiency and carrying capacity of delivery workers, thus diminishing their willingness to continue using electric bikes.
As for the travel attributes, compared with daily usage durations exceeding 9 h, the daily usage duration of electric bikes for other durations exhibits a positive effect on the continued use intention. However, this effect gradually diminishes as the usage duration increases. This suggests that groups with higher usage durations tend to show lower willingness to continue using electric bikes. This is because frequent users are more sensitive to regulatory changes, such as speed limits or charging restrictions, which may prompt them to shift to alternative modes of transport. The travel purpose, specifically commuting, significantly influences office workers’ intention to continue using electric bikes. Marginal effect analysis further confirms this, which reveals that a one-unit increase in the likelihood of commuting as the travel purpose leads to a 10.2% increase in the probability of being “very willing” to continue using electric bikes. The convenience, cost-effectiveness, and positive health benefits of electric bikes make them an ideal choice for office workers’ daily commutes. Furthermore, satisfaction with the use of electric bikes positively affects the intention to continue using them, particularly among the general population and courier/food delivery personnel. This indicates that a better user experience enhances the perceived value of e-bikes, leading to greater dependency and long-term usage intention among urban residents. This finding is consistent with the results from Popovich et al.’s interviews with 27 electric bike users in the Sacramento metropolitan area, which highlighted that the functional characteristics of electric bicycles—particularly their higher speed, smoother acceleration, and reduced effort compared to traditional bicycles—contribute to a range of positive experiences and higher satisfaction. These include enabling more people to cycle, increasing the frequency of bicycle use, and enhancing user enjoyment [27]. Marginal effect analysis further substantiates this, indicating that a one-unit increase in satisfaction with electric bikes corresponds to a 5.5%, 9.5%, and 4.8% increase in the probability of being “very willing” to continue using them across three groups. To assess the potential endogeneity of satisfaction in predicting the continued use intention, the variable was excluded, and the model was re-estimated (see Table A5). The results showed no significant change in model fit or the number of significant variables. The replacement of the electric bike variable demonstrates a positive but statistically insignificant effect on the continued use intention across the full sample, whereas it had a significant positive impact for the courier/food delivery person. This implies that even when a replacement is necessary, residents’ willingness to continue using e-bikes still increases. This could reflect the residents’ strong dependency on e-bikes for daily usage, as well as the potential performance upgrades associated with new models, such as improved battery life, speed, and comfort, which may enhance users’ long-term expectations.
Regarding perceptions of electric bikes, an increase in usage costs negatively impacts the intention to continue using electric bikes. This is because higher usage costs directly reduce the economic appeal, particularly for price-sensitive users. A decline in bike speed significantly decreases the continued use intention among courier/food delivery persons, likely because reduced speed (e.g., due to policy-imposed speed limits) undermines the core advantage of electric bikes in terms of efficient delivery. This finding aligns with Das et al.’s study in India, which surveyed 31 recent electric bicycle purchasers, indicating that technological and financial factors are the primary concerns for users when purchasing electric bikes [24]. Furthermore, strengthened regulations have a negative impact on continued usage intention, even though the effect is not statistically significant. These regulatory intensifications, such as licensing controls and penalties for violations, may raise the barriers to use and increase anxiety among users. In conclusion, when the practicality, cost-effectiveness, and convenience of e-bikes are diminished by policy or market factors, users are more likely to switch to alternative transportation modes, such as public transit or microcars, leading to a decline in continued usage intention. Future policies need to strike a balance between standardized management and preserving the core interests of users to avoid reverse incentives. This aligns with the findings of Ma et al., who investigated the impact of strengthened helmet-wearing regulations in Taizhou (2017–2019) and Nanning (2020). Their analysis revealed a decline in both usage frequency and accident rates following the introduction of these regulatory measures [45]. Previous studies have shown that improvements in battery range could enhance user loyalty [21,24]. However, under the current regulatory framework, this factor was not significant. This is because the new regulations impose strict requirements on e-bikes, and the advantage of their range may be partially offset. Consider the following examples: (1) Tightened management of charging facilities (such as prohibiting on-site charging) may cause users to encounter the problem of inconvenient charging even if they have longer-lasting batteries. (2) High-frequency short-distance travel demands (such as the “last mile” scenario brought about by new regulations) have made ultra-long range a non-essential need. Therefore, under the new regulations, users pay more attention to compliance, convenience, and policy adaptability rather than a single battery life indicator, which leads to the fact that the impact of this variable is no longer significant. To verify this hypothesis, an interaction term between usage frequency and battery range improvement is introduced. The results indicated that this interaction term remained insignificant, suggesting that under the new regulatory framework, the impact of battery range on the continued use intention of high-frequency users is diminished.
5.3. Policies and Recommendations
Based on the analysis of the factors influencing the residents’ continued usage intention of e-bikes, this study proposes several strategies to promote their sustained use.
- (1)
- Reducing compliance bike usage costs to enhance user retention
The findings indicate that an increase in usage costs has a significantly negative impact on continued usage intention (coefficient = −0.301), suggesting that price-sensitive users constitute a key demographic for e-bikes. In this context, it is recommended that the government implement subsidy policies for compliant e-bikes. For instance, bike registration fees for those meeting national standards could be waived, and reasonable subsidies could be offered for battery recycling. Additionally, the construction of community-based charging infrastructure could reduce both charging costs and risks. Simultaneously, efforts to standardize battery technology should be promoted to lower future maintenance costs. These measures would directly enhance the economic advantages of e-bikes, and effectively maintain user retention and boost long-term usage expectations.
- (2)
- Optimization of speed limit policies and the provision of advanced delivery management systems
The results indicate that reduced bike speeds significantly negatively impact the continued use intentions of electric bikes among courier/food delivery persons. Therefore, it is recommended to shift from overly standardized, inflexible speed limit regulations towards a more adaptive framework. A key proposal is the implementation of an intelligent speed-limiting system, which would leverage electronic fences to dynamically adjust speed limits by segment, thus ensuring safety while accommodating delivery riders’ efficiency needs. Furthermore, the development of AI- and big data-driven smart delivery systems should be prioritized, allowing real-time monitoring of traffic conditions, delivery routes, and vehicle status, which could provide optimized routing recommendations and minimize time lost due to speed restrictions. Additionally, platforms could introduce incentive schemes, such as task-based rewards or subsidies for efficient deliveries, to offset the efficiency losses imposed by speed limits.
- (3)
- Enhancing the electric bike user experience to strengthen long-term engagement among commuters and delivery personnel
The travel purpose of commuting significantly increases the intention of office workers to continue using electric bikes, while user satisfaction also plays a crucial role in driving long-term adoption, particularly for both the general public and delivery personnel. Several strategies can be employed to enhance the sustained use of electric bikes. First, improving the comfort and performance of electric bikes is essential, particularly for long commutes or high-frequency delivery scenarios. Second, the convenience of charging should be enhanced by installing additional charging stations in key commuting and delivery areas, coupled with a smart charging network that allows users to monitor the location and status of charging stations in real time, and optimize the charging routes. The promotion of battery swapping services should also be considered to reduce charging wait times and improve travel efficiency. Third, the development of intelligent management systems can provide users with personalized route planning, real-time traffic updates, and safety alerts, thereby improving both riding efficiency and security.
6. Conclusions
This study aims to explore the factors that influence users’ continued usage intention of e-bikes under the new national standard. Using data collected from valid responses, the ordered logit model is established to identify the key determinants and mechanisms driving the sustained use of e-bikes. The results indicate the following: (1) A monthly income range of 3500~5000 CNY has a significant positive impact on the continued usage intention of electric bikes among urban residents and courier/food delivery persons. However, as the income range increases, this positive effect diminishes and becomes statistically insignificant. Compared with office workers, delivery personnel exhibit a significantly negative influence on the continued use intention of electric bikes. (2) The travel purpose of commuting significantly enhances office workers’ intention to continue using electric bikes. Current satisfaction with electric bike usage also positively influences continued usage intention, particularly for both the general population and delivery personnel. Additionally, the need for an electric bike replacement has a significantly positive impact on the continued usage intention of delivery personnel. (3) Increased usage costs negatively affect the continued use intention of the electric bike. Reduced bike speeds significantly impact the continued use intention among delivery riders. Under the current regulatory framework, the battery range variable does not significantly influence continued usage. Based on these model findings, it is recommended to strengthen electric bike usage intentions through three strategies: reducing compliance-related bike costs, optimizing speed limit policies, and enhancing the electric bike user experience.
The study has several limitations that require further investigation. First, although multiple factors have been considered, users’ continued adoption of e-bikes may also be influenced by other unexamined variables, such as psychological perceptions and social influences. Future research could include additional dimensions in the model. Then, this study conducts an analysis based on the valid data collected from Nanjing. Given that influential factors may differ across cities, future research should involve comparative studies across multiple cities to verify the generalizability of the findings. A three-stage longitudinal tracking design (pre-policy implementation, transition period, post-implementation) will be employed, along with a multi-city comparative study (cities with varying levels of policy enforcement). Instrumental variable methods (e.g., using government enforcement resource allocation as an instrument) and Difference-in-Differences (DID) models could be utilized to establish a more rigorous causal inference framework, enabling a systematic evaluation of the true impact of the new national standard policy and its boundaries of effect. Additionally, future research can integrate Global Sensitivity Analysis (GSA) to quantify the relative importance and interactions of predictive factors on continued usage intentions, enhancing the robustness and transparency of the model, thereby increasing the explanatory power and reliability of the research conclusions [46,47]. In addition, in terms of methods, the generalized/partial proportional odds model can also be adopted to estimate the model. Finally, as the new e-bike standards are gradually implemented and adjusted, the policy effects may exhibit time-lagged or evolving impacts. Further empirical studies could explore changes in user behavior after policy implementation.
Author Contributions
Conceptualization, M.L., X.L. and M.D.; data curation, X.L.; formal analysis, M.L., M.D. and X.L.; writing—original draft, M.L., M.D. and X.L.; writing—review and editing, M.D., D.L. and J.Y. All authors have read and agreed to the published version of the manuscript.
Funding
This research was funded by the Baoshan Xingbao Young Talent Training Project (202303).
Institutional Review Board Statement
The study was conducted in accordance with the Declara-tion of Helsinki, and approved by the Ethics Committee of Nanjing Forestry University (NJFU162025082501, 31 October 2024).
Informed Consent Statement
Informed consent for participation was obtained from all subjects involved in the study.
Data Availability Statement
Data will be made available on request.
Acknowledgments
Thank you to all those who participated in the investigation.
Conflicts of Interest
The authors declare no conflicts of interest.
Appendix A
Table A1.
Confidence intervals (CI) for coefficient estimates of three models.
Table A1.
Confidence intervals (CI) for coefficient estimates of three models.
| Category | Variable | All Sample | Courier/Food Delivery Person | Office Worker | |||
|---|---|---|---|---|---|---|---|
| 95% CI | 95% CI | 95% CI | |||||
| Individual attributes | Gender = Male | −0.276 | 0.392 | −0.264 | 1.039 | −1.012 | 0.813 |
| Gender = Female | . | . | . | . | . | . | |
| Age = 18~25 | −0.234 | 0.868 | −0.433 | 1.421 | −1.026 | 1.920 | |
| Age = 26~35 | −0.413 | 0.630 | −0.642 | 1.055 | −2.103 | 0.719 | |
| Age = 36~45 | −0.265 | 0.791 | −0.227 | 1.603 | −1.362 | 1.338 | |
| Age = ≥46 | . | . | . | . | . | . | |
| Occupation = Student | −0.520 | 0.588 | / | / | / | / | |
| Occupation = Courier/Food delivery person | −1.090 | −0.142 | / | / | / | / | |
| Occupation = Teacher | −0.503 | 0.955 | / | / | / | / | |
| Occupation = Retired | −1.572 | 3.136 | / | / | / | / | |
| Occupation = Doctor | −1.597 | 0.478 | / | / | / | / | |
| Occupation = Freelancer | −1.102 | 3.303 | / | / | / | / | |
| Occupation = Self-employed | −0.654 | 0.414 | / | / | / | / | |
| Occupation = Office worker | . | . | . | . | . | . | |
| Monthly income = ≤3500 | −0.181 | 1.694 | 0.007 | 2.478 | −20.180 | −17.367 | |
| Monthly income = 3501~5000 | 0.271 | 2.182 | 0.582 | 3.067 | −20.316 | −17.330 | |
| Monthly income = 5001~8000 | −0.155 | 1.778 | −0.139 | 2.342 | −20.250 | −16.964 | |
| Monthly income = 8001~12,000 | −0.464 | 1.519 | −0.345 | 2.271 | −18.801 | −18.801 | |
| Monthly income = ≥12,001 | . | . | . | . | . | . | |
| Travel attributes | Daily usage frequency = 1~2 times | −0.639 | 1.632 | −1.097 | 3.021 | −5.527 | 0.198 |
| Daily usage frequency = 2~4 times | −0.835 | 2.066 | −0.618 | 4.290 | −6.725 | 2.331 | |
| Daily usage frequency = 4~6 times | −1.429 | 0.884 | −1.456 | 1.734 | −8.184 | 2.608 | |
| Daily usage frequency = >6 times | . | . | . | . | . | . | |
| Daily usage duration = 0.5 h | −0.157 | 1.475 | −0.295 | 2.761 | −2.205 | 1.864 | |
| Daily usage duration = 1 h | −0.382 | 1.009 | −0.477 | 1.921 | −3.136 | 0.997 | |
| Daily usage duration = 2 h | −0.174 | 1.158 | 0.390 | 2.813 | −1.814 | 1.935 | |
| Daily usage duration = 2~4 h | −0.299 | 0.998 | 0.017 | 2.206 | −1.846 | 1.879 | |
| Daily usage duration = 4~9 h | −0.492 | 0.660 | −0.303 | 1.776 | −1.897 | 1.317 | |
| Daily usage duration = 9 h and above | . | . | . | . | . | . | |
| Travel purpose = Commuting | −0.156 | 0.261 | −0.481 | 0.300 | 0.048 | 1.112 | |
| Travel Purpose = Child pickup/drop-off | −0.303 | 0.138 | −0.423 | 0.358 | −0.686 | 0.684 | |
| Travel purpose = Work-related | −0.193 | 0.228 | −0.252 | 0.546 | −0.458 | 0.599 | |
| Travel purpose = Leisure/Recreation | −0.092 | 0.322 | −0.095 | 0.620 | −0.244 | 0.919 | |
| Travel purpose = Transfer | −0.331 | 0.109 | −0.814 | −0.012 | −0.627 | 0.705 | |
| Travel purpose = Other | . | . | . | . | . | . | |
| Satisfaction with current e-bike usage | 0.072 | 0.456 | 0.124 | 0.851 | −0.247 | 0.795 | |
| Need to replace e-bike under new standard = Yes | −0.280 | 0.564 | −0.039 | 1.508 | −1.394 | 0.736 | |
| Need to replace e-bike under new standard = No | . | . | . | . | . | . | |
| Attitudes and perceptions | Increased usage cost | −0.542 | −0.021 | −0.802 | 0.127 | −0.982 | 0.654 |
| Reduced bike speed | −0.239 | 0.334 | −0.943 | 0.066 | −0.364 | 1.208 | |
| Limited bike choice | −0.313 | 0.203 | −0.513 | 0.397 | −0.667 | 0.744 | |
| Enhanced safety | −0.388 | 0.187 | −0.358 | 0.638 | −0.845 | 1.017 | |
| Strengthened regulation | −0.346 | 0.090 | −0.436 | 0.407 | −0.661 | 0.531 | |
| Improved environmental performance | −0.211 | 0.288 | −0.334 | 0.542 | −0.125 | 1.269 | |
| Extended battery life | −0.172 | 0.454 | −0.189 | 0.940 | −1.741 | 0.267 | |
| Usage frequency = 1~2 times * Extended battery life | −0.713 | 0.369 | −1.234 | 0.660 | −0.508 | 2.322 | |
| Usage frequency = 2~4 times * Extended battery life | −0.851 | 0.555 | −1.628 | 0.649 | −1.123 | 3.611 | |
| Usage frequency = 4~6 times * Extended battery life | −0.271 | 0.795 | −0.566 | 0.776 | −1.229 | 3.436 | |
| Usage frequency = >6 times * Extended battery life | . | . | . | . | . | . | |
| Intercepts | Continued usage intention = 1/2 | −4.925 | −1.031 | −4.751 | 1.931 | −25.225 | −12.839 |
| Continued usage intention = 2/3 | −4.118 | −0.374 | −2.085 | 3.467 | |||
| Continued usage intention = 3/4 | −2.338 | 1.296 | 0.234 | 5.747 | −23.699 | −11.477 | |
| Continued usage intention = 4/5 | −0.564 | 3.069 | 1.746 | 7.340 | −21.343 | −9.039 | |
Note: * denotes that the interaction between two variables.
Table A2.
Marginal effect analysis results of the model (all sample).
Table A2.
Marginal effect analysis results of the model (all sample).
| Category | Variable | 1 | 2 | 3 | 4 | 5 |
|---|---|---|---|---|---|---|
| Individual attributes | Gender = Male | −0.001 | −0.001 | −0.004 | −0.007 | 0.012 |
| Gender = Female | 0 a | 0 a | 0 a | 0 a | 0 a | |
| Age = 18~25 | −0.003 | −0.003 | −0.021 | −0.040 | 0.067 | |
| Age = 26~35 | −0.001 | −0.001 | −0.008 | −0.014 | 0.023 | |
| Age = 36~45 | −0.003 | −0.003 | −0.017 | −0.033 | 0.056 | |
| Age = ≥46 | 0 a | 0 a | 0 a | 0 a | 0 a | |
| Occupation = Student | 0.000 | 0.000 | −0.002 | −0.004 | 0.007 | |
| Occupation = Courier/Food delivery person | 0.006 | 0.006 | 0.042 | 0.080 | −0.134 | |
| Occupation = Teacher | −0.001 | −0.002 | −0.011 | −0.029 | 0.044 | |
| Occupation = Retired | −0.004 | −0.004 | −0.032 | −0.094 | 0.134 | |
| Occupation = Doctor | 0.005 | 0.006 | 0.038 | 0.073 | −0.121 | |
| Occupation = Freelancer | −0.005 | −0.005 | −0.040 | −0.124 | 0.174 | |
| Occupation = Self-employed | 0.001 | 0.001 | 0.007 | 0.016 | −0.025 | |
| Occupation = Office worker | 0 a | 0 a | 0 a | 0 a | 0 a | |
| Monthly income = ≤3500 | −0.011 | −0.011 | −0.065 | −0.084 | 0.171 | |
| Monthly income = 3501~5000 | −0.015 | −0.015 | −0.092 | −0.145 | 0.267 | |
| Monthly income = 5001~8000 | −0.012 | −0.011 | −0.069 | −0.091 | 0.183 | |
| Monthly income = 8001~12,000 | −0.009 | −0.008 | −0.048 | −0.056 | 0.121 | |
| Monthly income = ≥12,001 | 0 a | 0 a | 0 a | 0 a | 0 a | |
| Travel attributes | Daily usage frequency = 1~2 times | −0.004 | −0.004 | −0.030 | −0.062 | 0.100 |
| Daily usage frequency = 2~4 times | −0.005 | −0.005 | −0.035 | −0.076 | 0.122 | |
| Daily usage frequency = 4~6 times | 0.003 | 0.003 | 0.021 | 0.032 | −0.060 | |
| Daily usage frequency = >6 times | 0 a | 0 a | 0 a | 0 a | 0 a | |
| Daily usage duration = 0.5 h | −0.006 | −0.006 | −0.040 | −0.082 | 0.134 | |
| Daily usage duration = 1 h | −0.003 | −0.003 | −0.021 | −0.039 | 0.067 | |
| Daily usage duration = 2 h | −0.005 | −0.005 | −0.032 | −0.062 | 0.103 | |
| Daily usage duration = 2~4 h | −0.004 | −0.004 | −0.024 | −0.044 | 0.074 | |
| Daily usage duration = 4~9 h | −0.001 | −0.001 | −0.006 | −0.010 | 0.018 | |
| Daily usage duration = 9 h and above | 0 a | 0 a | 0 a | 0 a | 0 a | |
| Travel purpose = Commuting | −0.001 | −0.001 | −0.003 | −0.007 | 0.011 | |
| Travel Purpose = Child pickup/drop-off | 0.001 | 0.001 | 0.005 | 0.010 | −0.017 | |
| Travel purpose = Work-related | 0.000 | 0.000 | −0.001 | −0.002 | 0.004 | |
| Travel purpose = Leisure/Recreation | −0.001 | −0.001 | −0.007 | −0.014 | 0.024 | |
| Travel purpose = Transfer | 0.001 | 0.001 | 0.007 | 0.014 | −0.023 | |
| Travel purpose = Other | 0 a | 0 a | 0 a | 0 a | 0 a | |
| Satisfaction with current e-bike usage | −0.003 | −0.003 | −0.017 | −0.033 | 0.055 | |
| Need to replace e-bike under new standard = Yes | −0.001 | −0.001 | −0.009 | −0.018 | 0.030 | |
| Need to replace e-bike under new standard = No | 0 a | 0 a | 0 a | 0 a | 0 a | |
| Attitudes and perceptions | Increased usage cost | 0.003 | 0.003 | 0.018 | 0.035 | −0.059 |
| Reduced bike speed | 0.000 | 0.000 | −0.003 | −0.006 | 0.010 | |
| Limited bike choice | 0.001 | 0.001 | 0.003 | 0.007 | −0.011 | |
| Enhanced safety | 0.001 | 0.001 | 0.006 | 0.013 | −0.021 | |
| Strengthened regulation | 0.001 | 0.001 | 0.008 | 0.016 | −0.027 | |
| Improved environmental performance | 0.000 | 0.000 | −0.002 | −0.005 | 0.008 | |
| Extended battery life | −0.001 | −0.001 | −0.009 | −0.018 | 0.029 | |
| Usage frequency = 1~2 times * Extended battery life | 0.002 | 0.002 | 0.011 | 0.021 | −0.036 | |
| Usage frequency = 2~4 times * Extended battery life | 0.001 | 0.001 | 0.009 | 0.018 | −0.031 | |
| Usage frequency = 4~6 times * Extended battery life | −0.003 | −0.003 | −0.017 | −0.033 | 0.055 | |
| Usage frequency = >6 times * Extended battery life | 0 a | 0 a | 0 a | 0 a | 0 a |
Note: * denotes that the interaction between two variables; a denotes that this category of the variable is redundant and therefore it is set to zero.
Table A3.
Marginal effect analysis results of the model (courier/food delivery person).
Table A3.
Marginal effect analysis results of the model (courier/food delivery person).
| Category | Variable | 1 | 2 | 3 | 4 | 5 |
|---|---|---|---|---|---|---|
| Individual attributes | Gender = Male | −0.002 | −0.009 | −0.039 | −0.026 | 0.076 |
| Gender = Female | 0 a | 0 a | 0 a | 0 a | 0 a | |
| Age = 18~25 | −0.002 | −0.012 | −0.051 | −0.034 | 0.099 | |
| Age = 26~35 | −0.001 | −0.006 | −0.022 | −0.013 | 0.042 | |
| Age = 36~45 | −0.003 | −0.016 | −0.068 | −0.050 | 0.136 | |
| Age = ≥46 | 0 a | 0 a | 0 a | 0 a | 0 a | |
| Occupation = Student | / | / | / | / | / | |
| Occupation = Courier/Food delivery person | / | / | / | / | / | |
| Occupation = Teacher | / | / | / | / | / | |
| Occupation = Retired | / | / | / | / | / | |
| Occupation = Doctor | / | / | / | / | / | |
| Occupation = Freelancer | / | / | / | / | / | |
| Occupation = Self-employed | / | / | / | / | / | |
| Occupation = Office worker | 0 a | 0 a | 0 a | 0 a | 0 a | |
| Monthly income = ≤3500 | −0.009 | −0.046 | −0.148 | −0.040 | 0.243 | |
| Monthly income = 3501~5000 | −0.011 | −0.057 | −0.200 | −0.088 | 0.356 | |
| Monthly income = 5001~8000 | −0.009 | −0.043 | −0.133 | −0.030 | 0.215 | |
| Monthly income = 8001~12,000 | −0.008 | −0.039 | −0.118 | −0.022 | 0.187 | |
| Monthly income = ≥12,001 | 0 a | 0 a | 0 a | 0 a | 0 a | |
| Travel attributes | Daily usage frequency = 1~2 times | −0.004 | −0.021 | −0.089 | −0.071 | 0.185 |
| Daily usage frequency = 2~4 times | −0.005 | −0.030 | −0.141 | −0.145 | 0.321 | |
| Daily usage frequency = 4~6 times | −0.001 | −0.004 | −0.015 | −0.008 | 0.028 | |
| Daily usage frequency = >6 times | 0 a | 0 a | 0 a | 0 a | 0 a | |
| Daily usage duration = 0.5 h | −0.006 | −0.036 | −0.135 | −0.069 | 0.246 | |
| Daily usage duration = 1 h | −0.005 | −0.025 | −0.085 | −0.030 | 0.145 | |
| Daily usage duration = 2 h | −0.007 | −0.041 | −0.164 | −0.101 | 0.313 | |
| Daily usage duration = 2~4 h | −0.006 | −0.034 | −0.124 | −0.059 | 0.222 | |
| Daily usage duration = 4~9 h | −0.005 | −0.025 | −0.087 | −0.031 | 0.148 | |
| Daily usage duration = 9 h and above | 0 a | 0 a | 0 a | 0 a | 0 a | |
| Travel purpose = Commuting | 0.000 | 0.002 | 0.009 | 0.006 | −0.018 | |
| Travel Purpose = Child pickup/drop-off | 0.000 | 0.001 | 0.003 | 0.002 | −0.006 | |
| Travel purpose = Work-related | −0.001 | −0.003 | −0.014 | −0.010 | 0.029 | |
| Travel purpose = Leisure/Recreation | −0.001 | −0.006 | −0.026 | −0.018 | 0.051 | |
| Travel purpose = Transfer | 0.002 | 0.010 | 0.040 | 0.029 | −0.080 | |
| Travel purpose = Other | 0 a | 0 a | 0 a | 0 a | 0 a | |
| Satisfaction with current e-bike usage | −0.002 | −0.011 | −0.048 | −0.034 | 0.095 | |
| Need to replace e-bike under new standard = Yes | −0.004 | −0.021 | −0.079 | −0.041 | 0.144 | |
| Need to replace e-bike under new standard = No | 0 a | 0 a | 0 a | 0 a | 0 a | |
| Attitudes and perceptions | Increased usage cost | 0.001 | 0.008 | 0.033 | 0.023 | −0.066 |
| Reduced bike speed | 0.002 | 0.010 | 0.043 | 0.030 | −0.085 | |
| Limited bike choice | 0.000 | 0.001 | 0.006 | 0.004 | −0.011 | |
| Enhanced safety | −0.001 | −0.003 | −0.014 | −0.010 | 0.027 | |
| Strengthened regulation | 0.000 | 0.000 | 0.001 | 0.001 | −0.003 | |
| Improved environmental performance | 0.000 | −0.002 | −0.010 | −0.007 | 0.020 | |
| Extended battery life | −0.002 | −0.009 | −0.037 | −0.026 | 0.073 | |
| Usage frequency = 1~2 times * Extended battery life | 0.001 | 0.007 | 0.028 | 0.020 | −0.056 | |
| Usage frequency = 2~4 times * Extended battery life | 0.002 | 0.011 | 0.048 | 0.034 | −0.095 | |
| Usage frequency = 4~6 times * Extended battery life | 0.000 | −0.002 | −0.010 | −0.007 | 0.020 | |
| Usage frequency = >6 times * Extended battery life | 0 a | 0 a | 0 a | 0 a | 0 a |
Note: * denotes that the interaction between two variables; a denotes that this category of the variable is redundant and therefore it is set to zero.
Table A4.
Marginal effect analysis results of the model (office worker).
Table A4.
Marginal effect analysis results of the model (office worker).
| Category | Variable | 1 | 3 | 4 | 5 |
|---|---|---|---|---|---|
| Individual attributes | Gender = Male | 0.001 | 0.003 | 0.013 | −0.017 |
| Gender = Female | 0 a | 0 a | 0 a | 0 a | |
| Age = 18~25 | −0.005 | −0.012 | −0.055 | 0.071 | |
| Age = 26~35 | 0.013 | 0.027 | 0.092 | −0.131 | |
| Age = 36~45 | 0.000 | 0.000 | 0.002 | −0.002 | |
| Age = ≥46 | 0 a | 0 a | 0 a | 0 a | |
| Occupation = Student | / | / | / | / | |
| Occupation = Courier/Food delivery person | / | / | / | / | |
| Occupation = Teacher | / | / | / | / | |
| Occupation = Retired | / | / | / | / | |
| Occupation = Doctor | / | / | / | / | |
| Occupation = Freelancer | / | / | / | / | |
| Occupation = Self-employed | / | / | / | / | |
| Occupation = Office worker | 0 a | 0 a | 0 a | 0 a | |
| Monthly income = ≤3500 | 0.015 | 0.041 | 0.259 | −0.315 | |
| Monthly income = 3501~5000 | 0.016 | 0.043 | 0.265 | −0.324 | |
| Monthly income = 5001~8000 | 0.013 | 0.036 | 0.237 | −0.286 | |
| Monthly income = 8001~12,000 | 0.016 | 0.042 | 0.262 | −0.320 | |
| Monthly income = ≥12,001 | 0 a | 0 a | 0 a | 0 a | |
| Travel attributes | Daily usage frequency = 1~2 times | 0.065 | 0.107 | 0.235 | −0.406 |
| Daily usage frequency = 2~4 times | 0.042 | 0.078 | 0.208 | −0.328 | |
| Daily usage frequency = 4~6 times | 0.072 | 0.115 | 0.240 | −0.427 | |
| Daily usage frequency = >6 times | 0 a | 0 a | 0 a | 0 a | |
| Daily usage duration = 0.5 h | 0.002 | 0.005 | 0.022 | −0.029 | |
| Daily usage duration = 1 h | 0.020 | 0.044 | 0.139 | −0.203 | |
| Daily usage duration = 2 h | −0.001 | −0.002 | −0.008 | 0.010 | |
| Daily usage duration = 2~4 h | 0.000 | 0.000 | −0.002 | 0.003 | |
| Daily usage duration = 4~9 h | 0.004 | 0.009 | 0.038 | −0.050 | |
| Daily usage duration = 9 h and above | 0 a | 0 a | 0 a | 0 a | |
| Travel purpose = Commuting | −0.008 | −0.019 | −0.076 | 0.102 | |
| Travel Purpose = Child pickup/drop-off | 0.000 | 0.000 | 0.000 | 0.000 | |
| Travel purpose = Work-related | −0.001 | −0.002 | −0.009 | 0.012 | |
| Travel purpose = Leisure/Recreation | −0.005 | −0.011 | −0.044 | 0.060 | |
| Travel purpose = Transfer | −0.001 | −0.001 | −0.005 | 0.007 | |
| Travel purpose = Other | 0 a | 0 a | 0 a | 0 a | |
| Satisfaction with current e-bike usage | −0.004 | −0.009 | −0.036 | 0.048 | |
| Need to replace e-bike under new standard = Yes | 0.004 | 0.010 | 0.042 | −0.056 | |
| Need to replace e-bike under new standard = No | 0 a | 0 a | 0 a | 0 a | |
| Attitudes and perceptions | Increased usage cost | 0.002 | 0.005 | 0.021 | −0.029 |
| Reduced bike speed | −0.006 | −0.014 | −0.055 | 0.074 | |
| Limited bike choice | −0.001 | −0.001 | −0.005 | 0.007 | |
| Enhanced safety | −0.001 | −0.003 | −0.011 | 0.015 | |
| Strengthened regulation | 0.001 | 0.002 | 0.008 | −0.011 | |
| Improved environmental performance | −0.008 | −0.018 | −0.075 | 0.101 | |
| Extended battery life | 0.010 | 0.024 | 0.096 | −0.130 | |
| Usage frequency = 1~2 times * Extended battery life | −0.013 | −0.029 | −0.118 | 0.160 | |
| Usage frequency = 2~4 times * Extended battery life | −0.017 | −0.040 | −0.162 | 0.219 | |
| Usage frequency = 4~6 times * Extended battery life | −0.015 | −0.036 | −0.144 | 0.195 | |
| Usage frequency = >6 times * Extended battery life | 0 a | 0 a | 0 a | 0 a |
Note: * denotes that the interaction between two variables; a denotes that this category of the variable is redundant and therefore it is set to zero.
Table A5.
Coefficient estimation results of the model (all samples, without the satisfaction variable).
Table A5.
Coefficient estimation results of the model (all samples, without the satisfaction variable).
| Category | Variable | B | P | 95% CI | |
|---|---|---|---|---|---|
| Individual attributes | Gender = Male | 0.082 | 0.630 | −0.251 | 0.415 |
| Gender = Female | 0 a | . | . | . | |
| Age = 18~25 | 0.334 | 0.234 | −0.216 | 0.884 | |
| Age = 26~35 | 0.083 | 0.754 | −0.436 | 0.602 | |
| Age = 36~45 | 0.234 | 0.383 | −0.292 | 0.759 | |
| Age = ≥46 | 0 a | . | . | . | |
| Occupation = Student | 0.045 | 0.875 | −0.509 | 0.598 | |
| Occupation = Courier/Food delivery person | −0.646 | 0.008 | −1.120 | −0.172 | |
| Occupation = Teacher | 0.210 | 0.571 | −0.518 | 0.938 | |
| Occupation = Retired | 0.750 | 0.536 | −1.624 | 3.124 | |
| Occupation = Doctor | −0.657 | 0.210 | −1.684 | 0.370 | |
| Occupation = Freelancer | 0.947 | 0.398 | −1.249 | 3.143 | |
| Occupation = Self-employed | −0.108 | 0.692 | −0.642 | 0.426 | |
| Occupation = Office worker | 0 a | . | . | . | |
| Monthly income = ≤3500 | 0.790 | 0.098 | −0.145 | 1.724 | |
| Monthly income = 3501~5000 | 1.285 | 0.008 | 0.332 | 2.237 | |
| Monthly income = 5001~8000 | 0.858 | 0.081 | −0.106 | 1.821 | |
| Monthly income = 8001~12,000 | 0.590 | 0.242 | −0.398 | 1.578 | |
| Monthly income = ≥12,001 | 0 a | . | . | . | |
| Travel attributes | Daily usage frequency = 1~2 times | 0.599 | 0.300 | −0.534 | 1.732 |
| Daily usage frequency = 2~4 times | 0.721 | 0.331 | −0.732 | 2.174 | |
| Daily usage frequency = 4~6 times | −0.204 | 0.729 | −1.356 | 0.948 | |
| Daily usage frequency = >6 times | 0 a | . | . | . | |
| Daily usage duration = 0.5 h | 0.652 | 0.118 | −0.165 | 1.469 | |
| Daily usage duration = 1 h | 0.330 | 0.352 | −0.365 | 1.025 | |
| Daily usage duration = 2 h | 0.496 | 0.144 | −0.169 | 1.162 | |
| Daily usage duration = 2~4 h | 0.388 | 0.239 | −0.257 | 1.033 | |
| Daily usage duration = 4~9 h | 0.110 | 0.708 | −0.464 | 0.684 | |
| Daily usage duration = 9 h and above | 0 a | . | . | . | |
| Travel purpose = Commuting | 0.062 | 0.554 | −0.144 | 0.269 | |
| Travel Purpose = Child pickup/drop-off | −0.073 | 0.512 | −0.292 | 0.146 | |
| Travel purpose = Work-related | 0.022 | 0.835 | −0.187 | 0.232 | |
| Travel purpose = Leisure/Recreation | 0.115 | 0.273 | −0.091 | 0.322 | |
| Travel purpose = Transfer | −0.116 | 0.302 | −0.335 | 0.104 | |
| Travel purpose = Other | 0 a | . | . | . | |
| Need to replace e-bike under new standard = Yes | 0.145 | 0.499 | −0.276 | 0.566 | |
| Need to replace e-bike under new standard = No | 0 a | . | . | . | |
| Attitudes and perceptions | Increased usage cost | −0.275 | 0.038 | −0.534 | −0.016 |
| Reduced bike speed | 0.029 | 0.842 | −0.256 | 0.314 | |
| Limited bike choice | −0.056 | 0.670 | −0.314 | 0.202 | |
| Enhanced safety | −0.081 | 0.577 | −0.367 | 0.204 | |
| Strengthened regulation | −0.119 | 0.283 | −0.336 | 0.098 | |
| Improved environmental performance | 0.024 | 0.851 | −0.225 | 0.273 | |
| Extended battery life | 0.147 | 0.356 | −0.165 | 0.460 | |
| Usage frequency = 1~2 times * Extended battery life | −0.205 | 0.457 | −0.746 | 0.336 | |
| Usage frequency = 2~4 times * Extended battery life | −0.193 | 0.592 | −0.898 | 0.512 | |
| Usage frequency = 4~6 times * Extended battery life | 0.241 | 0.374 | −0.291 | 0.773 | |
| Usage frequency = >6 times * Extended battery life | 0 a | . | . | . | |
| Intercepts | Continued usage intention = 1/2 | −3.915 | 0.000 | −5.755 | −2.074 |
| Continued usage intention = 2/3 | −3.198 | 0.000 | −4.960 | −1.436 | |
| Continued usage intention = 3/4 | −1.508 | 0.082 | −3.206 | 0.190 | |
| Continued usage intention = 4/5 | 0.258 | 0.765 | −1.432 | 1.948 | |
Note: * denotes that the interaction between two variables; a denotes that this category of the variable is redundant and therefore it is set to zero.
Appendix B
Survey questionnaire
Part 1: Basic information
- What is your gender?
○ Male ○ Female
- 2.
- What is your age?
○ 18~25 ○ 26~35 ○ 36~45 ○ ≥46
- 3.
- What is your occupation?
○ Student ○ Courier/Delivery Person ○ Teacher ○ Retired
○ Doctor ○ Freelancer ○ Self-employed ○ Office Worker
- 4.
- What is your monthly income (CNY)?
○ ≤3500 ○ 3501~5000 ○ 5001~8000 ○ 8001~12,000 ○ ≥12,001
- 5.
- How often do you use an electric bike daily?
○ 1~2 times ○ 2~4 times ○ 4~6 times ○ >6 times
○ Do not use an electric bike
- 6.
- On average, how much time do you spend using an electric bicycle each day?
○ 0.5 h ○ 1 h ○ 2 h ○ 2~4 h ○ 4~9 h
○ >9 h ○ Do not use an electric bike
- 7.
- What is your primary purpose for using an electric bike?
○ Commuting ○ Child pickup/drop-off ○ Work-related
○ Leisure and entertainment ○ Transfer purposes ○ Other
- 8.
- How satisfied are you with your current electric bike usage?
○ Very dissatisfied ○ Dissatisfied ○ Neutral ○ Satisfied ○ Very satisfied
Part 2: Impact of the New National Standard Policy
On 31 December 2024, China released the “Safety Technical Standards for E-bikes” (GB17761-2024), and it came into effect on 1 September 2025. The new standard stipulates that compliant e-bikes must have a maximum speed of ≤25 km/h, the total bike weight using lead-acid batteries should be ≤63 kg (the total weight for other types is ≤55 kg), a motor power is ≤400 W, and a battery voltage is ≤48 V, and must be equipped with pedal-assist functionality and pass 3C certification.
- 9.
- Will you need to replace your electric bike following the new policy implementation?
○ Yes ○ No
- 10.
- What do you believe are the main effects of the new policy on you?
| Strongly Disagree | Disagree | Neutral | Agree | Strongly Agree | |
|---|---|---|---|---|---|
| Increased usage costs | ○ | ○ | ○ | ○ | ○ |
| Reduced bike speed | ○ | ○ | ○ | ○ | ○ |
| Limited bike choice | ○ | ○ | ○ | ○ | ○ |
| Enhanced safety | ○ | ○ | ○ | ○ | ○ |
| Strengthened regulation | ○ | ○ | ○ | ○ | ○ |
| Improved environmental performance | ○ | ○ | ○ | ○ | ○ |
| Extended battery life | ○ | ○ | ○ | ○ | ○ |
- 11.
- What is your willingness to continue using an electric bike in the future?
○ Very unwilling ○ Unwilling ○ Neutral ○ Willing ○ Very willing
References
- Jia, B.; Li, J.; Wang, Q. Understanding electric bike accidents through safe system approach in Guangzhou, China: A mixed-methods study. Systems 2025, 13, 261. [Google Scholar] [CrossRef]
- Song, M.; Wang, K.; Zhang, Y.; Li, M.; Qi, H.; Zhang, Y. Impact evaluation of bike-sharing on bicycling accessibility. Sustainability 2020, 12, 6124. [Google Scholar] [CrossRef]
- Meng, Q.; Hussain, S.; He, Y.; Lu, J.; Guerrero, J.M. Multi-timescale stochastic optimization for enhanced dispatching and operational efficiency of electric vehicle photovoltaic charging stations. Int. J. Electr. Power Energy Syst. 2025, 172, 111096. [Google Scholar] [CrossRef]
- Song, M.; Zhang, Y.; Li, M.; Zhang, Y. Accessibility of transit stops with multiple feeder modes: Walking and private-bike cycling. Sustainability 2021, 13, 3522. [Google Scholar] [CrossRef]
- Xing, X.; Wan, L.; Luo, F. Demand prediction for shared bicycles around metro stations incorporating STAGCN. PLoS ONE 2025, 20, e0328452. [Google Scholar] [CrossRef] [PubMed]
- Qian, Q.; He, J.; Shi, J. Analysis of factors influencing aberrant riding behavior of food delivery riders: A perspective on safety attitude and risk perception. Transp. Res. Part F Traffic Psychol. Behav. 2024, 100, 273–288. [Google Scholar] [CrossRef]
- National Standardization Administration of China. Safety Technical Specification for Electric Bicycles (GB 17761-2024). Available online: https://openstd.samr.gov.cn/bzgk/gb/newGbInfo?hcno=32E5D633E04B67FB241D100CA2A4A41D (accessed on 31 December 2024).
- Wu, D.; Ma, L.; Yan, X. Exploring the travel behavior of household-owned electric bikes with the consideration of nonlinear effects of factors with the aid of the generalized additive mixed model. Int. J. Sustain. Transp. 2024, 18, 1061–1071. [Google Scholar] [CrossRef]
- Wang, P.; Zhang, H.; Zhang, B.; Cheng, S.; Lu, F.; Zhang, T. Spatiotemporal variations of private e-bike trips with explainable data-driven technologies. Cities 2025, 158, 105712. [Google Scholar] [CrossRef]
- MacArthur, J.; Dill, J.; Person, M. Electric bikes in North America: Results of an online survey. Transp. Res. Rec. 2014, 2468, 123–130. [Google Scholar] [CrossRef]
- Wolf, A.; Seebauer, S. Technology adoption of electric bicycles: A survey among early adopters. Transp. Res. Part A Policy Pract. 2014, 69, 196–211. [Google Scholar] [CrossRef]
- Dong, C.; Dong, D.; Zhuge, C.; Zhen, L. Trip characteristics and decision-making behaviors modeling of electric bicycles riding. J. Jilin Univ. 2022, 52, 2618–2625. [Google Scholar]
- Zhu, Q. Exploration of electric bicycle development strategies based on behavioral intent characteristics analysis. Traffic Transp. 2025, 38, 115–118+127. Available online: https://kns.cnki.net/kcms2/article/abstract?v=29aDaWKg40HbaoBowbqzZKBBHDvX8pj6tRgk1mUo8ryb8_Ap8hgVK6xxh13xWRcKgXwvP3HiGWXFjU4n1nsRD1IyoHWTn2zkdeVDPk3VpWxeEfG-QXSfeJoUaM36Hq9Dw91Kfb_uokUc25akfZKeszH9vUblnPb-u2DdJaFyTwiYnKeSfpFohg==&uniplatform=NZKPT&language=CHS (accessed on 7 August 2025).
- Bigazzi, A.; Wong, K. Electric bicycle mode substitution for driving, public transit, conventional cycling, and walking. Transp. Res. Part D Transp. Environ. 2020, 85, 102412. [Google Scholar] [CrossRef]
- Hagedorn, T.; Meier, M.; Wessel, J. Electrifying choices: How electric bicycles impact on mode choice and CO2 emissions. Transp. Res. Part D Transp. Environ. 2025, 142, 104682. [Google Scholar] [CrossRef]
- Grau-Escolano, J.; Bassolas, A.; Vicens, J. Cycling into the workshop: E-bike and m-bike mobility patterns for predictive maintenance in Barcelona’s bike-sharing system. EPJ Data Sci. 2024, 13, 48. [Google Scholar] [CrossRef]
- Jaber, A.; Al-Sahili, K.; Hassouna, F.M.; Al-Tanbour, B.; Juma, D. Bicycle choice: Machine learning approach to understanding university students’ attitudes toward cycling. Ain Shams Eng. J. 2025, 16, 103531. [Google Scholar] [CrossRef]
- Plazier, P.A.; Weitkamp, G.; van den Berg, A.E. The potential for e-biking among the younger population: A study of Dutch students. Travel Behav. Soc. 2017, 8, 37–45. [Google Scholar] [CrossRef]
- Qu, Y.; Wang, Q.; Wang, H. Urban Built Environment Perceptions and Female Cycling Behavior: A Gender-Comparative Study of E-bike and Bicycle Riders in Nanjing, China. Urban Sci. 2025, 9, 230. [Google Scholar] [CrossRef]
- Cherry, C.; Cervero, R. Use characteristics and mode choice behavior of electric bike users in China. Transp. Policy 2007, 14, 247–257. [Google Scholar] [CrossRef]
- Lin, X.; Wells, P.; Sovacool, B.K. The death of a transport regime? The future of electric bicycles and transportation pathways for sustainable mobility in China. Technol. Forecast. Soc. Change 2018, 132, 255–267. [Google Scholar] [CrossRef]
- Sundfør, H.B.; Fyhri, A. A push for public health: The effect of e-bikes on physical activity levels. BMC Public Health 2017, 17, 809. [Google Scholar] [CrossRef]
- Fyhri, A.; Heinen, E.; Fearnley, N.; Sundfør, H.B. A push to cycling—Exploring the e-bike’s role in overcoming barriers to bicycle use with a survey and an intervention study. Int. J. Sustain. Transp. 2017, 11, 681–695. [Google Scholar] [CrossRef]
- Das, H.; Kaur, A.; Ilavarasan, P.V. Purchasing e-Bikes: Prioritization of Decision Factors Using AHP. In Proceedings of the International Working Conference on Transfer and Diffusion of IT, Nagpur, India, 15–16 December 2023; pp. 178–189. [Google Scholar]
- Sönmez, S.F.; Graefe, A.R. Determining future travel behavior from past travel experience and perceptions of risk and safety. J. Travel Res. 1998, 37, 171–177. [Google Scholar] [CrossRef]
- Zabiulla, M.; Sahu, P.K.; Majumdar, B.B.; Bini, R.R. Can self-reliant societies be potential adopters of electric bicycles? Examining the role of sociopsychological influences among the university employees in India. Travel Behav. Soc. 2024, 37, 100849. [Google Scholar] [CrossRef]
- Popovich, N.; Gordon, E.; Shao, Z.; Xing, Y.; Wang, Y.; Handy, S. Experiences of electric bicycle users in the Sacramento, California area. Travel Behav. Soc. 2014, 1, 37–44. [Google Scholar] [CrossRef]
- Arsenio, E.; Dias, J.V.; Lopes, S.A.; Pereira, H.I. Assessing the market potential of electric bicycles and ICT for low carbon school travel: A case study in the Smart City of ÁGUEDA. Eur. Transp. Res. Rev. 2018, 10, 13. [Google Scholar] [CrossRef]
- Adorean, E.C.; Nofre, J.; Juan, L.; Moura, F. Mobility Patterns of Shared and Own E-Bikes and E-Scooters in Iberian Cities. Int. J. Sustain. Transp. 2025, 1–27. [Google Scholar] [CrossRef]
- Gumasing, M.J.J. Exploring Factors Influencing E-Bike Adoption Among Filipino Commuters: An Integrated Diffusion of Innovation and Technology Acceptance Model. World Electr. Veh. J. 2025, 16, 113. [Google Scholar] [CrossRef]
- Julio, R.; Monzon, A. Long term assessment of a successful e-bike-sharing system. Key drivers and impact on travel behaviour. Case Stud. Transp. Policy 2022, 10, 1299–1313. [Google Scholar] [CrossRef]
- Simsekoglu, Ö.; Klöckner, C. Factors related to the intention to buy an e-bike: A survey study from Norway. Transp. Res. Part F Traffic Psychol. Behav. 2019, 60, 573–581. [Google Scholar] [CrossRef]
- Encyclopedia, B. Nanjing City. Available online: https://baike.baidu.com/item/%E5%8D%97%E4%BA%AC%E5%B8%82/2207627#10 (accessed on 30 December 2024).
- Daily, N. Temporary License Plates for Electric Bikes Valid Until the End of Next Year, Early Replacement Eligible for up to 800 CNY Subsidy. Available online: https://www.nanjing.gov.cn/zt/tddgmsbgxhxfpyjhxnjzxd/lssx20240516/202410/t20241023_4991603.html (accessed on 11 October 2024).
- Ye, X.; Hu, Y.; Liu, L.; Wang, T.; Yan, X.; Chen, J. Analyzing takeaway e-bikers’ risky riding behaviors and formation mechanism at urban intersections with the structural equation model. Sustainability 2023, 15, 13094. [Google Scholar] [CrossRef]
- Chen, H.; Guo, Y.; Li, L. Promoting Sustainable Mobility on Campus: Uncovering the Behavioral Mechanisms Behind Non-Compliant E-Bike Use Among University Students. Sustainability 2025, 17, 7147. [Google Scholar] [CrossRef]
- Davis, F.D.; Bagozzi, R.P.; Warshaw, P.R. Technology acceptance model. J. Manag. Sci. 1989, 35, 982–1003. [Google Scholar]
- Deng, Y.; Zhao, P.J.T. The determinants of shared bike use in China. Transportation 2023, 50, 1–23. [Google Scholar] [CrossRef]
- Zheng, Z.; Zhang, J.; Zhang, L.; Li, M.; Rong, P.; Qin, Y. Understanding the impact of the built environment on ride-hailing from a spatio-temporal perspective: A fine-scale empirical study from China. Cities 2022, 126, 103706. [Google Scholar] [CrossRef]
- Zhang, B.; Chen, S.; Ma, Y.; Li, T.; Tang, K. Analysis on spatiotemporal urban mobility based on online car-hailing data. J. Transp. Geogr. 2020, 82, 102568. [Google Scholar] [CrossRef]
- Aguilera-García, Á.; Gomez, J.; Sobrino, N. Exploring the adoption of moped scooter-sharing systems in Spanish urban areas. Cities 2020, 96, 102424. [Google Scholar] [CrossRef]
- Du, M.; Cheng, L.; Li, X.; Yang, J. Acceptance of electric ride-hailing under the new policy in Shenzhen, China: Influence factors from the driver’s perspective. Sustain. Cities Soc. 2020, 61, 102307. [Google Scholar] [CrossRef]
- Du, M.Y.; Cheng, L.; Li, X.F.; Xiong, J.Y. Analyzing the acceptance of electric ridesharing by drivers with and without local registered permanent residence. J. Clean. Prod. 2020, 265, 121868. [Google Scholar] [CrossRef]
- Li, S.; Zhao, P. The determinants of commuting mode choice among school children in Beijing. J. Transp. Geogr. 2015, 46, 112–121. [Google Scholar] [CrossRef]
- Ma, W.; Liu, Z.; Li, R. Effect of helmet-wearing regulation on electric-bike riders: A case study of two cities in China. Transp. Saf. Environ. 2024, 6, tdad038. [Google Scholar] [CrossRef]
- Owais, M.; Moussa, G.S. Global sensitivity analysis for studying hot-mix asphalt dynamic modulus parameters. Constr. Build. Mater. 2024, 413, 134775. [Google Scholar] [CrossRef]
- Owais, M.; El Sayed, M.A. Red light crossing violations modelling using deep learning and variance-based sensitivity analysis. Expert Syst. Appl. 2025, 267, 126258. [Google Scholar] [CrossRef]
Disclaimer/Publisher’s Note: The statements, opinions and data contained in all publications are solely those of the individual author(s) and contributor(s) and not of MDPI and/or the editor(s). MDPI and/or the editor(s) disclaim responsibility for any injury to people or property resulting from any ideas, methods, instructions or products referred to in the content. |
© 2025 by the authors. Licensee MDPI, Basel, Switzerland. This article is an open access article distributed under the terms and conditions of the Creative Commons Attribution (CC BY) license (https://creativecommons.org/licenses/by/4.0/).