Abstract
Energy consumption accounts for a significant proportion of China’s building operations, exhibiting notable regional variations influenced by geographic characteristics. Factors affecting building energy consumption during transitional seasons are particularly complex in severely cold regions. This study selected a university library in Hohhot, Inner Mongolia Autonomous Region, as its research subject, employing a hybrid TCN–transformer model to conduct predictive experiments on short-term building energy consumption. We first collected environmental data from Hohhot’s spring–summer transitional period. Following parameter screening and preprocessing, this dataset was input into the TCN–transformer model. By integrating TCN with transformer’s self-attention mechanism, the model addresses the region’s high noise levels and non-stationarity, enabling precise forecasting. To validate the effectiveness of the proposed model, a comparative analysis was conducted against traditional models, namely SVR and LSTM, on the same dataset. The results demonstrated that TCN–transformer achieves superior comprehensive performance, evidenced by a higher prediction accuracy (R2 = 0.8765) and lower error (MAE = 0.24603, RMSE = 0.32829), outperforming the baseline models. This research provides an innovative and efficient hybrid modelling approach and technical methodology for predicting building energy consumption during transitional seasons in severely cold regions, holding positive implications for enhancing building energy efficiency and promoting sustainable development.
1. Introduction
In recent years, China has made significant strides in energy efficiency. According to data from the National Development and Reform Commission, during the first three years of the 14th Five-Year Plan period, the nation’s cumulative energy consumption intensity decreased by approximately 7.3% []. However, while meeting the energy demands for high-quality development, the building sector accounts for roughly 33% of total energy consumption []. For frigid regions experiencing prolonged, bitter winters and brief summers accompanied by sharply increased cooling demands [], the impact of transitional seasons on building energy consumption remains equally significant. Seasonal transitions trigger dynamic interactions among meteorological factors such as solar radiation intensity, wind speed, and wind direction [], inducing temperature fluctuations []. This causes the thermal performance of buildings to dynamically alter in response to ambient temperature and outdoor environmental changes [], leading to lagging indoor temperature regulation during abrupt outdoor temperature shifts and consequently affecting indoor thermal comfort [,]. Building energy consumption exhibits pronounced non-linear and multi-scale characteristics, rendering traditional forecasting methods inadequate for capturing its dynamic patterns with precision. Although existing research has achieved some progress in energy consumption prediction accuracy through hybrid models [], the strong coupling between climate abruptness [] and building thermal performance [] poses significant challenges for models in long-term dependency capture and the integration of multivariate time-series features. Among various public buildings, university libraries exhibit highly representative energy consumption patterns in severely cold regions. This is due to their time-varying occupancy density, concentrated equipment operation, and typically comprehensive central air-conditioning systems. Such libraries effectively reveal energy consumption patterns arising from the interaction between climatic factors and building operations.
Addressing the challenge of building energy consumption forecasting in this specific climatic zone, this study’s core objective was to construct a prediction model based on a hybrid TCN–transformer architecture [,], aiming to achieve high-precision, robust short-term energy consumption forecasting for public buildings in cold regions during the transitional season. By integrating features from TCN (temporal convolutional network) [] and transformer models [], the approach simultaneously addresses the high noise levels and non-stationarity inherent in severely cold region data while providing a unified framework for the interaction of multi-source, heterogeneous data features. This enables precise forecasting of meteorological variables such as temperature fluctuations, snowfall amounts, and snow-melt rates during the transitional season. Its principal innovations comprise the inaugural application of a TCN–transformer hybrid architecture for transitional season energy consumption forecasting in public buildings within frigid regions, enhanced model interpretability through the incorporation of physically meaningful features such as indoor–outdoor temperature differentials and lagged energy consumption, and validation of the model’s superior short-term forecasting capabilities using empirical data from a representative university library. This provides a novel technical tool for refined energy management in buildings within such climatic zones, and implement China’s carbon peak and carbon neutrality strategy, thereby advancing the United Nations Sustainable Development Goals.
2. Relevant Literature
2.1. Current Research on Building Energy Consumption Forecasting
Current methods for forecasting energy consumption, both domestically and internationally, encompass statistical approaches such as time-series analysis [] and regression analysis []; machine learning techniques, including neural networks, support vector machines, and random forests [,]; and engineering-based models such as EnergyPlus, DeST, TRNSYS, DOE-2, and eQuest []. Hybrid methodologies combine the strengths of multiple models to enhance forecasting accuracy [,].
Based on the forecasting horizon, building energy consumption forecasting is typically categorised into long-term, medium-term, and short-term predictions, with the selection of forecasting methods dependent on the time frame []. Short-term building energy forecasting is closely linked to the daily operational patterns of energy systems, providing practical guidance for energy-saving measures []. Based on short-term forecast results, adjustments can be made to the operational modes of building energy systems and optimise resource allocation []. Wei Shangfu and Bai Xiaoqing proposed an SSA–CNN–BiGRU hybrid model. This approach integrates singular spectral analysis (SSA) decomposition, convolutional neural network (CNN) feature extraction, and bidirectional gated recurrent unit (BiGRU) dynamic modelling. Applied to UK office building energy consumption data, it achieved multistep-ahead forecasting, significantly enhancing both accuracy and stability in short-term predictions []. Wu Wenyu et al. proposed a combination forecasting model based on clustering results, achieving daily short-term predictions using 15 days of campus building electricity consumption data, with performance surpassing long short-term memory (LSTM) networks and support vector regression (SVR) []. Federico Divina et al. proposed the k–CNN–LSTM framework, integrating k-means clustering, CNN feature extraction, and LSTM temporal modelling. Validated using Indian IIT Bombay building data, it demonstrated more accurate energy consumption forecasting []. Yu, Ying et al. introduced an ECG–ICEEMDAN–BILSTM model for short-term energy consumption forecasting in university dormitories. This demonstrated superior predictive accuracy, yet limitations in generalisability and long-term application were acknowledged []. Jiao, Yinghao et al. proposed a hybrid energy consumption prediction model integrating density-based clustering (DBSCAN), Lagrange interpolation, CEEMDAN, FuzzyEn, random forest (RF), CNN, variant gated recurrent units (GRUs), and self-attention mechanisms. Experiments demonstrated its effective control of prediction errors, outperforming existing algorithms []. Wenqiang Cao et al. proposed a comprehensive energy consumption prediction model combined with the SHAP method, validating its high predictive accuracy while investigating data adaptation and feature quantity []. Xinbin Liang et al. proposed a hybrid model integrating deep ensemble and autoregressive approaches. Validated using 50 buildings’ measured data, this model achieved CV-RMSE reductions of 28.7%, 35.98%, and 18.47% compared to LSTM, DE, and ARIMA, respectively, demonstrating robust adaptability across diverse building types []. Consequently, short-term energy consumption forecasting plays a more prominent role in optimising energy utilisation, safeguarding building thermal environments, and reducing energy costs.
2.2. TCN—Current Applications of Transformer Models
Since the introduction of the TCN–transformer model [], it has seen extensive application across multiple domains. It enables precise forecasting of meteorological data during transitional seasons, including temperature variations, snowfall amounts, and snow-melt rates. A core tool in sequence modelling, the TCN (time convolutional network) architecture is specifically designed for processing time-series data. By combining causal convolutions with dilated convolutions, it effectively captures long-term dependencies within sequences []. Its core mechanism leverages the parallel computation advantages of convolutional layers while preserving temporal causality, enabling efficient extraction of both local and global features from sequence data. Since its inception, the transformer model has demonstrated exceptional performance in natural language processing. Its applications span precise multilingual semantic translation in machine translation tasks [], modelling complex dynamic patterns in time-series forecasting [], and integrating semantic understanding with knowledge retrieval in question-answering systems [].
The TCN–transformer model also demonstrates outstanding performance in current research. Sheng Ruixiang and Zhang Xiaoyu proposed the TCN–transformer composite model, where TCN extracts spatial features while transformer captures long-term temporal dependencies. Validated on the DKASC dataset, this model effectively enhances short-term photovoltaic power prediction accuracy under varying weather conditions []. Zhang Hong and Li Feng et al. proposed the SolarFormer prediction method, optimising the encoder through feature selection and pyramid attention while enhancing the decoder by integrating TCNs with sunrise–sunset constraints. This approach significantly reduced RMSE, MAE, and SMAPE on the San Yō dataset []. Chen H et al. addressed early-stage time-series classification tasks by introducing a TCN–transformer framework to overcome RNN limitations. By integrating feature extraction and designing a balanced loss function, its effectiveness and accuracy were validated across ten datasets []. Nikhil Thapa et al. constructed a beat-tracking model combining transformers and TCNs, leveraging the former for capturing global dependencies and the latter for local patterns. It achieved performance comparable to state-of-the-art methods on multiple music datasets with fewer parameters while providing interpretability through Grad-CAM []. Linhan Wu et al. proposed a TCN–transformer hybrid model, combining TCN’s local pattern capture capability with transformer’s parallel processing advantage. Case studies validated its high accuracy and generalisation ability in time-series and large-scale photovoltaic data prediction []. Shengcai Zhang et al. introduced a wind speed prediction model based on VMD–TCN–transformer, utilising DBO to optimise signal decomposition. Experiments across three datasets demonstrated an average R2 improvement of 52.1%, with multiple error metrics outperforming six comparison models [].
In summary, each model exhibits superior performance on specific datasets. Table 1 provides a systematic comparison of primary forecasting model categories, highlighting their limitations in addressing the specific challenges of this study.

Table 1.
Comparison of primary forecasting model categories.
3. Research Methodology
3.1. Research Overview
We selected Hohhot City in the Inner Mongolia Autonomous Region, a city representative of China’s severely cold northern regions, as the research area. We first collected, organised, and analysed environmental data from the spring–summer transition period in this region. Subsequently, the TCN–transformer model was applied to building energy consumption forecasting (Figure 1), enabling precise capture of actual prediction data. This analysis examined fluctuations in building energy demand during specific phases, ultimately guiding optimisation of the building’s energy management system to enhance energy utilisation efficiency and reduce operational costs.
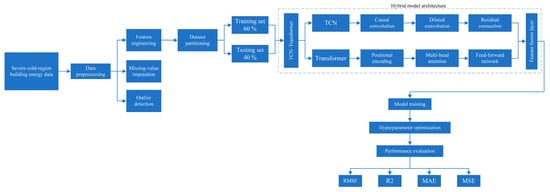
Figure 1.
Energy consumption forecasting implementation flowchart.
3.2. Selection of Research Subjects
We selected the transitional period between spring and summer in Hohhot, a severely cold region, as the research space for energy consumption forecasting. Based on multi-factor considerations (Table 2), it was determined that public buildings in this area represent the typical energy consumption characteristics of public buildings in severely cold Zone I cities in northern China. The transitional period from 28 April to 5 May 2024 was selected, comprising 192 datasets as the preliminary research dataset. This period represents a critical phase where natural environmental regulation interacts with active building operations. Although the data span is brief, it comprehensively covers weekdays, weekends, and public holidays (including Labour Day), enabling effective capture of typical energy consumption fluctuations during transitional days. This makes it suitable for validating model architecture feasibility and short-term forecasting performance. Overall, the selection of the study subject provides a high-quality energy consumption sample for public buildings in cold northern regions, offering research value across multiple dimensions, including scale, layout, systems, management, and geography.

Table 2.
Multi-factor considerations for research subjects.
3.3. Parameter Selection and Data Preprocessing
3.3.1. Preliminary Selection of Model Input Parameters
Whether employing energy consumption forecasting methods based on statistical approaches, traditional machine learning techniques, or deep learning methodologies, the fundamental task lies in selecting targeted input parameters for the predictive model. Based on the preliminary research parameters outlined above, data collection and statistical analysis were conducted alongside the formulation of a data acquisition plan. The energy consumption data of the library building, alongside meteorological data for the region and building usage patterns, were established as the initial research parameters (Table 3).

Table 3.
Factors influencing building energy consumption.
Building energy consumption data were obtained from the school’s smart water and electricity energy monitoring platform to ensure data accuracy and reliability. Regarding meteorological parameters, indoor temperature and humidity were monitored in real time via sensors (Vintron RC-4HC temperature and humidity recorders, the equipment is manufactured by Jiangsu Elitech Electric Co., Ltd., and it was sourced from Xuzhou City, Jiangsu Province, China.) installed within the library over eight consecutive days (encompassing public holidays, closure days, weekdays, and weekends). Other parameter data were extracted from the China Meteorological Administration website for Hohhot meteorological parameters. Energy consumption usage was determined based on the library’s daily opening hours and holiday schedules. Following data collation, we obtained complete datasets for the period from 28 April to 5 May 2024, comprising 192 sets.
Statistical analysis of the data (Figure 2) revealed pronounced environmental fluctuations during Hohhot’s spring-to-summer transition period. From 28 April to 5 May, the university library’s outdoor temperature (Temp Out) exhibited significant variation, oscillating widely between 8.6 °C and 28.5 °C. Alternating cold and warm air masses caused substantial short-term temperature fluctuations. Outdoor humidity (humidity out) exhibited some variation, but to a lesser extent than temperature, influenced by precipitation and wind direction. Wind speed and wind direction angle fluctuated frequently, with wind speeds exceeding 6 m/s during specific periods. Mean total cloud cover and visibility also exhibited instability, with cloud cover affecting solar radiation and air temperature, while visibility correlated with particulate matter concentration and humidity.
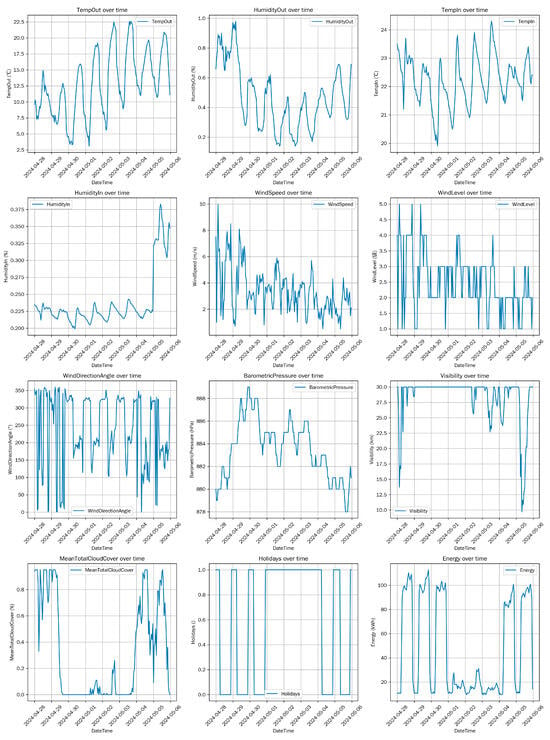
Figure 2.
Data analysis.
Selecting this time frame demonstrated high compatibility with the TCN–transformer model, effectively addressing the complexity of environmental data during the spring–summer transition. The TCN component captures local patterns such as short-term temperature fluctuations and sudden wind speed spikes, while transformer captures global connections between different environmental variables. This enhances the ability to predict environmental states, aiding in providing more accurate support for fields such as meteorological forecasting and energy management.
3.3.2. Parameter Correlation Analysis
At present, twelve input parameters for the load forecasting model have been identified, each exerting varying degrees of influence on building energy consumption. Pearson correlation analysis heat maps (Figure 3) reveal significant correlations between the collected energy consumption data and multiple environmental factors. Energy consumption exhibits positive correlations with outdoor temperature, indoor humidity, outdoor humidity, and wind speed and a negative correlation with cloud cover. Specifically, energy consumption increases during daytime when temperatures rise, indoor humidity increases, outdoor humidity is high, or wind speeds are strong. Conversely, energy consumption decreases when cloud cover is greater. Furthermore, holiday periods significantly impact energy consumption: reduced footfall during public holidays leads to a substantial decrease in the number and duration of equipment operations, resulting in markedly lower energy consumption.
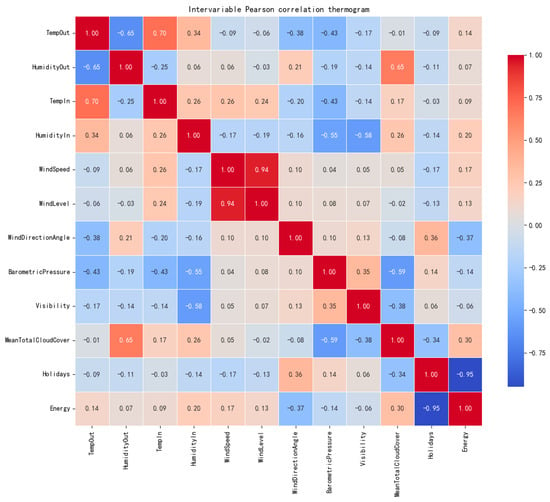
Figure 3.
Heatmap of Pearson correlation coefficients for each feature.
In building energy consumption analysis, although the direct linear correlation between indoor and outdoor temperatures and energy consumption is relatively weak (Figure 3), in-depth analysis reveals that environmental factors exert a significant non-linear combined influence on energy consumption. Figure 4 demonstrates that within the same temperature range, varying humidity levels lead to substantial differences in energy consumption, revealing a coupled temperature–humidity effect. Figure 5 further indicates a pronounced “lag” and “non-linear” relationship between air-conditioning energy consumption and outdoor temperature. Only when the outdoor temperature exceeds a certain threshold does air-conditioning energy consumption begin to rise significantly, and this increase is not linear. This phenomenon may be related to the delayed effect of indoor and outdoor temperature changes. In practical building environments, indoor temperatures do not adjust instantaneously to outdoor temperature changes. This delay arises from the combined effects of building thermal inertia, wall thermal transfer characteristics, and the response time of air-conditioning systems (currently the primary energy-consuming systems). Consequently, using only indoor and outdoor temperatures as model inputs may fail to accurately reflect the dynamic heat exchange processes between building interiors and exteriors or patterns in energy consumption variation.
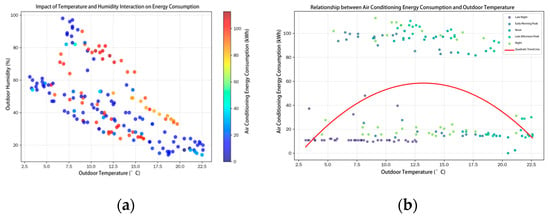
Figure 4.
(a) Effect of temperature and humidity interaction on building energy consumption. (b) Relationship between building energy consumption and outdoor temperature.
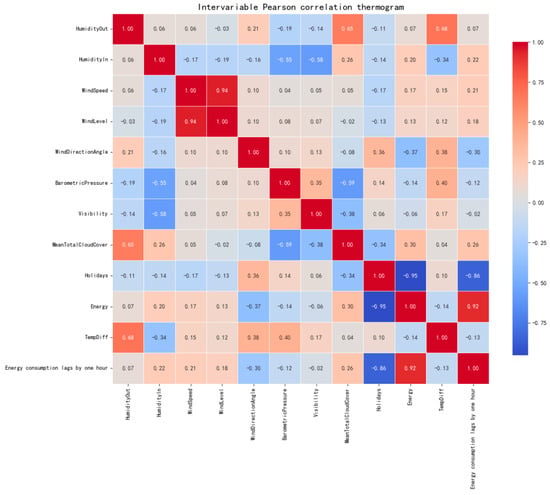
Figure 5.
Pearson correlation coefficient heat diagram of the new feature.
To capture the complex relationship between building energy consumption and environmental factors, two newly constructed features were introduced: indoor–outdoor temperature difference and one-hour lagged energy consumption. As demonstrated by the correlation heat map of the newly added features in Figure 6, this feature engineering strategy achieved the desired outcome. The correlation between indoor–outdoor temperature difference and energy consumption proved significantly stronger than that of indoor or outdoor temperature alone, aligning more closely with the physical principles of building thermal science. Concurrently, lagged energy consumption exhibited a strong positive correlation with current consumption, successfully capturing the temporal inertia of energy usage. The introduction of these two new feature sets—indoor–outdoor temperature difference parameters and one-hour lagged data parameters—has been implemented. The indoor–outdoor temperature differential provides a more intuitive reflection of the driving factors behind heat exchange within and outside the building, as heat transfer is primarily driven by temperature gradients. The one-hour lag data parameter meanwhile captures the delayed effects of energy consumption changes, aiding the model in better understanding the dynamic temporal patterns of energy usage.
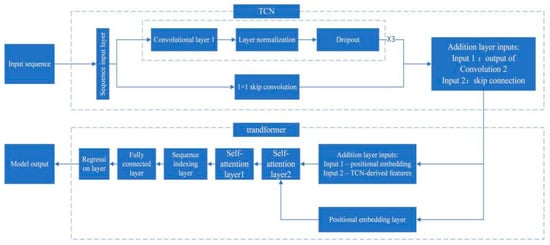
Figure 6.
TCN–transformer model.
Based on the above analysis, we removed the indoor and outdoor temperatures as features (Figure 6) and used the indoor–outdoor temperature difference and 1 h lagged energy consumption data instead. This allows us to more accurately capture the patterns of building energy consumption while retaining the environmental impact, thereby improving the prediction accuracy and applicability of the model.
3.3.3. Data Preprocessing
During the actual data collection process, issues such as missing values and outliers may arise, which can impact the model’s training effectiveness and predictive accuracy. Therefore, to ensure data quality and model precision, data preprocessing was required (Figure 7). We first employed the Lagrange interpolation method to address missing values, estimating missing data points based on the values of adjacent data points. Concurrently, to identify outliers, we adopted a statistical approach combined with comprehensive judgement based on building operational logic: (1) employing the Z-score method, where values exceeding the mean by ±3 standard deviations were classified as statistical outliers; and (2) considering the library’s operational characteristics, physically implausible values—such as negative energy consumption data or readings exceeding the historical maximum operational load (determined as 350 kW based on platform records and equipment nameplate specifications)—were deemed anomalous. Upon examining the data extracted from the database, partial anomalies were identified. In accordance with the aforementioned criteria and considering the library’s actual floor area and usage characteristics, the anomalous data points detected were removed. To mitigate the adverse effects of outlier samples and facilitate comprehensive comparative evaluations and correlation calculations, all parameters underwent normalisation processing. The normalisation formula is presented in Equation (1):
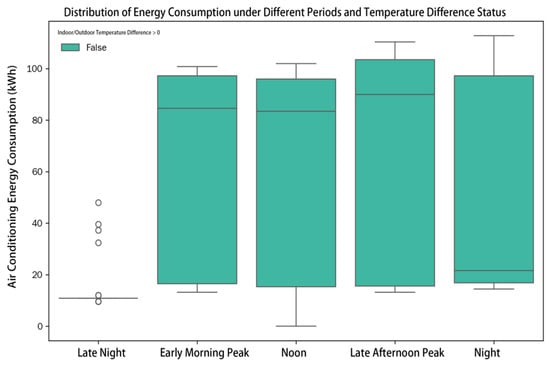
Figure 7.
Peak-and-valley law of energy consumption.
is the dataset’s minimum value.
is the dataset’s maximum value.
Normalisation scales data to the range [0, 1], enhancing model training efficiency and convergence speed. Finally, the preprocessed data needed to be divided into training and test sets in chronological order, with the training set covering the time range from 28 April 2024 00:00:00 to 2 May 2024 05:00:00 and the test set from 2 May 2024 06:00:00 to 5 May 2024 23:00:00, allocated in a 6:4 ratio. The training set was used to train the model, while the test set was employed to evaluate the model’s generalisation capability. This partitioning method prevents data leakage, enabling effective assessment of the model’s performance on unseen data and ensuring robust predictive accuracy and generalisation performance.
3.4. TCN–Transformer Model Construction
Based on the preceding analysis, hybrid learning models combine the strengths of multiple approaches to significantly enhance predictive accuracy.
The TCN–transformer model (Figure 8) is now constructed: utilising a three-layer TCN achieves an optimal balance between parameter efficiency (10 K) and receptive field (29 steps), making it suitable for the selected short-term forecasting period (28 April to 5 May). Following data preprocessing and feature engineering, the model effectively captures temporal dependencies such as daily electricity consumption curves and diurnal temperature variations. The positional embedding layer and feature fusion layer enable temporal order perception while embedding spatial information into time-series features. Transformer’s two-layer multi-head attention mechanism focuses on global dependencies, processing features through index layers, fully connected layers, and regression layers to generate final predictions. The model’s self-attention mechanism successfully identified valuable temporal patterns in energy consumption. As illustrated in Figure 9, it clearly captures the typical dual-peak consumption pattern on working days: one peak occurring between 08:00 and 10:00 (opening hours and equipment start-up), and another between 14:00 and 16:00. Simultaneously, it identified exceptional cases, such as the Labour Day holiday (1 May), where the morning peak vanishes entirely, revealing a distinctive low-energy consumption pattern characteristic of public holidays. This demonstrates the model’s capacity not only to learn general patterns but also to perceive special events.
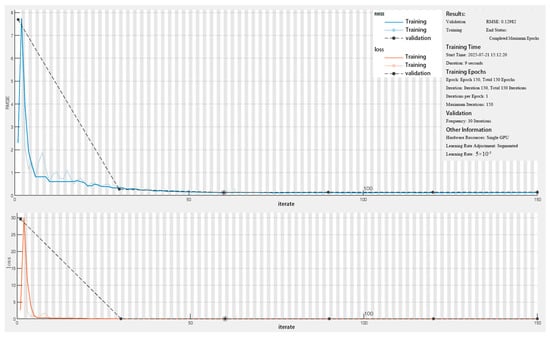
Figure 8.
Model training.
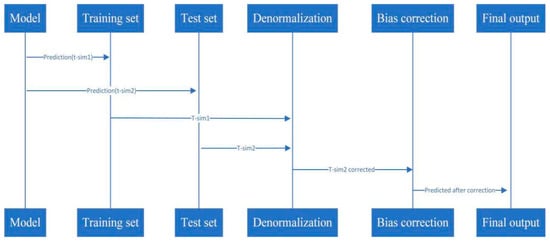
Figure 9.
Verification of predicted values.
3.5. Model Training Phase with Denormalisation and Validation
This study employed a hybrid training strategy based on an adaptive optimisation framework (Figure 10). Model parameter selection was guided by the root mean square error (RMSE) metric achieved on an independent validation set. This validation set comprised the final 40% of the training data, partitioned chronologically. Specifically, the Adam optimiser was utilised with an initial learning rate of 0.005 to accelerate early convergence, employing a stepwise decay strategy where the learning rate was reduced to 0.1 of its original value every 50 iterations. Additionally, L2 weight regularisation was introduced to control model complexity, set at 0.008, alongside dropout techniques. This involved randomly discarding 20% of neurons per layer to prevent overfitting. Regarding training parameters, training iterations were capped at 150. Data shuffling occurred before each iteration, with validation performed every 30 iterations. The model yielding the lowest validation loss was ultimately saved.
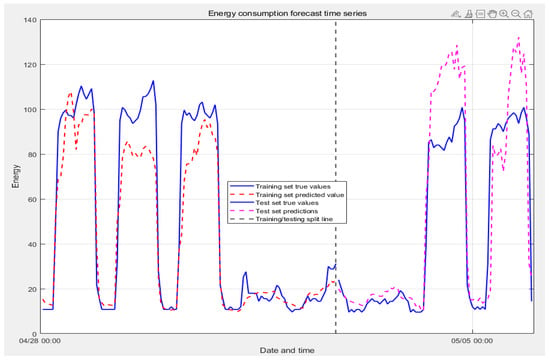
Figure 10.
Comparison of energy consumption forecasts and actual results.
3.6. Denormalisation and Validation
A crucial step following model training (Figure 11) involves performing a forward pass on the input features of both the training and test sets to obtain the model’s prediction results. These predictions initially exist in normalised form, meaning they are scaled to the range [0, 1]. However, to endow these predictions with practical physical meaning and enable comparison with the original energy consumption data, they must be converted back to the range of the raw data. This process is termed denormalisation.
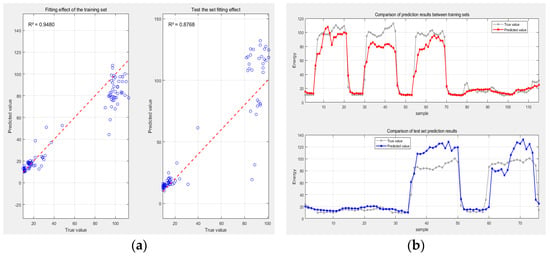
Figure 11.
(a) Comparison of training and test set results.(The blue dots represent the correspondence between the actual predicted values and the true values for each sample; the red line indicates the reference line for perfect prediction.) (b) Fitting comparison chart of training set and test set.
Denormalization uses Formula (2):
These variables represent the maximum and minimum values within the original energy consumption data. Through this formula, the normalised predicted energy consumption values are converted back into their original physical units, thereby enabling intuitive comparison and analysis against actual energy consumption values.
To validate the practical effectiveness and applicability of this model, we employed multiple scientifically rigorous evaluation metrics (Table 4) to conduct a comprehensive and in-depth assessment and analysis of the TCN–transformer model’s performance in building energy consumption forecasting. The evaluation metrics encompassed prediction accuracy and error range dimensions, thereby validating its effectiveness and reliability under the complex conditions of the spring–summer transition season in severely cold regions. This provides robust technical support and a decision-making basis for subsequent building energy-saving design, operational management, and energy consumption optimisation in these areas.

Table 4.
Evaluation index formulae.
4. Building Energy Consumption Forecast Results
4.1. Prediction Results
As shown in Figure 12, the TCN–transformer model demonstrates excellent performance in building energy consumption forecasting. On the training set, the solid blue line (actual training set values) closely aligns with the dashed red line (predicted training set values), indicating the model fits the training data well and accurately captures energy consumption trends. On the test set, the solid blue line (actual test set values) remains relatively close to the dashed pink line (predicted test set values). Although discrepancies exist and certain peaks are not entirely accurate, the overall trend aligns, demonstrating the model’s generalisation capability and predictive performance on unseen data. This indicates that the TCN–transformer model is suitable for building energy consumption forecasting tasks, providing reliable support for energy conservation management.
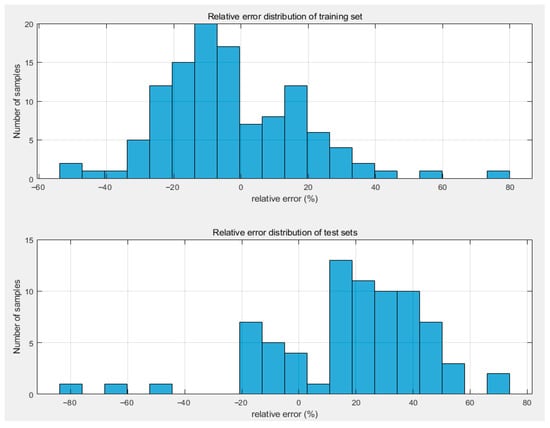
Figure 12.
Relative error distribution of training and test sets.
4.2. Comparison of Predictive Model Evaluation Metrics
The TCN–transformer model demonstrated outstanding performance in building energy consumption forecasting tasks (Figure 11). On the training dataset, the model achieved an R2 value of 0.96572, indicating it explains approximately 96.57% of data variation. This signifies excellent model fit and high predictive accuracy. In contrast, on the test set, the R2 value was 0.87403, accounting for approximately 87.40% of the data variation. Although the fit was slightly less favourable than on the training set, the R2 value indicates that the model effectively extracted features and patterns from the data, capturing the overall trend well. It can predict the energy consumption of new building samples and is suitable for building energy consumption prediction tasks.
From the relative error distribution (Figure 12), the relative errors in the training set are predominantly concentrated between −20% and 20%, with only a very small number of samples exhibiting larger relative errors, indicating the presence of some extreme prediction errors. In contrast, the relative errors in the test set are relatively dispersed, with some exceeding 20%, suggesting that the model’s predictions for certain test samples diverge significantly from the actual values. Regarding error metrics, the training set exhibits MAE = 0.12377, MSE = 0.02990, and RMSE = 0.17293, which are generally lower than the corresponding metrics for the test set (test set MAE = 0.24603, MSE = 0.10777, RMSE = 0.32829). This further indicates that the model exhibits superior fitting performance on the training set, with increased error on the test set. Nevertheless, considering the absolute magnitude of the errors, both training and test set errors remain at relatively low levels. This demonstrates the model’s effective extraction of features and patterns within the data, indicating strong predictive capability for building energy consumption and suitability for building energy consumption forecasting tasks. Overall, the model demonstrates excellent fitting performance on the training set. Although its generalisation capability on the test set is somewhat limited, it still possesses a certain degree of predictive capability.
Based on the aforementioned evaluation metrics, the TCN–transformer model demonstrates excellent performance on the training set with favourable fitting results. On the test set, although error metrics show an increase, it consistently outputs predictions close to actual values, exhibiting a degree of generalisation capability. These findings validate the effectiveness, accuracy, and generalisation potential of the TCN–transformer model for building energy consumption forecasting tasks.
4.3. Baseline Model Comparison
We selected support vector regression (SVR) and long short-term memory (LSTM) networks as baseline models for a performance comparison with the proposed TCN–transformer. All models were trained and evaluated on identical training and testing datasets to ensure a fair comparison. As presented in Table 5, the TCN–transformer model demonstrated superior overall performance on the test set. Specifically, compared to the LSTM model, the TCN–transformer achieved a discernible improvement across all evaluation metrics, indicating its more powerful capability for learning temporal patterns. When compared against the strong-performing SVR baseline, TCN–transformer achieved an order-of-magnitude reduction in the absolute error metrics (MAE and RMSE), confirming the higher precision of its predictions. Although SVR yielded a marginally higher R2 score, which measures the goodness of fit, TCN–transformer’s significantly lower absolute errors make it more valuable for practical applications. The subpar performance of the LSTM model is likely attributable to its high sensitivity to hyperparameters and its potential failure to converge adequately under the given configuration.

Table 5.
Performance comparison of different predictive models on the testing set.
5. Results and Discussion
The TCN–transformer model demonstrated superior performance in this case study (R2 = 0.87403, MAE = 0.24603, MSE = 0.10777, RMSE = 0.32829), attributable to its architecture effectively matching the intrinsic characteristics of energy consumption data during transitional seasons in frigid regions. Firstly, the TCN module successfully captures short-term abrupt changes in meteorological parameters such as temperature and wind speed caused by alternating cold and warm air masses through its causal dilated convolutions (see Figure 2). Secondly, transformer’s self-attention mechanism endows the model with the ability to recognise cross-temporal dependencies. It learns periodic operational patterns, such as weekday morning rush hours and holiday closures, while correctly identifying the distinctive low-energy consumption pattern during the Labour Day holiday period (see Figure 9). This capture of building operational logic endows the model’s predictions with clear physical significance. However, the model exhibits prediction biases at certain peak points, potentially attributable to unaccounted transient events in the data (such as temporary surges in footfall).
A limitation of this study lies in the relatively short data collection period. Longer-term data would aid in verifying the model’s robustness across complete seasonal variations. Although the selected week’s data are representative, the model’s generalisation capability over extended time scales (such as the entire transitional season or full year) requires further validation, which will be a focus of future work.
In summary, this research focuses on investigating climate data during the spring-summer transition period in severely cold regions. It innovatively introduces the TCN-Transformer hybrid model into the field of building energy consumption forecasting. The reliable prediction results can directly serve building operation management, aiding in the formulation and implementation of energy-saving and consumption-reduction measures. This promotes the construction of more efficient and low-carbon building energy systems in severely cold urban areas, thereby contributing to the development of sustainable cities and communities. Future research will concentrate on three directions: firstly, incorporating advanced hyperparameter tuning algorithms such as Bayesian optimisation to further enhance performance; secondly, extending the temporal scope of datasets and encompassing more building types across frigid regions to validate the model’s universality; thirdly, exploring the integration of this model into Building Energy Management Systems (BEMS) to achieve real-time optimisation control based on predictions.
Author Contributions
M.N.: Conceptualization, Methodology, Data Management, Software, Validation, Writing–Manuscript, Writing–Review and Editing, Visualization; D.Z.: Project Management, Conceptualization, Methodology, Validation, Writing–Review and Editing, Supervision, Funding Acquisition; X.L.: Investigation, Collection, Formal Analysis, Data Management; D.G.: Survey, Collection, Data Management, Software. All authors have read and agreed to the published version of the manuscript.
Funding
This project is supported by the National Natural Science Foundation of China, Project name: Carbon Footprint Analysis and Carbon Reduction Design Strategies for the Whole Life Cycle of Walls of Assembled Buildings in Inner Mongolia Region (Grant No.: 52168007); it is also supported by the Basic Scientific Research Business Expenses of Universities Directly under Inner Mongolia Autonomous Region, Project Name: Research on Carbon Reduction Design of Prefabricated Buildings in Inner Mongolia Based on Digital Twin Technology (Grant No.: JY20230053).
Institutional Review Board Statement
Not applicable.
Informed Consent Statement
Not applicable.
Data Availability Statement
The data presented in this study are available on request from the corresponding author.
Conflicts of Interest
The remaining authors declare that the research was conducted in the absence of any commercial or financial relationships that could be construed as a potential conflict of interest.
References
- Yang, W. China Accelerates Green and Low-Carbon Energy Transition. Available online: https://www.gov.cn/yaowen/liebiao/202407/content_6964065.htm (accessed on 22 July 2025).
- Jian, Z.; Shuai, Z.; Lei, S. The Impact of Technological Progress in China’s Major Energy-Consuming Industries on Energy Conservation and Emission Reduction and Prospects. Resour. Sci. 2017, 39, 2211–2222. [Google Scholar]
- Wei, C.; Yongle, L.; Nan, Z.; Xuan, J.; Lili, W. Research on Heat Recovery Energy-Saving Retrofit of Old Office Buildings in Severe Cold Regions. Build. Energy Conserv. 2024, 52, 130–135. [Google Scholar]
- Nianci, L.; Peiyang, D.; Zhaojun, W. Assessment of Electricity Energy Consumption of Passive Houses in Severe Cold Regions. Gas Heat 2023, 43, 15–21. [Google Scholar] [CrossRef]
- Xu, L.; Tong, S.; He, W.; Zhu, W.; Mei, S.; Cao, K.; Yuan, C. Better Understanding on Impact of Microclimate Information on Building Energy Modelling Performance for Urban Resilience. Sustain. Cities Soc. 2022, 103775, prepublish. [Google Scholar] [CrossRef]
- Yong, L.; Deyan, W.; Lu, Z.; Guangming, C.; Xuelai, L. Application of Neural Networks in Building Energy Consumption Prediction in Cold Regions. J. Shandong Univ. Archit. 2020, 35, 1–6. [Google Scholar]
- Jing, J.; Ziyi, Y.; Haoqing, N. The Impact of Short-Term Thermal Experience in College Classroom during Transitional Season on Thermal Comfort and Thermal Adaptation. J. Xi’an Polytech. Univ. 2023, 37, 1–7. [Google Scholar] [CrossRef]
- Kuixing, L.; Yihong, J.; Gang, L. The Impact of Seasonal Factors on Human Thermal Comfort Evaluation in University Classrooms. Build. Energy Conserv. 2018, 46, 25–28+32. [Google Scholar]
- Culaba, A.B.; Del Rosario, A.J.R.; Ubando, A.T.; Chang, J. Machine learning-based energy consumption clustering and forecasting for mixed-use buildings. Int. J. Energy Res. 2020, 44, 9659–9673. [Google Scholar] [CrossRef]
- He, L.; Zou, D. A Study on the Thermal and Moisture Transfer Characteristics of Prefabricated Building Wall Joints in the Inner Mongolia Region. Buildings 2025, 15, 2197. [Google Scholar] [CrossRef]
- Zheng, H.; Wang, F.; Wang, H.; Wang, Y. Numerical Analysis of the Dynamic Heat and Moisture Coupling Transfer Within Typical Building Walls in Severe Cold Region of China. In Proceedings of the 11th International Symposium on Heating, Ventilation and Air Conditioning (ISHVAC 2019), Harbin, China, 12–15, July 2019; Wang, Z., Zhu, Y., Wang, F., Wang, P., Shen, C., Liu, J., Eds.; Environmental Science and Engineering; Springer: Singapore, 2020. [Google Scholar] [CrossRef]
- Cao, W.; Meng, Z.; Li, J.; Wu, J.; Fan, F. A Remaining Useful Life Prediction Method for Rolling Bearing Based on TCN-Transformer. In IEEE Transactions on Instrumentation and Measurement; IEEE: New York, NY, USA, 2025; Volume 74, p. 3501309. [Google Scholar] [CrossRef]
- Yuan, H.; Zhang, J.; Zhang, L.; Zhang, Z.; Wang, Z. Vehicle Trajectory Prediction Based on Posterior Distributions Fitting and TCN-Transformer. IEEE Trans. Transp. Electrif. 2024, 10, 7160–7173. [Google Scholar] [CrossRef]
- Hewage, P.; Behera, A.; Trovati, M.; Pereira, E.; Ghahremani, M.; Palmieri, F. Temporal convolutional neural (TCN) network for an effective weather forecasting using time-series data from the local weather station. Soft Comput. 2020, 24, 16453–16482. [Google Scholar] [CrossRef]
- Chen, J.; Liu, B.; Lin, W.; Zheng, J.; Xie, J. A Review of Time Series Forecasting Methods Based on Transformers. Comput. Sci. 2025, 52, 96–105. [Google Scholar]
- Li, X.; Yu, J.; Zhao, A.; Hou, S.; Mao, Y. Time Series Prediction Method Based on Sub-Metering in Building Energy Performance Evaluation. J. Build. Eng. 2023, 72, 106638. [Google Scholar] [CrossRef]
- Jiwei, L.; Guohui, F.; Li, X. Research on Machine Learning Regression Models for Building Energy Consumption Prediction. J. Shenyang Univ. Archit. Nat. Sci. Ed. 2021, 37, 1098–1106. [Google Scholar]
- Ji, J.; Yu, H.; Wang, X.; Xu, X. Machine learning application in building energy consumption prediction: A comprehensive review. J. Build. Eng. 2025, 104, 112295. [Google Scholar] [CrossRef]
- Hosseini, S.; Fard, R.H. Machine Learning Algorithms for Predicting Electricity Consumption of Buildings. Wirel. Pers Commun 2021, 121, 3329–3341. [Google Scholar] [CrossRef]
- Yiting, C.; Suli, Z.; Guanghao, Y. A Review of Building Electricity Energy Consumption Prediction. China Build. Mater. Sci. Technol. 2024, 33, 88–93. [Google Scholar]
- Guozhi, Z.; Ziqing, W.; Bao, Y.; Xiaoqiang, Z. Office Building Energy Consumption Prediction Based on CNN-RNN Hybrid Model. J. Shanghai Jiao Tong Univ. 2022, 56, 1256–1261. [Google Scholar] [CrossRef]
- Congzhou, Y.; Penglin, X.; Jun, Q.; Chenxiong, Z.; Chen, L.; Wang, K. Research on Energy Consumption Load Prediction Model for Super-Large Buildings Based on Clustering and Random Forest Regression. Green Build. 2022, 14, 48–51+55. [Google Scholar]
- Mathumitha, R.; Rathika, P.; Manimala, K. Intelligent deep learning techniques for energy consumption forecasting in smart buildings: A review. Artif. Intell. Rev. 2024, 57, 35. [Google Scholar] [CrossRef]
- Fang, X.; Gong, G.; Li, G.; Chun, L.; Li, W.; Peng, P. A hybrid deep transfer learning strategy for short term cross-building energy prediction. Energy 2021, 215, 119208. [Google Scholar] [CrossRef]
- Lü, X.; Lu, T.; Kibert, C.J.; Viljanen, M. Modeling and forecasting energy consumption for heterogeneous buildings using a physical–statistical approach. Appl. Energy 2015, 144, 261–275. [Google Scholar] [CrossRef]
- Wei, S.; Bai, X. Multi-Step Short-Term Building Energy Consumption Forecasting Based on Singular Spectrum Analysis and Hybrid Neural Network. Energies 2022, 15, 1743. [Google Scholar] [CrossRef]
- Wu, W.; Deng, Q.; Shan, X.; Miao, L.; Wang, R.; Ren, Z. Short-Term Forecasting of Daily Electricity of Different Campus Building Clusters Based on a Combined Forecasting Model. Buildings 2023, 13, 2721. [Google Scholar] [CrossRef]
- Divina, F.; García Torres, M.; Goméz Vela, F.A.; Vázquez Noguera, J.L. A Comparative Study of Time Series Forecasting Methods for Short Term Electric Energy Consumption Prediction in Smart Buildings. Energies 2019, 12, 1934. [Google Scholar] [CrossRef]
- Yu, Y.; Zhang, C.; Wang, G.; Wang, X.; Yang, L. Short-term energy consumption prediction for university dormitory buildings based on energy consumption grouping by considering meteorological factors and teaching schedules. Energy Build. 2024, 312, 114219. [Google Scholar] [CrossRef]
- Jiao, Y.; Tan, Z.; Zhang, D.; Zheng, Q.P. Short-term building energy consumption prediction strategy based on modal decomposition and reconstruction algorithm. Energy Build. 2023, 290, 113074. [Google Scholar] [CrossRef]
- Cao, W.; Yu, J.; Chao, M.; Wang, J.; Yang, S.; Zhou, M.; Wang, M. Short-term energy consumption prediction method for educational buildings based on model integration. Energy 2023, 283, 128580. [Google Scholar] [CrossRef]
- Ouyang, Y.; Wan, D.; Gao, R.; Ye, Z. Research on Single-Phase Fault Line Selection in Distribution Network Based on TCN-Transformer Self-Attention. Microelectron. Comput. 2022, 39, 89–97. [Google Scholar] [CrossRef]
- Liang, X.; Chen, S.; Zhu, X.; Jin, X.; Du, Z. Domain knowledge decomposition of building energy consumption and a hybrid data-driven model for 24-h ahead predictions. Appl. Energy 2023, 344, 121244. [Google Scholar] [CrossRef]
- Lea, C.; Flynn, M.D.; Vidal, R.; Reiter, A.; Hager, G.D. Temporal convolutional networks for action segmentation and detection. In Proceedings of the IEEE Conference on Computer Vision and Pattern Recognition, Honolulu, HI, USA, 21–26 July 2017; pp. 156–165. Available online: https://arxiv.org/abs/1611.05267 (accessed on 5 November 2024).
- Zhang, J.; Luan, H.; Sun, M.; Zhai, F.; Xu, J.; Zhang, M.; Liu, Y. Improving the transformer translation model with document-level context. arXiv 2018, arXiv:1810.03581. [Google Scholar] [CrossRef]
- Civitarese, D.S.; Szwarcman, D.; Zadrozny, B.; Watson, C. Extreme precipitation seasonal forecast using a transformer neural network. arXiv 2021, arXiv:2107.06846. [Google Scholar] [CrossRef]
- Vale, L.D.N.; Maia, M.D.A. Towards a question answering assistant for software development using a transformer-based language model. arXiv 2021, arXiv:2103.09423. [Google Scholar] [CrossRef]
- Ruixiang, S.; Xiaoyu, Z. Short-term Photovoltaic Power Prediction Model Based on Probabilistic TCN-Transformer. Integr. Smart Energy 2024, 46, 10–18. [Google Scholar]
- Zhang, H.; Li, F.; Ma, Y.; Ji, W.; Zheng, Q. Research on Photovoltaic Power Forecasting Using PAM Combined with TCN to Optimise Transformers Computer Engineering. Comput. Eng. 2025, 51, 140–149. [Google Scholar]
- Chen, H.; Tian, A.; Zhang, Y.; Yuzi, L. Early Time Series Classification Using TCN-Transformer. In Proceedings of the 2022 IEEE 4th International Conference on Civil Aviation Safety and Information Technology (ICCASIT), Dali, China, 12–14 October 2022; pp. 1079–1082. [Google Scholar]
- Thapa, N.; Lee, J. Dual-Path Beat Tracking: Combining Temporal Convolutional Networks and Transformers in Parallel. Appl. Sci. 2024, 14, 11777. [Google Scholar] [CrossRef]
- Wu, L.; Yu, J.; Dai, Y.; Tianlu, G.; Jun, Z. Photovoltaic Power Generation Forecasting Based on TCN-Transformer Model. In Proceedings of the 2024 5th International Conference on Artificial Intelligence and Electromechanical Automation (AIEA), Shenzhen, China, 14–16 June 2024; pp. 620–626. [Google Scholar]
- Zhang, S.; Zhu, C.; Guo, X. Wind-Speed Multi-Step Forecasting Based on Variational Mode Decomposition, Temporal Convolutional Network, and Transformer Model. Energies 2024, 17, 1996. [Google Scholar] [CrossRef]
Disclaimer/Publisher’s Note: The statements, opinions and data contained in all publications are solely those of the individual author(s) and contributor(s) and not of MDPI and/or the editor(s). MDPI and/or the editor(s) disclaim responsibility for any injury to people or property resulting from any ideas, methods, instructions or products referred to in the content. |
© 2025 by the authors. Licensee MDPI, Basel, Switzerland. This article is an open access article distributed under the terms and conditions of the Creative Commons Attribution (CC BY) license (https://creativecommons.org/licenses/by/4.0/).