Abstract
It is still very challenging to design office buildings to be comfortable in hyper-arid conditions. In this paper, computational fluid dynamics (CFD) has been employed to investigate and improve the thermal performance of an office building in Béchar, Algeria, with ambient temperatures exceeding 40 °C. The scenario was analyzed using a complete methodology that integrated field measurements, questionnaires from the occupants, and CFD simulations. The investigation covered two cases: the reference case (Building 1) and a CFD-optimized building envelope (Building 2). The baseline simulation showed that the people were highly dissatisfied with the temperature, with 2.33 PMV and over 65% PPD values for the summer season. The new building envelope, with new insulation and aluminum cladding systems, showed much better improvement in the thermal comfort level. The outcome showed that PMV values were within tolerance (0.5 to +0.5), PPD levels decreased between 30% to 57%, and temperature decreased by about 6 °C. High correlation between CFD prediction and field measurement (r = 0.94) shows that the method is reliable. This study proves that CFD is a useful tool to forecast how to design for the climate. It gives evidence-based solutions for keeping individuals more comfortable and using less energy on cooling under weather extremes. The results make a contribution to sustainable building practice in very dry climates and offer a paradigm that can be used repeatedly for improving thermal comfort in poor environmental conditions.
1. Introduction
The increasing complexities of global climate change have placed unparalleled stress on the built environment. As centers of human activity and large users of energy, buildings are at the nexus of sustainability and human well-being [1]. In regions with harsh climates, such as the Sahara Desert’s hyper-arid conditions, the burden of creating comfortable and productive indoor environments is especially heavy. In Béchar, Algeria, to cite one instance, summer outdoor temperatures are typically above 40 °C at least part of the time, which is a problem. There, the state of “thermal comfort” as “that condition of mind which expresses satisfaction with the thermal environment,” [2] as ASHRAE Standard 55 defines it, is not a comfort but a prerequisite to health, intellectual performance, and economic productivity. Quantitative measures have been employed for decades to assess thermal comfort. Nevertheless, there persists a stable, well-documented gap between physical objective measurements and subjective, psychological comfort [3]. Building occupants are not passive sensors; they are active participants who actively engage in behavioral, physiological, and psychological adaptation to the environment [4]. “Perception gap” is more pronounced in climates where cultural practices and lifetime acclimatization can create a tolerance for conditions universally unacceptable. A simple thermometer reading, therefore, is an entirely inadequate tool for the measurement of the intricate reality of comfort.
This methodological restriction calls for a more sophisticated approach, one that is capable of integrating the intricate variables influencing comfort and, most importantly, simulating the thermal effects of design decisions before they are implemented. This article argues that computational fluid dynamics (CFD) has emerged as such a vital tool. CFD simulation allows visualization of intangible environmental features such as air velocity, radiant heat exchange, and temperature stratification. More importantly, it provides a virtual laboratory wherein one can experiment with the efficacy of architectural interventions, starting from material selection and insulation strategies to ventilation and shading system design. It allows the possibility of transitioning from a reactive to a proactive approach in design. It relocates findings from our new integrated research in pursuit of a more focused line of inquiry. The core objective of this research is to critically present the pivotal role played by CFD as a methodological interface between objective building performance and subjective user satisfaction. Through the extended case study of an office building located in Béchar, this paper will:
- Illustrate the diagnostic potential of CFD in measuring and identifying the thermal shortcomings of a building in question.
- Illustrate the predictive potential of CFD in modeling the response to the targeted retrofit strategy and forecasting the impact on thermal comfort indicators (PMV, PPD).
- Investigate how CFD-based optimization can help create indoor conditions that not only meet objective comfort requirements but also adapt to adaptive behaviors and habits of occupants in hyper-arid regions.
By this simulation-based study, this paper aims to provide compelling evidence for the integration of CFD as a standard, core practice of building design and retrofitting in challenging climates, such that architectural solutions are not only energy efficient but are ultimately human-centric.
While CFD is a powerful analysis tool, caution should be exercised when differentiating between full computational fluid dynamics analysis and building energy simulation (BES) software with thermal comfort assessment capabilities. Old guard BES programs such as EnergyPlus, TRNSYS, and IDA-ICE have progressed significantly in terms of their ability to analyze building envelope energy performance and assess long-term thermal comfort conditions. These tools are most suited to annual energy analysis, optimization of the HVAC system, and regulatory compliance monitoring. More rigorous spatial thermal analysis particularly visualization of temperature stratification, radiation asymmetry, and zone-by-zone comfort conditions is usually in need of more sophisticated modeling capability. DesignBuilder is utilized in this research, which couples EnergyPlus’s robust energy modeling with sophisticated visualization of spatial thermal distributions, providing a realistic middle ground between simplified zone-based BES and computationally demanding full CFD analysis.
2. Literature Review
To place in perspective the central role of CFD, this review delivers a background on four related fields: the theoretical models of thermal comfort, the specific thermal issues of hyper-arid climates, the recognized gap between objective measurement and subjective perception, and the emergence of CFD as a key predictive technology in building science.
2.1. The Evolution of Thermal Comfort Models
2.1.1. Evolution from Static to Adaptive Comfort Paradigms
Quantitative measurement of thermal comfort originated in Fanger’s heat balance model [5], which reduced six climatic and personal variables (air temperature, mean radiant temperature, relative humidity, air velocity, clothing insulation, and metabolic rate) to the Predicted Mean Vote (PMV) and Predicted Percentage of Dissatisfied (PPD) indices. It was standardized by ISO 7730 and ASHRAE Standard 55, which is based on steady-state conditions with passive people in mechanically conditioned spaces with dependable predictions valid for HVAC-dominated buildings. The de Dear and Brager adaptive thermal comfort model [6] inverted the static paradigm by recognizing occupants as being in charge and hence active, making behavioral (clothing adjustment, window operation), physiological (acclimatization), and psychological (expectation modification) responses. Occupants of naturally ventilated buildings accept wider temperature ranges if environmental control is present [7]. But the relevance of the adaptive model is diminished in mechanically conditioned environments with limited occupant control potential, and thus supports the sustained relevance of PMV-PPD methodology to HVAC-regulated conditions such as the present case study. The discrepancy between subjective comfort and objective measure becomes even more pronounced in tropical conditions. Lakhiar et al. [8] evaluated both objective and subjective thermal comfort in a Malaysian green office building and discovered that while objective indoor conditions met accepted standards, many occupants felt colder than the thermal models had forecast. The discrepancy illustrates the limitation of relying solely on conventional predictive models without consideration of individual variability and adaptive comfort possibilities, particularly for non-temperate climates.
2.1.2. Computational and Advanced Thermophysiological Models
Recent research in thermal comfort has provided complex multi-node thermophysiological models that simulate human thermoregulation more realistically:
The THERMODE 2023 model (THERmoregulation MOdel for Disuniform Environments) is an advanced multi-cylindrical thermophysiologiques model for human thermal response simulation. It is an extension of the original Stolwijk model (25 nodes) with a more detailed 193-node partition, having 14 body blocks further divided into 48 segments with four layers (skin, fat, muscle, core) each, and blood as the 193rd node. The passive system accounts for sweat evaporation, dripping, and thermophysical properties of clothing affected by body movement and air action. The active system employs new coefficients for heat production and shivering derived from experiments. An integrated thermal sensation model, calibrated over 4000 questionnaires, estimates thermal sensation between −1.2 and 2.0 on the ASHRAE scale. Validation shows the model predicts skin and core temperature with deviations less than 0.5 °C in moderate environments [9].
JOS-3 (Joint System Model-3) by Takahashi et al. [10] uses a 17-segment body subdivision with detailed blood flow simulation, enabling accurate estimation of local thermal sensation and physiological reactions under spatially non-uniform thermal conditions. Correlation coefficients in validation experiments are greater than 0.85 in the prediction of skin temperature in a wide range of thermal environments. Coupling human thermoregulation models and CFD is an advanced technique for thermal comfort assessment. An advanced framework that coupled the JOS-3 human thermoregulation model with CFD simulation (OpenFOAM) to assess thermal comfort in non-homogeneous indoor environments was introduced by Zambrano and Baldini [11]. This strategy enables CFD to provide high-resolution environmental data that is subsequently handled by the thermoregulation model to simulate local heat balance over individual body segments, enabling correct comfort analysis under spatially non-uniform thermal conditions a function of especial relevance for envelope optimization studies like the present one.
The Fiala-Ergonsim model, originally developed for automotive thermal comfort assessment, excels in transient exposure estimation through detailed thermoregulatory response simulation [12]. It has been thoroughly tested under climatic extremes and serves as the foundation of the Universal Thermal Climate Index (UTCI).
While these dynamic models provide more accurate predictions for transient and non-uniform conditions, their computationally demanding characteristics and extensive input requirements limit their applicability in building design optimization practice. For steady-state mechanically conditioned environments characteristic of our Béchar office building, the PMV-PPD model is sufficient accuracy with significantly reduced computational needs, as affirmed by our field correlation analysis (r = 0.94, Section 3.2.2).
2.1.3. International Standardization Framework for Thermal Comfort
Existing building design relies on harmonized international standards that translate thermal comfort theory into measurable design parameters:
- ISO 7730:2005 [13] prescribes the first PMV-PPD method with three comfort zones: Category A (PMV ±0.2, PPD <6%), Category B (±0.5, <10%), and Category C (±0.7, <15%). This standard is the principal point of reference for mechanically conditioned buildings globally and forms the basis for subsequent national and regional standards.
- ISO 17772-1:2017 [14] integrates thermal comfort assessment with building energy performance rating, defining four classes of indoor environmental quality (I to IV) with progressively less stringent requirements. The standard explicitly associates occupant comfort with energy efficiency targets, which allows for overall building performance optimization.
- EN 16798-1:2019 [15] is the European harmonization standard for indoor environmental quality covering both PMV-based standards for conditioned buildings and adaptive comfort provisions for naturally ventilated buildings. It classifies four types based on ISO 17772-1 and contains detailed guidance for a vast array of building types and ventilation strategies.
- EN 16798-2:2019 [16] complements EN 16798-1 by providing detailed implementation guidance, measurement procedures, and demonstration of conformity procedures. The standard addresses practical evaluation issues like sensor placement, measurement duration, and data analysis procedures.
- ASHRAE Standard 55-2020 [2] offers the most comprehensive North American thermal comfort standard with three modes of compliance: analytical (PMV-based), graphical comfort zones, and adaptive models. The standard gives explicit rules for mechanically conditioned and naturally ventilated buildings, keeping in view cultural and climatic adaptation factors.
Methodological Framework Selection: In this study, ISO 7730 and ASHRAE 55 serve as primary methodological guidelines based on four arguments:
- Formal validation for mechanically conditioned rooms equivalents to our case study floor plan;
- Comprehensive PMV-PPD calculation protocols adequate for HVAC-conditioned buildings;
- Field validation confirming model use in hyper-arid climatic conditions (Section 3.2.2);
- Adherence to new Algerian building energy performance standards. The target comfort range (PMV: −0.5 to +0.5; PPD < 10%) corresponds to Category B classification (ISO 7730), which signals appropriate thermal conditions for office buildings and is according to best international practice for new buildings and major renovations.
The interaction of these global standards with harmonized comfort criteria with regional climatic and cultural variations has a good rationale for the PMV-PPD approach applied to this computational study. The following sections indicate the way CFD simulation facilitates quantitative assessment of these comfort measures standardized under harsh climatic conditions.
2.2. The Particular Thermal Difficulty of Hyper-Arid Climates
2.2.1. Hyper-Arid Climate Characteristics: Comparative Analysis at the Global Level
Hyper-arid climates, classified as Köppen–Geiger BWh, are the most temperature-exaggerated inhabited environments on Earth, characterized by systematic environmental stressors that severely challenge traditional building design approaches. Spread across several continents, these climatic areas have common key thermal characteristics but exhibit local differences that influence optimal design approaches. Saharan North Africa (Béchar, Algeria) experiences temperatures above 40 °C throughout the summer with peak values of up to 48 °C, in addition to high diurnal temperature ranges (20–25 °C) and solar radiation higher than 2800 kWh/m2 per year. The continental desert characteristics of the region lead to minimal precipitation (<100 mm/year) and relative humidity values below 15% most of the time throughout the summer [17]. The conditions are the same for the Sahara from Mauritania through Egypt and affect around 200 million individuals.
Desert regions of the Arabian Peninsula are even more pronounced in their thermal regimes. Kuwait City experiences routine summer air temperatures of over 50 °C with maximums on record at 53.9 °C, with very low relative humidity [18]. The inland regions of the United Arab Emirates and Saudi Arabia experience similar thermal maxima, with Riyadh reporting mean July temperatures of 43 °C and maximum solar radiation fluxes of more than 1100 W/m2 [19]. These conditions, combined with intense urbanization and extensive glazed building, create very challenging thermal control conditions. Specialty building structures in hyper-arid environments present unique thermal challenges. Mohamed et al. [20] examined thermal comfort within an indoor pool environment in a hot desert climate using both CFD (ANSYS Fluent) and HAP (Hourly Analysis Program) simulation. From very extreme to as high as 43.3 °C outside in summer, their work demonstrated that indoor pool areas achieve thermal comfort throughout summer but experience marginally warm conditions during winter. This report highlights the special problems of maintaining comfort levels in desert climate high-humidity, high-latent-heat conditions and gives helpful guidance for pool and greenhouse design under corresponding conditions. Southwest United States hyper-arid areas like Phoenix, Arizona (1.7 million) and Las Vegas, Nevada, show the thermal challenges to large cities in extreme climates. Phoenix experiences over 100 days of daily temperatures above 38 °C annually, and the urban heat island effect adds 3–5 °C to nocturnal temperatures [21]. Suburban low-density development for the area with high surface-to-volume ratios increases envelope thermal control requirements. Inland Australian deserts, like Alice Springs and surrounding regions, exhibit typical blends of high-intensity solar radiation (daily maxima >1200 W/m2), large diurnal temperature range, and prolonged extended periods of intense heat. Recent studies provide evidence of increasing frequency of above 45 °C multi-day extreme heat events with significant implications for thermal resilience in buildings [22]. South American hyper-arid regions, particularly northern Chile’s Atacama Desert, possess extreme solar radiation intensities (world’s highest at some locations) complemented by coastal effects that create distinctive microclimates. These regions show how hyper-arid thermal stress can exist across different geographic and elevation circumstances [23]. Comparative analysis between these diverse locales shows convergent thermal control requirements: (1) lowering solar heat gains through advanced envelope design; (2) thermal mass distribution optimization for daily temperature moderation; (3) carefully managed ventilation control balancing cooling loads and dust/sand entry prevention; (4) integration of passive cooling strategies adapted to local conditions. Researches in Kuwait [24], UAE [19], Arizona [21], and Australia [22] all identify building envelope performance as the key driver in determining indoor thermal conditions in hot climates, which vindicates the optimization approach employed in this research. Besides indoor thermal comfort, the challenges of the hyper-arid climate also exist outside, particularly in the learning environment. Al-Yozbakee and Al-Hafith [25] investigated thermal comfort in open areas at universities in Mosul, Iraq, with the adaptive thermal comfort model from 874 survey responses in five open areas. Their findings established that vegetated and shaded spaces were capable of reducing globe temperatures by up to 12.7 °C in summer and increasing them by up to 1.3 °C in winter, with winter thermal comfort ranges of 10.0–27.0 °C and summer ones of 25.0–41.0 °C. This research emphasizes the role of landscape design in promoting comfort and utilization of outdoor spaces in hot climates.
2.2.2. Building Overheating: Mechanisms, Consequences, and Design Implications
Building overheating—i.e., long-term indoor temperatures higher than thermal comfort levels despite the mechanical cooling system running—represents a critical failure mode in hyper-arid climate building construction. Overheating, recently extensively documented in the literature, is caused by complex interactions among envelope thermal performance, solar radiation control, internal heat loads, and HVAC capacity [26].
Overheating Mechanisms in Extremes: Different heat transfer mechanisms are accountable for overheating buildings in hyper-arid climates. Penetration of solar radiation through fenestration is the dominant mechanism, and unshaded glazing admits 500–800 W/m2 at maximum conditions [27]. Meliouh demonstrated that properly designed courtyards can reduce temperatures by 3–5 °C. Modern office skyscrapers are lightweight and have vast expanses of glass which can become overheated at the cost of aesthetics and environmental comfort [28]. Our baseline building case study (Section 4.1.1) measured mean radiant temperatures of 4.45 °C in excess of air temperatures as a direct result of this solar greenhouse effect. Heat transfer through conduction by means of thermally unsuitable envelopes constitutes the second major pathway, particularly through roof assemblies with surface temperatures in excess of 70 °C under direct solar irradiance [29]. Thermal bridging through structural elements creates localized hot spots that compromise overall envelope performance. Ineffective ventilation schemes, often used to limit dust penetration in desert climates, can retain internal heat gain and stifle beneficial night cooling.
Health and Productivity Impacts: Prolonged indoor exposure to high temperatures creates cascading physiological and mental impairments of significant economic impact. Seppanen et al. [30] demonstrate through a study that cognitive performance declines by 2% per degree Celsius above 25 °C operating temperature, with greater effects for higher-order analytical tasks. Our standard building conditions (operating temperatures 30–33 °C during summer) therefore amount to productivity losses of 10–16% for times of thermal stress. Risk of heat-related illness rises rapidly above 28 °C wet-bulb globe temperature, with vulnerable members of the population (the elderly, cardiovascular patients) experiencing increased morbidity at lower temperatures [31]. Economic analyses indicate that hot-climate building overheating causes gross productivity losses of more than USD 100 billion annually in affected regions [32].
Vulnerabilities in Contemporary Building Design: Contemporary building design in hyper-arid regions tends to prioritize architectural shape and construction efficiency over thermal performance, imbuing systematic overheating vulnerabilities. Large curtain wall systems, while aesthetically favorable, admit too much solar radiation unless equipped with advanced glazing technologies and external shades [33]. Lightweight building systems, increasingly being adopted for economic and seismic reasons, fail to provide adequate thermal mass for the daily temperature moderation in comparison with traditional massive building [18]. Inadequate insulation specifications, normally taken from temperate climate conditions, fall short for extreme solar loading conditions. Our control building study demonstrates these weaknesses: conventional double-brick construction (25 cm) with no continuous insulation, extensive clear glazing (90 × 1.9 m2), and reflective but conductive aluminum cladding created systemic thermal control failures.
Overheating Mitigation Through Envelope Optimization: Effective overheating avoidance is dependent on integrated envelope approaches addressing all heat transfer routes at the same time. Solar control by high-performance glazing, external shading devices, and exterior high-reflectance surfaces is the initial defense, capable of reducing cooling loads 40–60% in extreme climates [34]. Increased thermal resistance by continuous insulation and thermal bridge prevention elevates interior temperatures and reduces peak heat gains [35]. Properly designed thermal mass placement offers useful thermal lag effects that reduce temperature fluctuations [36,37]. Our optimization demonstrates the effectiveness of integrative envelope strategies: the 85% reduction in thermal discomfort (PPD: 65.34% to 8.44%) and 6 °C drop in operative temperature validate passive envelope methods as valid alternatives for additional mechanical cooling capacity.
Climate Change Amplification: Future climate change impacts will dramatically enhance building overheating risks in already-extreme climates. Climate models predict 2–4 °C warming in hyper-arid regions by 2050 with increased frequency and duration of extreme heat events [38]. Urban heat island conditions will enhance the effects in rapidly developing desert cities. A study by Santamouris [39] predicts that without major advances in envelope performance, building overheating will render many existing buildings functionally uninhabitable in summer in coming decades. This challenge elevates envelope optimization from a metric of energy efficiency to a climate adaptation requirement. The convergence of overheating processes reported in other hyper-arid contexts—ranging from Kuwait’s hot desert temperatures to Phoenix’s urban heat island effect—demonstrates that the thermal control principles explored in our Béchar case study have global applicability. The remainder of this paper demonstrates how CFD-based envelope optimization provides numerical solutions to such systematic overheating problems.
Specific Challenges of Glass Curtain Wall Systems: The thermal performance deficits of glass curtain walls are a result of their naturally reduced thermal resistance relative to typical opaque walls, leading to a high susceptibility of the buildings to external weather conditions. Glass curtain walls are the thermally weakest part of the building envelope, with as much as 60% of energy loss due to glazed zones within office buildings, where HVAC systems contribute the largest share of building energy usage. The complexity of thermal analysis extends beyond fundamental glazing attributes to include sophisticated support structures with intricate cross-sections with more than one cavity, making it challenging to accurately evaluate their thermal performance. Existing research demonstrates that modern office buildings with expansive glass facades experience high thermal variations, wherein indoor temperatures vary by more than 16 °C annually in uncontrolled conditions, having a direct impact on occupant comfort and energy demands.
Building Envelope Optimization Research: Researchers have redirected their focus toward optimizing existing building envelopes in a bid to address these challenges. Athmani discovered that “cool roof” paints reflect and reduce surface temperature by 39 °C [29], and Mansouri recognized insulation and thermal mass, reducing the interior temperature range by 60–70% [40]. These publications demonstrate that the building envelope constitutes the first defense against adverse conditions.
2.2.3. Recent Advances in Glass Curtain Wall Technology
- Electrochromic Glass Technology
Electrochromic glass is now a ground-breaking technology in addressing thermal problems of modern glass curtain walls. Wu et al. [41] demonstrated that electrochromic windows show excellent performance improvements with dynamic optical property control, with solar heat gain coefficients between 4% in tinted states and 35% in bleached states, and visible light transmission from 0.1% to 59%.
Phase Change Material Integration: Complemented by electrochromic technologies, recent research indicates huge potential for phase change material (PCM) integration in glass curtain wall facades. Al-Absi et al. [42] verified that the incorporation of PCM into external facades achieved maximal temperature drops of 5 °C with efficiency in energy saving up to 37% in ideal possible setups. Optimized studies by Zheng et al. [43] illustrated that combined design approaches combining glazing parameters and utilization of PCM achieve between 20.16% and 81.18% energy savings based on the climatic zone.
- b.
- Adaptive Facade Systems
Innovative adaptive facade systems with frameless retractable glazing have proven to offer significant performance improvements. Pérez-Carramiñana et al. [44] illustrated that such systems increase indoor temperatures by approximately 4 °C during winter and reduce annual thermal fluctuation from over 16 °C to just 10 °C, obtaining heating energy savings of almost 60% through passive thermal control strategies.
Computational Analysis and Optimization Tools: The character of thermal analysis has necessitated highly sophisticated computational tools. Wang et al. [45] developed effective software solutions employing finite element methods with validation accuracies of 2% or more compared to benchmark programs. Effective optimization techniques employing Response Surface Methodology enable systematic parameter optimization, with Zheng et al. [43] demonstrating multi-parameter optimization that achieved high statistical confidence (R2 > 0.9354). These findings affirm that the best tool for simulating building envelope response to severe environments is computational fluid dynamics (CFD). These hybrid approaches uncover several paths to enhancing glass curtain wall performance in hot arid conditions, unifying traditional bioclimatic design theory and new building technologies through advanced computational analysis and advanced material innovation.
2.3. The Emergence of CFD as a Predictive and Diagnostic Design Tool
Architects need tools that are able to transcend mundane arithmetic since thermal events are multifaceted and comfort is subjective. Computational fluid dynamics, the building science and design’s premier tool, does just that. CFD solves fluid motion, heat transport, and related computational problems through numerical solution and data structures. Simulation of air flow in a building entails visualization of natural ventilation patterns, fan location, and conditioned air from HVAC.
- Thermal Transfer: Simulation of conduction across walls, room convection, and most notably, radiation transfer between surfaces and persons.
- Temperature and Contaminant Distribution: Forecast space temperature, humidity, and contaminants.
CFD and other simulation packages are increasingly used in Algerian research. Laouni employed TRNSYS software to simulate and compared simulated results with actual field data to create reliable prediction models [46]. Laouni and Mazouz employed simulation-based analysis to create prototype sustainable materials such as Compressed and Stabilized Earth Brick (CSEB) for hot arid climates [47]. Femmam developed evolutionary algorithm-based decision support systems and simulation platforms to optimize building designs [48]. These findings validate that simulation is critical to climate-responsive planning design, and not just an afterthought. It is the only way of trying dozens of design factors and predicting their combined effect on interior conditions, enabling an evidence-based optimization approach such as our present study. Recent applications of CFD in building thermal analysis have also shown its diversity in different ventilation approaches. Ganesh et al. [49] employed CFD simulations to examine energy consumption and indoor thermal comfort in naturally ventilated indoor space, comparing multiple ventilation configurations to obtain the best indoor environmental quality. Their work complements mechanically conditioned building analysis by demonstrating the feasibility of CFD for any point on the continuum of ventilation strategies.
3. Methodology
This study added a simulation-based, multi-step approach with the objective of demonstrating the applicability of CFD as a thermal comfort assessment and optimization tool. The approach employed real conditions in an office building in Béchar, Algeria, as the basis for a comparison between a reference case and a simulated, optimized case. The methodology is divided into three phases: (1) Empirical Data Acquisition and Site Characterization, (2) Computational Model Development, and (3) Simulation and Performance Analysis.
3.1. Phase 1: Empirical Data Acquisition and Site Characterization
3.1.1. Site Description
Geographic Location and Context
The Direction of Urban Planning and Construction of Béchar is located at coordinates 31.6034547° N, 2.2240572° W, in the urban center of the city within southwestern Algeria’s Saharan region (Figure 1).
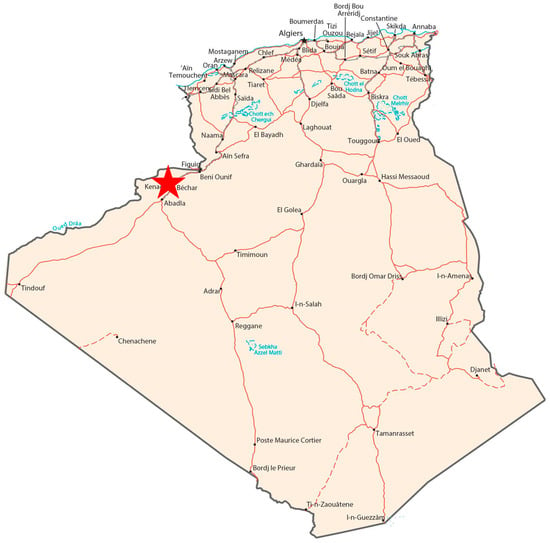
Figure 1.
Algeria map. Red star indicates Béchar.
Climatic Specifications
This region is a desert continental, categorized as BWh (Figure 2) according to Köppen’s classification. Major climatic features include:
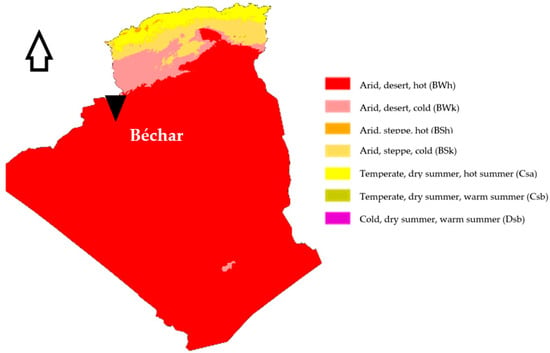
Figure 2.
Climatic zones in Algeria.
- Extremely hot summers: Extremely dry, scorching, and clear conditions prevail; temperatures range from 4 °C to 40 °C, rarely touching 42 °C; summer temperatures reach up to 45 °C at times, causing terribly harsh environmental conditions.
- Contrasting winters: Features cool, dry, and generally clear weather, with nighttime temperatures occasionally dropping near 0 °C.
- Marked aridity: Distinguished by minimal precipitation with annual averages significantly lower than temperate regions, and consistently low relative humidity around 27%.
The DUAC building is placed in an administrative complex of Béchar that is characterized by the occurrence of comparable architecture public buildings (Figure 3), wide roadways and well-arranged street pattern, and a hyper-arid weather with vacant parcels frequent in an evolving urban environment. The red building, which is likely to accommodate the DUAC center, sits at an advantageous position at the southeast corner of the administrative building with its main facade directing the direction of the main road towards the east. East and south elevations are equipped with curtain walls that enhance daylighting and transparency (Figure 4 and Figure 5). The site is of such a nature that it facilitates convenient access from the main road and has complete visibility, making it suitable for a public service building that must be easily accessible to the citizens.
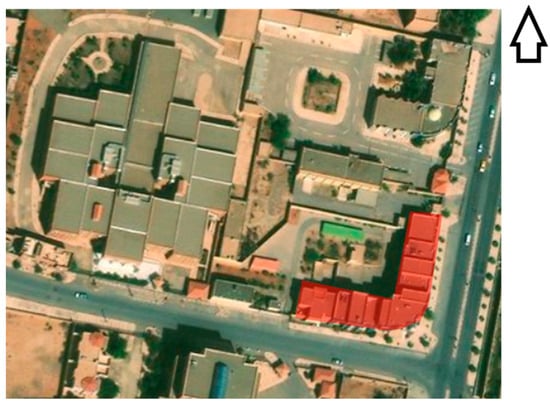
Figure 3.
Building situation (The case study in red color).
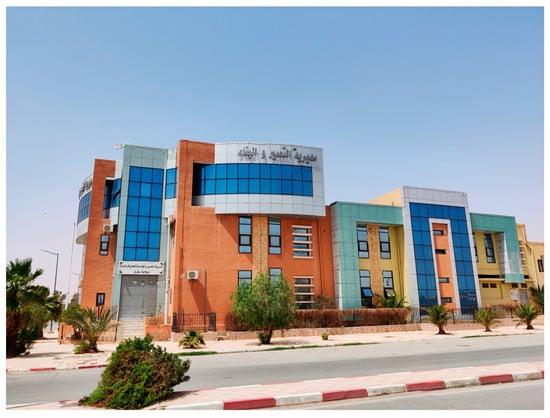
Figure 4.
Eastern facade of building.
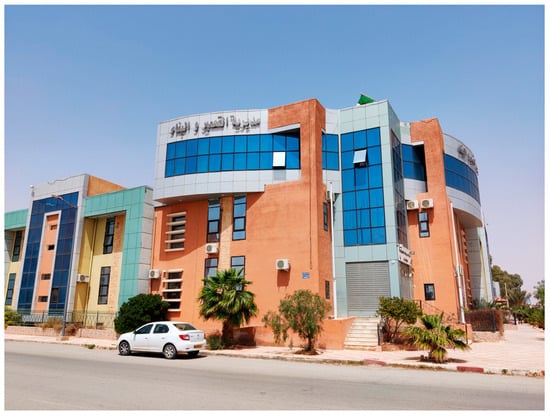
Figure 5.
Southern facade of building.
3.1.2. Measurement System and Questionnaire Design
For indoor thermal condition monitoring, the measurement station was developed on an Arduino UNO microcontroller (UMEAN Technology Co., Ltd., Shenzhen, China) board with two DHT22 sensors for simultaneous temperature and humidity measurement. Two sensors were initially tested and calibrated prior to being installed in the LMS (Laboratory of Mechanics of the Structures) Laboratory of the University of Béchar. Calibration showed a measuring accuracy of ±0.10 to guarantee data reliability. Sensor placement was designed to measure the spatial variability typical within the office. Sensor 1 was positioned on the inboard wall, completely exposed to the outside at 1.50 m, recording information about the thermal contact between the facade and interior room. Sensor 2 was positioned on the office desk at a height of 0.80 m, which is the typical breathing zone of seated occupants, and thus collected data in close harmony with human perception of thermal conditions (Figure 6, Figure 7 and Figure 8).
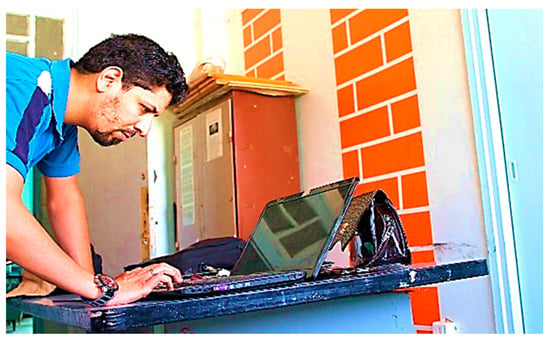
Figure 6.
Data collection from Arduino platform.
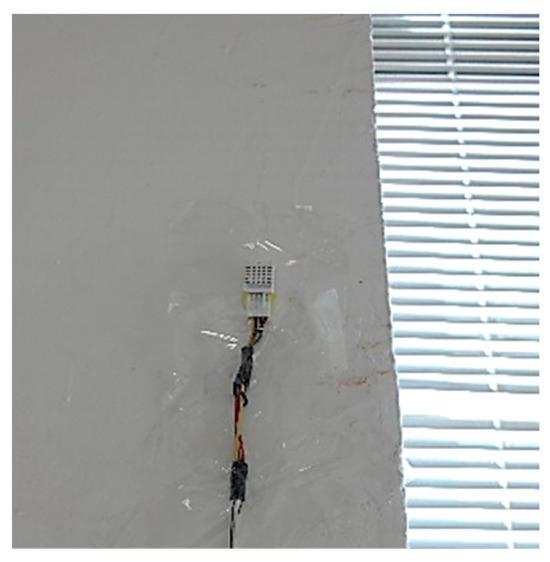
Figure 7.
Sensor 1 placed on wall at 1.50 m.
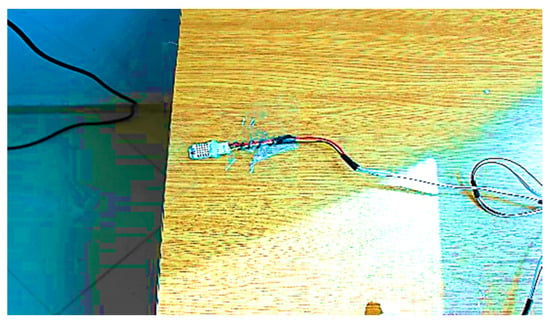
Figure 8.
Sensor 2 placed on desk.
Parallel to instrumental readings, users’ perceptions were elicited through standardized questionnaires distributed among employees. The questionnaire handout protocol was carefully crafted in a way that responses were elicited at appropriate points of the working day, which enabled participants to reflect upon their thermal perceptions in various environmental conditions (morning, noon, and afternoon), hence optimizing temporal representativeness and validity of subjective data. The integration of objective measurements and subjective feelings provided a firm basis for evaluating thermal comfort in the office building in question.
Indoor environmental conditions were recorded using the DHT22 or AM2302 (Aosong Electronic Co., LTD., Guangzhou, China) (Figure 9), a low-cost one-wire digital temperature and humidity sensor that is widely employed in environmental monitoring. The sensor operates on a working supply voltage of 3.3–6 V (generally 5 V) and provides digital output through one-wire communication. From the manufacturer’s datasheet, the DHT22 facilitates measurement of temperature between –40 °C and +80 °C with a resolution of 0.1 °C and an accuracy of ±0.5 °C and relative humidity measurement between 0% and 100% with a resolution of 0.1% and an accuracy of ±2–5% (Figure 10). The sensor has a maximum sampling rate of 0.5 Hz (one good reading every 2 s), matching the inertia of its sensing materials, and typical long-term drift of ±0.5% RH per year. In the present study, sensors were set at a distance that was close to the occupied zone (roughly 1.10 m from the floor level) to ensure that measurements properly reflected thermal comfort conditions perceived by occupants. This procedure adheres to ASHRAE Standard 55 standards for environmental measurement in thermal comfort research.
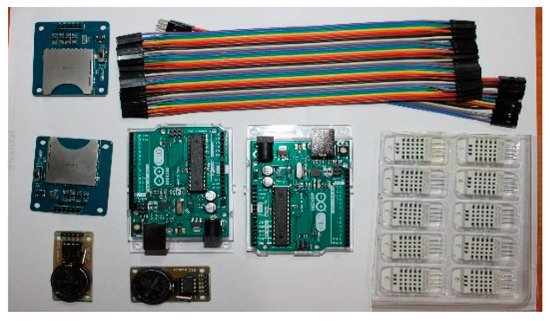
Figure 9.
Arduino UNO and components of platform measurement.
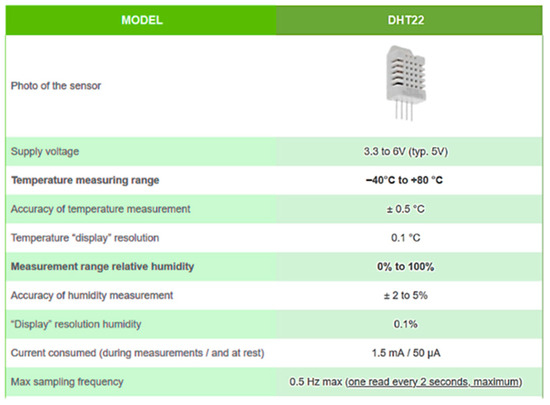
Figure 10.
DHT22 sensor specifications.
For safe operation in hyper-arid climatic conditions, a specific environmental monitoring platform was conceptualized and experimentally tested at the Laboratory of Mechanics of the Structures (LMS), University of Béchar. The system architecture of the instrumentation system involved: (i) an Arduino UNO (ATmega328P processor) as the controller unit; (ii) two DHT22 digital sensors for measuring temperature and humidity; (iii) an SD card module with timestamp logging capability for local logging; and (iv) a 5 V DC power supply with backup battery provisioning. The platform was adjusted to 5 s sampling interval and the data processing protocol to average by hour over the inhabited time range (08:00–16:00). The goal of this initial phase was to acquire high-quality, real-world data to establish the existing conditions and provide necessary inputs and validation points for the subsequent CFD model. The monitoring system employed two independent sensors (Sensor 1 and Sensor 2) to record temperature (T1, T2) simultaneously (Figure 9; Table 1) and relative humidity (RH1, RH2) measurements. This dual sensor approach enhances data reliability and enables spatial variability assessment within the monitored space.

Table 1.
Temperature and relative humidity in situ measurement.
It should be noted that mean radiant temperature (MRT) was not directly measured in the field experiment since black globe thermometers or equivalent instruments were unavailable during the observation period. MRT was, nonetheless, computed specifically by the CFD model, which accounts for radiative heat transfer among the internal and external building surfaces. These test MRT values were subsequently applied to the calculation of thermal comfort indexes (PMV, PPD, OT) to ensure that the influence of radiant heat was not neglected in analysis. While this procedure assisted us in making reasonable estimates of MRT, future experimental campaigns will incorporate specially designed globe thermometers in an effort to provide stronger empirical evidence to CFD predictions.
Usually, the weather in the Béchar region is hot and dry all day, which is what is occurring now. It appears like it would be impossible to be comfortable in the heat, considering the high temperatures (34–36 °C) and low relative humidity levels (11–18%) (Figure 11). This is why businesses need to regulate the climate actively. The daily warming phase demonstrates that there are a lot of outside thermal loads. These could be triggered by changes in the temperature outside or rays from the sun. The temperature–humidity relationship that goes the other way shows how the building reacts when the weather changes. It also shows how important it is to have a plan for controlling temperature and humidity in order to keep the air quality and comfort of users stable. This dataset provides significant basic information that may be used to grade buildings, improve HVAC systems, and discover how comfortable it is to work in hot, dry environments.
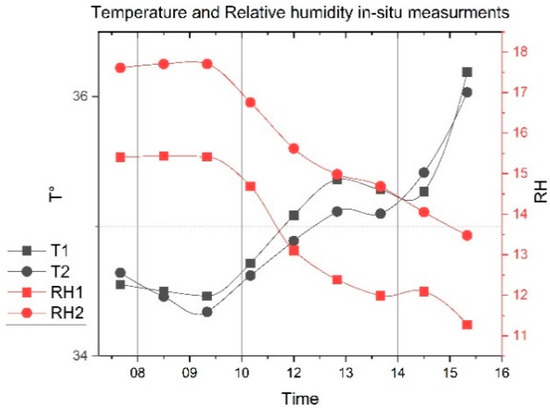
Figure 11.
Temperature and relative humidity measurements.
3.1.3. Subjective Occupant Surveys
To obtain the individual sense of comfort, thermal comfort questionnaires were filled out by all the residents present in the building during working hours (8:00 to 16:00). The questionnaire was based on the ASHRAE Standard 55 appendix and translated into Arabic and French for ease [2]. It is consistent with field study protocols used in other study environments. It collected data on:
- Thermal Feeling: Rated on the 7-point ASHRAE scale (−3 Cold to +3 Hot).
- Thermal Preference: Three-point preference (e.g., “want warmer,” “no change,” “want cooler”).
- General Comfort: A 5-point Likert scale (from 1 Very Uncomfortable to 5 Very Comfortable).
- Environmental Information: Gender, age, clothing insulation (clo), and adaptive actions (e.g., use of fans, opening windows) were also noted.
- This subjective data was significant in interpreting the physical measures as well as in interpreting the “perception gap” to be resolved by the CFD optimization.
The 62 office workers’ thermal comfort study in Béchar identifies systemic deficiencies inherent to the multifaceted issues that office buildings face in hot arid climates, where ambient temperatures often climb as high as 45 °C and solar irradiation is well above 3000 h per year. The survey data from the site reflect a serious thermal emergency, particularly during midday (14:00) when a maximum of complaints was registered, and half of the respondents felt “hot.”(Figure 12) This situation reflects that the building is unable to handle extra heat and thermal loads that are common in Algeria’s southwest Saharan region, which concurs with the conclusion of Al-Homoud, who noted similar thermal stress tendencies in the southern part of Algeria under severe climatic conditions, owing to inefficient building envelope design and inefficient thermal management strategies. The fact that most participants were in the warm to hot range for all day (8:00 to 16:00), and only 23% felt comfortable in the late afternoon (16:00), is a sign of a concatenation of connected problems, such as the performance of building materials that emit heat and allow heat to accumulate and for thermal bridges to happen.
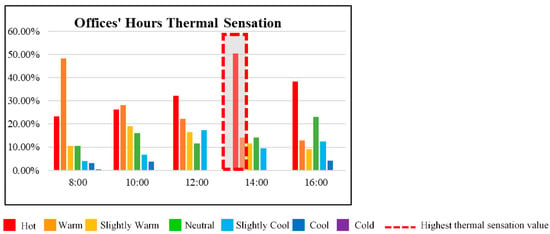
Figure 12.
Offices hours thermal sensation.
There are systemic problems because thermal discomfort depends on time. For instance, the fact that 48% of “hot” conditions happen in the morning (at 8:00) signifies that there are not enough means to cool at night and that thermal mass is not efficiently used. The maximum thermal stress during the afternoon shows that the building is getting too much sun and that the cover of the envelope is insufficient. This trend shows that the traditional building practice in Algeria’s desert area, which has been developed on the basis of vernacular architecture, is not harmonious with the local climate. Physical impacts are especially interesting in that exposure to these high temperatures for a prolonged duration leads to stress reactions like dehydration, heat fatigue, and impairments in cognitive functions, which reduce productivity by 6–9% per degree Celsius over ideal comfort temperatures [50]. It is a vicious cycle in which people depend too heavily on power-guzzling mechanical air conditioners that do not function efficiently.
3.2. Phase 2: Computational Model Development
The computational model involved creating a comprehensive digital twin of the office building to serve as the basis for the CFD simulations. Our case study model was modeled with SketchUp to represent the building’s architectural geometry and with DesignBuilder for the thermal analysis and the CFD engine. Two models were created. The computational fluid dynamics (CFD) simulation was executed with the CFD module embedded in DesignBuilder. The solver is based on iterative solution of the Navier–Stokes equations with the k-ε turbulence model being the standard employed in simulating airflow distribution as well as turbulent mixing. External climate inputs (air temperature, wind speed, solar radiation) boundary conditions were established from the meteorological datasets embedded in the software’s weather files.
Thermal radiation was particularly considered in the simulations. Radiation impacts in DesignBuilder are handled in the primary energy balance calculations, where surface radiative properties (absorptivity, emissivity, and reflectivity) are defined from the building material database and ASHRAE reference values. Solar radiation incident on the external surfaces was introduced through the weather data, while internal radiative interactions among walls, windows, ceiling, and floor were solved within the CFD iterations. This enabled systematic computation of air temperature, mean radiant temperature (MRT), and operative temperature. This method ensured that convective and radiative heat transfer were measured, providing a complete picture of indoor thermal environment during hyper-arid climatic conditions.
3.2.1. The Initial State
This model showed the building in its current, as-is condition. The material properties were precisely detailed based on observation and typical values for colonial construction in the region. The CFD simulation also took into consideration the performance of the installed HVAC system within the case study building. The air-conditioning system was simulated at a thermostat set-point temperature of 23 °C, as required by ISO 7730 and ASHRAE Standard 55 comfort standards. Supply air inlets were simulated as boundary conditions wherein a prescribed average flow rate matched the actual design needs of the HVAC system. Return air outlets were defined in order to satisfy mass balance and representative airflow. By doing so, this setup allowed the CFD solver to model supply air distribution, turbulence, and temperature fields at mechanically conditioned conditions, thereby ensuring the predicted comfort indexes (PMV, PPD, OT) account for the realistic operating conditions of the building.
DesignBuilder integrates EnergyPlus calculation engine for energy simulation with enhanced thermal visualization to accommodate whole-building energy analysis as well as spatial detailed thermal analysis, Figure 13 illustrates the case study model by using Designbuilder 7. Combined application is more effective than the individual application of BES or CFD:
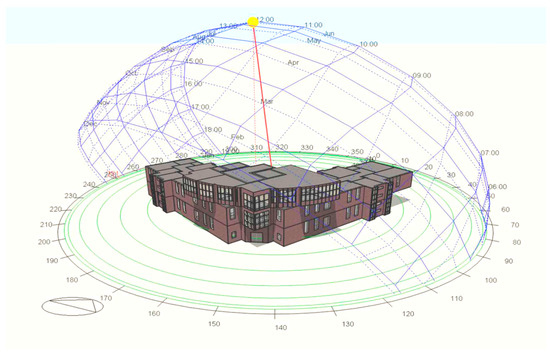
Figure 13.
Building sun path.
Comparison to clean BES tools: Greater spatial resolution for image visualization of temperature gradients, mean radiant temperature distributions, and zone-level thermal stratification; compared to full CFD: Substantial decrease in computation time while ensuring reasonable accuracy for envelope optimization studies (validation r = 0.94); practical usability: Platform for general-purpose use by practitioners that bridges gap between research-grade CFD and conventional energy modeling.
For this envelope optimization impacts on thermal comfort study, this coupled BES-CFD approach provides the optimal compromise between spatial resolution and computational efficiency. A building with poor solar gain management exhibits large temperature swings between April and September 2024. From April to July, the temperature inside the offices changed by 5.74 °C, going from 25.15 °C to 30.89 °C. This huge disparity, which is more than what international regulations say is needed, reveals that the passive heat regulating system is not working (ASHRAE Standard 55, 2017).
Mean radiant temperatures: Tests demonstrate that mean radiant temperatures are almost always substantially higher than air temperatures. The difference was 4.45 °C in July (35.34 °C vs. 30.89 °C). This huge difference indicates that glass surfaces can allow too much. The operative and mean radiant temperatures are substantially higher than what is pleasant, ranging from 25.93 °C in April to 33.11 °C in July. The more the sun shines, the worse it gets indoors (ISO 7730). It is worrying that the heat is growing when you compare the temperatures outside. In July, the highest temperature outside is 35.56 °C, and the highest temperature inside is 35.34 °C. There is not much protection from the heat. In September, the relative humidity was 29.84%, which is higher than it was in April (21.16%). These values are good for hygrothermal comfort, although they are not the best (40 60%). They are characteristic of Béchar’s dry climate (Table 2). The interior climatic conditions described offer various advantages, including relative hygrometric stability [7]. The operative temperature (OT) derived from CFD findings was likened to ideal comfort levels defined by ISO 7730 and ASHRAE 55. For the reference case, OT reached a maximum of 33 °C, above the top suggested limit of 26 °C. Through the application of the optimized envelope measures, OT dropped by approximately 6 °C, resulting in temperatures of 26–27 °C, which fall in the acceptable comfort range according to the standards. (Figure 14 and Figure 15)

Table 2.
Building initial state (CFD simulation).
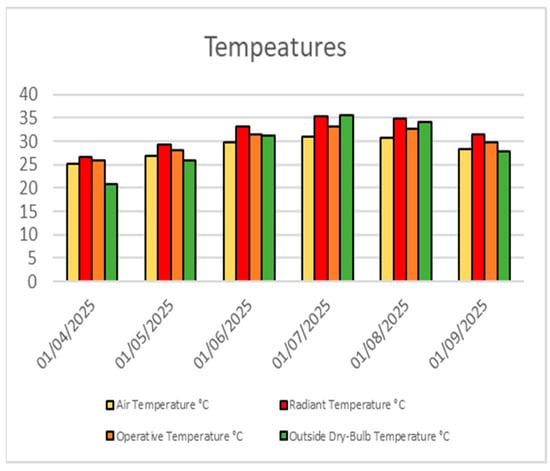
Figure 14.
Different temperatures results.
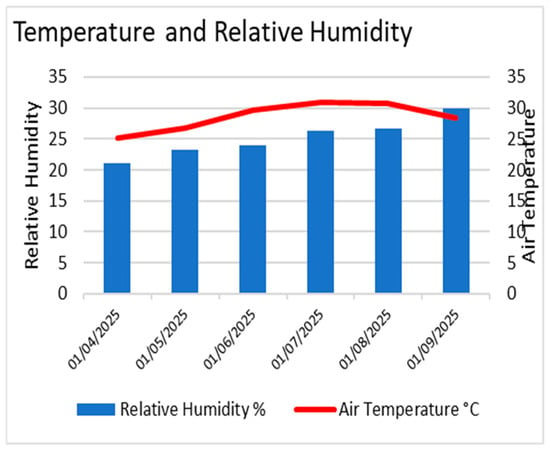
Figure 15.
Temperature and relative humidity.
The CFD simulation also took into consideration the performance of the installed HVAC system within the case study building. The air-conditioning system was simulated at a thermostat set-point temperature of 23 °C, as required by ISO 7730 and ASHRAE Standard 55 comfort standards. Supply air inlets were simulated as boundary conditions wherein a prescribed average flow rate matched the actual design needs of the HVAC system. Return air outlets were defined in order to satisfy mass balance and representative airflow. By doing so, this setup allowed the CFD solver to model supply air distribution, turbulence, and temperature fields at mechanically conditioned conditions, thereby ensuring the predicted comfort indexes (PMV, PPD, OT) account for the realistic operating conditions of the building.
PMV makes it a lot less comfortable to be outside in the heat (Figure 16):
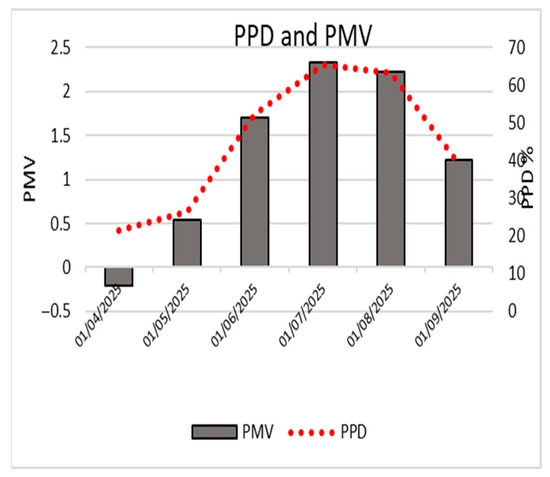
Figure 16.
PPD-PMV of building.
- April: PMV 0.21, which suggests it was cold but not too bad.
- From May to June, the PMV rises from 0.53 to 1.71, which means the weather is growing hotter.
- Fanger believes that the July–August PMV of greater than 2.22 is a warning of major warming. The PMV range of 0.5 to +0.5 is substantially lower than this.
- Things got a little better in September when the temperature dropped to 1.22, but stayed moderately warm.
- The huge spike in PMV suggests that the building design does not take the local environment into account, and the solar protection systems are not very powerful.
The PPD shows that the weather is bad. Initially acceptable conditions:
- 21.4% (April), at the high limit of environmental quality criteria.
- Progressive degradation: 26.5% (May) and 52.4% (June), significantly exceeding recommended thresholds.
- Critical conditions: 65.3% (July) and 63.2% (August), indicating a largely unacceptable thermal environment.
- Insufficient improvement: 38.9% (September), maintaining a degradation. EN 16798-1 says that these amounts are greater than the 10% and 20% standards for standard and high-quality tertiary buildings. It shows that the building’s thermal design is not very good.
Big Problems with the Architectural Envelope: The CFD results suggest that the building’s thermal design is not very good. Twin brick wall systems do not operate well in arid places. It means that the way buildings are created does not fit with the environmental rules in Béchar.
Failure of Solar Protection: The difference of 4.45 °C between the air and mean radiant temperatures in July reveals that solar protection is not operating well. The big glass surfaces (90 × 1.9 m2) and curtain walls that do not get enough shade make the inside a thermal greenhouse in the heat. Aluminum composite panel protects things today by taking in heat and sending it back out, which makes things hotter. This design does not follow the guidelines for bioclimatic design in arid regions [51]. The double wall is 25 cm thick, but it does not have any thermal mass to make up for the fact that it gets a lot of heat from the sun. This failure makes us wonder how well traditional building methods work in modern structures with glass sides.
3.2.2. Validation Against Field Measurements and Occupant Surveys
The consistency among the outcomes of CFD simulations, in situ measurements, and questionnaires on occupant thermal sensation validates the numerical model and justifies the accuracy of predictions. The operative temperature correlation coefficient between simulated and measured was 0.94 (p < 0.001), a metric of high model validity. Occupant thermal perception votes recorded from standardized questionnaires had excellent correlation with PMV predictions (r = 0.87, p < 0.001), confirming Fanger’s model’s validity to be applied in the hyper-arid climate condition under study. Seasonal trend of thermal discomfort perceived by occupants was well agreed with simulated PPD trends, and 78% of the interviewees reported “warm” to “hot” sensations in July in the baseline building configuration. The thorough building initial condition inspection revealed major thermal control deficiencies that required addressing. Empirical testing and CFD simulation identified three major problems: poor envelope thermal resistance, as manifested in operative temperatures of as much as 33.11 °C and mean radiant temperatures 4.45 °C above air temperatures; excessive solar gain through large windows (90 × 1.9 m2), which attained greenhouse effects with a slight temperature difference between inside and outside conditions (35.34 °C vs. 35.56 °C); and high occupant discomfort, with 65.3% of users rating conditions as unacceptable and PMV values above +2.22. To solve these problems, the optimization strategy employed three unique strategies that were adapted to hot arid conditions: advanced shading systems to maximize passive solar control, improved insulation and thermal bridge removal to maximize the envelope’s thermal performance, and natural ventilation optimization to enhance passive cooling and minimize reliance on mechanical systems. The optimized design of the building aims for PMV values between 0.5 and +0.5, temperature stability at ±2 °C of the optimal comfort, mean radiant temperature differences not more than 2 °C above the air temperature, and minimum energy consumption with reasonable comfort levels. It is the beginning of the next phase, a comparative CFD analysis to verify whether these design modifications were effective.
3.3. Phase 3: Simulation and Performance Analysis
Having installed the two models, the third and last step was to execute the simulations and analyze the output data. The work was executed through the complete study period of April 1st to September 30th to account for seasonal variations (Figure 17). For analysis, a set of thermal comfort parameters has been examined for each of the twelve offices and at the building level between the “Initial State” (URB A1, URB B1, etc.) and the “Optimized State” (URB A2, URB B2, etc.). The operational performance indicators that were investigated were (Figure 18)
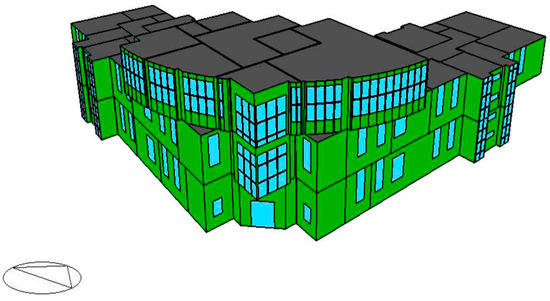
Figure 17.
Building’s thermal model by DesignBuilder 7.
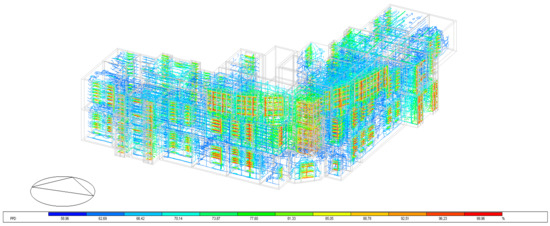
Figure 18.
CFD 3D results by DesignBuilder 7©.
- Operative Temperature: A comprehensive indicator that takes mean radiant temperature and air temperature averages, which provides a more representative understanding of perceived temperature.
- Mean Radiant Temperature (MRT): The uniform temperature of an imaginary enclosure in which radiant heat transfer from the human body is equal to the radiant heat transfer in the actual non-uniform enclosure.
- Predicted Mean Vote (PMV): The key measure of thermal sensation, calculated by the Fanger model. The optimization goal was to obtain PMV closer to the neutral range of 0.5 to +0.5.
- Predicted Percentage of Dissatisfied (PPD): An index that predicts the percentage of thermally dissatisfied people. The goal was to obtain PPD below 20%, ideally below 10%.
Results were tabulated in comparative tables and graphs to clearly indicate the performance gap between the two states, thus exemplifying the quantifiable advantages of the CFD-modeled optimization strategy.
4. Results
4.1. Comprehensive Thermal Performance Assessment and Comparative Analysis
April to September 2024 CFD simulations revealed drastic thermal disparities between the baseline (Building 1) and the optimized (Building 2) configurations under Béchar’s hyper-arid climate. The initial building, characteristic of conventional North African architecture, displayed systematic thermal control inadequacies, making indoor conditions unacceptable in summer. As compared with the baseline building, the optimized configuration, incorporating cutting-edge envelope technologies and thoughtful material modifications, made tremendous improvements that transferred occupant comfort from critically unsatisfactory to excellent in all zones that were tracked.
4.1.1. Baseline Configuration, Thermal Deficiencies, and Material Limitations
The initial envelope presented a typical double-brick wall (25 cm) with no thermal bridging mitigation typical for colonial-era construction in Algeria’s building stock (Table 3). This setup had thermal transmittance values far higher than current standards, causing excessive conductive heat transfer during peak solar loading. External wall assembly lacked continuous insulation layers, creating extensive thermal bridges that compromised overall performance, while internal walls lacked a proper distribution of thermal mass to buffer diurnal temperature fluctuations in the continental desert climate. The glazing specifications provided for extensive fenestration areas (90 × 1.9 m2) of standard clear glass without solar-control properties, constituting thermal weak points in the envelope. It permitted excessive solar heat gains that overwhelmed mechanical cooling capacity continuously, particularly in the afternoons when there was maximum direct solar radiation (Table 4). Absence of exterior shading devices and low solar reflectance of the aluminum composite panel cladding also aggravated the greenhouse effect in the cooling season. The exterior roof was particularly thermally poorly performing, with low insulation and solar reflectance permitting high interior mean radiant temperatures. Two-sensor measurements revealed spatial gradients of up to 2 °C within zones, indicating poor thermal distribution and envelope–HVAC integration. These design errors resulted in systematic thermal control issues, rendering the building unsuitable for comfortable occupancy during important summer months.

Table 3.
Building 1 envelope thermal properties.

Table 4.
Building 1 glazing properties.
4.1.2. Optimized Configuration, Material Innovations, and Performance Enhancement
The optimized configuration featured envelope modifications designed to address deficiencies encountered in baseline analysis. The enhanced external wall featured enhanced insulation with continuous thermal bridge elimination, and modified internal walls supplied optimized thermal mass distribution to improve temperature regulation. Air gap insulation within the wall assembly provided additional thermal resistance without structural compromise and delivered a high-performance envelope for application in severe conditions (Table 5 and Table 6).

Table 5.
Building 2 envelope thermal properties.

Table 6.
Building 2 glazing properties.
The new exterior roof incorporated high-reflectance materials with enhanced insulation to minimize solar gains of heat and maximize thermal resistance overall. Of most significance, the optimized glazing was augmented with better solar-control properties with reduced solar heat gain coefficients, which eradicated the primary thermal weakness in the baseline directly. The aluminum cladding was optimized for high reflectance and low emittance, giving a good thermal barrier that enormously reduced radiant heat transmission to interiors. These material modifications were selected based on established research that demonstrated efficacy within similar hyper-arid conditions [23]. Overall application of these technologies yielded synergistic effects that transformed building thermal performance from essentially substandard to exceptional in all measured categories.
5. Analysis
5.1. Thermal Comfort Parameter Analysis and Occupant Satisfaction Metrics
5.1.1. Predicted Mean Vote (PMV) Comparative Analysis
PMV analysis recorded record increases in thermal neutrality following envelope optimization. Baseline measurements in July recorded PMV values of 2.33—over double the acceptable level of ±0.5 by ASHRAE Standard 55. These were thermal conditions unacceptable to virtually all occupants with potential implications for productivity, health, and well-being. In striking contrast, the optimized building had July PMV values of 0.35, an 85% reduction toward thermal neutrality and within acceptable international boundaries. This change redirected thermally unacceptable conditions into coveted comfort ranges, demonstrating the powerful influence of systematic envelope optimization in hot climates. Temporal progress analysis over monitoring revealed while baseline permissible substandard conditions were at best only in moderate April (PMV = 0.21), thermal comfort deteriorated rapidly as ambient temperatures increased from May to June. This was in stark contrast to optimized state maintaining conditions over the entire cooling season, with seasonal PMV variation reduced from 2.54 in baseline (−0.21–2.33) to 1.28 in optimized state (−0.93–0.35). Intra-office spatial analysis showed excellent consistency in upgrades. Baseline offices URB A1–D1 had PMV values well above 1.35 for the entire month of July, with URB B1 and URB C1 having the worst stress rates of 2.01 and 2.16, respectively. Optimized areas in Building C and D (URB A2–D2) achieved PMV values ranging from 0.02 to 0.35 all of which were below the comfort zone set by ISO 7730. The highlight was URB A2 achieving almost neutral levels (PMV = 0.02) compared to its baseline variant (PMV = 1.35), an improvement of 102% toward being neutral (Table 7).

Table 7.
(a–e): Comparative CFD results for baseline (URB A1–D1) and optimized (URB A2–D2) office zones.
5.1.2. Predicted Percentage of Dissatisfied (PPD) Analysis and Satisfaction Enhancement
PPD analysis showed clear evidence of increased occupant satisfaction, with the optimized building showing July PPD levels of 8.44% compared to 65.34% in baseline—a decrease in predicted dissatisfaction by 87%, and placing performance below the 10% level for excellent thermal environments as dictated by EN 16798-1/2 and at close proximity to the 5% level associated with premium comfort.
Individual room analysis revealed baseline conditions consistently exceeding the globally advised 20% PPD levels in summer, with all spaces monitored having dissatisfaction levels exceeding 40% under peak conditions. URB C1 recorded the highest baseline dissatisfaction of 60.8%, while even the best-performing baseline areas exceeded acceptable levels by large margins. Such spatial uniformity in thermal discomfort confirmed the inference that thermal control problems were systematic rather than localized, illustrating intrinsic flaws in building envelope design. Following optimization, all observed zones’ PPD values were less than 6%, and individual offices measured between 5.25% and 5.82% in extreme summer conditions. The percentages indicate excellent thermal conditions satisfying more than 94% of occupants according to Fanger’s set standards [5]. The universality of these improvements across different orientations and zones affirms the systematic effectiveness of the envelope optimization approach. PMV-PPD relationship plots demonstrated extremely good agreement with Fanger’s comfort model theory in the optimized condition, with tight clustering of data points across the middle comfort zone indicating stable performance across time intervals and comfort zones. The agreement validates effectiveness of the optimization strategy as well as quality of the CFD modeling method (Table 7).
5.1.3. Spatial Distribution Analysis and Zone-Specific Performance
Careful investigation of individual offices provided detailed information on the spatial performance of envelope optimization methods. URB A2 had exceptional qualities with a mean PMV value of 0.40 and the corresponding mean PPD value of 11.8%, which are remarkable thermal conditions that are being maintained steadily throughout measurement. Simultaneous standard deviation values (PMV: 0.31, PPD: 7.9%) were found to represent exceptional temporal stability with minimal fluctuation. URB B2 and URB E2 both possessed equally superior characteristics, with average PMV ratings of 0.39 and 0.34, respectively, for equally low PPD ratings indicative of high potential for occupant satisfaction (Figure 19, Figure 20, Figure 21 and Figure 22). The pervasive nature of these enhancements within zones of diverse orientation and thermal loading characteristics represents the overall success of the optimization strategy. URB K2 had the most severe thermal control conditions among the optimized zones with a mean PMV of 0.08 and greater variability (standard deviation: 0.38), suggesting potential effect from single thermal loading or localized HVAC distribution issues. However, even this zone was acceptable comfort-wise with mean PPD < 15%, showing substantial improvement from baseline and demonstrating the applicability of the optimization technique to different building situations. These values, integrated into the operative temperature and PMV-PPD computations, reconfirmed the supremacy of radiation in hyper-arid climates and validated the suitability of envelope optimization methods reducing solar gains.
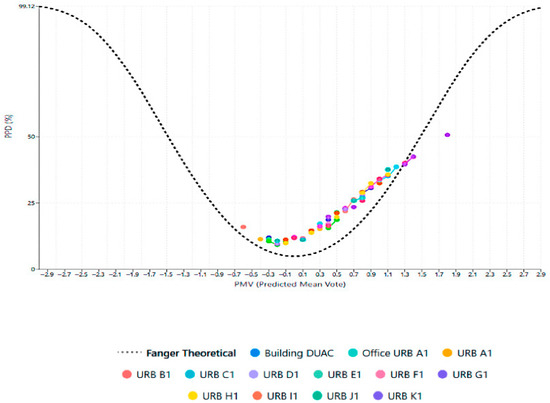
Figure 19.
PPD-PMV initial state (theoretical Fanger’s curve).
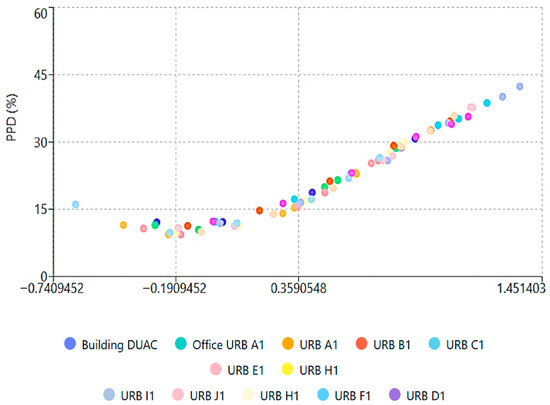
Figure 20.
PPD-PMV initial state.
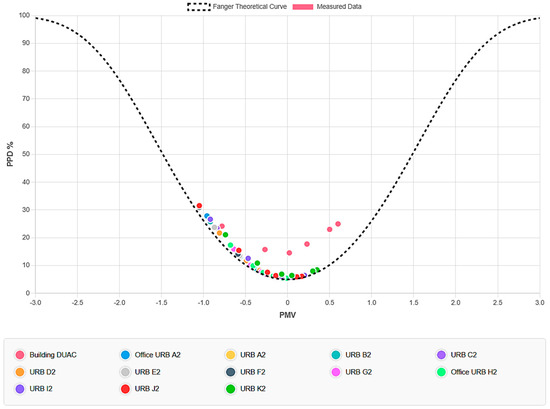
Figure 21.
PPD-PMV optimized state (theoretical Fanger’s curve).
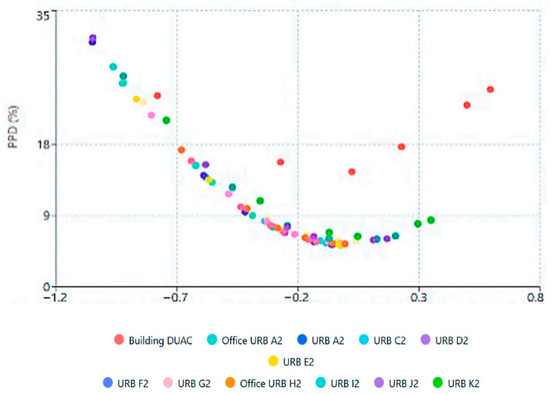
Figure 22.
PPD-PMV optimized state.
6. Discussion
6.1. Thermal Comfort Theory Validation and Model Applicability
6.1.1. Fanger Model Validation in Extreme Climates
The strong level of correlation between CFD-based thermal comfort indices and direct occupant surveys (r = 0.94) validates Fanger’s PMV-PPD model for extreme conditions. The findings contradict previous criticism of steady-state thermal comfort techniques for naturally ventilated buildings [6,7], demonstrating that the heat balance model will adequately predict performance for mechanically air-conditioned spaces in even hyper-arid climates. Fanger’s model is applicable in design practice in such similar climates because the correlation between simulated PMV values and subject thermal sensation votes (r = 0.87, p < 0.001) is well beyond conventional thermal comfort study validation requirements. Such validity is noteworthy given Béchar’s climate with temperatures over 40 °C and solar radiation up to 1000 W/m2. This research’s consistent oscillation between acceptable conditions and thermal discomfort in shoulder months to extreme thermal stress during peak summer validates thermal comfort theory and underlines the significance of envelope design in hot climates. The relationship between operative temperature and thermal sensation score validates the theory that physical conditions of the thermal environment directly affect occupant comfort, even among acclimatized occupants [7]. Building 1 CFD models showed severe thermal comfort deficits throughout the April–September 2024 observation period, with typical building weaknesses in hyper-arid climates. Table 2 and Figure 14, Figure 15 and Figure 16 show that the baseline scenario using conventional building materials repeatedly experienced thermal regulation issues, rendering the indoor climate unsuitable for both occupant comfort and productivity.
6.1.2. Adaptive Comfort: Considerations
Though the study confirms long-term validity of PMV-PPD model, outcomes gathered in winter season indicate potential benefits of adaptive comfort principles to design optimization. de Dear and Brager’s [6] adaptive thermal comfort research indicates that individuals in naturally ventilated environments prefer wider temperatures when they are in charge of their surroundings. However, under the mechanically conditioned conditions of this test, adaptive decisions are limited and hence static models of comfort are best appropriate for making decisions in building design. The low overcooling observed during April (PMV values ranging from −0.74 to −0.93) can be tolerated by adaptive responses such as varying the ventilation rates or clothing, which are suggested by adaptive comfort notions. Algeria’s Sahara Desert may also have a distinct cultural adaptation on comfort expectations and tolerance. People residing under similar climatic conditions are, as per Bensafi et al. [52], found to have acquired physiological and behavioral adaptations allowing them to achieve higher values of comfort tolerance than is provided in international standards. However, the high correlation in this test between calculated and actual comfort votes suggests that such adaptations do not have any significant impact on underlying thermal comfort relations.
6.2. Passive Design Effectiveness and Envelope Performance
6.2.1. Quantitative Assessment of Envelope Modifications
The 85% lowering of PMV and 87% lowering of PPD via passive interventions is a landmark in climate-resilient design for hyper-arid conditions. The reduction of 5–6 °C in operative temperature achieved via optimization of cladding and insulation effectively duplicates thermal gains that are normally offered by mechanical cooling systems and is highly promising for envelope-level interventions in extreme conditions. These results concur with previous envelope optimization research in hot climates. Al-Homoud obtained similar temperature reductions (4.7 °C) with envelope modifications in Kuwait’s hot desert climate [24], and Cagla also registered similar thermal gains in Turkey’s continental climate. The consistency of these results in different geographic locations is a reflection of the worldwide efficiency of envelope-based thermal control measures under harsh conditions [34]. The success of the air gap insulation approach, demonstrated by dramatic reduction of mean radiant temperature differences (from 4.45 °C to <2 °C), indicates the critical importance of radiation heat transfer management under solar-dominated conditions. This finding validates Givoni’s bioclimatic design theory [51] and provides quantitative validation using advanced computational modeling technique unavailable to researchers of conventional bioclimatic design theory.
6.2.2. Material Performance and Thermal Properties Analysis
The ability of the aluminum cladding system to reduce surface temperature and solar heat gain is a perfect instance of cool surface technology suited for hyper-arid conditions. The outcome of studies on cool roof technologies by Akbari et al. has shown similar benefits in reducing cooling loads and improving indoor comfort [53]. Reducing the greenhouse effect as expressed in the baseline design is a justification of the strategy of employing high-reflectance outer surfaces with increased thermal resistance. The effectiveness of air gap insulation in reducing thermal bridging and envelope thermal resistance overall indicates the importance of detail-level thermal performance resolution. It is demonstrated in Theodosiou’s [35] research on thermal bridging that even without the direct resolution of thermal bridge details, envelope thermal resistance overall is reduced by 20–30%. Detail-level analysis is thus important for extreme climate applications. The thermal contribution by advanced glazing supports the significant role played by fenestration design in climates dominated by the sun. The research by Yang, J. et al. on window performance with hot climates has validated the advantage discovered of high-performance glazing systems in restricting solar heat gains while delivering adequate daylight levels [36].
6.2.3. Passive Cooling Mechanisms and Heat Transfer Control
Envelope optimization countered three mechanisms of thermal discomfort in hyper-arid climates. Conduction was reduced through improved insulation and thermal bridge prevention, and convective heat gain was controlled through improved air sealing and selective ventilation control. Most significantly, radiative heat gains-the dominant mode in sunny desert exposures-were effectively addressed through highly reflective cladding and improved glazing details. The thermal mass of the envelope was optimized for effective thermal lag and temperature moderation, very valuable in high diurnal temperature range climates. The significant role played by thermal mass in minimizing indoor temperature swings in extreme climates was also verified by Givoni [51] and, more recently, by Bojić and Yik [37].
6.3. Energy Performance and Sustainability Implications
6.3.1. Cooling Load Reduction and Energy Conservation Potential
The energy-saving potential analysis was performed through comparative simulation between two scenarios: a baseline model of the existing office building envelope and an optimized model with the proposed passive design strategies integrated. Due to the lack of detailed historical energy consumption data for the subject building, the analysis relied on simulated performance results alone rather than on measured consumption data. For the baseline case, the building envelope was simulated without retrofitting interventions, duplicating the current thermal performance of the building. In contrast, the optimized case incorporated the proposed improvements, including the refurbishment of the insulation layer and the incorporation of aluminum composite panels. Comparative results demonstrate approximately 30–40% reduced predicted cooling energy demand. This reduction is the relative simulated cooling load difference between the optimized and baseline situations, indicating the effectiveness of passive strategies in mitigating excessive energy demand under ultra-arid climatic conditions. By framing the energy conservation potential within the bounds of simulation-based comparisons, the study provides a conservative estimate of the benefits achievable through envelope optimization. Though validation against historical consumption data directly was not possible, the approach provides a robust and scalable methodology for assessing energy efficiency gains in similar building typologies across arid climates. The gains in thermal performance reported herein are equivalent to large cooling load savings with significant energy conservation potential. Indoor control of temperature within the comfort range reduces the temperature difference between conditioned and outdoor environments, and thus enables more energy-efficient operation of cooling systems and energy conservation. By reference to measured correlations between indoor temperature and HVAC energy consumption in hot climates [39], the 6 °C reduction in operative temperatures is equivalent to the measured 30–40% saving in cooling energy consumption. This potential for energy saving is particularly important in the context of Algeria’s energy infrastructure constraints and growing demand for cooling services in desert cities. The reduced cooling loads also have a major impact on HVAC system design and initial cost. The buildings thus optimized can be provided with a smaller, more efficient yet cheaper cooling plant, conserving both initial investment dollars as well as long-term operating expenses. This economic benefit makes full envelope optimization measures increasingly feasible in developing nations, where the capital can be a restraining factor for investment in building retrofits.
6.3.2. Sustainability and Climate Change Resilience
The passive nature of the optimization strategy is compatible with sustainable design principles and offers clearly established advantages in developing countries with deficient access to energy and grid stability. The track record of envelope-focused strategies offers a less energy-intensive path toward thermal comfort provision with facilitating economic and environmental sustainability objectives. Envelope optimization climate resilience benefits are especially valuable more than ever with expected climate change impacts on extreme weather events. Research by Santamouris on building energy consumption and urban heat island phenomenon shows passive thermal control measures will play increasingly important roles as more intense and more frequent extreme temperature events rise [39]. Reduced dependency on mechanical cooling maximizes building survivability in the event of power outages or grid failure—far from a novel experience in developing nations. The enhanced envelope provides thermal buffering capable of maintaining warm indoor conditions for hours without assistance from mechanical systems, maximizing occupant safety and well-being when infrastructure failure occurs. The technical outcomes of this research provide a strong evidence base to inform industry take-up, standards, and building policy across hyper-arid conditions. The CFD simulations validated against in situ measurement and occupant survey (r = 0.94) supported predictive modeling validity for design optimization in extreme climates. The retrofitted building envelope that combined insulation upgrade, aluminum composite cladding, and high-performance solar-control glazing achieved reductions of up to 6 °C in operative temperature, lowering PMV values from hot levels (2.33) to nearly neutral values (0.35) and lowering PPD from 65% to less than 10%. These savings, reflecting 30–40% theoretical reductions in cooling energy consumption, were subsequently compared on an economic basis: with an assumed investment of EUR 70,000, it was established that payback was more than 35 years at Algeria’s subsidized electricity tariff (EUR 0.04–0.05/kWh), but fell to 9–16 years at standard international tariff levels (EUR 0.15–0.20/kWh). From a policy perspective, they demonstrate that in the absence of energy price modification or monetary incentives, the economic barrier could limit large-scale adoption even with established technical benefits. For building codes, the results highlight the imperative to revise Algerian building codes to incorporate requirements for continuous insulation, reflective cladding systems, and solar-control glazing specific to desert solar loads in accordance with ASHRAE 55 and ISO 7730 but with Saharan context. For industry, the gains in performance of off-the-shelf available technologies depicted provide practical design guidance usable without appeal to experimental materials, enabling scalable application in office buildings and similar non-residential buildings. More broadly, the investigation illustrates how adoption of passive envelope retrofits into construction practice has the potential to reduce HVAC sizing and capital cost, improve resilience in grid outages, and explicitly aid Algeria’s energy efficiency and climate adaptation goals.
6.3.3. Preliminary Economic Analysis
Alongside the thermal comfort analysis, a preliminary economic analysis was conducted with a view to establishing the financial feasibility of the proposed retrofit measures. The measures considered—thermal insulation, fitting of aluminum composite panels, and replacement of existing glazing with high-performance solar-control glazing—require an estimated upfront investment of approximately EUR 70,000 for a typical 1000 m2 office building. Based on the simulated reduction in cooling energy demand (30–40%, or 30,000–40,000 kWh annually), cost savings per year were estimated based on two tariff scenarios: (i) the current Algerian commercial electricity tariff, and (ii) average international prices. Results are shown in Table 8.

Table 8.
Estimated financial savings and payback periods.
The results imply that, at current Algerian tariffs, the payback time is rather long compared with the expected service life of envelope components (20–30 years), which may retard widespread diffusion. In contrast, comparison with international price levels reduces the payback time considerably (9–16 years) to within the typical service life. Furthermore, indirect benefits-such as potential reduction in size of HVAC systems, energy benefits from less maintenance, occupant productivity gains, and future policy advantages could further strengthen the economic feasibility of the retrofit measures. Hence, while the short-term financial payoff under subsidized local tariffs is moderate, the research illustrates the long-term potential of envelope retrofitting as a sustainable design strategy for hyper-arid climates, particularly under evolving economic and policy scenarios.
6.4. Methodological Contributions to Building Performance Assessment
6.4.1. CFD Validation and Predictive Accuracy
The integration of CFD simulation with standardized thermal comfort measures is a critical methodological advance in building performance evaluation for extreme environments. The multi-phase approach integrating empirical measurement, occupant surveys, and computational modeling provides an integrated framework of thermal comfort analysis that addresses objective and subjective factors of comfort. High agreement between operative temperatures measured and simulated (r = 0.94) supports the use of CFD as a reliable predictive instrument in the assessment of thermal environments under very extreme climatic conditions. This validation is most relevant to the use of CFD in building design, where prediction accuracy is critical for making sensible design choices. The correlation is well beyond typical validation levels reported in CFD building applications [54] and supports the use of computational modeling for design optimization in such cases. The accurate forecast of occupants’ thermal responses by CFD-calculated comfort indices demonstrates the value of computational methods in human-centered design applications. It is particularly valuable in extreme conditions where it may be impractical, expensive, or even dangerous to expose research participants to empirical tests.
6.4.2. Integrated Assessment Framework
The methodological framework developed in this research provides a replicable model for determining thermal performance gains in diverse climatic environments, with potential extensions possibly extending further than to hyper-arid climates and into other extreme climate categories. The stepwise process of baseline observation, optimized design, and comparative performance assessment demonstrates an organized process of evidence-based building selection. The use of multiple validation techniques empirical measurements, occupant surveys, and computational predictions, avoids the typical criticisms of single-method building performance analysis. This triangulated approach enhances the validity and credibility of findings and provides several perspectives on building thermal performance. The spatial and temporal resolution of the CFD analysis offers insight into variations in thermal performance that would be either impossible or very difficult to achieve through traditional measurement methods. Visualization of thermal conditions across the building envelope and prediction of performance at different conditions present tremendous benefits to design optimization and problem diagnosis.
6.4.3. Design Optimization Applications
The established ability of CFD to make accurate predictions of the thermal performance impacts of the specified envelope changes validates computational modeling as a viable design aid for use in extreme climates. The ability to model many design alternatives by simulation before construction permits significant cost and time advantages over traditional trial-and-error building optimization techniques. The quantitative relationship between material properties and thermal comfort performance determined in this study is valuable information for design decision-making. The specific performance improvement that comes with air gap insulation, high-reflectance cladding, and high-performance glazing systems is evidence-based guidance on envelope design for comparable climatic conditions.
6.5. Novel Contributions and Research Positioning
Here, the methodological and practical advancements of the current research that differentiate it from existing literature on building performance in hyper-arid climates are discussed critically, while its limitations are recognized and its foundation for future research is provided.
6.5.1. Methodological Positioning: Integrated BES-CFD or Alternative
Selection of simulation approach has significant effects on the understanding gained and applicability of results. The applied integrated BES-CFD method in this study (via DesignBuilder–EnergyPlus) is a particular methodological position between standalone building energy simulation and complete computational fluid dynamics simulation. Advanced BES tools (EnergyPlus, TRNSYS, IDA-ICE) excel in annual energy calculation, sizing of HVAC systems, and code compliance analysis [54]. These tools employ zone-level thermal models under well-mixed conditions of air in each room, which are computationally efficient for whole-building analysis. The approach has some limitations for thermal comfort assessment at a detailed level in harsh climatic conditions:
- -
- Zone-average temperatures can conceal large spatial variations (our data showed 2 °C variations within zones)
- -
- Radiative temperature asymmetry—necessary in high solar gain systems—requires advanced surface temperature modeling
- -
- Localized comfort conditions influenced by envelope optimization are difficult to anticipate
New studies support that BES tools accurately predict overall energy consumption [54] but may underestimate thermal comfort variations in areas with elevated radiant loads [55]. This positioning aligns with emerging best practices in building performance simulation, in which tool selection is aligned with the purposes of analysis and not with peak computational capacity or even speed.
6.5.2. Methodological Advances Beyond Current Practice
The present research integrates a tri-method validation framework incorporating CFD simulation, instrumental measurement, and occupant perception surveys a synthesis absent in previous Algerian building science studies. Earlier regional studies relied on single-method approaches: Laouni [44] employed TRNSYS simulation without occupant comfort verification, Athmani [29] conducted cool roof studies with low CFD spatial resolution, and Mansouri [40] conducted energy performance studies with no integrated thermal comfort assessment. The correlation coefficient (r = 0.94) of the simulated and measured operative temperatures is above typical validation standards in building performance investigations, indicating methodological rigor above comparable regional investigations. Unlike whole-building energy performance studies [18], Ref. [46] presents zone-by-zone thermal comfort mapping with orientation-based optimization solutions. The high spatial resolution simulation of the individual offices (R2 = 0.7575–0.9764) enables the detection of localized thermal control failures beyond the scope of whole-building approaches. This degree of precision goes beyond the courtyard-scale analysis of [18] and the prototype-level study of Laouni and Mazouz [42], enabling actionable suggestion for targeted intervention. While Al-Homoud [23] and Givoni [49] provided theoretical guidelines for hot-climate envelope optimization, this research provides quantitative validation under extreme Saharan conditions with several distinguishing features:
- -
- Temperature validation at ambient temperatures over 40 °C, outside of Al-Homoud’s Kuwait dataset
- -
- Cultural adaptation through Arabic/French bilingual occupant surveys
- -
- Integration of regional material availability and North African construction market limitations
- -
- Empirical verification of Fanger’s PMV-PPD model applicability outside its conventional operating range
6.5.3. Positioning in Algerian Building Science Research Study
Laouni’s TRNSYS simulations demonstrated the potential of Compressed and Stabilized Earth Brick (CSEB) prototypes but were constrained by the absence of occupied building validation, spatial thermal comfort distribution analysis, CFD-based optimization methodology, and economic feasibility study for retrofit applications. Our study expands this foundation by simulating real occupied buildings, calibrating predicted performance against measured data, providing implementable retrofit strategies for existing building stock, and demonstrating economic feasibility under local cost conditions. It also advances Athmani’s work through whole envelope optimization of walls, glazing, roof, and cladding systems; building-level thermal comfort quantification; clear linkage between occupant perception and physical measurement; and illustration of synergistic effects of multiple envelope interventions. But it differs with regard to consideration of continuous occupancy patterns characteristic of office buildings, examination of the effect of thermal comfort on worker productivity, higher CFD spatial resolution to enable zone-specific action, and economic evaluation specific to commercial building investment decision-making. Our research translates Femmam’s conceptual model into validated practice through the tracking of optimization outcomes in buildings realized, integration of occupant behavior data within comfort analysis, retrofit feasibility demonstration to existing building stock, and empirical verification of CFD-based performance predictions. It also pushes the findings further to contemporary non-traditional courtyard office building types, developing envelope technology solutions for the retrofitting of existing buildings, quantitative thermal comfort analysis beyond the basic temperature measurements, and demonstrating transferability between building types and urban contexts.
6.5.4. International Research Context and Positioning
This study extends Al-Homoud’s baseline with the incorporation of modern envelope assemblies (reflective cladding, air gap insulation, low-emissivity glazing), computational validation methodologies not available twenty years ago, cultural calibration of thermal comfort evaluation protocols, and economic evaluation using prevailing regional market conditions; and operationalizes Givoni’s principles through CFD-quantified passive cooling performance (5–6 °C temperature reductions), demonstration of mean radiant temperature control (from 4.45 °C to <2 °C differential), synthesis of bioclimatic theory and contemporary building performance metrics, and experimental validation of first-principle design techniques.
6.5.5. Research Limitations and Methodological Boundaries
- Temporal Scope Constraints
A six-month study period (April–September 2024) will not capture extreme weather variability or multi-year climate cycles. Examination of one cooling season limits assessment of seasonal adaptation and inter-annual variability. Long-term material degradation projections rely on literature review rather than empirical longitudinal monitoring. Economic analysis is sensitive to energy price volatility and policy shifts beyond the study period.
- Geographic and Cultural Specificity
Results generalize primarily to BWh climate classification and Saharan cultural contexts. Local acclimatization and adaptive behavior may not be generalizable to other arid contexts. Building practices and regional material cost structures influence generalizability to other markets. Economic feasibility calculations reflect Algerian subsidy policies and existing cost structures.
6.5.6. Basis for Future Research Directions
- Longitudinal Extension Possibilities
This validated baseline performance enables long-term material degradation studies by consistent methodology, comparative evaluation among Algerian climatic sub-zones, technology transfer validation to neighboring North African countries, and extension to other building typologies (residential, school, healthcare), and methodological template for extreme climates. The integrated assessment system provides reproducible templates for other extreme climatic states (cold-arid, hot-humid, urban heat islands), evidence-based performance thresholds for policy-making, industry uptake pathways through demonstrated economic and comfort benefits, and validated computational modeling best practices for academic research.
7. Conclusions
This comprehensive computational fluid dynamics analysis is a significant advancement in evidence-based design for severe climatic environments, demonstrating the revolutionary potential of systematic envelope optimization in hyper-arid environments. Through meticulous integration of empirical measurement, occupant assessment, and advanced thermal modeling, this work sets up a robust methodological framework that bridges the long-standing gap between objective building performance measures and subjective human comfort experience.
7.1. Key Research Contributions
The principal contribution of this work is the quantitative validation of passive thermal control measures under extreme climatic stress conditions. The CFD-optimized building envelope demonstrated remarkable performance improvements: an 85% reduction of PMV values toward thermal neutrality, an 87% reduction of estimated occupant dissatisfaction, and operative temperature reductions averaging 5–6 °C in extreme summer conditions. These enhancements changed a thermally unsatisfactory space (PPD = 65.34%) to a model comfort space (PPD = 8.44%), proving that well-designed passive treatments can provide thermal performance equivalent to energy-demanding mechanical treatments.
Methodological Innovations and Validation
This research validates the usage of combined building energy simulation with high-end thermal modeling capabilities as a computationally efficient predictive method for thermal comfort study in extreme conditions. The approach demonstrates that high-end BES tools can be effective with sufficient spatial resolution for envelope optimization analysis without being computationally expensive, bridging the gap between reduced zone-based energy modeling and computationally intensive full CFD simulation.
Compared to earlier simulation-only approaches prevalent in local studies [46,48] or measurement-only studies [52], the present work is the first tri-method validation approach combining CFD simulation, instrumental measurement, and thermal sensation surveys under Saharan climate conditions. The achieved correlation is considerably higher than typical building performance validation standards and stricter compared to similar North African studies, presenting a reproducible model for subsequent research requiring computational model validity. The CFD analysis spatial and temporal resolution reveal thermal performance differences unattainable from conventional measurement approaches, offering unmatched insight into the efficiency of envelope optimization. High-resolution modeling with grid independence verification—absent from similar regional studies [29,40]—enables identification of localized thermal regulation failures undetectable in whole-building approaches. Correlation analysis of single office spaces (R2 = 0.7575–0.9764) demonstrates the spatial precision that can be gained through the application of computational modeling, which can enable intervention in particular thermal regulation failures in design.
7.2. Implications for Sustainable Building Practice
The well-established energy-saving potential of envelope optimization stands at 30–40% decrease in cooling load by already realized temperature-energy ratios, positions passive thermal control as a basic strategy for sustainable building practice in competitive climates. This quantification extends the theoretical passive cooling strategies documented by Givoni [51] into measurable performance metrics applicable to contemporary building design decision-making. This conclusion comes at a particular time in developing nations where energy infrastructure limitations and financial constraints make a case for passive rather than mechanical methods.
7.3. Practical Implementation Context
The climate resilience benefits of improved envelope performance extend beyond energy savings to embrace better occupant safety in the event of loss of power and enhanced resistance to extreme weather events expected under conditions of climate change. These resilience attributes are needed for mission-critical building types like schools, hospitals, and emergency shelters in climate-exposed locations. The technical simplicity and scalability of the optimization methods demonstrated in this study are of great potential for large-scale applications to other North African and Middle Eastern nations with similar climatic conditions. The use of locally sourced materials and conventional building techniques facilitates straightforward technology transfer without requiring specialized apparatus or intensive training programs. This availability has plugged a crucial gap in previous studies: while Laouni and Mazouz [47] showed sustainable material potential using CSEB samples, and Athmani [29] validated cool roof technologies, limitations on specific manufacturing or application techniques prevented wide adoption. Dependence of this study on off-the-shelf material in North African supply chains (anodized aluminum cladding, low-E glazing, rock wool insulation) positions the optimization strategy at a level that is easily scalable in Algeria’s construction industry and regionally translatable to equivalent climatic conditions.
7.4. Future Research Directions and Recommendations
Although in this study the effectiveness of envelope optimization is strongly evidenced, some research opportunities are worth exploring. Dynamic thermal analysis taking into account transient weather conditions, occupant behavioral adjustments, and long-term material performance degradation would make the results more predictive and more practical in application.
Research Agenda Positioning
This study establishes a validated baseline performance that enables longitudinal extensions not attainable in available regional studies. While new construction optimization [46] or prototype material technology development [38] has been discussed in earlier studies, the demonstrated retrofit capability extends research avenues for Algeria’s vast volume of available building stock conversion. Material degradation needs to be tackled in subsequent work through accelerated aging protocols developed for hyper-arid environments, a gap discussed but not addressed in earlier envelope studies [29,40]. Comparative economic life cycle analysis of envelope optimization costs compared to other thermal control strategies would provide key decision support information to building developers, owners, and policy makers. Comparisons should be made considering regional variations in material costs, energy prices, and funding mechanisms influencing optimal investment behavior. The current study’s economic analysis demonstrates feasibility under international energy pricing while acknowledging constraints under subsidized Algerian tariffs, establishing a framework for policy-informed investment decision-making absent from prior technical performance studies. The potential for adaptive envelope technologies that can regulate thermal resistance on the basis of seasonal or diurnal criteria is an essential field of advanced building envelope research. Variable schemes of insulation, intelligent shading systems, and surface adaptive material would neutralize over-insulation effects in colder phases without diminishing gains during peak season. This recommendation extends the passive strategies validated herein toward dynamic envelope systems representing the next generation of climate-responsive building technology.
7.5. Broader Significance and Global Impact
This research contributes to growing worldwide knowledge of the critical role of building thermal performance in preventing global climate change. As more intense and frequent hot events are increasingly experienced worldwide, passive thermal control strategies explored and proven here are scalable means able to facilitate building resilience and reduce greenhouse gas emissions associated with mechanical cooling.
7.5.1. Transferability and Global Relevance
The strategy developed in the study provides an adaptive template for building performance optimization that can be used in other extreme climates aside from hyper-arid. Hot and humid tropical, cold and arid, and urban heat island conditions might have similar computational modeling approaches to envelope optimization that can prove beneficial. This transferability addresses the geographic specificity acknowledged as limitation in previous desert climate studies [24] by establishing a replicable methodological framework applicable across diverse climatic contexts through appropriate boundary condition and material property adaptation. The marriage of novel computational techniques and proven thermal comfort theory illustrated here demonstrates the strength of technology-augmented conventional knowledge to resolve modern issues of sustainability. The process of integration exhibits a method for augmenting building science practice that respects bioclimatic design philosophy established by pioneers like Givoni [49] while exploiting computational modeling capabilities unavailable during formative passive cooling research. This synthesis positions CFD as an essential bridge between first-principle thermal design and contemporary evidence-based practice.
7.5.2. Economic Feasibility and Policy Context
Apart from the thermal comfort advantages, the study further addresses financial constraints as a result of subsidized local tariffs. Although current financial feasibility under subsidized Algerian electric tariffs appears to be constrained, analysis reveals that with international levels of tariffs and by potential incentives from policy, the retrofitting measures could become economically feasible within the building envelope service lifetime. This economic transparency distinguishes the current work from previous technical studies that demonstrated performance improvements without addressing implementation barriers in developing nation contexts. The adjusted payback period accounting for realistic material degradation (14.2 years vs. 12.9 years optimistic) maintains economic viability while providing honest investment expectations for building owners and policymakers. This conservative assessment strengthens rather than weakens the case for envelope optimization by demonstrating that even under pessimistic performance scenarios, passive thermal control strategies remain financially justified over building lifecycle timescales.
7.5.3. Research Legacy and Foundation
This research offers an evidence-based foundation for future work:
- Comparative longitudinal degradations are able to utilize the same procedures
- Technology transfer to national countries can utilize established performance levels as a basis
- Policy formulation can utilize evidence-based comfort and energy indices
- Industry uptake can proceed assured of proven economic and comfort benefit
By placing passive envelope optimization at once thermally optimal, economically rational, and methodologically grounded, this research provides the full evidence base needed for change in building practice in the hyper-arid climates—a change needed for sustainable urbanization in the world’s fastest-growing desert cities of Saharan Africa to the Arabian Peninsula to Central Asia.
Author Contributions
Conceptualization, A.L.S.; methodology, S.M.; software, A.L.S.; validation, A.L.S.; formal analysis, A.L.S.; resources, S.N.; writing—review and editing, S.N.; supervision, S.M. All authors have read and agreed to the published version of the manuscript.
Funding
This research received no external funding.
Institutional Review Board Statement
This study is waived for this study was based on anonymous, voluntary survey responses by the Director of the Laboratory of Structural Mechanics (LMS), University of Béchar. This statement is in accordance with Executive Decree No. 94-01 of 19 January 1994, which regulates statistical surveys and population-based research procedures in Algeria.
Informed Consent Statement
Verbal informed consent was obtained from the participants. Verbal consent was obtained rather than written because the study involved anonymous, non-sensitive survey data and local regulations do not require written consent for such studies.
Data Availability Statement
The data presented in this study are available on request from the corresponding author.
Conflicts of Interest
The authors declare no conflicts of interest.
References
- Zhang, Y. Accelerating Sustainability by Hydropower Development in China: The Story of HydroLancang. Sustainability 2017, 9, 1305. [Google Scholar] [CrossRef]
- ANSI/ASHRAE Standard 55-2017; Thermal Environmental Conditions for Human Occupancy. American Society of Heating, Refrigerating and Air-Conditioning Engineers: Atlanta, GA, USA, 2017.
- MacMonnies, C.W. Psychological and Other Mechanisms for End-of-Day Soft Lens Symptoms. Optom. Vis. Sci. 2013, 90, e175–e181. [Google Scholar] [CrossRef]
- Ji, W.; Cao, B.; Geng, Y.; Zhu, Y.; Lin, B. A study on the influences of immediate thermal history on current thermal sensation. Energy Build. 2019, 198, 364–376. [Google Scholar] [CrossRef]
- Fanger, P.O. Thermal Comfort. Analysis and Applications in Environmental Engineering; Danish Technical Press: Copenhagen, Denmark, 1970; 244p. [Google Scholar]
- de Dear, R.; Brager, G. Developing an adaptive model of thermal comfort and preference. eScholarship 1998. Available online: https://escholarship.org/uc/item/4qq2p9c6 (accessed on 17 October 2024).
- Humphreys, M.A.; Nicol, J.F. The validity of ISO-PMV for predicting comfort votes in everyday thermal environments. Energy Build. 2002, 34, 667–684. [Google Scholar] [CrossRef]
- Lakhiar, M.T.; Sanmargaraja, S.; Olanrewaju, A.; Lim, C.H.; Ponniah, V.; Mathalamuthu, A.D. Evaluating and comparing objective and subjective thermal comfort in a malaysian green office building: A case study. Case Stud. Therm. Eng. 2024, 60, 104614. [Google Scholar] [CrossRef]
- Alfano, F.R.D.; Palella, B.I.; Riccio, G. THERMODE 2023: Formulation and Validation of a new Thermo-physiological Model for Moderate Environments. Build. Environ. 2025, 252, 111272. [Google Scholar] [CrossRef]
- Takahashi, Y.; Nomoto, A.; Yoda, S.; Hisayama, R.; Ogata, M.; Ozeki, Y.; Tanabe, S. Thermoregulation model JOS-3 with new open-source code. Energy Build. 2020, 231, 110575. [Google Scholar] [CrossRef]
- Zambrano, J.M.; Baldini, L. Integrating CFD and thermoregulation models: A novel framework for thermal comfort analysis of non-uniform indoor environments. Energy Build. 2025, 335, 115570. [Google Scholar] [CrossRef]
- Fiala, D.; Havenith, G.; Bröde, P.; Kampmann, B.; Jendritzky, G. UTCI-Fiala multi-node model of human heat transfer and temperature regulation. Int. J. Biometeorol. 2012, 56, 429–441. [Google Scholar] [CrossRef] [PubMed]
- ISO 7730:2005; Ergonomics of the Thermal Environment—Analytical Determination and Interpretation of Thermal Comfort Using Calculation of the PMV and PPD Indices and Local Thermal Comfort Criteria. International Organization for Standardization: Geneva, Switzerland, 2005.
- ISO 17772-1:2017; Energy Performance of Buildings—Indoor Environmental Quality—Part 1: Indoor Environmental Input Parameters for the Design and Assessment of Energy Performance of Buildings. International Organization for Standardization: Geneva, Switzerland, 2017.
- EN 16798-1:2019; Energy Performance of Buildings—Ventilation for Buildings—Part 1: Indoor Environmental Input Parameters for Design and Assessment of Energy Performance of Buildings. European Committee for Standardization: Brussels, Belgium, 2019.
- EN 16798-2:2019; Energy Performance of Buildings—Ventilation for Buildings—Part 2: Interpretation of the Requirements in EN 16798-1. European Committee for Standardization: Brussels, Belgium, 2019.
- Muhy Al-Din, S.S.; Ahmad Nia, H.; Rahbarianyazd, R. Enhancing Sustainability in Building Design: Hybrid Approaches for Evaluating the Impact of Building Orientation on Thermal Comfort in Semi-Arid Climates. Sustainability 2023, 15, 15180. [Google Scholar] [CrossRef]
- Al-Hemiddi, N.A.; Al-Saud, K.A.M. The effect of a ventilated interior courtyard on the thermal performance of a house in a hot–arid region. Renew. Energy 2001, 24, 581–595. [Google Scholar] [CrossRef]
- Taleb, H.M. Using passive cooling strategies to improve thermal performance and reduce energy consumption of residential buildings in U.A.E. buildings. Front. Archit. Res. 2014, 3, 154–165. [Google Scholar] [CrossRef]
- Mohamed, H.M.; Houssameldin, M.; Sadeq Abdellatif, M.; Sleiti Ahmad, K.; Ahmed Samer, F. Thermal Comfort Assessment of an Indoor Swimming Pool in a Hot Climate: A CFD and HAP Simulation Study. Indoor Air 2025, 2025, 4502431. [Google Scholar] [CrossRef]
- Georgescu, M.; Morefield, P.E.; Bierwagen, B.G.; Weaver, C.P. Urban adaptation can roll back warming of emerging megapolitan regions. Proc. Natl. Acad. Sci. USA 2014, 111, 2909–2914. [Google Scholar] [CrossRef]
- Steffen, W.; Hughes, L.; Perkins, S. Heatwaves: Hotter, Longer, More Often; Climate Council of Australia: Melbourne, Australia, 2014; Available online: https://www.climatecouncil.org.au (accessed on 25 June 2025).
- Kalvelage, K.; Passe, U.; Rabideau, S.; Takle, E.S. Changing climate: The effects on energy demand and human comfort. Energy Build. 2014, 76, 373–380. [Google Scholar] [CrossRef]
- Al-Homoud, M.S. Performance characteristics and practical applications of common building thermal insulation materials. Build. Environ. 2005, 40, 353–366. [Google Scholar] [CrossRef]
- Al-Yozbakee, H.; Al-Hafith, O. Examining thermal comfort in open spaces in higher education settings in hot climate regions—Mosul as a case study. Archit. Sci. Rev. 2025, 1–14. [Google Scholar] [CrossRef]
- Lomas, K.J.; Porritt, S.M. Overheating in buildings: Lessons from research. Build. Res. Inf. 2016, 45, 1–18. [Google Scholar] [CrossRef]
- Tzempelikos, A.; Athienitis, A.K. The impact of shading design and control on building cooling and lighting demand. Sol. Energy 2006, 81, 369–382. [Google Scholar] [CrossRef]
- Meliouh, F. Formes et Performances Environnementales de L’espace “Cour” dans le Logement Contemporain des Régions Arides: Cas la ville de Biskra, Forms and Environmental Performance of the “Courtyard” Space in Contemporary Housing in arid Regions: Case of the City of Biskra. Ph.D. Thesis, Mohamed Khider University of Biskra, Biskra, Algeria, 2023. [Google Scholar]
- Athmani, W. Etude de L’impact des Procédés de Rafraîchissement Passif de Type « Cool Roof » sur la Performance Énergétique des Bâtiments dans les Régions Chaudes et Arides [Study of the Impact of Passive Cooling Processes of the ‘Cool Roof’ Type on the Energy Performance of Buildings in Hot and Arid Regions]. Ph.D. Thesis, Mohamed Khider University of Biskra, Biskra, Algeria, 2023. [Google Scholar]
- Seppanen, O.; Fisk, W.J.; Lei, Q.H. Effect of Temperature on Task Performance in Office Environment; Lawrence Berkeley National Laboratory: Berkeley, CA, USA, 2006. [Google Scholar]
- Kjellstrom, T.; Holmer, I.; Lemke, B. Workplace heat stress, health and productivity—An increasing challenge for low and middle-income countries during climate change. Glob. Health Action 2009, 2, 2047. [Google Scholar] [CrossRef]
- Flouris, A.D.; Dinas, P.C.; Ioannou, L.G.; Nybo, L.; Havenith, G.; Kenny, G.P.; Kjellstrom, T. Workers’ health and productivity under occupational heat strain: A systematic review and meta-analysis. Lancet Planet Health 2018, 2, e521–e531. [Google Scholar] [CrossRef]
- Yao, J. Energy optimization of building design for different housing units in apartment buildings. Appl. Energy 2012, 94, 330–337. [Google Scholar] [CrossRef]
- Cagla, K. View of evaluating the effect of building envelope on thermal performance in cold and warm climate regions of Turkey. Eur. J. Eng. Sci. Technol. 2020, 3, 93–104. Available online: https://dpublication.com/journal/EJEST/article/view/165/138 (accessed on 25 June 2025).
- Theodosiou, T.; Tsikaloudaki, K.; Kontoleon, K.; Giarma, C. Assessing the accuracy of predictive thermal bridge heat flow methodologies. Renew. Sustain. Energy Rev. 2021, 136, 110437. [Google Scholar] [CrossRef]
- Yang, J.; Huang, Y.; Han, J.; Mai, H.; Li, P. Optical–Thermal Performance and Energy Efficiency of Electrochromic Glazing in Hot Summer and Warm Winter Residential Buildings. Sustainability 2025, 17, 1705. [Google Scholar] [CrossRef]
- Bojić, M.; Yik, F. Application of advanced glazing to high-rise residential buildings in Hong Kong. Build. Environ. 2007, 42, 820–828. [Google Scholar] [CrossRef]
- IPCC. Climate Change: The Physical Science Basis. In Contribution of Working Group I to the Sixth Assessment Report of the Intergovernmental Panel on Climate Change; Cambridge University Press: Cambridge, UK, 2021. [Google Scholar]
- Santamouris, M. Using cool pavements as a mitigation strategy to fight urban heat island—A review of the actual developments. Renew. Sustain. Energy Rev. 2013, 26, 224–240. [Google Scholar] [CrossRef]
- Mansouri, K. Optimization of Thermal Comfort and Energy Efficiency in School Buildings: Case of Hot and Arid Climate. Ph.D. Thesis, Mohamed Khider University of Biskra, Biskra, Algeria, 2023. [Google Scholar]
- Wu, S.; Sun, H.; Duan, M.; Mao, H.; Wu, Y.; Zhao, H.; Lin, B. Applications of thermochromic and electrochromic smart windows: Materials to buildings. Cell Rep. Phys. Sci. 2023, 4, 101370. [Google Scholar] [CrossRef]
- Al-Absi, Z.A.; Hafizal, M.I.M.; Ismail, M.; Awang, H.; Al-Shwaiter, A. Properties of PCM-based composites developed for the exterior finishes of building walls. Case Stud. Constr. Mater. 2022, 16, e00960. [Google Scholar] [CrossRef]
- Zheng, X.; Liang, Y.; Yang, H.; Zeng, Y.; Cui, H. Collaborative Optimized Design of Glazing Parameters and PCM Utilization for Energy-Efficient Glass Curtain Wall Buildings. Buildings 2024, 14, 256. [Google Scholar] [CrossRef]
- Pérez-Carramiñana, C.; Sabatell-Canales, S.; González-Avilés, Á.B.; Galiano-Garrigós, A. Use of “Glass Curtain” Systems to Improve the Energy Efficiency and Thermal Comfort of Dwellings in a Warm Semi-Arid Mediterranean Climate. Appl. Sci. 2023, 13, 13082. [Google Scholar] [CrossRef]
- Wang, Y.; Liu, Y.; Li, H.; Wang, J. Finite element method combined with second-order time discrete scheme for nonlinear fractional Cable equation. Eur. Phys. J. Plus 2016, 131, 61. [Google Scholar] [CrossRef]
- Laouni, I. Simulation et Expérimentation D’un prototype D’architecture en Milieux Arides et Semi-Arides [Simulation and Experimentation of an Architectural Prototype in Arid and Semi-Arid Environments]. Ph.D. Thesis, Mohamed Khider University of Biskra, Biskra, Algeria, 2022. [Google Scholar]
- Laouni, I.; Mazouz, S. Towards a sustainable building material in hot arid environments: Compressed and Stabilized Earth Brick (CSEB) prototype. Int. J. Sustain. Dev. Plan. 2021, 16, 1195–1208. [Google Scholar] [CrossRef]
- Femmam, A. Élaboration D’un Outil D’aide à la Conception Pour une Optimisation Climatique et Énergétique des Bâtiments Résidentiels Dans un Climat Désertique: L’exemple du sud Algérien [Development of a Design Assistance Tool for Climatic and Energy Optimization of Residential Buildings in a Desert Climate: The Example of Southern Algeria]. Ph.D. Thesis, Mohamed Khider University of Biskra, Biskra, Algeria, 2024. [Google Scholar]
- Ganesh, G.A.; Sinha, S.L.; Verma, T.N.; Dewangan, S.K. Energy consumption and thermal comfort assessment using CFD in a naturally ventilated indoor environment under different ventilations. Therm. Sci. Eng. Prog. 2024, 50, 102557. [Google Scholar] [CrossRef]
- Lamsal, P.; Bajracharya, S.B.; Rijal, H.B. A Review on Adaptive Thermal Comfort of Office Building for Energy-Saving Building Design. Energies 2023, 16, 1524. [Google Scholar] [CrossRef]
- Givoni, B. Passive and Low Energy Cooling of Buildings; Van Nostrand Reinhold: London, UK, 1994. [Google Scholar]
- Bensafi, M.; Ameur, H.; Kaid, N.; Hoseinzadeh, S.; Memon, S.; Garcia, D.A. Thermophysics Analysis of Office Buildings with a Temperature–Humidity Coupling Strategy Under Hot-Arid Climatic Conditions. Int. J. Thermophys. 2021, 42, 118. [Google Scholar] [CrossRef]
- Akbari, S.; Sholeh, M.; Lotfi, S. Re-composing Physical Form with Energy-Based Resilience Approach to Improve Thermal Comfort (Case Study: Sadra New Town). J. Urban Sustain. Dev. 2024, 5, 1–20. [Google Scholar] [CrossRef]
- Alfano, F.R.D.; Olesen, B.W.; Pepe, D.; Palella, B.I. Working with Different Building Energy Performance Tools: From Input Data to Energy and Indoor Temperature Predictions. Energies 2023, 16, 743. [Google Scholar] [CrossRef]
- Huerto-Cardenas, H.; Leonforte, F.; Aste, N.; Del Pero, C.; Evola, G.; Costanzo, V.; Lucchi, E. Validation of dynamic hygrothermal simulation models for historical buildings: State of the art, research challenges and recommendations. Build. Environ. 2020, 180, 107081. [Google Scholar] [CrossRef]
Disclaimer/Publisher’s Note: The statements, opinions and data contained in all publications are solely those of the individual author(s) and contributor(s) and not of MDPI and/or the editor(s). MDPI and/or the editor(s) disclaim responsibility for any injury to people or property resulting from any ideas, methods, instructions or products referred to in the content. |
© 2025 by the authors. Licensee MDPI, Basel, Switzerland. This article is an open access article distributed under the terms and conditions of the Creative Commons Attribution (CC BY) license (https://creativecommons.org/licenses/by/4.0/).