Abstract
This study establishes a structured framework to identify and evaluate risk factors that may hinder the achievement of sustainable development goals in green buildings and sustainable infrastructure projects. Fifty-six risk factors are identified and categorized into four risk groups, including stakeholder and management, financial and economic, technological and resource, and process and regulatory risks. The risk factors are evaluated across four risk indices related to probability of occurrence, manageability, impact on building performance, and project cost. Further, the severity of risks based on combining the four indices’ effects is quantified using a new Green Risk Index (GRI), while the relationships among all risk indices are determined. The strongest positive correlation is observed between the probability and the impact on cost, whereas a negative relationship is found between the probability and manageability. The analysis demonstrates that a risk factor related to the lack of knowledge about energy-saving procedures and environmental concerns during the design phase is the most critical, as it has the highest severity based on the GRI. “Non-compliance with environmental standards in project design” is also identified as a critical risk factor due to its high effect on building performance. Additionally, the risk factor associated with unstable funds from investors shows the highest effect on manageability. Process and regulatory is identified as the most critical risk group, encompassing the maximum number of key risk factors, and has the highest average weight related to the GRI. These findings reveal crucial vulnerabilities and underline the importance of targeted strategies to strengthen the use of nature-based solution frameworks for mitigating the risk effects in green buildings and sustainable infrastructures.
1. Introduction
The construction sector is considered a major contributor to environmental degradation, responsible for around 70% of total energy consumption and 17% of water use. It also utilizes natural resources, produces nearly 50% of landfill waste, and is responsible for around 35% of carbon dioxide emissions [1,2,3]. Given ongoing challenges such as global warming, water shortages, rapid resource depletion, and pollution, it is essential for construction projects to adopt more environmentally friendly practices, which are commonly referred to as “green building” [4]. Green building is an emerging trend that aims to minimize buildings’ negative effects on the environment throughout their entire lifecycle [5,6]. Green buildings are designed to optimize resource efficiency, safeguard the environment, minimize waste generation, encourage the adoption of sustainable materials, reduce life-cycle costs, and improve the quality of indoor environments [7,8,9]. Therefore, incorporating green building practices may become an essential component of future urban architecture, aiming to minimize environmental impacts while maximizing economic and social advantages [10,11,12]. Green building projects can be certified to be recognized as truly green. Today, numerous green building certification systems exist worldwide, such as BREEAM (Building Research Establishment Environmental Assessment Method) developed in the U.K., LEED (Leadership in Energy and Environmental Design) developed in the U.S., Green Star developed in Australia, and CASBEE (Comprehensive Assessment for Building Environmental Efficiency) developed in Japan. These certification systems vary in assessment structures, criteria categories, criteria weights, and the certification process for buildings [13,14,15]. Beyond certification, however, the adoption of green building practices is increasingly recognized as a critical step toward strengthening the resilience of sustainable infrastructure, and it provides an entry point for aligning construction with broader frameworks such as nature-based solutions (NBSs).
The Project Management Institute (PMI) defines risk as an uncertain event or condition that can have a positive or negative effect on one or more project objectives, including scope, schedule, cost, and quality [16,17]. In the context of construction projects, risk is an unavoidable factor that must be addressed through strategies such as mitigation, allocation, transfer, or acceptance, rather than neglect [18]. A comprehensive understanding of the potential impacts of risk is considered a critical approach for minimizing the probability of project delays [19]. Recently, the increasing complexity of project execution, coupled with advances in techniques and technologies, has led to a greater focus on risk management research [20]. Construction projects are often highly unique and complex, involving many stakeholders, requiring significant capital, operating in unpredictable environments, and affected by environmental conditions [21,22]. Previous studies indicate that the construction industry is particularly vulnerable to risk due to these distinct project characteristics [16]. Overlooking potential risks and uncertainties during the project lifecycle can hamper the achievement of key objectives. Therefore, integrating risk management into overall project management is vital for project success, ensuring that goals related to time, cost, quality, safety, and environmental sustainability are met [23]. Identifying potential sources of risk represents a fundamental stage in the risk management process. This identification helps project stakeholders recognize specific uncertainties, allowing them to analyze the potential impact of these uncertainties. Consequently, they can develop appropriate strategies to mitigate their effects [24].
Various methodologies have been proposed to assess these risks. A study developed a generic life cycle risk management framework specifically for GB projects, which helps analyze significant risks and identify the stakeholders involved in managing those risks [25]. Another study highlighted that stakeholder diversity in green development projects leads to various risks, including miscommunication and conflicts of interest. Contractors are identified as bearing the most risk, necessitating real-time monitoring [26]. A study emphasized the importance of stakeholder identification, analysis, and classification as critial components in managing risks associated with construction projects. It highlighted that a poor perception among stakeholders can significantly hinder project success and cause conflicts [27]. Wuni et al., (2023) [28] identified and categorized ninety-six critical risk factors for green building projects, providing a comprehensive list that serves as a frame of reference for researchers. A study identified and classified financial and economic risks associated with LEED-certified projects, highlighting issues such as the cost of the certification process, scarcity of insurance solutions, and potential loss in rental or resale value [29]. A study in Indonesia highlighted technical risk factors, such as the shortage of skilled professionals in green construction and the limited availability of sustainable building materials, as significant challenges [30]. Issa et al., (2021) [31] identified and categorized sixty-six risk factors related to greening existing buildings into seven risk groups, focusing on aspects such as economic, social, environmental, managerial, sustainability operation, sustainable design, and renovation.
Recent studies in the Gulf region have emphasized the importance of addressing risk factors specific to the local construction market. For instance, Alshamrani et al., (2023) [32] developed a pre-qualification and selection framework for contractors in Saudi Arabia, highlighting the need to incorporate sustainability-related risk criteria in the procurement process. Similarly, Sodangi et al., (2018) [33] assessed the awareness and adoption of building information modeling (BIM) across the subcontracting sector of the Saudi Arabian construction industry, revealing significant gaps in digital readiness that can exacerbate technological and resource risks in green projects. Another study conducted in Jordan identified risks such as changes to the initial design, errors in budgeting, and a lack of adequate funds from clients as critical factors that could impact the success of sustainable construction projects [18]. Zhao et al., (2016) [34] proposed a fuzzy synthetic evaluation approach to assess risks in Singapore’s green construction projects. Their study aimed to address the limitations of conventional risk assessment by introducing fuzzy set theory to better capture subjectivity and uncertainty in expert judgments. Darko, et al., (2017) [35] examined the adoption of green building practices in Singapore, underlining the financial and managerial risks faced in rapidly urbanizing economies. Zhu et al., (2025) [36] proposed a hybrid machine learning methodology applied to green building development, identifying and forecasting critical risks related to economic volatility, material constraints, and policy uncertainty.
Nguyen and Macchion, (2023) [37] reviewed 64 publications on green building risks published between 2006 and 2020, providing a systematic synthesis of prior research and outlining directions for future investigations. Wang et al., (2024) [38] conducted a comprehensive review highlighting key challenges in risk management research for green building projects, including the limited consideration of financial risks specific to such projects, the absence of dedicated risk assessment models, and the lack of studies addressing risk mitigation strategies across different project phases. Extensive research has addressed financial risk assessment in green building projects through diverse quantitative methods. Marzouk, (2020) [39] utilized the fuzzy Monte Carlo simulation to evaluate cost uncertainties associated with material selection in LEED-certified buildings. Research highlights that changes in legislation, delays in administrative approvals, and changes in energy policy pose significant risks to project scope, cost, and timeline [40]. Technological risks were evaluated using post-occupancy assessments and performance gap analyses. Stakeholder risks have been assessed through the social network analysis (SNA) and stakeholder mapping approaches. Yang et al., (2016) [41] developed SNA-based methods to evaluate stakeholder-related risks, while various studies used questionnaire surveys to gather stakeholder perspectives. Overall, these studies emphasize that risk management in GB projects is essential for strengthening sustainable infrastructure resilience and for supporting decision-making to develop effective mitigation strategies and integrate future frameworks such as nature-based solutions.
Managing risks in sustainable construction, particularly in green building projects, is crucial for ensuring the resilience and long-term performance of infrastructure systems. Green buildings are integral components of sustainable infrastructure networks. They contribute to reducing energy demand, enhancing resource efficiency, and mitigating environmental impacts [37,42,43]. However, the complexity of integrating innovative sustainable technologies, high-performance materials, and regulatory requirements exposes these projects to unique risks that may not be apparent in traditional construction practices [44]. In the absence of effective management, these risks may undermine not only the successful delivery of individual projects but also the resilience and reliability of the broader infrastructure systems that depend on sustainable building performance. Although the current study does not directly implement NBS, it provides a structured framework for risk identification and assessment that can serve as a basis for future decision-support tools driven by NBS. By highlighting the probability, manageability, and cost–performance impacts of 56 identified risk factors, this research provides empirical insights to help decision-makers prioritize vulnerabilities, develop effective mitigation strategies, and incorporate risk-aware methods into infrastructure planning.
Despite increasing focus on risk management in green building projects, several ongoing gaps challenge the existing literature. Nguyen and Macchion, (2023) [37] highlight that many previous studies inconsistently identify and categorize green building-specific risk factors, often lacking empirical validation or context-specific adaptation. Additionally, researchers tend to focus narrowly on specific risk areas like financial or technological risks, without considering their interconnectedness within a comprehensive classification system [36]. Current models often depend on simple probability–impact calculations and overlook factors like manageability, building performance, and stakeholder experience, which lowers predictive accuracy [37,38]. Studies on risks associated with commercial green building projects are also geographically biased toward developed economies such as Singapore, the United States, Australia, and China. This results in a scarcity of data and insights from developing countries, where local challenges and contexts remain underexplored [45]. Moreover, few studies incorporate qualitative stakeholder insights like semi-structured interviews and quantitative multi-index assessment, such as probability, manageability, and multi-outcome impact indices, to systematically validate and prioritize risk factors. This study addresses these gaps by identifying 56 empirically validated risk factors, refining them via field surveys and practitioner feedback, classifying them into four main groups, and evaluating each using four indices, while incorporating respondent experience into the assessment formulas to mirror real-world conditions better.
The objectives of the current study are outlined as follows:
- To determine and classify risk factors in green building projects through an extensive literature review and semi-structured interviews;
- To assess and analyze the identified risk factors in terms of probability of occurrence, manageability, impact on building performance, and impact on cost through field surveys;
- To conduct a qualitative analysis of risk groups and highlight the critical risk factors in each group.
In addition to these goals, the findings of this study provide insights that could help improve decision-support tools for enhancing infrastructure resilience. This aligns with broader sustainable development goals and nature-based solutions.
2. Methodology
The research methodology involves several stages, starting with a review of the relevant literature. This stage is followed by semi-structured interviews conducted with experts who have direct experience in delivering and managing LEED-certified buildings across various regions worldwide. These experts were actively involved in the planning, design, and execution phases of GB projects. The interviews are designed to establish an initial checklist of risk factors frequently encountered in green building projects. Following this stage, brainstorming sessions are conducted to assess and finalize the comprehensive list of risk factors. Subsequently, a questionnaire is developed, incorporating respondent information and evaluating each risk factor according to its probability of occurrence, manageability, impact on building performance, and impact on the cost of GB projects. The questionnaire is distributed to a varied group of stakeholders, including specialists and experts involved in implementing green building projects, and including contractors, consultants, owners, and researchers. The collected data from the survey is then systematically analyzed to assess each identified risk factor based on its probability of occurrence, manageability, impact on building performance, and influence on the overall cost of green building projects. Spearman’s correlation test is applied to verify the consistency and reliability of the collected data. A summary of the study methodology is illustrated in Figure 1.
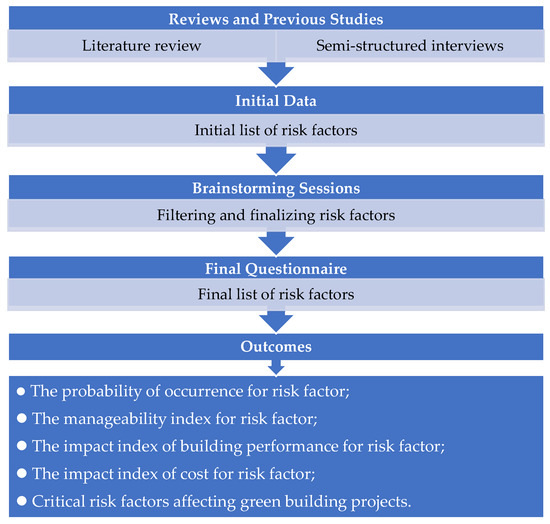
Figure 1.
Flow chart showing the research methodology.
2.1. Risk Factors Affecting Green Buildings
Several risk factors are identified as a result of the literature review analysis concerning risks related to sustainability and green buildings. At this stage, semi-structured interviews are conducted to allow respondents to provide suggestions for changes they might make to enhance the survey and its outcomes. The primary aim of this phase is to confirm the risk factors that affect GB projects by revising the initial list by adding, combining, or deleting some of the risks to reflect the current situation in GB projects. A field survey identified and categorized fifty-six risk factors into four main groups. The classified groupings are shown below: the first group (G01) “Stakeholder and Management Risks” has thirteen factors, such as miscommunication and lack of experience among stakeholders, and low productivity level of labor; the second group (G02) “Financial and Economic Risks” has fifteen factors, including high costs, fluctuation in sustainable materials, and lags in cash flow; the third group (G03) “Technological and Resource Risks” has fourteen factors, involving complexity and rigid requirements in green technologies (GTs), low efficiency of equipment, and waste in green materials; and the fourth group (G04) “Process and Regulatory Risks” has fourteen factors, which include insufficient site investigation, ineffective quality management procedures, delays due to accidents, and frequent design changes. Table 1 presents the identified risk factors in green building projects.

Table 1.
Description of the risk factors affecting green building projects.
2.2. Design of Questionnaire Structure
The main objective of literature reviews and semi-structured interviews is to identify the risk factors that affect GB projects. The interviews are conducted with consultants, contractors, researchers, and project managers with over 20 years of experience in GB projects, including individuals who have worked on BREEAM-certified buildings in various countries. Seventy-five risk factors are initially determined, which are then filtered down to fifty-six risk factors affecting the GB projects. The risk factors unrelated to risk groupings are removed. To facilitate data collection, the questionnaire is provided in two formats: printed hard copies distributed to some participants and an online version is sent to others.
The questionnaire consists of two parts. The first part of the survey form includes participants’ personal information, such as their name and email address, which are not required fields, as well as another required questions, such as their years of experience in the field of GB projects and their position within the project as owner, consultant, or contractor. On the other hand, the main part of the survey is located in Section 2. Participants in this section of the survey are asked to assess each risk factor’s probability of occurrence, manageability, and impact on building performance and cost based on their experience with GB project execution. To standardize participants’ responses in determining the percentage of probability of occurrence, manageability, and the weight of risk impact on building performance and cost, pre-defined percentages are provided according to linguistic variables utilized in similar studies, as illustrated in Table 2 [46].
Table 2.
Linguistic variables and assigned weight.
2.3. Circulation of Questionnaire and Response Rates
To ensure that the questionnaire provides effective valuable results, it is distributed to several groups of engineers depending on their years of experience and positions in GB projects. The participants are grouped into three categories: owner, consultant, and contractor. Participants completed a total of one hundred and two questionnaires out of the one hundred and thirty-seven distributed. The survey includes people working in GB projects in several countries. Table 3 indicates the number of respondents according to their role in the project, in addition to the response rate of the circulated questionnaires.
Table 3.
Rate of response for participants and frequency of participation.
2.4. Experience of Respondents
The respondents’ years of experience can be used to assess the consistency and strength of the gathered data. As shown in Figure 2, about 28% of the respondents in the survey have more than 20 years of experience in green building projects in different countries, which makes the data reliable. A total of 36% of participants have 15–20 years of relevant experience. In addition, 22% of them have 10–15 years of experience, and the remaining 14% have 5–10 years of experience. To guarantee the reliability of survey results, responses from participants with less than five years of work experience are excluded. The average years of experience for all respondents is 16.4 years, indicating that their opinions reliably reflect current conditions in the field. Some experts with more than 20 years of experience informally noted that the scope of GB projects has evolved from a narrow focus on energy and resource efficiency toward broader sustainability performance goals, including resilience, occupant well-being, and integration with nature-based solutions. While these insights were not systematically examined in this study, they provide a valuable direction for future research.
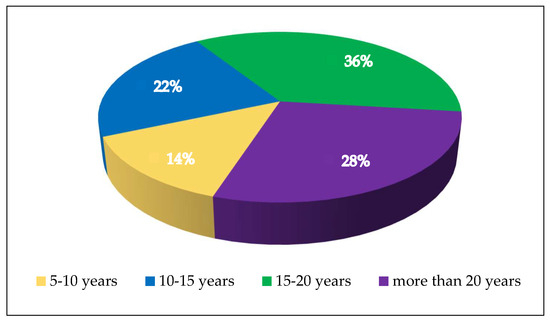
Figure 2.
Respondents’ years of experience.
2.5. Agreement Analysis
It is not logical to separate the results for three applicant groups (owners, consultants, and contractors). Instead, presenting the findings as an average is more accurate. To validate this step, a correlation test is applied to prove agreement among the three groups using Spearman’s correlation coefficient. This statistical test assesses the direction and strength of the relationship between any continuous or ordinal variables. A key advantage of Spearman’s test is that it does not require assumptions of normality or homogeneity of variance. Medians and means can be compared, and if the data contains two or fewer outliers, their effect can be neglected. In this study, the Spearman test was conducted to assess the responses from the three participant groups (owners, consultants, and contractors) and determine the level of agreement in the rankings for the probability of occurrence, manageability, and the impact of risk factors on building performance and the cost of GB projects. The rank correlation coefficient (R) ranges from −1 to +1. An R value of +1 indicates complete agreement, with ranks increasing in the same direction. Conversely, an R value of −1 signifies complete agreement but in the opposite direction, where ranks decrease in reverse order. If R equals 0, it implies no relationship between the variables [47,48].
Figure 3 shows a high agreement among the three groups regarding the impact on building performance and cost. High R values are observed between consultants and contractors for the probability of occurrence and the impact on building performance and cost. The strongest relationship is observed between consultants and contractors with an R value of 0.825 for the impact on cost. These findings underscore the high level of agreement among the three categories in assessing risk factors in GB projects. On the other hand, the weakest relationship is found between owners and contractors (R = 0.624) for manageability. Despite this, the correlation between respondent pairs remained reasonable and sufficient. The positive results reflected strong agreement among the different groups, allowing data from all participants to serve as the foundation for the analysis.
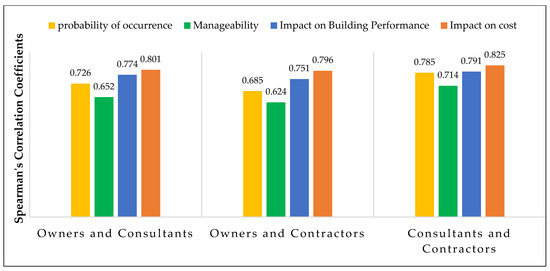
Figure 3.
Spearman’s correlation coefficients.
3. Results and Discussion
The analysis of collected data plays a crucial role in the risk assessment process [49]. Data analysis involves using various methods to interpret the gathered information and derive meaningful insights [50,51]. Conducting a thorough and accurate analysis is essential for obtaining reliable results, enabling proper assessment, and ultimately developing an effective risk management plan. As a result, significant focus and effort were dedicated to this stage of the study.
3.1. Qualitative Analysis for Risk Factors
The analysis of risk factors was conducted using four indices: (1) probability index (PI), (2) manageability index (MI), (3) impact index for building performance (IIBP), and (4) impact index for cost (IIC). These indices were utilized to assess risk factors according to their probability of occurrence, manageability, impact on building performance, and impact on the project cost. The respondents were asked to respond to the questionnaire to assess the values of risk factors in terms of (PI, MI, IIBP, and IIC). The questionnaire responses are then utilized in the study to analyze the respondents’ assessment of risk factors concerning their probability of occurrence, manageability, impact on building performance, and impact on the project cost. To evaluate the weight of the probability of occurrence of each risk factor (Pi, i = 1:56), five levels of probability significance were selected: very low, low, moderate, high, and very high probability [46]. The same procedure was used to ask the respondents to evaluate the weight of manageability of each risk factor (Mi, i = 1:56) and the weight of risk factor impact on building performance (Ibpi, i = 1:56) and cost (Ici, i = 1:56). Table 2 presents the weights assigned to each level of the five linguistic variables, as well as their numerical values [52]. The probability index (PI), manageability index (MI), impact index for building performance (IIBP), and impact index for cost (IIC) were calculated using Equations (1)–(4), respectively, based on the parameters associated with each risk factor (Pi, Mi, Ibpi, and Ici). To enhance and ensure reliable and accurate results, the relevant years of experience were incorporated into the formulas as an experience factor (E.F.), which was determined using Equation (5).
where
Y = Ni (5–10) ∗ EF1 + Ni (10–15) ∗ EF2 + Ni (15–20) ∗ EF3 + Ni (above 20) ∗ EF4
PI represents the probability index for a certain risk factor;
Pi represents the probability weight assigned to option (i);
Ni represents the number of participants who responded to option (i);
EFi represents the experience factor (EF1 = 1 for 5–10 years, EF2 = 1.6 for 10–15 years, EF3 = 2.3 for 15–20 years, and EF4 = 3 for above 20 years);
Y represents the total number of respondents after adding the EF weights;
MI represents the manageability index for a certain risk factor;
Mi represents the manageability weight assigned to option (i);
IIBP represents the impact index for building performance for a certain risk factor;
Ibpi represents the impact weight for building performance assigned to option (i);
IIC represents the impact index for cost on a certain risk factor;
Ici represents the impact weight for cost assigned to option (i).
The results of the previous equations are then utilized to analyze each risk group based on its probability of occurrence, manageability, impact on building performance, and impact on cost, providing a comprehensive understanding of the risk factors influencing the project’s outcomes.
Figure 4 shows a summary of the risk index values for risk factors in group 01 (Stakeholder and Management Risks). In this group, the risk factor with the highest probability and impact on building performance is RF02 “Lack of green building management experience among stakeholders”, with (PI = 0.754) and (IIBP = 0.762), respectively. RF01 “Conflicts of interest among project stakeholders affecting the implementation of green building projects” holds the first rank in terms of manageability (MI = 0.728). The risk factor with the highest impact on cost is RF09 “Poor communication and coordination among contractors and other parties” (IIC = 0.756). It was observed that RF10 “Differences in cultures and nationalities of workers cause communication problems” occupies the last rank in terms of probability, impact on building performance, and impact on cost, with (PI = 0.545), (IBP = 0.514), and (IIC = 0.578), while the risk factor with the least manageability in this group is RF12 “Low productivity level of labor” (MI = 0.559). Impact index for cost has the highest cumulative and average index in this group, while the manageability index has the lowest cumulative and average index. These findings highlight that stakeholder-related risks are not only operational challenges but also crucial factors in decision-making. Closing gaps in management experience and communication can reduce project uncertainties and strengthen the adaptive capacity of infrastructure systems. Such improvements create a foundation for implementing risk-informed decision-support frameworks that align with infrastructure resilience goals and support the future integration of nature-based solutions into sustainable development agendas.
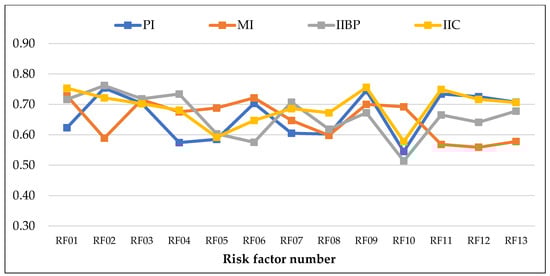
Figure 4.
Risk index values for risk factors in Group 01.
Figure 5 presents a summary of the risk index values for risk factors in group 02 (Financial and Economic Risks). In this group, the risk factor with the highest probability and impact on cost is RF14 “High costs of sustainable materials and equipment”, with (PI = 0.816) and (IIC = 0.854). RF21 “Poor budget allocation for maintenance and operations post-construction” occupies the first rank in terms of manageability (MI = 0.588). The risk factor with the highest impact on building performance is RF23 “Insufficient funds allocated for training staff on green building technologies” (IIBP = 0.755). It was observed that RF18 “Lack of facilities from the government in the development of green building technology” occupies the last rank in terms of probability and impact on cost, with (PI = 0.654) and (IIC = 0.736). The risk factor with the least manageability is RF17 “Unstable funds from investors” (MI = 0.485). RF26 “Increased insurance premiums for green building projects” has the lowest impact on building performance (IIBP = 0.605). These findings highlight that financial and economic risks, especially those related to high material costs, unstable funding, and limited support mechanisms, are more than just budget issues; they are critical factors influencing decision-making. Addressing these vulnerabilities can enhance infrastructure resilience by incorporating financial risk considerations into decision-support systems and facilitate future adoption of nature-based solutions as cost-effective and sustainable strategies within development plans.
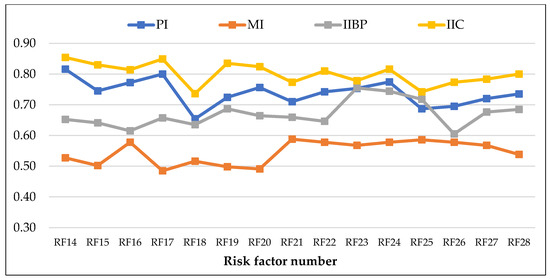
Figure 5.
Risk index values for risk factors in Group 02.
Figure 6 shows a summary of the risk index values for risk factors in group 03 (Technological and Resource Risks). In group 03, the risk factor with the highest probability and impact on cost is RF36 “Green Material wastes due to poor design or execution”, with (PI = 0.835) and (IIC = 0.806). RF37 “Misuse of modern equipment by workers” holds the first rank in terms of manageability (MI = 0.635). The risk factor with the highest impact on building performance is RF33 “Poor communication and coordination among contractors and other parties” (IIBP = 0.764). The risk factor with the least probability in this group is RF37 (PI = 0.593). RF32 “Risks and uncertainties involved in implementing new technologies” holds the last rank in terms of manageability (MI = 0.519). The risk factor with the least impact on building performance and impact on cost is RF29 “Lack of reliable and available GBTs research and education”, with (IIBP = 0.553) and (IIC = 0.655). Impact index for cost has the highest cumulative and average index in this group, while the manageability index has the lowest cumulative and average index. The analysis of technological and resource risks shows that deficiencies in training, inconsistent performance of new green materials, and delays in material supply create structural vulnerabilities that directly impact project results. These challenges stem from the technological foundation of green building delivery, making them crucial in shaping the long-term resilience of infrastructure. It is essential to improve decision-making processes related to technology adoption and supply chain reliability, as it ensures that systemic inefficiencies or resource instabilities do not compromise sustainability objectives.
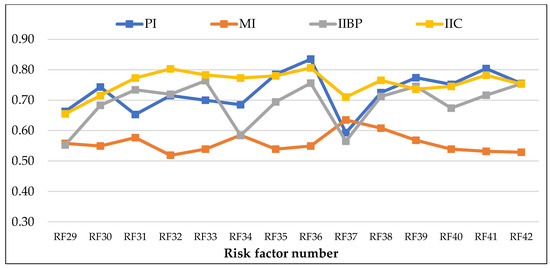
Figure 6.
Risk index values for risk factors in Group 03.
Figure 7 presents a summary of the risk index values for risk factors in group 04 (Process and Regulatory Risks). In this group, RF50 “Inadequate information in drawings and project documents” holds the first rank in terms of probability and manageability (PI = 0.804), (MI = 0.579). The risk factor with the highest impact on building performance is RF43 “Lack of knowledge about energy-saving procedures and environmental concerns during the design phase” (IIBP = 0.817). RF56 “Frequent design changes requested by regulatory bodies” has the highest impact on cost (IIC = 0.819). The risk factor with the least probability in this group is RF53 “Delays due to accidents during material transportation” (PI = 0.673). RF45 “Non-compliance with environmental standards in project design” holds the last rank in terms of manageability (MI = 0.519) and impact on cost (IIC = 0.698). The risk factor with the least impact on building performance is RF48 “Lack of clear and adequate project documentation” (IIBP = 0.547). Process- and regulation-related risks—like inadequate documentation, limited knowledge, and frequent regulatory changes—undermine decision-making in green building projects and, if unaddressed, can disrupt infrastructure resilience by decreasing reliability and causing delays in sustainable improvements. Closing these gaps helps create risk-aware regulatory frameworks that enhance infrastructure resilience and establish an institutional basis for incorporating nature-based solutions into long-term sustainability strategies.
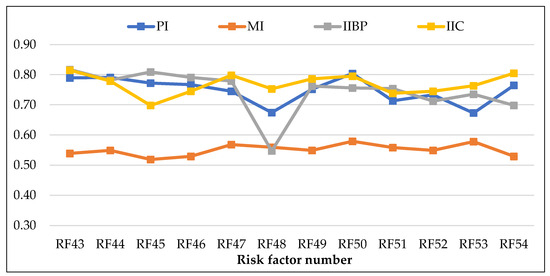
Figure 7.
Risk index values for risk factors in Group 04.
Across all groups, the manageability index consistently scored lower than the other indices. This trend can be attributed to the inherent nature of risk factors identified in GB projects. Many risks are externally driven, such as high costs of sustainable materials, exchange rate fluctuations, unstable funding, or delays due to slow regulatory approvals, which are largely outside the control of project stakeholders. Similarly, technological and resource-related risks, like unstable performance of new materials, unreliable suppliers, or lack of training on advanced technologies, are challenging to manage because they depend on market maturity, supplier reliability, and workforce expertise, which cannot be quickly improved within a project’s timeframe. Even stakeholder and process-related risks, including miscommunication, late involvement of GB consultants, or lack of knowledge about energy-saving procedures, tend to persist despite recognition, as they require long-term organizational changes and capacity building rather than short-term managerial actions. Conversely, the probability and impacts on cost and building performance are more easily perceived and rated by practitioners, since these effects are visible and measurable during project execution.
3.2. Correlation Among Risk Indices
This study uses Spearman’s correlation test to evaluate the relationships among all risk indices and to determine the strength and direction of these relationships [53]. The relationship between all indices can be measured by computing the correlation coefficient for each pair, including PI, MI, and IIPB IIC. Figure 8 shows the correlation coefficient values for the risk indices. The strongest correlation is observed between the probability index and the impact index for cost. In contrast, the weakest correlation is found between the impact index for building performance and the impact index for cost. There is an adverse relationship between the manageability index and other indices, with the highest negative relationship observed with the probability index, followed by the impact index for cost.
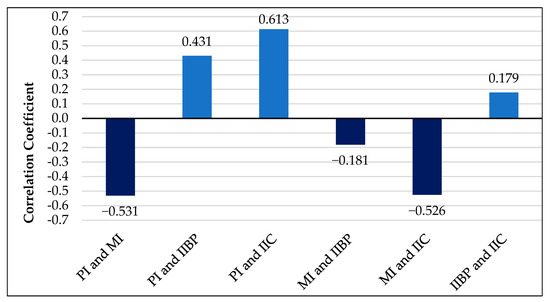
Figure 8.
The correlation coefficient values for the risk indices.
Risks that have a high probability and are costly to address should be evaluated to determine the combined impact of the risk probability and their impact on the cost. Risk Index for Cost (RIC) represents the combined impact of probability and cost. Risks that have high impacts on building performance but are also difficult to manage can significantly reduce project success. Combining these two will be represented by Risk Index for Building Performance (RIBP). Finally, risks that occur frequently but are easy to manage might not need immediate action. However, risks that occur frequently and are difficult to manage are critical, need attention, and will be presented by the Risk Index for Manageability (RIM). RIC, RIBP, and RIM can be calculated through Equations (6)–(8), respectively. Table 4 shows the risk indices values and ranks them according to RIC, RIBP, and RIM.
where RIC represents the Risk Index for Cost;
where RIBP represents Risk Index for Building Performance;
where RIM represents the Risk Index for Manageability.
where GRI represents Green Risk Index.
RIC = PI ∗ IIC
RIBP = IIBP/MI
RIM = PI/MI
GRI = (PI ∗ IIBP ∗ IIC)/MI
Table 4.
Risk factor indices according to RIC, RIBP, and RIM.
3.3. Boxplot Analysis Based on RIC
Figure 9 summarizes the boxplot results for the Risk Index for Cost (RIC), making risk index comparisons clearer and more straightforward. It has been observed that group 01 has the widest range when outliers are neglected, as well as the lowest values and the lowest lower limit value, which is RF10 “Differences in cultures and nationalities of workers cause communication problems”. On the other hand, Group 04 has the shortest range (0.508 to 643). Group 02 has high values, and the highest upper limit value which is RF14 “High costs of sustainable materials and equipment”. Group 02 and Group 03 have values close to the upper limit. It has been noted that RF29 “Lack of reliable and available GBTs research and education” and RF37 “Misuse of modern equipment by workers” are outlier factors in Group 03.
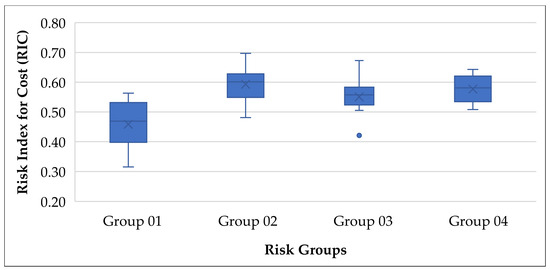
Figure 9.
Boxplot analysis comparing risk groups based on RIC.
3.4. Boxplot Analysis Based on RIBP
Figure 10 shows a boxplot analysis that compares risk groups based on the Risk Index for Building Performance (RIBP). It has been observed that Group 04 has high values and one outlier, which is RF48 “Lack of clear and adequate project documentation”. It can be observed that Group 01 has the widest range when outliers are neglected, and the lowest values and the lowest lower limit value, which is RF10. Group 04 (Process and Regulatory Risks) stands out as the most significant compared to the other groups, as is evident from the elevated values of the building performance index presented in the figure. Within this group, the highest risk factors, in descending order, are RF45, RF43, RF46, and RF44.
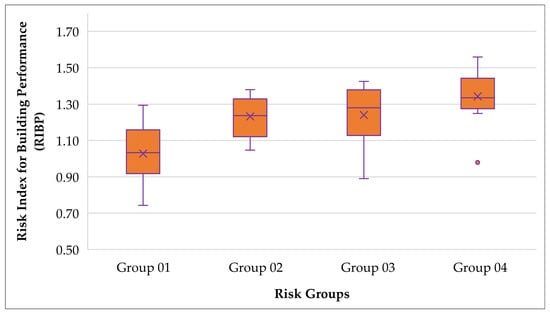
Figure 10.
Boxplot analysis comparing waste groups based on RIBP.
3.5. Boxplot Analysis Based on RIM
Figure 11 presents a summary of the boxplot results for the four risk groups according to the Risk Index for Manageability (RIM). It has been noted that there is no outlier in any group for the control index. Group 03 has the widest range, while Group 04 has the narrowest range. It can be observed that Group 01 has the lower values and the lowest minimum value. On the other side, Group 02 has higher values and the highest maximum value which is RF17 “Unstable funds from investors”.
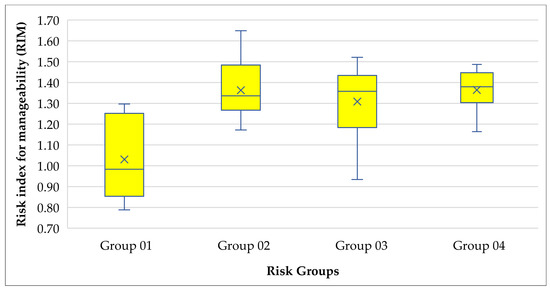
Figure 11.
Boxplot analysis comparing risk groups based on RIM.
3.6. Analysis Based on Green Risk Index
To provide a more comprehensive assessment of each risk factor and its significance in GB projects, the significance of risk must be determined to assess the combined weight of the probability, cost, building performance, and magnanimity. The significance of waste will be represented by the Green Risk Index (GRI) and the following equation (Equation (9)) is used to calculate GRI. The results of the previous equation are arranged in descending order of values to provide an extensive comprehension of the risk factors according to GRI. Figure 12 shows Green Risk Indices, and the results are as follows:
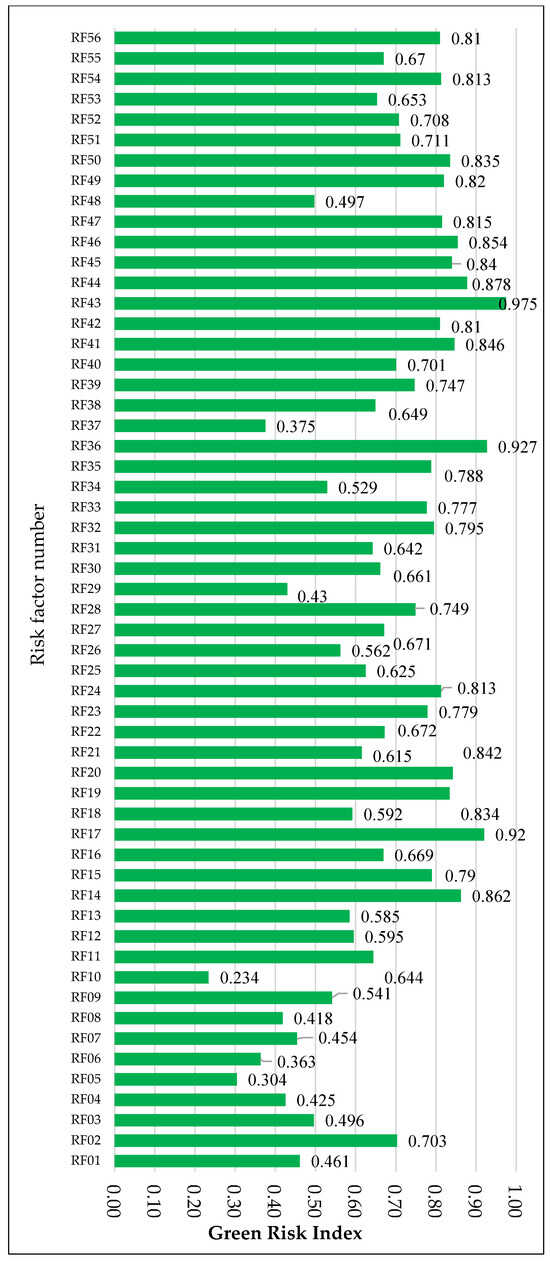
Figure 12.
Green Risk Indices for risk factors.
The risk factor with the highest Green Risk Index is RF43 “Lack of knowledge about energy-saving procedures and environmental concerns during the design phase” (GRI = 0.975), which falls under Group 04. RF36 “Green material wastes due to poor design or execution” ranks second (GRI = 0.927), followed by (RF17) (GRI = 0.920), (RF44) (GRI = 0.878), and (RF14) (GRI = 0.862), respectively. RF10 “Differences in cultures and nationalities of workers cause communication problems” which belongs to Group 01 has the lowest Green Risk Index (GRI = 0.234). Figure 13 presents the average weight of each group based on the Green Risk Index. Group 04 ranks highest (GRI = 0.777), followed by Group 02 (GRI = 0.733). In contrast, Group 01 records the lowest average improvement level (GRI = 0.479). Integrating multiple risk dimensions into the GRI framework enhances prioritization and supports broader sustainability goals. It provides a unified basis for embedding risk-based decision-making into GB projects, ensuring that cost, technical reliability, and regulatory compliance are collectively considered. Ultimately, the GRI bridges project-level risk management and infrastructure resilience, promoting the expansion of nature-based solutions and other green innovations. Combining probability, cost, performance, and manageability aspects into a single index provides stakeholders with a clear tool for identifying high-impact risks and aligning mitigation strategies with long-term infrastructure objectives. This comprehensive approach improves the adaptability of green projects and helps embed NBS into policy and investment strategies, making sustainability transitions both technically achievable and economically sustainable.
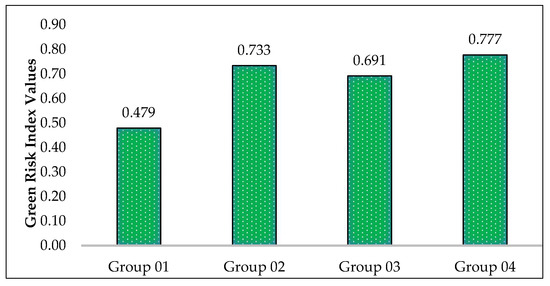
Figure 13.
The average weight of each group based on the Green Risk index.
Although RF10, which refers to differences in cultures and nationalities of workers, consistently recorded the lowest values across RIC, RIBP, and GRI, this finding should be interpreted with caution. The relatively low ranking may reflect the perception of practitioners, giving the impression that such challenges are common and often normalized in construction projects, especially in regions with highly diverse labor markets. However, workforce diversity has a broad impact on the application of all project procedures, including communication, safety compliance, knowledge transfer, and the enforcement of environmental standards. This suggests that, although statistically ranked as less critical in this study, diversity-related risks may still indirectly and significantly influence project outcomes and therefore warrant further research.
The survey included respondents from both developed and developing countries, but the prominence of RF43 “Lack of knowledge about energy-saving procedures and environmental concerns during the design phase” particularly reflects the context of developing countries, especially in the Middle East. Experts from these regions highlighted that, even among professionals with more than 20 years of experience, systematic exposure to updated green building standards and energy-saving design practices remains limited due to gaps in training programs, regulatory enforcement, and institutional capacity. By contrast, respondents from developed economies reported higher familiarity with such procedures. Therefore, the high ranking of RF43 in our results should be interpreted as evidence of regional disparities in knowledge and practice, underscoring the urgent need for targeted professional development in developing countries.
3.7. Key Risk Factors Affecting Green Building Projects
All the risk factors identified in this study have the potential to occur and impact green building projects. To assess the most significant risks, it is crucial to determine and highlight those with the highest expected values. The top ten risk factors based on risk indices (RIC, RIBP, and RIM) are presented in Table 5. Out of fifty-six risk factors, only twenty contributed to the top ten risk factors in the overall indices. Seven factors belong to Group 02, six factors are from Group 03, seven factors belong to Group 04, while group 01 has no significant risk factors. It must be highlighted that RF43 is the most significant risk factor, ranking fourth in the cost index, second in the building performance index, and eighth in the manageability index. In addition, Rf 36 is recognized as a critical factor, holds the third rank in terms of cost index, tenth rank in terms of building performance index, and is fourth in terms of manageability index. It has been noted that RF14, RF17, and RF20 are repeated in both cost and manageability indices. This study enhances understanding of green building risks by shifting from fragmented assessments to a comprehensive framework that captures their systemic and cascading impacts. Incorporating multiple indices into the Green Risk Index transforms risk evaluation into a strategic tool that improves foresight, prioritization, and adaptability. This approach redefines risk management as a vital element for resilient infrastructure development, with project insights guiding broader decision-making. Ultimately, the proposed framework not only reinforces the operational basis for green building implementation but also advocates for risk-informed strategies to promote nature-based solutions and hasten the move toward sustainable urban development.
Table 5.
Top ten risk factors affecting green building projects.
4. Future Research Directions
Future research should investigate the influence of practitioners’ characteristics (such as professional role, industry experience, green building knowledge, risk-related expertise, and risk attitudes), project-specific features (like building type, delivery or contract method, and complexity level), and contextual factors (including country, region, and cultural setting) on the risk assessment process in green building projects. Such investigations would expand the current knowledge and provide more nuanced insights for both academics and practitioners.
Conducting comparative analyses of green building risk factors between developed and developing countries are recommended, as these contexts often exhibit significant differences in regulatory frameworks, financial means, and technological capabilities. These studies would improve understanding of global disparities and provide valuable guidance for international practitioners and organizations working in diverse environments.
Extending research to include multi-region or cross-country analyses would enhance the generalizability of results and help identify variations in green building risk profiles based on context. This wider view would make risk management strategies more applicable across different geographic and socio-economic conditions.
Future research should also compare risks across various green building rating systems (such as LEED, BREEAM, WELL, Green Star) to identify universal risk factors versus system-specific ones. Such comparisons would support the development of more customized and regionally sensitive risk management approaches.
Empirical validation of the proposed Green Risk Index using longitudinal data from real-world projects is essential to evaluate its predictive accuracy and refine the identified risk factors. Incorporating project-level evidence would enhance both the robustness and the practical utility of the model.
5. Conclusions
The main objective of this study is to identify and evaluate the risks that affect green building projects. Fifty-six risk factors are identified under four main groups, including Stakeholder and Management Risks, Financial and Economic Risks, Technological and Resource Risks, and Process and Regulatory Risks. A Spearman test is utilized to assess the relationships among the various risk indices. A field survey introduced four parameters representing the risk factor features: probability of risk occurrence, manageability, impact on building performance, and impact on the cost of GB projects. Additionally, a new Green Risk Index has been developed to quantify the relationships among the four parameters. A comprehensive qualitative assessment of the gathered data can be used to develop a risk management framework for sustainable building projects. The study results can be summarized as follows:
- RF43 “Lack of knowledge about energy-saving procedures and environmental concerns during the design phase”, which belongs to group 04, is considered the most significant risk factor due to it having the highest Green Risk Index and its high risk index values. Additionally, Rf 36 is regarded as a critical risk factor as it occupies the third rank in terms of Risk Index for Cost, and is fourth in terms of Risk Index for Manageability.
- Group 02 (Financial and Economic Risks) and Group 04 (Process and Regulatory Risks) have the maximum number of key risk factors (seven key factors), as well as the highest average weight in terms of Green Risk Index, which signifies that they are considered the most significant group. Group 01 has no factors in the top ten risk factors.
- RF45 “Non-compliance with environmental standards in project design” is considered a critical risk factor, as it has a high impact on building performance but is also difficult to manage. RF14 “High costs of sustainable materials and equipment” has the highest impact on cost and a high probability index. Also, it has been observed that RF17 “Unstable funds from investors” has a high probability, but its manageability is minor.
- High correlations between consultants and contractors across the risk indices are observed. The highest correlation is found between the probability and the impact index for cost. There is an adverse relationship between the manageability index and the probability index, followed by the impact index for cost. This research helps project managers, designers, and decision-makers fulfill the accreditation standards of different green building rating systems, enhance sustainable infrastructure resilience, and provide a baseline for embedding risk-aware approaches within broader frameworks, such as NBS.
Author Contributions
A.G.A.: Writing—review and editing, Writing—original draft, Visualization, Validation, Supervision, Software, Resources, Methodology, Investigation, Formal analysis, Data curation, Conceptualization, Project administration, Funding acquisition. M.R.K.: Writing—review & editing, Investigation, Project administration, Funding acquisition. M.E.: Writing—review & editing, Project administration, Funding acquisition. U.H.I.: Writing—review and editing, Writing—original draft, Visualization, Validation, Supervision, Software, Resources, Methodology, Investigation, Formal analysis, Data curation, Conceptualization, Project administration, Funding acquisition. All authors have read and agreed to the published version of the manuscript.
Funding
This research is funded by the NATURE-DEMO project (Nature-Based Solutions for Demonstrating Climate-Resilient Critical Infrastructure, a Horizon Europe Project Number 101157448) (www.nature-demo.eu). NATURE-DEMO project seeks to protect critical infrastructure by developing decision-making methodologies and models that incorporate risk assessment, climate indicators, and nature-based solutions. The authors would like to acknowledge the Deanship of Graduate Studies and Scientific Research, Taif University for funding this work.
Institutional Review Board Statement
Ethical review and approval were waived for this study due to the study does not involve any personal or sensitive human data.
Informed Consent Statement
Informed consent was obtained from all subjects involved in the study.
Data Availability Statement
The data presented in this study are available on request from the corresponding author.
Acknowledgments
Funding for this research has been provided by the European Union’s Horizon Europe Programme in the framework of the NATURE-DEMO project (https://www.nature-demo.eu/) under Grant Agreement no. 101157448. The authors would like to acknowledge the Deanship of Graduate Studies and Scientific Research, Taif University for funding this work.
Conflicts of Interest
Mohamed Eldessouki was employed by the company Digital Innovation Centre (DIC—DigInnoCent s.r.o, Czech Republic and Digital InnoCent Ltd., UK). The remaining authors declare that the research was conducted in the absence of any commercial or financial relationships that could be construed as a potential conflict of interest. The funders were not involved in the study design, collection, analysis, interpretation of data, the writing of this article, or the decision to submit it for publication.
List of Abbreviations
| GB | green building |
| NBS | nature-based solutions |
| PI | the probability index for a certain risk factor |
| MI | the manageability index for a certain risk factor |
| IIBP | the impact index for building performance for a certain risk factor |
| IIC | the impact index for cost on a certain risk factor |
| RIC | the Risk Index for Cost |
| RIBP | the Risk Index for Building Performance |
| RIM | the Risk Index for Manageability |
| GRI | the Green Risk Index |
References
- Castro-Lacouture, D.; Sefair, J.A.; Flórez, L.; Medaglia, A.L. Optimization model for the selection of materials using a LEED-based green building rating system in Colombia. Build. Environ. 2009, 44, 1162–1170. [Google Scholar] [CrossRef]
- Sandanayake, M.S. Environmental Impacts of Construction in Building Industry—A Review of Knowledge Advances, Gaps and Future Directions. Knowledge 2022, 2, 139–156. [Google Scholar] [CrossRef]
- Kabir, N.; Ali, R.; Islam, A.; Mathin, T.T.; Sarker, M.; Ahmed, M.; Sayeed, M.A. Necessity of green construction for building sustainable environment. World J. Adv. Eng. Technol. Sci. 2024, 13, 372–382. [Google Scholar] [CrossRef]
- Polat, G.; Turkoglu, H.; Gurgun, A.P. Identification of Material-related Risks in Green Buildings. Procedia Eng. 2017, 196, 956–963. [Google Scholar] [CrossRef]
- Wang, C.; Che, Y.; Xia, M.; Lin, C.; Chen, Y.; Li, X.; Chen, H.; Luo, J.; Fan, G. The Evolution and Future Directions of Green Buildings Research: A Scientometric Analysis. Buildings 2024, 14, 345. [Google Scholar] [CrossRef]
- Issa, U.H.; AbdelHaffez, A.G.; Abdel-Hafez, A.A.; Assaf, K.A. Identifying and evaluating causes of waste effect in green building projects. J. Eng. Appl. Sci. 2025, 72, 9. [Google Scholar] [CrossRef]
- Li, F.; Yan, T.; Liu, J.; Lai, Y.; Uthes, S.; Lu, Y.; Long, Y. Research on social and humanistic needs in planning and construction of green buildings. Sustain. Cities Soc. 2014, 12, 102–109. [Google Scholar] [CrossRef]
- Alwisy, A.; BuHamdan, S.; Gül, M. Evidence-based ranking of green building design factors according to leading energy modelling tools. Sustain. Cities Soc. 2019, 47, 101491. [Google Scholar] [CrossRef]
- Liu, T.; Chen, L.; Yang, M.; Sandanayake, M.; Miao, P.; Shi, Y.; Yap, P.-S. Sustainability Considerations of Green Buildings: A Detailed Overview on Current Advancements and Future Considerations. Sustainability 2022, 14, 14393. [Google Scholar] [CrossRef]
- Addy, M.; Adinyira, E.; Danku, J.C.; Dadzoe, F. Impediments to the development of the green building market in sub-Saharan Africa: The case of Ghana. Smart Sustain. Built Environ. 2021, 10, 193–207. [Google Scholar] [CrossRef]
- Balaban, O.; Puppim de Oliveira, J.A. Sustainable buildings for healthier cities: Assessing the co-benefits of green buildings in Japan. J. Clean. Prod. 2017, 163, S68–S78. [Google Scholar] [CrossRef]
- Komurlu, R.; Kalkan Ceceloglu, D.; Arditi, D. Exploring the Barriers to Managing Green Building Construction Projects and Proposed Solutions. Sustainability 2024, 16, 5374. [Google Scholar] [CrossRef]
- Rebelatto, B.G.; Salvia, A.L.; Brandli, L.L.; Leal Filho, W. Examining Energy Efficiency Practices in Office Buildings through the Lens of LEED, BREEAM, and DGNB Certifications. Sustainability 2024, 16, 4345. [Google Scholar] [CrossRef]
- Chantry, W.; Turcu, C. Sustainability power to the people: BREEAM Communities certification and public participation in England. Discov. Sustain. 2024, 5, 371. [Google Scholar] [CrossRef]
- Alves Tenório de Morais, G.; R. S. de M. S. Nascimento, C.; dos Santos, E.B.; M. N. de Souza, K.; Fernandes, B.S.; Palha, R.P. Integration potential between REVIT and LEED: A review. Archit. Eng. Des. Manag. 2024, 20, 510–525. [Google Scholar] [CrossRef]
- El-Sayegh, S.M.; Mansour, M.H. Risk Assessment and Allocation in Highway Construction Projects in the UAE. J. Manag. Eng. 2015, 31, 04015004. [Google Scholar] [CrossRef]
- Cerezo-Narváez, A.; Pastor-Fernández, A.; Otero-Mateo, M.; Ballesteros-Pérez, P. The Influence of Knowledge on Managing Risk for the Success in Complex Construction Projects: The IPMA Approach. Sustainability 2022, 14, 9711. [Google Scholar] [CrossRef]
- Alawneh, R.; Jannoud, I.; Rabayah, H.; Asaad, S.; Almasaeid, H.; Imam, R.; Ghazali, F.E.M. Development of a New Method for Assessing Project Risks in Sustainable Building Construction Projects in Developing Countries: The Case of Jordan. Buildings 2024, 14, 1573. [Google Scholar] [CrossRef]
- Ariska, T.Y.; Mubarak, M.; Husin, S.; Maulina, F.; Mahmuddin, M. Analysis of the risk impact of internal factors on time in building construction projects in Aceh Province. AIP Conf. Proc. 2024, 3082, 030017. [Google Scholar] [CrossRef]
- Monzer, N.; Fayek, A.R.; Lourenzutti, R.; Siraj, N.B. Aggregation-Based Framework for Construction Risk Assessment with Heterogeneous Groups of Experts. J. Constr. Eng. Manag. 2019, 145, 04019003. [Google Scholar] [CrossRef]
- Siraj, N.B.; Fayek, A.R. Risk Identification and Common Risks in Construction: Literature Review and Content Analysis. J. Constr. Eng. Manag. 2019, 145, 03119004. [Google Scholar] [CrossRef]
- Taroun, A. Towards a better modelling and assessment of construction risk: Insights from a literature review. Int. J. Proj. Manag. 2014, 32, 101–115. [Google Scholar] [CrossRef]
- Zou, P.X.W.; Zhang, G.; Wang, J. Understanding the key risks in construction projects in China. Int. J. Proj. Manag. 2007, 25, 601–614. [Google Scholar] [CrossRef]
- Zayed, T.; Amer, M.; Pan, J. Assessing risk and uncertainty inherent in Chinese highway projects using AHP. Int. J. Proj. Manag. 2008, 26, 408–419. [Google Scholar] [CrossRef]
- Koc, K.; Kunkcu, H.; Gurgun, A.P. A Life Cycle Risk Management Framework for Green Building Project Stakeholders. J. Manag. Eng. 2023, 39, 04023022. [Google Scholar] [CrossRef]
- Ma, L.; Wang, L.; Wu, K.-J.; Tseng, M.-L.; Chiu, A.S.F. Exploring the Decisive Risks of Green Development Projects by Adopting Social Network Analysis under Stakeholder Theory. Sustainability 2018, 10, 2104. [Google Scholar] [CrossRef]
- Tawfik Mohamed, N.; Fathi Eid, A.; Mohamed Khodeir, L. Assessing The Impact of Stakeholders’ Interaction on The Efficiency of Managing Risk in Construction Projects A Literature Review. Eng. Res. J. 2022, 173, 299–315. [Google Scholar] [CrossRef]
- Wuni, I.Y.; Bao, Z.; Yevu, S.K.; Tetteh, M.O. Theorizing the path dependencies and hierarchical structure of the multidimensional risks in green building projects. J. Build. Eng. 2023, 68, 106069. [Google Scholar] [CrossRef]
- Gurgun, A.P.; Polat, G.; Bayhan, H.G.; Damci, A. Financial and Economical Risks Impacting Cost of Leed Certified Projects. Proc. Int. Struct. Eng. Constr. 2017, 4. [Google Scholar] [CrossRef]
- Afiq, M.; Nurdiana, A. Analisis Manajemen Risiko pada Pelaksanaan Pembangunan Bangunan Hijau di Kota Semarang. J. Syntax. Admiration 2024, 5, 2322–2329. [Google Scholar] [CrossRef]
- Issa, U.; Sharaky, I.; Alwetaishi, M.; Balabel, A.; Shamseldin, A.; Abdelhafiz, A.; Al-Surf, M.; Al-Harthi, M.; Osman, M.M.A. Developing and applying a model for evaluating risks affecting greening existing buildings. Sustainability 2021, 13, 6403. [Google Scholar] [CrossRef]
- Alshamrani, O.S.D.; Saleem, M.; AlYousif, I.K.; Alluqmani, A. Development of a pre-qualification and selection framework for construction projects’ contractors in Saudi Arabia. J. Asian Archit. Build. Eng. 2023, 22, 1545–1563. [Google Scholar] [CrossRef]
- Sodangi, M.; Salman, A.F.; Saleem, M. Building Information Modeling: Awareness Across the Subcontracting Sector of Saudi Arabian Construction Industry. Arab. J. Sci. Eng. 2018, 43, 1807–1816. [Google Scholar] [CrossRef]
- Zhao, X.; Hwang, B.-G.; Gao, Y. A fuzzy synthetic evaluation approach for risk assessment: A case of Singapore’s green projects. J. Clean. Prod. 2016, 115, 203–213. [Google Scholar] [CrossRef]
- Darko, A.; Chan, A.P.C.; Owusu-Manu, D.-G.; Ameyaw, E.E. Drivers for implementing green building technologies: An international survey of experts. J. Clean. Prod. 2017, 145, 386–394. [Google Scholar] [CrossRef]
- Zhu, Y.; Chen, H.; Ma, J.; Pan, F. Risk Management of Green Building Development: An Application of a Hybrid Machine Learning Approach Towards Sustainability. Sustainability 2025, 17, 6373. [Google Scholar] [CrossRef]
- Nguyen, H.D.; Macchion, L. Risk management in green building: A review of the current state of research and future directions. Environ. Dev. Sustain. 2023, 25, 2136–2172. [Google Scholar] [CrossRef]
- Wang, L.; Chan, D.W.M.; Darko, A.; Oluleye, B.I. A-state-of-the-art review of risk management process of green building projects. J. Build. Eng. 2024, 86, 108738. [Google Scholar] [CrossRef]
- Marzouk, M. Fuzzy Monte Carlo Simulation Optimization Selecting Materials in Green Bulidings. J. Environ. Eng. Landsc. Manag. 2020, 28, 95–104. [Google Scholar] [CrossRef]
- Serrano-Gomez, L.; Munoz-Hernandez, J.I. Monte Carlo approach to fuzzy AHP risk analysis in renewable energy construction projects. PLoS ONE 2019, 14, e0215943. [Google Scholar] [CrossRef] [PubMed]
- Yang, R.J.; Zou, P.X.W.; Wang, J. Modelling stakeholder-associated risk networks in green building projects. Int. J. Proj. Manag. 2016, 34, 66–81. [Google Scholar] [CrossRef]
- Zhang, X.; Shen, L.; Wu, Y. Green strategy for gaining competitive advantage in housing development: A China study. J. Clean. Prod. 2011, 19, 157–167. [Google Scholar] [CrossRef]
- Herath, N.; Vaz-Serra, P.; Hui, F.K.P.; Mendis, P.; Aye, L. Risk Mitigation Measures in Green Building Projects: An Investigation. In ICSBE 2022; Springer: Singapore, 2023; pp. 277–289. [Google Scholar] [CrossRef]
- Darko, A.; Zhang, C.; Chan, A.P.C. Drivers for green building: A review of empirical studies. Habitat. Int. 2017, 60, 34–49. [Google Scholar] [CrossRef]
- Simpeh, E.K.; Smallwood, J.J.; Ahadzie, D.K.; Mensah, H. Analytical taxonomy of challenges to the implementation of green building projects in South Africa. Int. J. Constr. Manag. 2023, 23, 286–296. [Google Scholar] [CrossRef]
- Issa, U.H.; Marouf, K.G.; Faheem, H. Analysis of risk factors affecting the main execution activities of roadways construction projects. J. King Saud. Univ. —Eng. Sci. 2023, 35, 372–383. [Google Scholar] [CrossRef]
- Issa, U.H.; Mosaad, S.A.A.; Salah Hassan, M. Evaluation and selection of construction projects based on risk analysis. Structures 2020, 27, 361–370. [Google Scholar] [CrossRef]
- Hauke, J.; Kossowski, T. Comparison of values of pearson’s and spearman’s correlation coefficients on the same sets of data. Quaest. Geogr. 2011, 30, 87–93. [Google Scholar] [CrossRef]
- Eskander, R.F.A. Risk assessment influencing factors for Arabian construction projects using analytic hierarchy process. Alex. Eng. J. 2018, 57, 4207–4218. [Google Scholar] [CrossRef]
- Thompson, D.L. Data Analysis. Conducting Undergraduate Research in Education; Routledge: New York, NY, USA, 2022; pp. 94–108. [Google Scholar] [CrossRef]
- Ahmed, B.; Das, P.; Banerjee, R.; Singh, S.; Bharti. Data Analytics Methods: Artificial Intelligence for Precision Agriculture; Auerbach Publications: Boca Raton, FL, USA, 2024; pp. 259–269. [Google Scholar] [CrossRef]
- Eid, M.A.; Hu, J.W.; Issa, U. Developing a Model for Analyzing Risks Affecting Machinery Tunnel Execution. Buildings 2023, 13, 1757. [Google Scholar] [CrossRef]
- Xu, S.; Shirowzhan, S.; Sepasgozar, S.M.E. Urban Waste Management and Prediction through Socio-Economic Values and Visualizing the Spatiotemporal Relationship on an Advanced GIS-Based Dashboard. Sustainability 2023, 15, 12208. [Google Scholar] [CrossRef]
Disclaimer/Publisher’s Note: The statements, opinions and data contained in all publications are solely those of the individual author(s) and contributor(s) and not of MDPI and/or the editor(s). MDPI and/or the editor(s) disclaim responsibility for any injury to people or property resulting from any ideas, methods, instructions or products referred to in the content. |
© 2025 by the authors. Licensee MDPI, Basel, Switzerland. This article is an open access article distributed under the terms and conditions of the Creative Commons Attribution (CC BY) license (https://creativecommons.org/licenses/by/4.0/).