Abstract
As urban built-up areas are the main generators of carbon emissions, scientific and accurate estimation of carbon emission levels in urban built-up areas is an important method to help implement the carbon neutrality target. Nowadays, developing a spatial data–based carbon emission estimation model that reduces dependence on energy consumption data, shortens the estimation cycle, and enhances its applicability to urban spatial development remains an urgent challenge. In this study, we developed a spatial data-based carbon emission estimation model for urban built-up areas using data from five winter cities in China over a 15-year period as an example. The estimation model not only strengthens the connection between carbon emission results and urban spatial elements, but also gets rid of the over-reliance on energy data, which in turn greatly shortens the estimation cycle of urban carbon emissions. We also used the model to investigate the distribution of carbon emissions in urban built-up areas. Compared with the traditional carbon emission estimation model based on energy consumption, the correlation coefficient between the two models is greater than 0.95, and the error between the two models is extremely small, indicating that this model has important practical value. On this basis, we propose applications for this model. We apply the model to Harbin, China, to estimate built-up area carbon emissions without using energy consumption data, thereby improving estimation efficiency. We also assess how the current urban planning strategy influences low-carbon construction. Additionally, we use the SHAP method to rank each spatial element’s contribution to carbon emissions. Based on these results, we propose low-carbon optimization strategies for winter cities in China.
1. Introduction
The impacts of climate change, including the increased frequency of extreme weather events, loss of biodiversity and threats to human health, are serious impediments to global sustainable development [1,2]. According to the Sixth Assessment Report of the Intergovernmental Panel on Climate Change, the global average surface temperature between 2011 and 2020 increased by 1.09 °C compared to the period between 1850 and 1900 [3]. Many countries are actively reducing emissions to combat global warming. To effectively address the risks posed by climate change, China formally announced its commitment to achieving carbon peaking by 2030 and carbon neutrality by 2060 at the 75th United Nations General Assembly. Cities, as centers of human activity and production, are characterized by high energy consumption and carbon emissions, estimation for over 80% of global greenhouse gas emissions [4,5]. Urban built-up areas, the primary zones of residential and economic activity, are not only major sources of urban carbon emissions but also key focuses of urban planning and research. Existing research indicates that a rational layout and efficient coordination of urban spatial elements effectively reduce regional carbon emissions [6]. Winter cities, defined as urban areas situated above 45° N latitude, experience extended periods of low temperatures during winter. As a result, residents in these cities are highly dependent on centralized heating systems during the cold season. Additionally, climatic impacts on transportation systems further increase overall energy consumption [7]. The energy consumption patterns of these cities differ markedly from those of other urban areas. These cities consume larger amounts of fossil fuels, including coal, gasoline, and natural gas, resulting in comparatively higher carbon emissions [8]. Therefore, focusing on winter cities as primary research subjects and targeting built-up areas, the major sources of carbon emissions, for low-carbon development studies constitute a critical research pathway toward achieving carbon neutrality.
Currently, urban carbon emission estimation models have emerged as a crucial technical tool and a significant research direction in low-carbon urban planning [9,10]. Urban carbon emission estimation models are primarily categorized into the production-based carbon emission accounting (PBA) method, which relies on energy consumption data, and the consumption-based carbon emission accounting (CBA) method, which utilizes economic input-output data [11,12,13,14]. Notably, the IPCC Guidelines for National Greenhouse Gas Inventories represent a production-based carbon emission accounting method developed by the Intergovernmental Panel on Climate Change (IPCC) in collaboration with the World Meteorological Organization (WMO) and the United Nations Environment Program (UNEP). It serves as a critical and authoritative tool for countries and cities worldwide in compiling greenhouse gas emission inventories [15,16]. This model segments regional carbon emissions into four sectors: energy; industrial processes and product use; agriculture, forestry, and other land use; waste. Energy consumption data is employed to calculate the carbon emissions for each sector, which are aggregated to determine the total regional greenhouse gas emissions [17,18]. Due to its widespread adoption in global climate monitoring reports, many cities and regions rely on energy consumption data to calculate urban carbon emissions and compile greenhouse gas inventories. Based on these estimation results, urban decision-makers and researchers can accurately assess the impact of variations in energy consumption activities on carbon emissions and monitor shifts in the urban carbon emissions structure [15]. Consequently, this model has become the most widely employed urban carbon emission estimation technique in urban planning [15,19]. Although the energy consumption data-based carbon emission estimation model offers several advantages, its integration with urban spatial elements remains limited in the context of urban planning and research. The correlation between its estimation results and spatial elements is low, providing inadequate support for urban planning [11,20,21]. Additionally, Traditional carbon emission estimation models often involve lengthy processes due to the difficulty in obtaining and aggregating energy consumption data. This makes it challenging to accurately assess the impact of urban development and construction on carbon emissions [22,23].
To enhance the relevance of carbon emission estimation results to spatial elements, and to attempt to shorten the carbon emission estimation cycle, researchers have increasingly focused on developing models grounded in urban spatial data. Initially, scholars explored carbon emission models based on land use and established the relationship between land use and land cover (LULC) and carbon emissions [24,25]. Building on this foundation, scholars began using non-energy data to quantify regional carbon emissions and incorporate them into related research. During this period, some scholars combined population location data, points of interest (POI)s, road data and building boundary vectors with energy use statistics to develop a city-wide carbon emission estimation method [26,27]. In addition, some scholars have characterized the spatial and temporal distribution of urban carbon emissions using urban spatial pattern data and multidimensional city-scale data [28,29]. Subsequently, scholars have focused on directly quantifying changes in urban carbon emissions using spatial data. For city areas and urban agglomerations, some researchers have employed population and GDP data, combined with landscape pattern and land use area data, to establish a macro-scale carbon emission estimation model [30,31,32]. Other scholars have focused on micro-scale areas within cities, subdivided carbon emissions into multiple sectors, and developed neighborhood-level carbon emission estimation models using population and GDP statistics alongside spatial data such as floor areas and parking space counts [33,34]. It is evident that developing urban carbon emission estimation methods based on non-energy data has become a prominent research trend. However, most existing studies focus on the macro scale of cities and urban clusters or the micro scale of communities, with limited attention given to the meso scale of built-up areas. These estimation scales provide limited guidance for the development of key functional zones within cities. Furthermore, existing estimation models still depend on energy and economic data as supplementary inputs, sustaining a high demand for data resources.
In summary, although carbon emission estimation methods based on energy data are widely used, the lengthy process of acquiring such data and the need for cross-sectoral collaboration result in a prolonged urban carbon emission estimation cycle. Moreover, the integration of traditional estimation methods with spatial elements is limited, rendering the results less supportive of urban planning efforts. Given the growing demand for more efficient carbon emission estimation methods, many scholars have begun to explore approaches based on non-energy data. However, current research has largely overlooked the mesoscale units that include urban built-up areas, and the spatial data employed in the estimation process are relatively limited. Therefore, this paper proposes a novel spatial data-based carbon emission estimation model for urban built-up areas in winter cities, aiming to improve data accessibility and shorten the estimation cycle. Focusing on winter cities with relatively high carbon emissions can effectively unlock their carbon reduction potential, accelerate progress toward national carbon neutrality goals, and enhance the intrinsic value of this study. Although narrowing the scope may reduce applicability due to variations in carbon emission structures across climate zones, it substantially enhances the model’s accuracy, particularly in estimating spatial data, based emission coefficients. By focusing on built-up areas, the model’s results can directly inform urban development and construction. Compared with other spatial data-based carbon emission estimation models, this model draws on a wider range of spatial data sources and relies less on energy and economic data, resulting in a more streamlined and efficient estimation framework.
The remainder of this paper is organized as follows: Section 2 details the case area and the methodology for developing a spatial data-based carbon emission estimation model for urban built-up areas; Section 3 presents the empirical analysis by applying the model to selected winter cities and evaluating its accuracy; and Section 4 discusses the main findings and outlines the primary applications of the proposed model. The specific contributions of this paper are as follows: (1) propose a carbon emission estimation framework for urban built-up areas, which narrows the estimation scope and more accurately assesses carbon emission changes resulting from urban residents production and activities; (2) propose a spatial data-based carbon emission estimation model for built-up areas in winter cities to reduce dependence on energy consumption data, shorten estimation cycles, and improve estimation efficiency; and (3) propose application pathways for this model through empirical research, accompanied by recommendations for future low-carbon urban development.
2. Data and Methods
2.1. Study Area
This study selected Harbin, Daqing, Jixi, Qiqihaer, and Mudanjiang in China as research subjects, as shown in Figure 1. All five cities are situated in Heilongjiang Province, China, north of 53°33″ N. Their average annual temperatures range from −5.3 °C to 5 °C. The long, cold winters align with the typical climate characteristics of winter cities. Based on their permanent urban populations and built-up areas, these cities are classified into three categories: Type I large cities (Harbin), Type II large cities (Qiqihaer and Daqing), and medium-sized cities (Mudanjiang and Jixi). Considering their functional divisions and pillar industry characteristics, the cities can be further categorized as follows: comprehensive cities (Harbin), resource-based cities (Daqing, Mudanjiang, and Jixi), and industrial cities (Qiqihaer). Collectively, these cities represent the primary typologies of winter cities in China, thereby offering significant representativeness and research value. Moreover, as all cities are located within the same province and share relatively similar political and economic environments, they provide valuable opportunities for horizontal comparison. To ensure data adequacy and accuracy, the study employed 15 years of relevant data (2007–2021) to support the subsequent development and validation of the carbon emission estimation models.
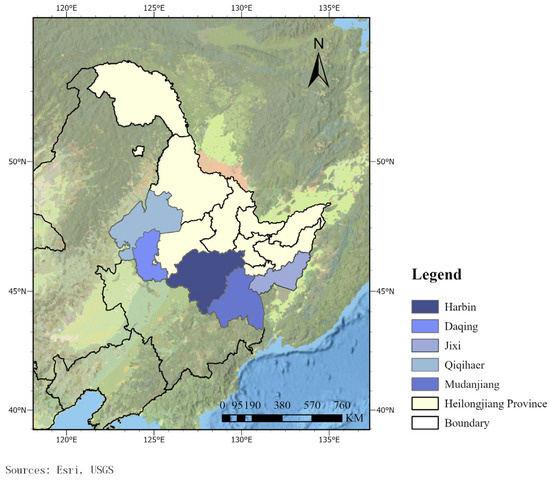
Figure 1.
Location of the case cities.
2.2. Data Source
This study primarily sourced urban energy consumption data, spatial data, and fundamental carbon emission estimation data from urban statistical yearbooks, urban energy statistical yearbooks, provincial greenhouse gas (GHG) inventory compilation guidelines, urban transportation survey reports, national GHG inventory guidelines, and reference factor tables for various energy-converted standard coals.
The collection of energy consumption data primarily relies on the use of various energy sources within the “urban district” scope defined in the statistical yearbook, excluding agricultural activity data. These data are ultimately aggregated to form the energy consumption dataset for built-up areas. Furthermore, according to reference coefficient tables for converting different energy sources into standard coal equivalents, complex energy consumption data—such as raw coal, coke, gasoline, and diesel—are converted into standard coal equivalents. These data are available for download from the official websites of various city statistics bureaus and the Ministry of Ecology and Environment of the People’s Republic of China. Since statistical yearbooks are official publications, their content and format are highly standardized, and the data show strong consistency, eliminating the need for further processing.
The collection of spatial data primarily relies on statistical yearbooks, multi-level planning blueprints, urban transportation reports, and satellite remote sensing imagery. Statistical findings indicate that within the built-up areas of each sample city, residential clusters exist at substantial distances from the central urban districts. Although geographically distant from city centers, these areas feature well-developed urban functions and generally maintain high population densities. Notably, these areas are administratively designated as district-level regions under the direct jurisdiction of their respective cities. In statistical yearbooks, data for these areas are classified under the “urban district” category. To ensure consistency between the statistical boundaries of spatial and energy consumption data, this study includes these discrete areas within the built-up area scope. Specifically, land use data are primarily derived from planning maps, supplemented by statistical yearbooks. When data are missing for certain years, land area estimates are obtained from remote sensing imagery. Spatial data on transportation systems and municipal facilities are mainly sourced from statistical yearbooks and urban transportation reports. Spatial data on green space systems are primarily compiled from statistical yearbooks and remote sensing imagery.
2.3. Methods
2.3.1. Framework of Research
This study proposes an innovative model for estimating carbon emissions in urban built-up areas to address the limitations of previous studies. The logical framework of the study is illustrated in Figure 2. The three steps to achieve the objectives of this research are: (1) The study develops a carbon emission estimation framework for urban built-up areas based on the IPCC Guidelines for National Greenhouse Gas Inventories. Based on the framework, the study uses energy consumption data to account for carbon emissions in five winter cities in China, defining baseline data and establishing standards for validating the estimation results presented in the study. (2) The study develops a spatial data-based carbon emission estimation model for urban built-up areas, based on urban spatial basis data and spatial utilization data. The estimation results are validated against baseline data to assess the model’s accuracy. (3) The study outlines the application model and expansion pathways for the spatial data-based carbon emission estimation model for urban built-up areas. Using Harbin, a winter city in China, as a case study. The study accounts for urban carbon emissions in 2022–2024 based on urban spatial data. Subsequently, analyze the contribution of urban spatial elements to carbon emissions and propose development strategies applicable to winter cities in China.
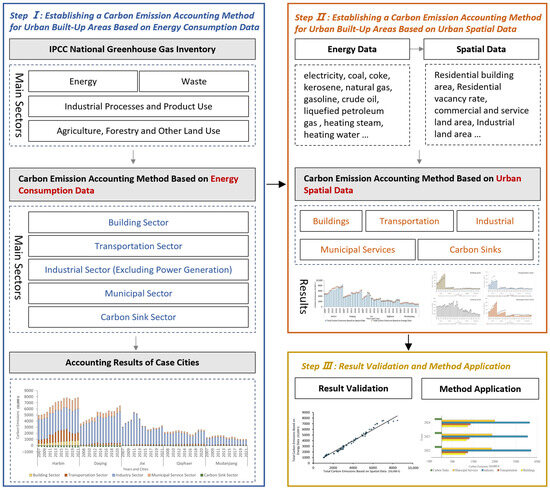
Figure 2.
Research framework.
2.3.2. Establishing Carbon Emission Estimation Framework and Model for Urban Built-Up Areas Based on Energy Consumption Data
The IPCC Guidelines for National Greenhouse Gas Inventories, as the primary model for preparing greenhouse gas emission inventories worldwide, is highly authoritative and scientifically robust. As a carbon emission estimation model for municipalities and broader regions, its classification of estimation sectors is comprehensive and generalized [22]. However, when applied to the smaller scale of urban built-up areas, this classification method inadvertently includes carbon emissions from non-built-up areas, such as agriculture and forestry, in the energy consumption and waste treatment sectors. This will lead to an overestimation of the results. To address these issues, this study adopts the carbon emission estimation model outlined in the IPCC Guidelines for National Greenhouse Gas Inventories. Based on the carbon emission characteristics and research requirements of urban built-up areas, the emission sectors have been reclassified to establish a carbon emission estimation system applicable to this area (see Figure 3). Due to the revised estimation scope, notable differences exist between the carbon emission estimation system for urban built-up areas and the IPCC Guidelines for National Greenhouse Gas Inventory. For instance, carbon emissions from electricity consumed within urban built-up areas are attributed to electricity consumption processes across various sectors. To avoid double counting, carbon emissions resulting from electricity production in the industry sector must be excluded. Furthermore, as agricultural land falls outside urban built-up areas, agricultural carbon emissions are omitted from the estimation list. By adapting the estimation system, the urban built-up area carbon emission estimation framework is aligned with the IPCC Guidelines for National Greenhouse Gas Inventory, thereby laying the foundation for subsequent development of carbon emission estimation models.
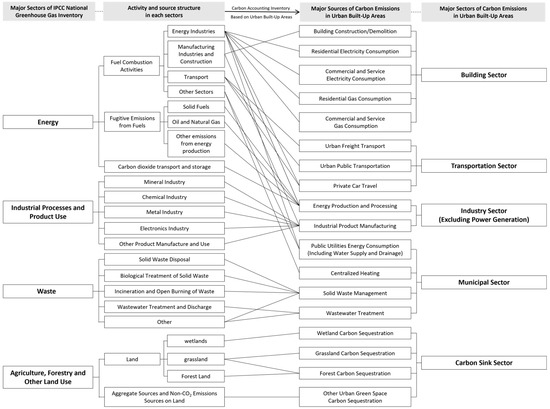
Figure 3.
Carbon emission estimation framework for urban built-up areas.
To establish accurate benchmark data for verifying carbon emissions in urban built-up areas, this study utilizes the most commonly used energy consumption data to perform detailed calculations for each carbon emission sector. Due to changes in the estimation scope, the specific estimation process must also be adjusted. Accordingly, this study builds on the urban built-up area estimation system by employing the IPCC model to calculate carbon emissions across different sectors within urban built-up areas, and subsequently constructs an energy consumption-based carbon emission estimation model (see Table 1). The model primarily utilizes two types of data: energy consumption data and standard carbon emission factors. The energy consumption data for urban built-up areas are obtained from sources such as the City Statistical Yearbook and the City Energy Statistical Yearbook. In this process, data collection primarily relies on the “urban energy consumption figures” provided in the statistical yearbooks, while data related to agricultural activities are excluded, the resulting dataset represents the energy consumption of the built-up area.

Table 1.
Carbon emission estimation model for urban built-up areas based on energy consumption data.
For uniform calculation, this model adopts the following standard carbon emission coefficients based on current national standards and relevant literature. According to the Carbon Dioxide Emission Accounting Methodology and Data Verification Sheet issued by the National Development and Reform Commission of China, the carbon emission factor per unit of standard coal is 2.64 tCO2/tce. According to the Stipulation of Energy Consumption of Municipal Wastewater Treatment issued by the Market Supervision and Regulation Administration of China, daily treatment capacities ≥ 5 × 10⁵ m3/d use 0.0000310 tce/m3; 2 × 10⁵–5 × 10⁵ m3/d use 0.0000356 tce/m3; 1 × 10⁵–2 × 10⁵ m3/d use 0.0000413 tce/m3; and 5 × 10⁴–1 × 10⁵ m3/d use 0.0000477 tce/m3. For carbon sink sector, forests sequester 3.81 tCO2/ha·year, wetlands 4.44 tCO2/ha·year and grasslands 0.91 tCO2/ha·year [35,36]. The carbon sink coefficient for other urban green space types is set at 2.16 tCO2/ha·year [29]. Moreover, for convenience of calculation, the model converts complex energy consumption data, such as raw coal, coke, gasoline, and electricity, into kilogram of standard coal (kgce) equivalents using reference factor tables for various energy sources (see Table 2).
Table 2.
Conversion coefficients of various energy types to standard coal equivalent.
2.3.3. Establishing Spatial Data-Based Carbon Emission Estimation Model for Urban Built-Up Areas
Building on the carbon emission estimation system for urban built-up areas, this study employs urban spatial data to quantify carbon emissions across various subsectors, thereby constructing a spatial data-based estimation model (see Table 3). Due to the climatic conditions of winter in urban areas, residents exhibit a strong demand for centralized heating and public transportation. Compared with carbon emission accounting processes in other regions, this model emphasizes municipal services and transportation sectors during development, particularly ensuring accurate estimation of carbon emissions from centralized heating and multiple transport modes.
Table 3.
Carbon emission estimation model for urban built-up areas based on spatial data.
The selection of spatial data plays a critical role in the process of model development. It is essential to integrate spatial data commonly used in previous studies, such as the area of different construction land types, residential floor area, and green space area [32,39]. It is also necessary to address the challenging task of estimating carbon emissions from the road and municipal sectors in the research. Particular emphasis should be placed on developing methods to estimate carbon emissions from urban transportation and district heating systems without relying on energy consumption data [26,34]. In this research, the spatial data required for estimation includes urban spatial basis data and spatial utilization data. Urban spatial basis Data refers to the fundamental physical and structural attributes of the built environment. This category primarily includes data on land use distribution, transportation infrastructure and travel distances, newly constructed building areas, infrastructure scale, and the extent of green spaces. Spatial utilization data captures the intensity, efficiency, and behavioral aspects of how urban spaces and facilities are used. It mainly encompasses indicators such as vacancy rates of buildings, per capita waste generation, per capita sewage discharge, ownership and use of different modes of transportation, and service utilization levels of municipal infrastructure. Most urban spatial basis data and spatial utilization data are sourced from planning drawings, documents, and statistical yearbooks at various administrative levels. It is important to note that the residential vacancy rate in this study is derived from the ratio of unsold commercial housing floor area to total residential floor area, based on urban statistical data. Although this method has some limitations in accuracy, it ensures good data accessibility and generalizability, thereby improving the overall rigor of the calculation approach. In addition, the public transportation data used in this study primarily include buses, subways, light rail, and other transit modes. In addition, the public transportation data used in this study primarily include buses, subways, light rail, and other transit modes. To ensure data reliability and generalizability, the average annual mileage of private vehicles was estimated primarily from per capita transportation expenditure data in the statistical yearbooks. All other data were directly obtained from relevant official documents.
In addition, the model estimation involves two types of coefficients: standardized coefficient for carbon emissions from urban spatial data in winter cities and carbon emission calculation coefficient. Carbon emission calculation coefficient is a standardized, externally validated factor used in conventional carbon accounting to convert measured activities into carbon emissions. Established by authoritative guidelines and datasets, it mostly includes the carbon emission coefficient per unit of standard-coal energy consumption, standard-coal conversion factors for electricity and other fuels, and carbon sink coefficients for urban green space. Standardized coefficient for carbon emissions from urban spatial data in winter cities is a statistically derived parameter that maps unit changes in spatial features to expected carbon emissions under cold-climate operating conditions. It describes the amount of ton of coal equivalent (tce) consumed within a unit spatial area. The establishment of this coefficient is a key prerequisite for ensuring the model’s accuracy. It is primarily derived from 15 years of relevant energy consumption and spatial data from five case cities. In line with the scope of this study, all relevant data were collected during the development of the estimation model. By calculating and aggregating the coefficient values for each city and each year, a total of 75 data points were obtained for each coefficient. Consistent with methodologies adopted in similar studies, this research uses the expected values of these data as coefficient values and computes corresponding standard deviations to validate their accuracy [40,41]. Typical items include: energy consumption per unit land use area, per unit building floor area, energy consumption per unit of heated area, and energy consumption per unit of freight turnover. The specific results are shown in Table 4. The results show that the standard errors for most coefficients are relatively small, indicating a high overall accuracy in the coefficient calculations. However, it should be acknowledged that no coefficient calculation is entirely free from error. In estimating coefficients related to the transportation sector, the data exhibit a relatively high degree of dispersion. This is mainly due to variations in the accuracy of transportation statistics across the case cities, which may result in potential estimation errors for the transportation sector.
Table 4.
Expected values and variances of each coefficient for winter cities.
Compared with the energy consumption-based carbon emission estimation model, this approach yields more timely results by using spatial activity data rather than relying solely on energy consumption data. Moreover, the results clearly reflect the impact of urban spatial development and changes in spatial utilizations on carbon emissions, thereby supporting low-carbon urban planning.
2.3.4. Assessment Methods for Estimation Models
To assess the accuracy of the new carbon emission estimation model, this study employs R2, MSE, RMSE, and MAE to evaluate the variability between the carbon emission estimates based on spatial data and those based on energy consumption data. Table 5 showed their formulas. These metrics offer a clear assessment of the model’s performance. R2 is a key measure of fit, with values closer to 1 indicating a better fit. MSE, RMSE, and MAE are primarily used to assess the error between two datasets. MSE amplifies larger errors by squaring them, making it more sensitive to extreme values. The unit of MSE is the square of the original data, resulting in generally larger values. RMSE represents the average error between the two datasets, with its unit consistent with that of the original data, reflecting the distribution of the error. MAE represents the average absolute difference between two datasets, being insensitive to outliers, and provides an overall measure of error. For error metrics, smaller values indicate less deviation between the two sets of estimation results. It is important to note that the values of MSE, RMSE, and MAE are directly influenced by the scale of the original data, and the magnitude of the error cannot be assessed solely by the size of these values. Comparisons with the original data are necessary for accurately assessing the model’s performance.
Table 5.
The formula of metrics to assess model performance.
3. Results
3.1. Results of Carbon Emission Estimation Based on Energy Consumption Data
Based on the previously summarized carbon emission estimation model for urban built-up areas using energy consumption data, this study calculates carbon emissions across various sectors in the built-up areas of Harbin, Daqing, Jixi, Qiqihar, and Mudanjiang from 2007 to 2021 (see Figure 4). This study adopts carbon emission estimates derived from the IPCC Guidelines for National Greenhouse Gas Inventories as baseline data, providing a foundation for the subsequent comparative analysis of estimation results. Horizontal comparisons reveal that Harbin, the only comprehensive city among the five, exhibits substantially higher carbon emissions than the other four cities. In 2021, total carbon emissions from Harbin’s built-up area reached 75.78 million tons. Daqing, an important resource-based and industrial city in China’s winter city regions, recorded the second highest carbon emissions reached 63.12 million tons. In contrast, Mudanjiang, a smaller medium-sized city, registered the lowest carbon emissions. In 2021, it only had 10.18 million tons. Temporal analyses indicate that industrial carbon emissions constitute the largest share of total emissions in China’s winter cities, generally exceeding 50%. Since China’s winter cities are situated within the old industrial base of northeast China, akin to a rust belt, fluctuations in industrial carbon emissions have become a critical determinant of overall regional emissions. With the optimization and upgrading of industrial structures, the share of industrial carbon emissions in integrated cities, exemplified by Harbin, has gradually declined. Conversely, as cities expand and urbanization progresses, carbon emissions from the transportation and public service sectors have steadily increased. Meanwhile, carbon sinks remain relatively low in winter cities due to climatic constraints. In summary, among the five cities, only Mudanjiang has exhibited a downward trend in total carbon emissions, whereas the other four continue to display a fluctuating upward trend. These findings indicate that China’s winter cities remain far from achieving urban carbon neutrality, highlighting the critical need to scientifically and effectively assess the relationship between urban spatial changes and carbon emissions in order to promote low-carbon, sustainable development in winter city regions.
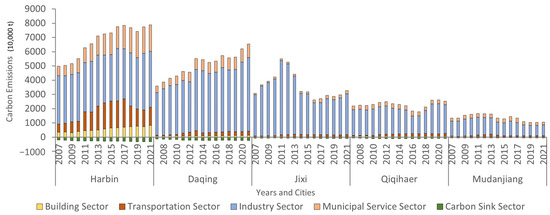
Figure 4.
Carbon emission estimation results for the built-up area of case cities based on energy consumption data.
3.2. Results of Carbon Emission Estimation Based on Spatial Data
Based on the carbon emission estimation model for spatial data, the study reviewed statistical yearbooks and transportation survey reports from various administrative levels to obtain the urban spatial basis data and urban spatial utilization data for each case city. It then calculated the total carbon emissions in the built-up area and compared these results with those derived from energy consumption data (see Figure 5). The comparison reveals that the total carbon emissions calculated by both models are relatively similar, with neither model consistently producing higher estimates than the other. Regarding the error values themselves, the largest discrepancy in any single year amounts to only about 2 million tons. This is negligible compared to the magnitude of the results themselves. This indicates that discrepancies in the estimation results are not due to the estimation model itself but are instead caused by inaccuracies in the underlying data.
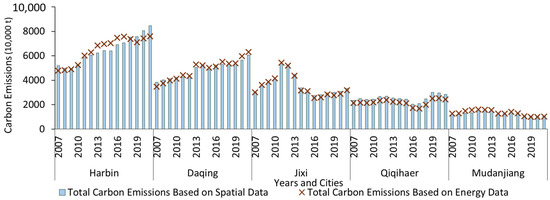
Figure 5.
Comparison of total carbon emission estimation results using two models.
In additional, the study calculates the carbon emissions for each sector using urban spatial data and compares these results with those derived from energy consumption data estimation (see Figure 6). Since the estimation model for carbon sinks is identical in both approaches (both use the model of area covered by each type of vegetation carbon sink factor) and gets identical results, the carbon sink sector was excluded from the comparison, focusing the analysis on the remaining four sectors. The results indicate that carbon emission estimation based on spatial data is more sensitive to the effects of urban spatial changes on carbon emissions. Overall, the two models get similar results across the various carbon emission sectors. In the buildings sector, although both models follow a similar trend, some differences in the absolute values are observed. In the transportation sector, however, the discrepancy between the two models is relatively large. This discrepancy is particularly pronounced in the case of Harbin. This is mainly because Harbin is experiencing rapid economic growth and accelerated urban expansion, with key indicators, such as residential floor area, commercial service facility land area, per capita travel distance, and urban freight turnover, growing rapidly and exhibiting continuous fluctuations. Consequently, these dynamic changes result in discrepancies between the spatial data-based estimation results and those derived from energy consumption data.
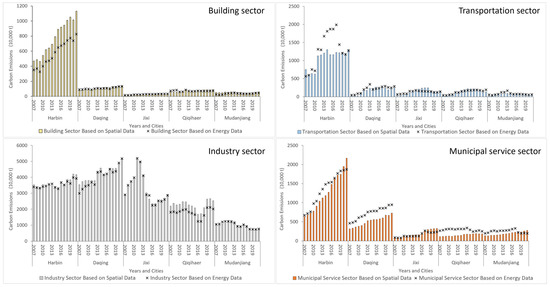
Figure 6.
Comparison of carbon emission estimation results by sector using two models.
3.3. Distribution of Estimated Carbon Emissions in Urban Built-Up Areas
Traditional carbon emission estimation models rely on city-level energy consumption data, making it difficult to estimate emissions at the administrative district scale within built-up areas. This study uses urban spatial data to rapidly identify the spatial distribution of carbon emissions within built-up areas. We collected urban spatial basis data and spatial utilization data from all administrative districts in Harbin. Using the spatial data-based carbon emissions accounting model, we accurately estimated the spatial distribution of carbon emissions within the city’s built-up areas. The results are shown in Figure 7. Over time, urban carbon emissions tend to concentrate toward the center, forming a pattern of high central emissions and lower emissions in peripheral areas. Here, “center” refers not to the geographical center but to the area of secondary and tertiary industrial concentration. In contrast, carbon emissions outside the central region grow more slowly and even decline in some cities. This phenomenon is especially pronounced in Harbin and Daqing, which have relatively high total emissions. Therefore, controlling emission growth in secondary and tertiary industrial central regions is the most effective way to reduce total emissions in urban built-up areas.
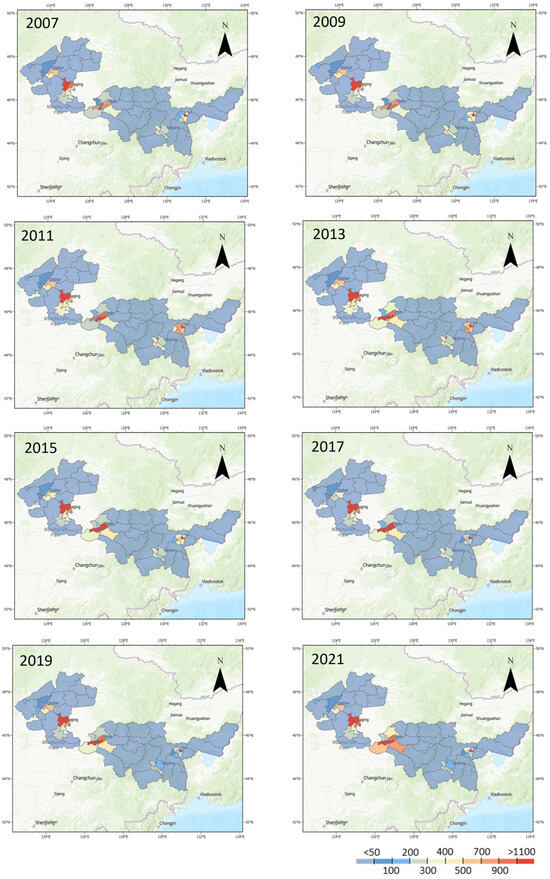
Figure 7.
Distribution of estimated carbon emissions in urban built-up areas.
3.4. Validation of Accuracy of Estimation Results
To scientifically validate the accuracy of the carbon emission estimation model for spatial data, this study employed regression analysis to compare the results derived from spatial data with those based on energy consumption data (see Figure 8 and Figure 9). And calculate relevant metrics that can measure the performance of the model (see Table 6). The validation results show that the correlation between the estimation results of the two models is high, and the error is small. Correlation coefficients exceed 95% for both total carbon emissions and sector-specific estimates. For total carbon emissions, the correlation between the two models reaches 98%, and the error rate is only about 6%. These findings demonstrate the high accuracy of spatial data-based carbon emission estimates. For the estimation results of different sectors, the building sector has the highest relevance; the industrial sector has the lowest error rate; and although the transportation sector shows a relatively higher error rate, it remains within acceptable bounds. In summary, the spatial data-based carbon emission estimation model for urban built-up areas demonstrates both high accuracy and significant practical value.
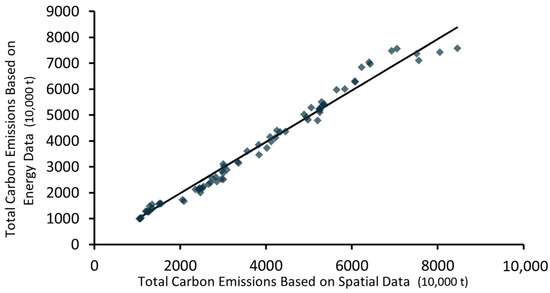
Figure 8.
Accuracy verification of total carbon emission estimation results.
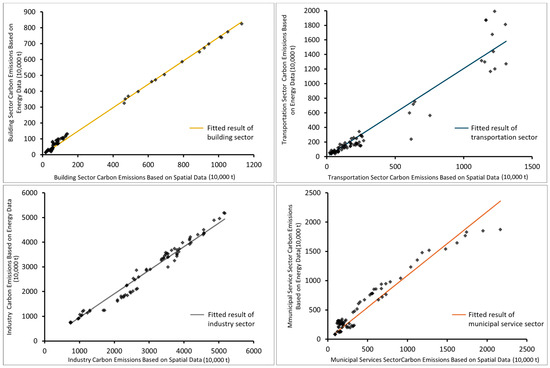
Figure 9.
Accuracy verification of carbon emission estimation results by sector.
Table 6.
Validation metrics of the carbon-emission estimation model by sector.
Compared with energy consumption-based carbon emission estimation models, those based on spatial data can quantify carbon emissions within built-up areas by using the city’s spatial characteristics. In the buildings sector, outcomes are heavily influenced by the accuracy of vacancy rates and energy consumption per unit area. Precise statistics can ensure that carbon emission estimation based on spatial use closely aligns with that based on energy consumption. In the transportation sector, private vehicle travel data significantly impacts estimation accuracy. However, since official statistics on these data are scarce in statistical yearbooks, the study must rely on urban transportation survey reports or questionnaires, potentially introducing minor errors. For other sectors, relevant data are obtained from statistical yearbooks and multi-level GHG inventories, resulting in higher estimation accuracy. Overall, carbon emission estimation based on spatial data gets results numerically similar to those derived from energy consumption data, while also relying on simpler and more universally available datasets. Moreover, owing to its strong correlation with urban spatial elements, this model allows for real-time adjustments of estimation results based on changes in the built-up area, thereby reducing reliance on energy consumption data and enhancing flexibility and scalability. In summary, developing a carbon emission estimation model for urban built-up areas based on spatial data represents a crucial technical approach to achieving the carbon neutrality goals and supporting urban planning for low-carbon city development.
4. Discussion
4.1. Applicability of the Model
As the spatial data-based carbon emission estimation model for urban built-up areas becomes increasingly established and refined, it can be effectively integrated into urban planning. Traditional carbon emission estimation models, which rely on energy consumption data, are subject to lengthy statistical cycles and significant lag. In comparison, spatial data-based carbon emission estimation models accurately compute carbon emissions in response to urban spatial changes, thereby enhancing the timeliness of the results. The spatial data-based carbon emission estimation model for winter cities proposed in this study, although narrower in scope than other spatial data-based models, produces highly accurate results and no longer depends on energy or economic data once the carbon emission estimation coefficients are established. Compared with widely used AI-based prediction models, although these models are more efficient, the spatial data involved in their training process remain a “black box” in terms of explaining the mechanisms influencing carbon emissions. This limitation prevents the estimation results from directly informing urban development and construction practices. By analyzing the sources and mechanisms of urban carbon emissions during model development, this study enables the identification of urban sectors exhibiting persistently high or sharply increasing emissions based on estimation results, thereby providing effective technical support for low-carbon urban development.
This model holds significant practical value. For example, in Harbin, China, due to the delayed release cycle of statistical yearbooks, relevant departments had not published energy consumption statistics for 2022 and later. Consequently, urban policymakers and researchers cannot accurately track changes in carbon emissions using energy consumption data, thereby hindering timely assessment of urban low-carbon development and planning outcomes. Therefore, this study employs the spatial data-based carbon emission estimation model to assess urban carbon emissions in Harbin for 2022–2024 (see Figure 10). Although energy data were unavailable for validating the estimation results, this estimation approach effectively addresses the issue of lag in carbon emission estimation and ensures the timeliness of the results.
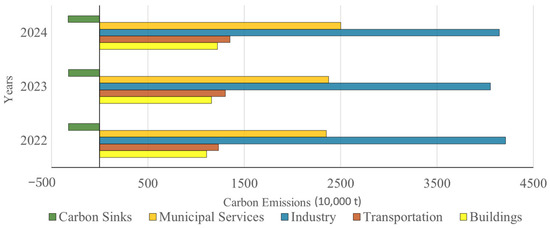
Figure 10.
Estimation results of urban built-up areas carbon emissions in Harbin in 2022 to 2024.
The estimation results indicate that total urban carbon emissions continue to exhibit a gradual upward trend. As cities expand, emissions from the buildings, municipal services, and transportation sectors increase, with the buildings sector showing the most pronounced growth. In contrast, the industry sector, the primary source of carbon emissions, continues to decline. This suggests that Harbin’s initiatives for industrial space agglomeration and for transforming and upgrading its industrial structure have effectively reduced industrial carbon emissions. Conversely, despite recent municipal efforts to promote low-carbon measures, such as zero-carbon buildings and new energy vehicles, these measures have not sufficiently offset the increase in carbon emissions resulting from the expansion of the built-up area. It can be seen that how to accurately control the spatial elements related to carbon emissions and effectively reduce the high carbon emission sectors is an important means for urban planning to help the implementation of the carbon peak and carbon neutrality targets.
Although this model provides several advantages, its applicability is confined to estimating carbon emissions in winter cities, as the standardized coefficients were derived specifically for this category. In future research, developing a carbon emission estimation model with broader applicability will require expanding data collection to include energy consumption and spatial data from cities across different climate zones. This expansion would allow for the calculation of carbon emission estimation coefficients applicable to a wider range of cities, thereby facilitating the development of a more universal estimation model. Two major challenges are expected to arise in this process. First, extending coverage to a broader range of cities will substantially increase data requirements. Statistical data from different cities may vary in units, recording methods, and scope, posing difficulties in accurately compiling energy consumption and spatial datasets. Second, residential energy consumption patterns differ substantially across climate zones. For example, residents in winter cities rely heavily on centralized heating during the winter but use air conditioning less frequently in summer. In contrast, residents in hot-summer, cold-winter regions rely extensively on air conditioning during summer but seldom depend on centralized heating in winter. Consequently, applying a uniform carbon emission estimation coefficient across diverse cities may lead to considerable estimation errors. To ensure broader applicability and accuracy, it may be necessary to calculate separate coefficients for different climate zones when developing a carbon emission estimation model.
4.2. Suggestions Based on the Carbon Emission Estimation
As important heavy industry bases, the spatial data-based carbon emission estimation of China’s winter cities have far-reaching significance. While enhancing carbon emission estimation efficiency, these results can also guide urban spatial planning and development. The Shapley Additive Explanations (SHAP) method quantified the contribution of each spatial data to the estimation of urban carbon emissions [42]. The results are presented in Figure 11. The honeycomb plot indicates the importance of each element to carbon emission, which visually reveals how each element affects the model estimation results. On the horizontal axis, the farther an element lies from zero, the greater its influence on the results; those closer to zero are less influential. Overall, these ten spatial elements have significant impacts on carbon emissions. The Shapley value contribution for public facilities’ land area exhibits greater fluctuations. In the high SHAP value region, its contribution rises sharply, strongly indicating that public facilities’ land area is a key factor influencing carbon emissions in China’s cold-region cities. Other spatial elements also contribute to some extent, ranked in descending order of importance in the figure. The scatter points of these factors are denser, indicating that the contributions of these factors are more consistent across multiple samples. In contrast, scatter points for public facilities’ land area are more dispersed, with pronounced extreme contributions in the high-value region. This suggests that the public facilities’ land area contribution varies significantly among sample cities, making its impact on carbon emissions relatively difficult to assess.
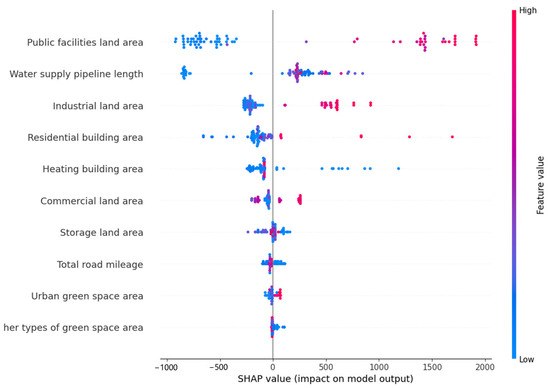
Figure 11.
Form importance using the SHAP method.
According to the carbon emission estimation results, the carbon emissions of Harbin, Daqing and Qiqihaer are still in the rising stage and have not realized the target of reaching the carbon peak. Although Jixi and Mudanjiang have already experienced their emission peaks, their carbon emissions have trended upward in recent years, necessitating measures to prevent another peak. Effective management of urban spatial elements can significantly reduce regional carbon emission levels. Based on the contribution of each element, industrial land area, residential building area, heating building area, and commercial land area are identified as the primary carbon sources. Carbon emissions in the industrial sector can be reduced by integrating decentralized industrial land into comprehensive industrial parks. The proportions of residential and commercial land should be scientifically managed to reduce building-sector carbon emissions. The sizes of these land types should be determined based on the city’s population and future development needs, particularly to prevent residential over-expansion. Public facilities’ land area has a variable impact on carbon emissions, so adjustments should align with the city’s economic development needs and current conditions. In the transportation sector, urban spatial control does not significantly reduce carbon emissions. Strategies such as increasing the share of new energy vehicles and developing a comprehensive public transport system should be considered. In contrast, variations in different types of urban green space have minimal impact on carbon emissions, so expanding green space solely to enhance carbon sinks is unnecessary and should be balanced with landscaping and urban development priorities. Building on the above conclusions, this study further proposes a set of key control indicators for effectively guiding low-carbon urban development. The proposed indicators include: new urban carbon sink reserves, the electrification rate of urban households, the renewable energy utilization rate, the proportion of developed land within existing urban areas, and the proportion of new buildings achieving net-zero carbon emissions. These indicators are derived from the key estimation variables of the proposed model. Regulating these metrics can effectively reduce regional carbon emissions. They also serve as essential reference indicators in the formulation and monitoring of urban planning, thereby supporting the development of low-carbon cities. By integrating the aforementioned low-carbon city development plans and control indicators, the strategies derived from this model can effectively support the realization of carbon peaking and carbon neutrality objectives at the master planning level. During the urban planning process, prioritizing the scale and spatial structure of key land use types can enhance the effectiveness of urban carbon reduction strategies. In the supervision and evaluation stages of urban planning, the control indicator system can be applied to assess the level of low-carbon development, thereby providing technical support for evaluating the outcomes of urban planning.
Compared to previous studies, this work provides a more comprehensive and in-depth perspective. This study not only proposes a more efficient and accurate accounting method for carbon emissions in urban built-up areas, but also proposes a targeted low-carbon construction strategy for winter cities based on the results of spatial data-based carbon emission accounting. This approach enables carbon-reduction strategies to be tailored to local conditions and policies to be implemented more precisely. It not only meets regional development needs, but also effectively prevents the risk of insufficient carbon reduction potential.
5. Conclusions
Carbon emission estimation models are essential technical tools for monitoring urban carbon emission changes and supporting decision-making in urban planning. In this context, efforts should be directed towards developing a novel urban carbon emission estimation model that better integrates the city’s spatial data, shortens the estimation cycle, and reinforces the role of estimation results in guiding urban planning. Therefore, this study uses Chinese winter cities as case studies to develop a spatial data-based carbon emission estimation model for urban built-up areas. The following are the main findings of this study:
(1) Building on the IPCC National Greenhouse Gas Inventory, we propose a carbon emission estimation system for urban built-up areas, along with a model for estimating carbon emissions based on energy consumption data. This model not only narrows the scope of urban carbon emission estimation but also identifies the primary sectors of carbon emissions in urban built-up areas and their corresponding estimation subjects. Based on this, carbon emissions in the central urban areas of five Chinese winter cities, used as case studies, are accounted for as baseline data in the subsequent validation of the estimation results.
(2) Based on the central city’s carbon emission estimation system and the incorporation of urban spatial data, we establish a spatial data-based carbon emission estimation model for urban built-up areas that covers five sectors: Buildings, Industry, Municipal Services, Transportation, and Carbon Sinks. When compared with the baseline data, the results from both models exhibit a correlation exceeding 95%, with errors remaining within acceptable limits, and both pass significance tests. These findings indicate that the proposed carbon emission estimation model is both accurate and practically valuable. The establishment of this estimation model not only strengthens the connection between carbon emission estimation and urban spatial elements, allowing the results to better reflect the impact of urban development and construction on carbon emissions, but also eliminates the reliance on energy consumption data in the urban carbon emission estimation process, thereby shortening the estimation cycle and improving the timeliness of the results.
(3) We propose an application path for the spatial data-based carbon emission estimation model for urban built-up areas. First, the model can estimate urban carbon emissions without requiring energy consumption data. In this study, we estimated Harbin’s carbon emissions for 2022–2024 without using statistical yearbooks. The results indicate that carbon emissions from Harbin’s built-up area continue to rise slowly, with the buildings sector exhibiting the most significant growth. In contrast, guided by recent policies promoting large-scale industrial park construction and industrial agglomeration, carbon emissions from the industry sector have shown a declining trend. Secondly, the study employs the SHAP method to rank the contributions of spatial data in the carbon emission assessment, identifying those spatial elements that are highly sensitive to changes in carbon emissions. Subsequently, the study proposes low-carbon construction strategies tailored for winter cities based on these elements.
Author Contributions
Conceptualization, Y.Z. (Yuran Zhao); methodology, Y.Z. (Yuran Zhao); software, Y.Z. (Yuran Zhao) and Y.Z. (Yan Zhao); validation, Y.Z. (Yuran Zhao); formal analysis, Y.Z. (Yuran Zhao); investigation, Y.Z. (Yuran Zhao); resources, Y.Z. (Yuran Zhao); data curation, Y.Z. (Yuran Zhao) and Y.Z. (Yan Zhao); writing—original draft preparation, Y.Z. (Yuran Zhao); writing—review and editing, Y.Z. (Yuran Zhao); visualization, Y.Z. (Yuran Zhao) and Y.Z. (Yan Zhao); supervision, H.L. and Q.Y.; project administration, H.L. and Q.Y.; funding acquisition, H.L. All authors have read and agreed to the published version of the manuscript.
Funding
This work was supported by the National Key Research and Development Program of China, Ministry of Science and Technology of the People’s Republic of China (Grant No. 2018YFC0704705).
Institutional Review Board Statement
Not applicable.
Informed Consent Statement
Not applicable.
Data Availability Statement
The original contributions presented in this study are included in the article. Further inquiries can be directed to the corresponding author.
Acknowledgments
The authors would like to thank the editors of the Special Issue for their help and all the anonymous reviewers for their benevolence and wise comments which have led to the significant improvement of the first version of the research paper.
Conflicts of Interest
The authors declare no conflicts of interest.
References
- Sun, B.; Zhong, C.; Yu, D.; Han, Q.; Tang, J. Life cycle carbon emission assessment and carbon payback period analysis for the regeneration of old residential areas in cold regions: Case study in Qingdao, China. Sustain. Cities Soc. 2024, 115, 105860. [Google Scholar] [CrossRef]
- Wang, Y.; Chen, W.; Zhao, M.; Wang, B. Analysis of the influencing factors on CO2 emissions at different urbanization levels: Regional difference in China based on panel estimation. Nat. Hazards 2019, 96, 627–645. [Google Scholar] [CrossRef]
- Revi, A.; Satterthwaite, D.; Aragón-Durand, F.; Corfee-Morlot, J.; Kiunsi, R.; Pelling, M.; Roberts, D.; Solecki, W. 2014: Urban areasUrban areas. In Climate Change 2014: Impacts, Adaptation, and Vulnerability. Part A: Global and Sectoral Aspects. Contribution of Working Group II to the Fifth Assessment Report of the Intergovernmental Panel on Climate Change; Cambridge University Press: Cambridge, UK; New York, NY, USA, 2014; pp. 535–612. [Google Scholar]
- Dhakal, S. Urban energy use and carbon emissions from cities in China and policy implications. Energ. Policy 2009, 37, 4208–4219. [Google Scholar] [CrossRef]
- Lynn, J.; Peeva, N. Communications in the IPCC’s Sixth Assessment Report cycle. Clim. Change 2021, 169, 18. [Google Scholar] [CrossRef]
- Houghton, R.; House, J.; Pongratz, J.; Werf, G.; Defries, R.; Hansen, M.; Le Quéré, C.; Ramankutty, N. Chapter G2 Carbon emissions from land use and land-cover change. Biogeosciences 2012, 9, 5125–5142. [Google Scholar] [CrossRef]
- Abediasl, H.; Balazadeh Meresht, N.; Alizadeh, H.; Shahbakhti, M.; Koch, C.R.; Hosseini, V. Road transportation emissions and energy consumption in cold climate cities. Urban Clim. 2023, 52, 101697. [Google Scholar] [CrossRef]
- Xu, H.; Chen, J.; Kim, J.I. An integrated LCA–BIM framework for assessing carbon emissions in buildings in China’s cold regions. J. Clean. Prod. 2025, 522, 146255. [Google Scholar] [CrossRef]
- Soytas, U.; Sari, R.; Ewing, B.T. Energy consumption, income, and carbon emissions in the United States. Ecol. Econ. 2007, 62, 482–489. [Google Scholar] [CrossRef]
- Wei, W.; Zhang, P.; Yao, M.; Xue, M.; Miao, J.; Liu, B.; Wang, F. Multi-scope electricity-related carbon emissions accounting: A case study of Shanghai. J. Clean. Prod. 2020, 252, 119789. [Google Scholar] [CrossRef]
- Carpio, A.; Ponce-Lopez, R.; Lozano-García, D.F. Urban form, land use, and cover change and their impact on carbon emissions in the Monterrey Metropolitan area, Mexico. Urban Clim. 2021, 39, 100947. [Google Scholar] [CrossRef]
- Guan, D.; Meng, J.; Reiner, D.M.; Zhang, N.; Shan, Y.; Mi, Z.; Shao, S.; Liu, Z.; Zhang, Q.; Davis, S.J. Structural decline in China’s CO2 emissions through transitions in industry and energy systems. Nat. Geosci. 2018, 11, 551–555. [Google Scholar] [CrossRef]
- Peters, G.P. From production-based to consumption-based national emission inventories. Ecol. Econ. 2008, 65, 13–23. [Google Scholar] [CrossRef]
- Wiedmann, T. A review of recent multi-region input–output models used for consumption-based emission and resource accounting. Ecol. Econ. 2009, 69, 211–222. [Google Scholar] [CrossRef]
- Tian, S.; Wang, S.; Bai, X.; Luo, G.; Li, Q.; Yang, Y.; Hu, Z.; Li, C.; Deng, Y. Global patterns and changes of carbon emissions from land use during 1992–2015. Environ. Sci. Ecotechnology 2021, 7, 100108. [Google Scholar] [CrossRef] [PubMed]
- Wu, F.; Huang, N.; Zhang, F.; Niu, L.; Zhang, Y. Analysis of the carbon emission reduction potential of China’s key industries under the IPCC 2 °C and 1.5 °C limits. Technol. Forecast. Soc. Change 2020, 159, 120198. [Google Scholar] [CrossRef]
- Lin, B.; Sun, C. Evaluating carbon dioxide emissions in international trade of China. Energy Policy 2010, 38, 613–621. [Google Scholar] [CrossRef]
- Steininger, K.; Lininger, C.; Droege, S.; Roser, D.; Tomlinson, L.; Meyer, L. Justice and cost effectiveness of consumption-based versus production-based approaches in the case of unilateral climate policies. Glob. Environ. Change 2014, 24, 75–87. [Google Scholar] [CrossRef]
- Xu, L.; Du, H.; Zhang, X. Driving forces of carbon dioxide emissions in China’s cities: An empirical analysis based on the geodetector method. J. Clean. Prod. 2021, 287, 125169. [Google Scholar] [CrossRef]
- Khan, F.; Pinter, L. Scaling indicator and planning plane: An indicator and a visual tool for exploring the relationship between urban form, energy efficiency and carbon emissions. Ecol. Indic. 2016, 67, 183–192. [Google Scholar] [CrossRef]
- Zhang, C.; Zhao, L.; Zhang, H.; Chen, M.; Fang, R.; Yao, Y.; Zhang, Q.; Wang, Q. Spatial-temporal characteristics of carbon emissions from land use change in Yellow River Delta region, China. Ecol. Indic. 2022, 136, 108623. [Google Scholar] [CrossRef]
- Baltar De Souza Leão, E.; Nascimento, L.F.M.D.; Andrade, J.C.S.D.; Puppim De Oliveira, J.A. Carbon accounting approaches and reporting gaps in urban emissions: An analysis of the Greenhouse Gas inventories and climate action plans in Brazilian cities. J. Clean. Prod. 2020, 245, 118930. [Google Scholar] [CrossRef]
- Zhou, X.; Liang, Y.; Li, L.; Chai, D.; Gu, X.; Yang, L.; Duan, J. Analysis of spatial and temporal characteristics and influence mechanisms of carbon emissions in China’s, 1997–2017. J. Clean. Prod. 2024, 485, 144411. [Google Scholar] [CrossRef]
- Fattah, M.A.; Morshed, S.R.; Morshed, S.Y. Impacts of land use-based carbon emission pattern on surface temperature dynamics: Experience from the urban and suburban areas of Khulna, Bangladesh. Remote Sens. Appl. 2021, 22, 100508. [Google Scholar] [CrossRef]
- Ghosh, S.; Dinda, S.; Chatterjee, N.D.; Dutta, S.; Bera, D. Spatial-explicit carbon emission-sequestration balance estimation and evaluation of emission susceptible zones in an Eastern Himalayan city using Pressure-Sensitivity-Resilience framework: An approach towards achieving low carbon cities. J. Clean. Prod. 2022, 336, 130417. [Google Scholar] [CrossRef]
- Zheng, Y.; Du, S.; Zhang, X.; Bai, L.; Wang, H. Estimating carbon emissions in urban functional zones using multi-source data: A case study in Beijing. Build. Environ. 2022, 212, 108804. [Google Scholar] [CrossRef]
- Gurney, K.R.; Patarasuk, R.; Liang, J.; Song, Y.; O’Keeffe, D.; Rao, P.; Whetstone, J.R.; Duren, R.M.; Eldering, A.; Miller, C. The Hestia fossil fuel CO2 emissions data product for the Los Angeles megacity (Hestia-LA). Earth Syst. Sci. Data 2019, 11, 1309–1335. [Google Scholar] [CrossRef]
- Cai, M.; Ren, C.; Shi, Y.; Chen, G.; Xie, J.; Ng, E. Modeling spatiotemporal carbon emissions for two mega-urban regions in China using urban form and panel data analysis. Sci. Total Environ. 2023, 857, 159612. [Google Scholar] [CrossRef]
- Chen, W.Y. The role of urban green infrastructure in offsetting carbon emissions in 35 major Chinese cities: A nationwide estimate. Cities 2015, 44, 112–120. [Google Scholar] [CrossRef]
- Ge, K.; Wang, Y.; Liu, X.; Hu, L.; Ke, S.; Jiang, X.; Zhang, W. Spatial effects and influence mechanisms of urban land use green transition on urban carbon emissions. Ecol. Indic. 2025, 172, 113261. [Google Scholar] [CrossRef]
- Li, Z.; Wang, S.; Zhang, H.; Chen, Y.; He, L.; He, B. Development of data-driven estimation models of village carbon emissions by built form factors: The study in Huaihe River Basin, China. Build. Environ. 2025, 276, 112846. [Google Scholar] [CrossRef]
- Zhang, Z.; Zhu, J.; Yang, L.; Lu, N. Toward dual carbon targets: Spatial correlation on comprehensive carbon emission index in urban agglomerations based on a new evaluation model. J. Clean. Prod. 2024, 458, 142507. [Google Scholar] [CrossRef]
- Jo, H.; Kim, H. The influence of urban spatial structure on building carbon emissions at the neighborhood scale considering spatial effect. Build. Environ. 2025, 276, 112888. [Google Scholar] [CrossRef]
- Ye, X.; Wang, Z.; Cui, K.; Meng, S.; Ning, X. Data-driven neighborhood-level carbon emission accounting models and decarbonization strategies: Empirical study on Central Shenyang City. Sustain. Cities Soc. 2025, 125, 106346. [Google Scholar] [CrossRef]
- Lou, H.; Shi, X.; Ren, X.; Yang, S.; Cai, M.; Pan, Z.; Zhu, Y.; Feng, D.; Zhou, B. Limited terrestrial carbon sinks and increasing carbon emissions from the Hu Line spatial pattern perspective in China. Ecol. Indic. 2024, 162, 112035. [Google Scholar] [CrossRef]
- Wang, X. The Estimation on Crop Absorbing Co2 Under Current and Double CO2 Conditions in the World. Acta Meteorol. Sin. 1996, 54, 466–473. [Google Scholar]
- GB/T 34913-2017; Classification and Presentation of Civil Building Energy Use. Standards Press of China: Beijing, China, 2017.
- GB/T 2589-2008; General Principles for Calculation of the Comprehensive Energy Consumption. Standards Press of China: Beijing, China, 2008.
- Tan, G.; Zhang, X.; Xiong, S.; Sun, Z.; Lei, Y.; Wang, H.; Du, S. Assessing the impacts of urban functional form on anthropogenic carbon emissions: A case study of 31 major cities in China. Ecol. Indic. 2024, 167, 112700. [Google Scholar] [CrossRef]
- Lin, Z.; Huang, B.; He, J.; Yan, Y.; Xiao, M.; Luo, Q.; Qi, Z.; Ding, X. High-resolution estimation of urban anthropogenic carbon emissions. Sustain. Cities Soc. 2025, 130, 106599. [Google Scholar] [CrossRef]
- Ye, C.; Ming, T. Land use carbon emissions estimation and carbon emissions control strategy effect scenario simulation in Zhejiang province. Heliyon 2023, 9, e20783. [Google Scholar] [CrossRef]
- Zhang, G.; Chang, F.; Liu, J. Carbon emission prediction of 275 cities in China considering artificial intelligence effects and feature interaction: A heterogeneous deep learning modeling framework. Sustain. Cities Soc. 2024, 114, 105776. [Google Scholar] [CrossRef]
Disclaimer/Publisher’s Note: The statements, opinions and data contained in all publications are solely those of the individual author(s) and contributor(s) and not of MDPI and/or the editor(s). MDPI and/or the editor(s) disclaim responsibility for any injury to people or property resulting from any ideas, methods, instructions or products referred to in the content. |
© 2025 by the authors. Licensee MDPI, Basel, Switzerland. This article is an open access article distributed under the terms and conditions of the Creative Commons Attribution (CC BY) license (https://creativecommons.org/licenses/by/4.0/).