Abstract
The penetration rate of battery electric buses (BEBs) continues to rise, and the design of BEB networks has become the foundation for establishing efficient and sustainable public transportation systems. Improving the equity of bus network and reducing the total cost of the bus system are taken as the targets, a multi-objective programming model for TNDP is proposed in this study. Among them, the Gini coefficient of bus travel times during peak hours and the direct travel proportion of the elderly during non-peak hours are used to describe the equity of the bus network. When calculating the comprehensive cost, factors such as the fleet size of battery electric buses, charging facilities requirements, and charging costs are taken into account. To enhance the reliability of the obtained results, the Non-Dominated Sorting Genetic Algorithm II (NSGA-II) is adopted to generate the Pareto-optimal solution set. The Mandl’s benchmark network is used for comparative validation, and a case study based on the road network of Zhengzhou is undertaken. Calculation results indicate that the proposed model not only minimizes the total travel costs but also significantly reduces the Gini coefficient of the transportation mode distribution. Under the constraint of overall expenses, it effectively improves the equity and the direct travel proportion of the elderly served by the bus system. The results can provide quantitative support to formulate livelihood transportation policies for local government and optimize the allocation of public transportation resources.
1. Introduction
With the continuous and rapid growth of the number of vehicles, urban traffic congestion issues have become increasingly severe, affecting the quality of life of residents and exacerbating environmental pollution. The prioritization development of public transportation and its electrification hold significant importance in alleviating these issues. Existing research has indicated that numerous factors influence residents’ travel choices, such as the traveler’s own characters, travel time, walking distance, fare, etc. [1,2]. Moreover, improving the service quality of the public transit system can effectively increase the property of travelers choosing buses for their trips [3]. Therefore, as the foundation of the bus system, optimizing the design of the network is crucial for enhancing the operational efficiency of bus transit systems and boosting their appeal to residents. Meanwhile, battery electric buses (BEBs) have been widely adopted within the bus transit system. For example, by the end of 2021, China had accumulated a substantial fleet of 419,500 BEBs within urban areas, marking a 10.8% increase from 2020. In addition, in the current stage of social development, many countries have recognized the importance of transportation equity. In China, for instance, balancing efficiency and equity is emphasized to construct a transportation system that satisfies a broader range of travelers. Similarly, transportation equity is also a key focus, objective, and research strategy outlined in the United States Department of Transportation’s Research, Development, and Technology Strategic Plan (RD&T Strategic Plan) for the years 2022 to 2026. However, in the practice of bus network design, the equitable distribution of transportation resources among passengers is frequently overlooked, ultimately hindering the accessibility of public transportation services.
Additionally, in the current situation, the ongoing development of rail transit construction and the increasing number of private cars have significantly affected residents’ travel preferences and altered the demand for bus transit. Under the declining trend in passenger flow, the composition and spatial distribution of passengers are undergoing gradual transformations. Notably, the proportion of elderly individuals within the passenger flow is steadily rising, to the point where they now constitute the primary user base for a substantial portion of bus routes. Therefore, how to better ensure the equity of the elderly taking public transportation is also an important aspect that needs to be considered in the design of bus transit network.
The current approach to design bus networks that favors operational efficiency may lead to inadequate public transportation coverage in peripheral urban areas with relatively low demand, while areas with higher demand may experience an overabundance of resources and excessive route redundancy. This disparity in public transportation experiences between different origins and destinations contributes to inequalities in public transportation access. Review [4] also shows that, although environmental sustainability has been the primary focus in most studies on transit network design problem (TNDP), integrating social aspects such as equity is vital for the design of a sustainable bus transit system. Thus, this study aims to investigate a bus network design method that simultaneously prioritizes equity and total cost considerations under the growing trend of electric bus development, particularly in the context of an aging population. The objective is to devise an approach that effectively balances these crucial aspects within the framework of electric bus deployment.
1.1. Literature Review
TNDP is a classic problem in the field of transportation. Significant progress has been made in developing models and solution methods to address TNDP. Key variations among these studies stem primarily from the selection of objective functions and the application of distinct solution algorithms. Notably, several comprehensive literature reviews have been conducted, offering multifaceted insights into the existing body of TNDP research from various perspectives. Guihaire and Hao (2008) [5] provided a comprehensive global review of essential strategic and tactical steps in transit planning, with an emphasis on network design and scheduling. Kepaptsoglou and Karlaftis (2009) [6] reviewed over sixty studies of TNDP and categorized elements of these studies into a three-layer/multi-item structure. Derrible and Kennedy (2011) [7] conducted a literature review examining how graph theory and network science have been applied to TNDP. Ibarra-Rojas et al. (2015) [8] focused on reviewing the applications of analytical approaches to TNDP. They also analyzed the sustainability problem in bus transit systems. Current research predominantly emphasizes environmental sustainability, particularly in terms of reducing emissions. However, a truly sustainable transportation system must address all three essential aspects: environmental, economic, and social [9] (Purvis et al., 2019). Iliopoulou et al. (2019) [10] collected seventy-five papers and reviewed applications of metaheuristics for solving TNDP. It is found that the performance of almost a third of the papers was analyzed utilized Mandl’s (1980) benchmark network [11] for performance evaluation. Gkiotsalitis and Cats (2021) [12] systematically reviewed and synthesized the literature on impacts of COVID on public transport, highlighting the necessity to adapt planning strategies. Mahmoudi et al. (2024) [4] used Critical Path Method (CPM) to visualize historical applications of analytical approaches in TNDP. The review further explored recent applications of these methods to new sub-problems, such as sustainable bus transit network design and integrating emerging transportation technologies into existing systems. In terms of solution methodologies for the TNDP, heuristic and meta-heuristic search algorithms have become the mainstream approaches [13], among which the Genetic Algorithm (GA) is the most widely applied. With continued research development, other search-based techniques such as Simulated Annealing (SA) and Particle Swarm Optimization (PSO) have also been incorporated into TNDP solutions. However, these algorithms often struggle to effectively handle multi-objective optimization. Since transportation problems are typically integrated optimization problems, multi-objective search methods have gradually been introduced to address optimization tasks in the transportation domain. Huo et al. (2024) [14] applied the NSGA-II to solve a multi-load automatic guided vehicles scheduling problem, which formulated multi-objective mixed integer program. Lu et al. (2023) [15] proposed an improved NSGA-II algorithm based on particle swarm optimization to solve the multi-objective intercity carpooling path optimization problem. Akopov and Beklaryan (2025) [16] proposed a new multi-agent hybrid clustering-assisted genetic algorithm (MA-HCAGA) for the design of large-capacity reconfigurable multi-layer road networks to ensure the effective connection between different layers. The research shows that using NSGA-II algorithm to solve multi-objective model is still in the exploratory stage.
With the advancement of environmental policies and the continuous progress of charging technology, the mileage and charging speed of battery electric buses have made a qualitative leap, and the electrification of buses has become a trend worldwide. Bus electrification often requires the joint solution of line design, shift setting, charging infrastructure layout and vehicle scheduling as a multi-objective and coupled optimization problem. Studies [17,18] indicated that the integration of electric buses necessitates modifications in the design paradigms, bus stop configurations, timetables and bus scheduling within the transit network. Iliopoulou et al. (2019) [19] formulated the electric transit route network design problem as a bi-level optimization problem, which jointly designed efficient transit routes and located required charging infrastructure. A multi-objective, particle swarm optimization algorithm, coupled with a mixed linear-integer programming model was used to solve the model. Liu et al. (2020) [20] used an improved artificial fish swarm algorithm (AFSA), incorporating crossover and mutation operators to optimize the transit route network, bus fleet allocation, and the location of charging stations. Tong et al. (2021) [13] proposed an optimization model for the electric transit network design, assuming that the locations of charging depots are predetermined. The objectives were to maximize travel reliability while keeping the total cost within an acceptable range. Iliopoulou and Kepaptsoglou [21] proposed the design framework of battery electric bus network, studied the design of opportunistic charging electric bus network under the condition of power supply change and queuing charging, and solved the problem of charging infrastructure location by robust optimization method. Pylarinou et al. (2021) [22] used a hybrid Genetic Algorithm to solve the optimal redesign problem of an existing transit route network, and proposed model aimed to minimize the cost of electrification implementation while enhancing the service level for passengers. Perumal et al. (2022) [23] reviewed 43 articles related to the electric bus technologies and give an overview of challenges in the electric bus planning process. These challenges included investment, charging infrastructure placement, the electric vehicle scheduling problem (E-VSP), and the charging scheduling problem. Liu et al. (2022) [24] presented a multi-objective optimization model for the electric transit network problem using a Pareto artificial fish swarm algorithm (PAFSA) embedded with the genetic algorithm (GA), which aimed to design bus routes, frequencies, and charging station locations and sizes, balancing the objectives of passengers and operators. Momenitabar et al. (2023) [25] proposed a bi-level optimization model for designing electric transit networks. The upper-level model aimed to minimize the total travel times and the number of indirect trips. The lower-level problem focused on minimizing the total costs of acquiring fast and energy storage chargers and demand charges for the transit network entirely operated by battery electric buses. The discrete multi-objective grey wolf optimizer algorithm was suggested in a discrete space to search for the feasible solution by providing the Pareto frontier of two objective functions. Li et al. (2024) [26] optimized design parameters of the electric bus network, such as stop spacing, headway, and batteries’ expected charging range. Aksoy and Alver (2024) [27] developed the multi-objective differential evolution algorithm to address the integrated problem referred to as the electric transit network design and frequency setting problem, and tested it on a hypothetical network. Energy states resulting from the individual evaluation of each bus in the best Pareto optimal solution considering dynamic aspects of the transit network were presented.
As an important aspect of social sustainability, equity is a critical field of study in transportation. There has been a recent effort to address equity issues in the transportation network [4]. In addition, accessibility can break the inequality caused by transportation resource allocation and further promote the realization of equity by improving the accessibility of various resources and services. Equity is considered as a critical dimension of accessibility assessment [28]. Feng and Zhang (2014) [29] proposed a multi-objective optimization model to balance the trade-off between maximizing equity and minimizing network construction costs, achieving accessibility-based transportation equity measurements. Li et al. (2018) [30] investigated the efficiency and spatial equity impacts of a unique island-looping high-speed rail network in Hainan province, China, using an integrated network and raster-based model to evaluate accessibility indicators. Behbahani et al. (2019) [31] suggested a framework for simultaneously optimizing network design and achieving social equity objectives to enhance accessibility. In addition, Lorenz curve analysis and Gini coefficient have also been widely used in the equity analysis of transportation networks [28,32,33,34,35]. Carleton and Porter (2018) [36] studied the theme of equity in the spatial distribution of transportation services for vulnerable groups. The results indicate that Lorenz curve analysis can be used to achieve overall equality between groups. Ma et al. (2022) [37] used ArcGIS to analyze the accessibility of transportation networks within urban agglomerations. They proposed the use of the Gini coefficient and Theil index to measure the disparities in accessibility. The research shows that accessibility as the core measurement index combined with inequality measurement methods such as Lorenz curve, Gini coefficient and Theil index has been proved to be an effective tool to quantify the equity of traffic space, and incorporating equity as a multi-objective optimization goal into network design can clearly depict the trade-off between efficiency and equity. However, there are still significant challenges in the refined measurement of vulnerable groups and the scalable implementation of large-scale networks.
Previous research has analyzed the travel behaviors of the elderly. He et al. (2020) [38] explored how satisfaction with transportation systems influences the social inclusion and overall wellbeing of older individuals. Mitra et al. (2021) [39] examined gender disparities in the mobility patterns of older adults in the U.S. Villena-Sanchez et al. (2022) [40] studied the travel habits of older adults in Mexico City, revealing that they tend to utilize public transit infrastructure when it is accessible, irrespective of whether they own a car. Ravensbergen et al. (2023) [41] found that older adults are more likely to be occasional transit users (such as monthly or annually) compared to younger individuals who often use buses daily. However, there is a notable lack of studies focusing on elderly-oriented bus service planning at the route level.
In recent years, research on evaluating the equity of public transport systems based on accessibility has also emerged and gradually increased. For example, El-Geneidy et al. (2016) [42] suggested that allocating public transit resources in an equitable manner is not only related to travel time, but also related to the out-of-pocket cost of transit. Ben-Elia and Benenson (2019) [28] applied the Gini index and two new developed indices (i.e., the absolute and normalized accessibility loss) to assess the equity implications arising from adjustments to transit services. Lyons and Choi (2021) [43] developed an index called the transit economic equity index, which facilitates the quantitative evaluation of equity in transit service provision. Raza et al. (2023) [44] constructed a multi-modal accessibility assessment framework for public transport, designed to capture the overall performance of the entire transport network. Achieving equity in transit systems is contingent upon its integration into the service planning process from the outset, and consequently, its incorporation into the TNDP [45]. We have summarized the current research considering equity in TNDP, as shown in Table 1.

Table 1.
Literature on TNDP considering equity.
In summary, the TNDP, as a classic topic in the transportation field, has developed a mainstream research framework centered on minimizing system costs and employing heuristic search algorithms for problem solving. The differences across existing studies mainly arise from variations in application scenarios, constraint settings, and the choice of search algorithms. With the rapid electrification of public transport systems, recent studies have also incorporated the operational characteristics of electric buses into traditional TNDP models. Meanwhile, as public awareness of social equity continues to rise, the issue of fairness in public transit, an essential component of public welfare, has received increasing attention. However, research addressing fairness considerations during the network design stage remains insufficient. As shown in Table 1, only seven papers actually considered equity in the TNDP. But they did not take into account the trend of aging of bus passenger flow and electrification of public transportation. In addition, three of the papers used equity as a constraint condition, and four used equity as a goal or one of the goals. As a constraint, the optimization process mainly focuses on optimizing other objectives (such as minimizing costs) while satisfying equity constraints. As the objective function, the optimization process directly focuses on equity, possibly by adjusting decision variables to maximize or minimize equity indicators. Thus, while progress has been made in addressing equity within the TNDP framework, there remains a need to integrate the transition to elderly-oriented services and electric buses into these analyses. Under this background, objectives of this study are to investigate the TNDP with focuses on both equity, elderly-oriented and the total cost, while also accounting for the prevailing trend towards the electrification of buses. It aims to explore how the shift to electric buses can be incorporated into equitable network design strategies.
1.2. Contributions
Existing studies focus on accessing or evaluating the equity condition of a given transit network. Equity aspects are neglected in most cases. As shown in Table 1, only seven papers actually considered equity in the TNDP. But they did not take into account the trend of aging of bus passenger flow and electrification of public transportation. In addition, three of the papers used equity as a constraint condition, and four used equity as a goal or one of the goals. As a constraint, the optimization process mainly focuses on optimizing other objectives (such as minimizing costs) while satisfying equity constraints. As the objective function, the optimization process directly focuses on equity, possibly by adjusting decision variables to maximize or minimize equity indicators. Thus, while progress has been made in addressing equity within the TNDP framework, there remains a need to integrate the transition to elderly-oriented services and electric buses into these analyses. Under this background, objectives of this study are to investigate the TNDP with focuses on both equity, elderly-oriented and the total cost, while also accounting for the prevailing trend towards the electrification of buses. It aims to explore how the shift to electric buses can be incorporated into equitable network design strategies.
Contributions of this paper are as follows: (1) A mathematical model for electric TNDP is constructed, considering cost, direct travel proportion of the elderly during non-peak hours, and equity as multi-objective. This model considers characteristics of the battery electric bus system. The total cost takes into account the charging cost of electric buses and the related costs of charging facility construction. In addition, in order to make the results more practical, transfer time was taken into account when calculating passengers’ travel time. (2) The modified Gini coefficient based on the Lorenz curve, which is constructed based on transit accessibility is used to characterize equity. Compared with the revised Gini coefficient based on the Lorenz curve, which is constructed with the public transport need index, the equity index established by considering transit accessibility not only takes into account the demand level of public transportation services, but also reduces the difference between public transportation and private car travel to reduce the use of private cars. (3) In order to achieve the optimal balance between equity, elderly-oriented and total cost objectives, the NSGA-II algorithm is used in this study to solve the model.
The rest of the paper is organized as follows. Section 2 establishes a multi-objective bus network planning model that takes into account equity and total cost. Section 3 proposes a model solving method based on the Non-dominated Sorting Genetic Algorithm II (NSGA-II). Section 4 demonstrates the method’s validity and applicability through 2 networks: a small-scale Mandl benchmark network and a large-scale Zhengzhou real-world network. Section 5 presents the conclusions and suggestions for future research.
2. Model for Electric TNDP
2.1. Problem Description
The goal of TNDP is to design a bus network based on the urban road network using mathematical optimization methods to meet the demand for public transportation. Compared with traditional buses, the main difference of BEBs lies in its energy replenishment process, which can easily lead to range anxiety, and its limited battery capacity limits its daily operating range. Due to the difficulty of charging BEBs during operation, they need to return to the charging station for charging after completing their operational journey. Therefore, compared to traditional fuel buses, electric bus systems require higher investment in fleet size and charging facility construction.
The following reasonable assumptions are made for the electric TNDP: (1) All buses in the public transportation system are BEBs using fast charging technology, and it is assumed that the average operating speed of buses on different bus routes remains relatively stable and is not significantly affected by external factors. (2) The arrival time of passengers at all bus stops follows a unified probability distribution pattern, which simplifies the randomness of passenger arrival and facilitates model analysis and calculation. (3) Before daily operation, BEB’s battery is fully charged and charging is only allowed at the terminal station. During the operation, no form of charging is arranged to ensure operational efficiency and safety.
2.2. Objective Functions
2.2.1. Equity in Terms of Travel Time
The Lorenz curve is used to describe the degree of distribution equality and has been widely applied in the evaluation of income distribution equality. Correspondingly, the Gini coefficient is a specific indicator calculated based on the Lorenz curve, used to quantitatively reflect the level of distributive equality. In recent studies, the Lorenz curve has not only been used to evaluate income distribution, but has also been widely applied in the field of transportation [32]. Everyone has the right to freely choose their own mode of travel, and equal individuals should enjoy equal travel resources and treatment. Therefore, based on the concept of transit accessibility proposed by [47,49], as well as the Lorenz curve, the Gini coefficient of the bus transit system is calculated to evaluate the equality of the bus transit system in providing services to different travelers.
The traditional Lorenz curve presents the cumulative distribution of wealth of the entire population in an intuitive graphical way. By sorting the population according to wealth from low to high and drawing a concave curve towards the origin, it deeply reveals the differences in wealth accumulation between different social classes, and thus becomes an important tool for measuring income distribution fairness. As the shape of the curve deviates from the perfectly equal line, the corresponding Gini coefficient increases, which intuitively reflects the decline in social equity. Similarly, when evaluating the quality of public transportation services, travel time is the most direct experiential indicator, and its importance is self-evident. However, unlike absolute quantities such as social wealth, the travel distance and conditions of travelers vary greatly, making it inadequate to rely solely on the absolute value of travel time to comprehensively reflect the differences in public transportation service levels. As shown in Figure 1, although the bus travel time between points C and D is significantly shorter than between points A and B, the quality of bus service experience in the former may be much lower than that in the latter, highlighting the limitations of evaluating based solely on absolute travel time. In order to more accurately measure the equity of public transportation resource allocation and effectively evaluate the differences in transportation service quality enjoyed by residents, this study introduces a relative transit accessibility measurement method, which calculates the ratio of the bus travel time between a certain OD (origin point to destination) pair to the theoretical shortest car travel time required between the OD pair. This relative indicator can more reasonably consider the relative value of travel time under different travel conditions, thereby providing support for achieving more fair and efficient optimization of public transportation services.
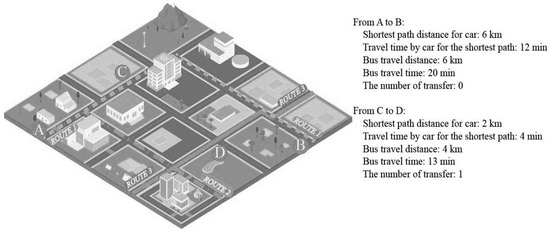
Figure 1.
A simple schematic diagram.
Subsequently, the cumulative proportion of this relative indicator is correlated with the cumulative proportion of categorized travelers, yielding a Lorenz curve that mirrors the distribution of bus transit resources, as depicted in Figure 2. On the horizontal axis lies the cumulative proportion of public transportation users, while the vertical axis denotes the cumulative proportion of relative transit accessibility. The solid line depicts the Lorenz curve, contrasting with the dashed line, which signifies absolute equity. The smaller the area enclosed between these two lines, the lower the Gini coefficient for public transportation, indicative of a more equitable distribution of transportation resources in practice.
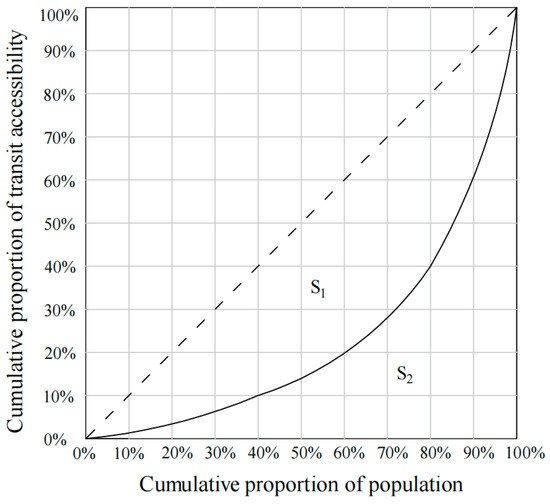
Figure 2.
Schematic representation of the Lorentz curve.
Accordingly, the computation of the Gini coefficient is formulated as follows:
where G is the Gini coefficient of public transportation; S1 is the area enclosed by the line representing absolute equity and the Lorentz curve; S2 is the integration of the Lorentz curve in the horizontal axis direction. Approximately, S2 can be discretized into trapezoids along the horizontal axis, and the calculation method can be illustrated as follows:
where is the cumulative proportion of population variables, , ; is the cumulative proportion of the relative transit accessibility, where the bus travel time includes the transfer time. The objective function of transit equity is thus as follows:
2.2.2. Direct Travel Proportion of the Elderly During Non-Peak Hours
With the aggravation of the aging problem in China, the elderly have gradually become the main component of bus system during the non-peak period. The bus plays a crucial role as the primary mode of motorized transportation in the daily lives of the elderly [52]. Limited by physical strength and other reasons, the elderly are the vulnerable groups in public transportation. Therefore, allocating more public transit resources to the elderly population to a certain extent during non-peak hours is also a reflection of bus equity. This study not only considers the peak-hour demand for passenger flow, but also considers the elderly demand during non-peak hours. Research [39] shows that the main reason for not using public transport is the inconvenience caused by its fixed routes and schedules. Therefore, increasing the proportion of public transportation by reducing transfers has a positive impact on elderly bus travel. The direct travel proportion of the elderly during non-peak hours is shown as follows:
where is direct travel proportion of the elderly during non-peak hours; is direct bus travel demand of the elderly during non-peak hours; is total bus travel demand of the elderly during non-peak hours; is the passenger flow using bus route l from node to node during non-peak hours.
2.2.3. Total Cost of the Bus System
The daily total cost of the bus transit system includes two parts: user cost and operator cost. The user cost mainly includes the cost of converting the total travel time of each traveler by the value per unit time, while operator cost includes various expenses incurred during the operation of the bus transit system. Among them, the travel time of travelers includes walking time, waiting time, and in-bus time, while the operator cost mainly includes the purchase cost of BEBs, charging fee, and charging facility cost, shown as follows.
where represents the total cost of the bus transit system; denotes the user cost; denotes the operator cost; represents the cost converted from the walking and waiting time of travelers based on the value per unit of time; is the cost converted from the in-bus time of travelers based on the value per unit of time; is the daily charging cost, mainly including the charging cost of bus batteries and the fixed cost of charging infrastructures; is the daily purchase and maintenance cost of BEBs.
The calculation methods for each component of the cost are shown in Equations (7)–(12). A uniform distribution is used to estimate the waiting time of travelers at bus stops, while in-bus time mainly includes the stop delay at intersections and the travel time of the bus on each segment along the bus route. The calculation of in-bus time mainly depends on the average travel speed of each bus route.
where is the unit cost of travelers’ walking and waiting time; is the set of nodes in the road network; is the distance travelers walk from the starting point to the boarding bus stop; is the distance of travelers walking from the alighting bus stop to the destination; is the walking speed of the travelers; is the frequency of the bus route chosen by travelers when travelling from bus stop to bus stop ; is the passenger flow from bus stop to bus stop in peak hour; is the conversion coefficient between passenger flow in peak hour and daily passenger flow; is the unit cost of passenger in-bus time; is the length of road section along the bus path from stop to stop ; is the average operation speed of the BEBs; is the set of sections along the bus path from stop to stop ; is the price of electricity; is the daily bus operating time; is the transit network, which can be represented as a set of bus routes; is the energy consumption per kilometer of the BEBs; is the frequency of bus route ; is the length of bus route ; is the cost of a single charging pile; is the number of charging pile; is the service life of the charging pile; is the purchase cost of per BEB; is the number of buses needed to ensure the normal operation of the bus network; is the service life of the BEB; is the single maintenance cost of the BEB; is the bus maintenance period; is the battery capacity of the power battery; is the charging efficiency of the charging pile; is the charging power of the charging pile; is the total operating time of one-way bus route, including the driving time on the line, the average charging time, and the delay time of entering and leaving the charging stop.
2.3. Constraints
- (1)
- Bus route length
Bus routes should be of appropriate length. Excessively long routes can extend the duration of a complete trip, affect the flexibility of bus network deployment and potentially increase the number of buses needed. Conversely, overly short routes may result in an excess of routes, raise operational costs, and necessitate more frequent transfers, thereby diminishing the overall service quality of the bus system.
where and are the minimum and maximum values of the bus route length lb, respectively.
- (2)
- The number of bus routes
To ensure convenient travel for residents while managing operating costs, the number of bus routes K in the network should be maintained at an optimal level.
where and are the minimum and maximum values of the number of bus routes, respectively.
- (3)
- Non-linear coefficient
In a bus transit network, a lower non-linear coefficient can effectively reduce detours in bus routes, thereby reducing passenger travel costs and improving overall satisfaction with bus services.
where is the straight-line distance between the starting and ending nodes of bus route b; is the maximum value of the non-linear coefficient of the bus route.
- (4)
- Departure frequency
The transport capacity of bus routes is significantly influenced by the departure frequency, which should meet the passenger flow demand of all sections along the route in both directions. Therefore, based on the results of passenger flow distribution and the maximum section passenger flow, the constraint on departure frequency is established as follows:
where is the departure frequency of bus route ; is the set of sections along bus route ; and are the passenger flow on section in the upstream and downstream directions of bus route , respectively; is the product of the maximum passenger capacity and maximum load factor of a bus.
- (5)
- Energy conservation
After each charging cycle, the State of Charge (SOC) reaches 100%, and the electricity consumed by the bus between two consecutive charges is equal to the amount charged each time.
where represents the number of completed runs before charging; represents the duration of charging.
Using bus transit network consisting of a set of bus routes as the control variable, a multi-objective nonlinear programming model can be constructed as follows:
S.t.
where is the transit equity; is the total cost; is the direct travel proportion of the elderly during non-peak hours; is the set of all feasible bus route network solutions.
3. Solution Algorithm
Due to the NP-hard nature of TNDP, heuristic search algorithms, such as genetic algorithms, ant colony algorithms, and simulated annealing algorithms, have become the mainstream methods for solving it in recent years. When applied to multi-objective optimization models, these methods typically transform the multi-objective model into a single-objective one by using weighting factors. However, determining the appropriate weights for each objective is a subjective process that can significantly affect the reliability of the results. To address this, NSGA-II (Non-dominated Sorting Genetic Algorithm II) has been implemented for solving multi-objective combinatorial optimization problems. The NSGA-II algorithm is highly effective, with its solution process mainly encompassing fast non-dominated sorting, crowding distance calculation, and population selection based on an elite strategy.
(1) Fast non-dominated sorting. Fast non-dominated sorting involves stratifying the population based on the dominance relationships among individuals. Specifically, an individual is considered to dominate another if all of its objective function values are either superior or equal to those of the other individual. All individuals that are not dominated by any others are assigned to the first rank (or grade 1). These individuals are then removed from consideration, and the dominance relationships among the remaining individuals are recalculated to determine the second rank (or grade 2). This process is repeated until all individuals in the population have been assigned a rank.
(2) Crowding distance calculation. The crowding distance of the individual is defined as the average distance on both sides of the individual. According to the fast non-dominated sorting, the crowding distance of each individual in the same grade is calculated by Equation (22). As shown in Figure 3, , and are the first, second, and third objective functions values, respectively, namely Gini coefficient, direct proportion, and total cost.
where is the crowding distance of the -th individual in a certain grade; is the number of optimization objectives in the multi-objective model; and represent the function values of adjacent individuals on both sides of the -th individual for the -th objective; and represent the maximum and minimum values of the -th objective function among the individuals in that grade, respectively.
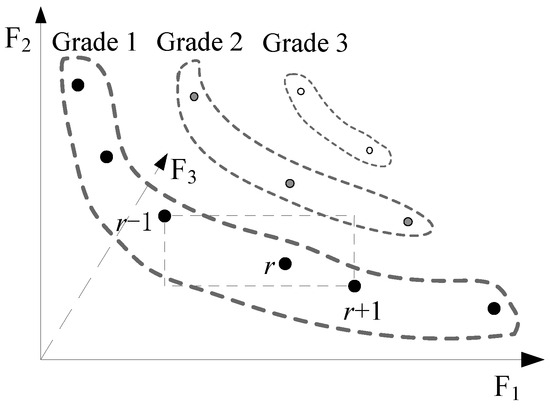
Figure 3.
Crowding distance calculation diagram.
(3) Selection based on elite strategy. To prevent the degeneration of the optimal solution, excellent individuals are selected from both parent population and filial population in order of increasing grade and decreasing crowding distance to form the new parent population until the number of individuals matches that of the previous parent population.
Based on the above description and the characteristics of the problem in this research, the basic solution process is designed specifically shown in Figure 4. Among them, the setup rules for the core processes are shown in Section 3.1, Section 3.2, Section 3.3 and Section 3.4.
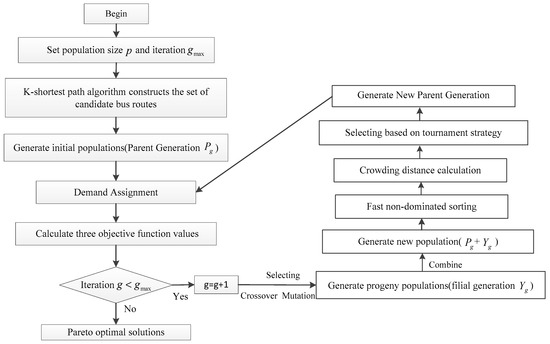
Figure 4.
The basic process of solution algorithm.
3.1. Generation of Initial Populations
The goal of population initialization is to generate an initial population with sufficient diversity and to cover the solution space, which lays a foundation for the exploration of global optimal solutions. Firstly, the K-shortest path algorithm is used to calculate K-shortest paths between any given OD pairs. The paths that do not meet the length and nonlinear coefficient constraints are eliminated, and the paths that meet the constraints are retained as candidate routes. Then, all routes within the set of candidate routes are encoded, and an initial population containing fixed number of individuals (chromosome) is created at random. Each individual (chromosome) represents a bus network composed of a certain number of candidate routes that meet the constraints.
3.2. Demand Assignment
For the initial population and the subsequent generations of offspring populations, operations such as non-dominated sorting and crowding distance calculation require the objective function values of all individuals in the population to be computed. The calculation of these objective function values depends on the passenger flow assignment process. In this study, the passenger flow assignment primarily relies on the Dijkstra algorithm. When multiple alternative paths exist between OD pairs, direct routes are prioritized. If no direct routes are available, the passenger flow is randomly distributed among multiple bus paths.
3.3. Objective Function Calculation
After demand allocation is completed, transit equity, total cost, Direct travel proportion of the elderly during non-peak hours of each individual need to be calculated. Firstly, the service frequency and the number of buses running on each route are calculated by Equations (14) and (18), and the corresponding 3 objective function values are obtained. Then, fast non-dominated sorting based on the objective function values, and calculating the crowding distance of each individual (chromosome) within each grade are accomplished. Individuals are selected according to the ranking and crowding distance values, and a new population is generated by merging with the parents.
3.4. Crossover and Mutation
To increase population diversity and avoid local optimality, using sample genetic algorithm, crossing and mutating are applied to the population to generate a filial generation population. Firstly, based on the crossover probability, two individuals are selected from the population, and the crossover operation is performed to generate offspring. Then, based on the mutation probability, the offspring are mutated to obtain a new population. Until the iteration satisfies the preset algebra, the pareto solution set is obtained.
4. Case Study
4.1. Mandl Benchmark Network
Mandl’s (1980) [11] benchmark network, widely used in case studies by researchers, consists of 15 nodes and 21 segments representing a road network in Switzerland. Figure 5 displays the Mandl road network along with the travel times (in minutes) between each pair of nodes.
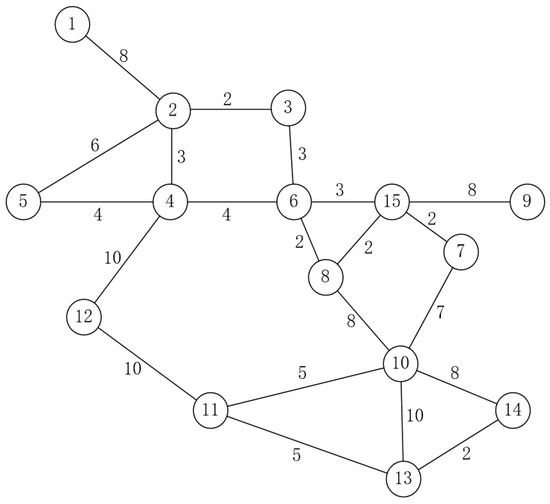
Figure 5.
Mandl’s benchmark network.
Based on the Mandl network, existing studies have applied various evolutionary algorithms for bus network optimization, including: MOSA (an extension of simulated annealing to multi-objective problems), BCO (a swarm intelligence-based method that mimics the foraging behavior of honeybees and explores the solution space through cooperative search), PSO (which simulates the social behavior of particle groups to converge toward optimal regions), GAWE (a genetic algorithm enhanced by embedded local search or weight-adjustment strategies), and AOGA (an improved genetic algorithm designed to reduce premature convergence). The method proposed in this study is compared against the above algorithms. The elderly passenger demand is randomly set to be 30–70% of the total passenger flow during peak hours. Table 2 displays the objective function values, total operating times, and fleet sizes for the bus network, as computed using various methods. Figure 6 demonstrates that, in comparison to the results obtained by other methods, the method proposed in this study not only enhances the direct bus travel proportion for the elderly but also maintains a favorable balance in terms of equity and total cost.
Table 2.
Comparison of different methods for Mandl benchmark network.
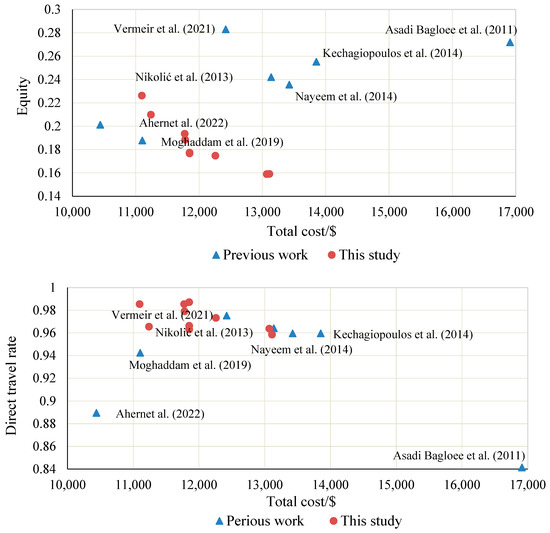
Figure 6.
Comparing results with previous work [53,54,55,56,57,58,60].
4.2. Network of Zhengzhou City
The main road network of Zhengzhou city, which consists of 44 nodes and 72 segments, as shown in Figure 7, is used for numerical example. The distances between each node-pair are provided in kilometers. It is assumed that the peak passenger flow demand for all origin-destination (OD) pairs is 10. Given the peak hourly passenger demand is 20, and the hourly elderly passenger demand in the non-peak period is 6. The primary parameter settings are outlined in Table 3.
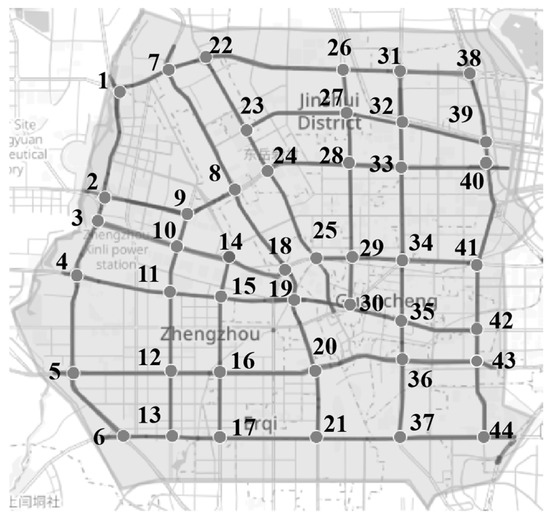
Figure 7.
The main road network of Zhengzhou city.
Table 3.
Parameters setting.
The objective function values of bus transit network schemes under different numbers of routes are shown in Table 4. The results indicate that as the Gini coefficient decreases, the total cost consistently increases. Further analysis of the objective function value’s trend, as depicted in Figure 8, reveals that as the number of bus routes in the network increases, the total cost exhibits a notable upward trend. Concurrently, the Gini coefficient experiences a slight increase, accompanied by fluctuations. The direct travel proportion of the elderly also undergoes minor changes. Consequently, the number of bus routes is determined to be 11, and the set of Pareto optimal solutions is illustrated in Figure 9.
Table 4.
Objective function values of bus transit network schemes under different numbers of routes.
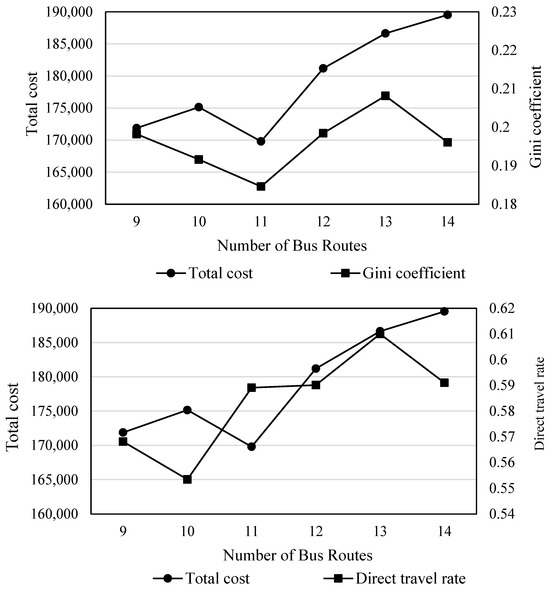
Figure 8.
The objective function value under different number of bus routes.
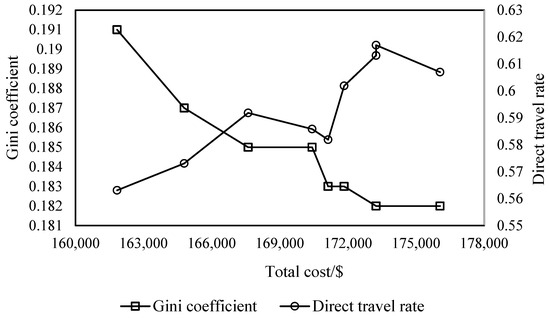
Figure 9.
Approximate Pareto optimal solution set.
It can be seen from Figure 10 that when the Gini coefficient is 0.191, the total cost reaches its minimum of 1.62 × 10⁵ dollar, the direct travel rate is 0.563. When the Gini coefficient decreases to the minimum value of 0.182, the total social travel cost increases to 1.76 × 10⁵ dollar, the direct travel rate is 0.607. This trade-off occurs due to conflicting objectives: a lower Gini coefficient implies greater equity in the bus system, a higher bus travel sharing proportion, and consequently, an increased demand for battery electric buses and charging equipment within the network, leading to higher total costs. Additionally, the direct travel proportion of the elderly increases with total costs, but this growth is not linear and exhibits fluctuations.
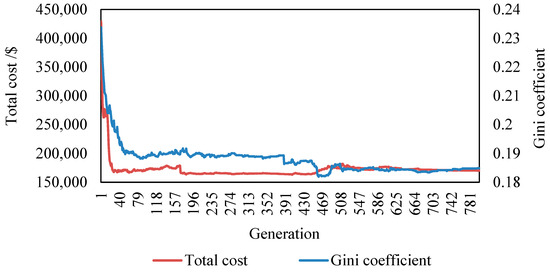
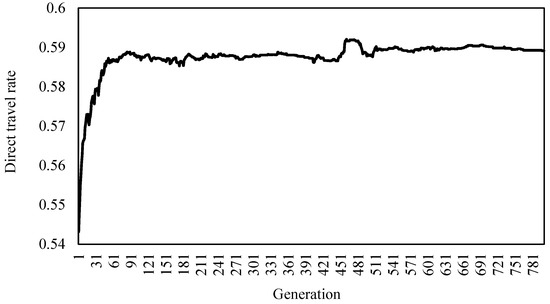
Figure 10.
Algorithm convergence process.
To assess the convergence speed of the method, the average values of the objective functions are computed by averaging the individual objective function values across each generation of the Pareto solution set. As illustrated in Figure 10, the algorithm demonstrates rapid convergence with minimal fluctuations. By the 100th iteration, a solution set close to the final solution has already been achieved.
According to the Pareto optimal solution set, decision-makers can weigh the travel needs of residents against the construction and operational costs of battery electric bus charging equipment to choose the most suitable solution. As an illustration, a solution with 11 bus routes is selected based on the total cost, transit equity and direct travel rate for the elderly. In this paper, the transit route network is selected which the total cost is 1.68 × 10⁵ dollar, Gini coefficient is 0.185 and direct travel rate is 0.59, as shown in Figure 11. It is denoted as network 1, and its Lorentz curve is obtained as shown in Figure 12. The dotted line indicates that the mode is absolutely fair. It can be seen that the area between the Lorentz curve and the dotted line is small, which proves that our proposed network scheme effectively improves the equity of residents’ travel mode.
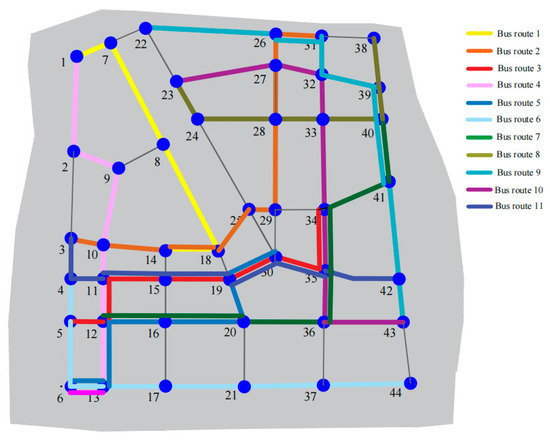
Figure 11.
Bus transit network.
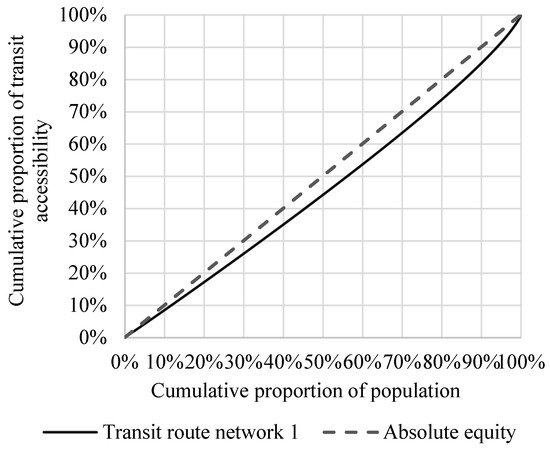
Figure 12.
Equity Lorenz curve of public transport system.
Details of transit route network 1 are shown in Table 5. From the result analysis, each node of routes can be traversed, which satisfies the rationality of the transit network. Meanwhile, under the passenger demand set in this paper, the equity is relatively high, and the route is suitable for the elderly, that is, the direct travel rate of the elderly is more than half.
Table 5.
Detailed results of the routes for solution.
5. Conclusions and Discussion
In this study, a multi-objective programming model is established with the goal of public transport system equity, elderly-oriented bus service level and total social travel cost. Taking equity as the objective function, it is possible to maximize or minimize the equity index by adjusting the decision variables, and the direct travel rate for the elderly and the transition of electric buses are included in the optimization analysis. To solve the three-objective model, the Pareto optimal solution set is obtained by NSGA-II. Firstly, the Mandl’s benchmark network is chosen to compare the objective function values of bus network design results from other studies with this paper. The results show that the equity index (0.1841) of the proposed method is significantly better than other methods when the online network scale is 6 lines. The total running time (122 min) is the shortest, the direct rate (0.9727) is higher, and the total cost (85,121 dollar) is sub-optimal, which reflects higher cost-effectiveness and performance of the model. And then, we select a large-scale network, indicating that the algorithm can be applied to the real road network to help decision makers choose the optimal solution. To get a more practical solution, the transfer time is taken into account in the calculation of bus travel time, and the cost of charging facilities required for battery electric vehicles is also considered in the total social cost. The results show that the proposed method can improve the equity of bus route network design scheme, raise the direct travel rate of the elderly (direct access rate was 0.59), reduce the difference of travel cost among different travelers, achieve a good balance in terms of equity, operational efficiency and aging requirements, and thus raise the attractiveness of bus travel mode to some extent.
It should be noted that the present study still has several limitations. For example, this study is a deterministic analysis and does not account for the stochastic factors and interactions that may exist within the system. In future work, simulation-based methods can be incorporated to further enhance and optimize the approach; the passenger flow assignment process adopts a relatively simple random allocation strategy for multi-path selection, and the consideration of the travel characteristics of elderly passengers is not yet sufficiently comprehensive. Regarding future work, we plan to conduct a more detailed analysis of the travel behavior of the elderly and optimize equity-related objectives from an age-friendly perspective. Moreover, given the high computational complexity of the TNDP model and its low-dimensional objective structure, this study employed NSGA-II as the solution method to ensure computational efficiency and algorithmic stability. However, emerging evolutionary algorithms such as NSGA-III, MORCGA-MOPSO-II, RCGA-PSO, and CBHPSO may potentially offer better solution performance. Therefore, future research will explore new path optimization strategies and compare NSGA-II with more advanced algorithms to evaluate whether they can further improve solution quality and computational efficiency.
Author Contributions
Methodology, Y.Y. and P.T.; Software, W.D.; Investigation, W.D. and J.L.; Data curation, W.D. and J.L.; Writing—original draft, W.D.; Writing—review & editing, Y.Y. and P.T.; Supervision, Y.Y. and P.T.; Project administration, Y.Y.; Funding acquisition, P.T. All authors have read and agreed to the published version of the manuscript.
Funding
This research was funded by [Scientific and Technological Key Projects in Henan Province] grant number [242102240023] and [Key Research Projects of Higher Education Institutions in Henan Province] grant number [24A580005].
Institutional Review Board Statement
Not applicable.
Informed Consent Statement
Not applicable.
Data Availability Statement
The raw data supporting the conclusions of this article will be made available by the authors on request.
Conflicts of Interest
Author Junsheng Li was employed by the company Henan Urban Planning and Design Institute Co., Ltd. The remaining authors declare that the research was conducted in the absence of any commercial or financial relationships that could be construed as a potential conflict of interest.
References
- Macioszek, E.; Wierk, P.; Gran, A.; Sobota, A. Application of a Logit Model to Identify Sociodemographic Factors Influencing the Choice of Public Transport for Daily Trips—A Case Study Based on the Example of the Górnośląska-Zagłębiowska Metropolis (Poland). Transp. Probl. Int. Sci. J. 2024, 19, 183–192. [Google Scholar] [CrossRef]
- Olfindo, R. Transport Accessibility, Residential Satisfaction, and Moving Intention in a Context of Limited Travel Mode Choice. Transp. Res. Part A Policy Pract. 2021, 145, 153–166. [Google Scholar] [CrossRef]
- Tyndall, J. Bus Quality Improvements and Local Commuter Mode Share. Transp. Res. Part A Policy Pract. 2018, 113, 173–183. [Google Scholar] [CrossRef]
- Mahmoudi, R.; Saidi, S.; Wirasinghe, S.C. A Critical Review of Analytical Approaches in Public Bus Transit Network Design and Operations Planning with Focus on Emerging Technologies and Sustainability. J. Public Transp. 2024, 26, 100100. [Google Scholar] [CrossRef]
- Guihaire, V.; Hao, J.-K. Transit Network Design and Scheduling: A Global Review. Transp. Res. Part A Policy Pract. 2008, 42, 1251–1273. [Google Scholar] [CrossRef]
- Kepaptsoglou, K.; Karlaftis, M. Transit Route Network Design Problem: Review. J. Transp. Eng. 2009, 135, 491–505. [Google Scholar] [CrossRef]
- Derrible, S.; Kennedy, C. Applications of Graph Theory and Network Science to Transit Network Design. Transp. Rev. 2011, 31, 495–519. [Google Scholar] [CrossRef]
- Ibarra-Rojas, O.J.; Delgado, F.; Giesen, R.; Muñoz, J.C. Planning, Operation, and Control of Bus Transport Systems: A Literature Review. Transp. Res. Part B Methodol. 2015, 77, 38–75. [Google Scholar] [CrossRef]
- Purvis, B.; Mao, Y.; Robinson, D. Three Pillars of Sustainability: In Search of Conceptual Origins. Sustain. Sci. 2019, 14, 681–695. [Google Scholar] [CrossRef]
- Iliopoulou, C.; Kepaptsoglou, K.; Vlahogianni, E. Metaheuristics for the Transit Route Network Design Problem: A Review and Comparative Analysis. Public Transp. 2019, 11, 487–521. [Google Scholar] [CrossRef]
- Mandl, C.E. Evaluation and Optimization of Urban Public Transportation Networks. Eur. J. Oper. Res. 1980, 5, 396–404. [Google Scholar] [CrossRef]
- Gkiotsalitis, K.; Cats, O. Public Transport Planning Adaption under the COVID-19 Pandemic Crisis: Literature Review of Research Needs and Directions. Transp. Rev. 2021, 41, 374–392. [Google Scholar] [CrossRef]
- Tong, P.; Yan, Y.; Wang, D.; Qu, X. Optimal Route Design of Electric Transit Networks Considering Travel Reliability. Comput. Aided Civ. Infrastruct. Eng. 2021, 36, 1229–1248. [Google Scholar] [CrossRef]
- Huo, X.; He, X.; Xiong, Z.; Wu, X. Multi-Objective Optimization for Scheduling Multi-Load Automated Guided Vehicles with Consideration of Energy Consumption. Transp. Res. Part C Emerg. Technol. 2024, 161, 104548. [Google Scholar] [CrossRef]
- Lu, X.; Wang, J.; Yuen, C.W.; Liu, Q. Multi-Objective Intercity Carpooling Route Optimization Considering Carbon Emission. Sustainability 2023, 15, 2261. [Google Scholar] [CrossRef]
- Akopov, A.S.; Beklaryan, L.A. Evolutionary Synthesis of High-Capacity Reconfigurable Multilayer Road Networks Using a Multiagent Hybrid Clustering-Assisted Genetic Algorithm. IEEE Access 2025, 13, 53448–53474. [Google Scholar] [CrossRef]
- Pternea, M.; Kepaptsoglou, K.; Karlaftis, M.G. Sustainable Urban Transit Network Design. Transp. Res. Part A Policy Pract. 2015, 77, 276–291. [Google Scholar] [CrossRef]
- Häll, C.H.; Ceder, A.; Ekström, J.; Quttineh, N.-H. Adjustments of Public Transit Operations Planning Process for the Use of Electric Buses. J. Intell. Transp. Syst. 2019, 23, 216–230. [Google Scholar] [CrossRef]
- Iliopoulou, C.; Tassopoulos, I.; Kepaptsoglou, K.; Beligiannis, G. Electric Transit Route Network Design Problem: Model and Application. Transp. Res. Rec. J. Transp. Res. Board 2019, 2673, 264–274. [Google Scholar] [CrossRef]
- Liu, Y.; Feng, X.; Ding, C.; Hua, W.; Ruan, Z. Electric Transit Network Design by an Improved Artificial Fish-Swarm Algorithm. J. Transp. Eng. Part A Syst. 2020, 146, 04020071. [Google Scholar] [CrossRef]
- Iliopoulou, C.; Kepaptsoglou, K. Robust Electric Transit Route Network Design Problem (RE-TRNDP) with Delay Considerations: Model and Application. Transp. Res. Part C Emerg. Technol. 2021, 129, 103255. [Google Scholar] [CrossRef]
- Pylarinou, C.; Iliopoulou, C.; Kepaptsoglou, K. Transit Route Network Redesign under Electrification: Model and Application. Int. J. Transp. Sci. Technol. 2021, 10, 366–379. [Google Scholar] [CrossRef]
- Perumal, S.S.G.; Lusby, R.M.; Larsen, J. Electric Bus Planning & Scheduling: A Review of Related Problems and Methodologies. Eur. J. Oper. Res. 2022, 301, 395–413. [Google Scholar] [CrossRef]
- Liu, Y. Study on Optimization of Bus Scheduling. Front. Comput. Intell. Syst. 2022, 1, 76–78. [Google Scholar] [CrossRef]
- Momenitabar, M.; Dehdari Ebrahimi, Z.; Mattson, J.; Hough, J. Designing an Electric Transit Route Network Utilizing Energy Storage Technology to Mitigate Annual Demand Charge. Transp. Res. Rec. J. Transp. Res. Board 2023, 2677, 158–174. [Google Scholar] [CrossRef]
- Li, X.; Li, Y.; Liu, W.; Yuan, Y. Optimal Design of Pure Battery Electric Bus System on the Grid Network. Transp. A Transp. Sci. 2024, 20, 2152298. [Google Scholar] [CrossRef]
- Aksoy, İ.C.; Alver, Y. Addressing Electric Transit Network Design Frequency Setting Problem with Dynamic Transit Assignment. Transp. B Transp. Dyn. 2024, 12, 2318566. [Google Scholar] [CrossRef]
- Ben-Elia, E.; Benenson, I. A Spatially-Explicit Method for Analyzing the Equity of Transit Commuters’ Accessibility. Transp. Res. Part A Policy Pract. 2019, 120, 31–42. [Google Scholar] [CrossRef]
- Feng, T.; Zhang, J. Multicriteria Evaluation on Accessibility-based Transportation Equity in Road Network Design Problem. J. Adv. Transp. 2014, 48, 526–541. [Google Scholar] [CrossRef]
- Li, X.; Zhang, Y.; Du, M. Analysis of Travel Decision-Making for Urban Elderly Healthcare Activities under Temporal and Spatial Constraints. Sustainability 2018, 10, 1560. [Google Scholar] [CrossRef]
- Behbahani, H.; Nazari, S.; Jafari Kang, M.; Litman, T. A Conceptual Framework to Formulate Transportation Network Design Problem Considering Social Equity Criteria. Transp. Res. Part A Policy Pract. 2019, 125, 171–183. [Google Scholar] [CrossRef]
- Delbosc, A.; Currie, G. Using Lorenz Curves to Assess Public Transport Equity. J. Transp. Geogr. 2011, 19, 1252–1259. [Google Scholar] [CrossRef]
- Jang, S.; An, Y.; Yi, C.; Lee, S. Assessing the Spatial Equity of Seoul’s Public Transportation Using the Gini Coefficient Based on Its Accessibility. Int. J. Urban Sci. 2017, 21, 91–107. [Google Scholar] [CrossRef]
- Chen, X.; Wang, Y.; Ma, X. Integrated Optimization for Commuting Customized Bus Stop Planning, Routing Design, and Timetable Development With Passenger Spatial-Temporal Accessibility. IEEE Trans. Intell. Transport. Syst. 2021, 22, 2060–2075. [Google Scholar] [CrossRef]
- Berke, A.; Truitt, W.; Larson, K. Is Access to Public Bike-Share Networks Equitable? A Multiyear Spatial Analysis across 5 U.S. Cities. J. Transp. Geogr. 2024, 114, 103759. [Google Scholar] [CrossRef]
- Carleton, P.R.; Porter, J.D. A Comparative Analysis of the Challenges in Measuring Transit Equity: Definitions, Interpretations, and Limitations. J. Transp. Geogr. 2018, 72, 64–75. [Google Scholar] [CrossRef]
- Ma, S.-H.; Chen, X.-F.; Wu, Y.-J.; Shao, H.; Zhang, J.-J. Equity Analysis of Transportation Networks in Urban Agglomerations Based on Accessibility. J. Transp. Syst. Eng. Inf. Technol. 2022, 22, 51–59. [Google Scholar] [CrossRef]
- He, Y.; Liu, Z.; Song, Z. Optimal Charging Scheduling and Management for a Fast-Charging Battery Electric Bus System. Transp. Res. Part E Logist. Transp. Rev. 2020, 142, 102056. [Google Scholar] [CrossRef]
- Mitra, S.; Yao, M.; Ritchie, S.G. Gender Differences in Elderly Mobility in the United States. Transp. Res. Part A Policy Pract. 2021, 154, 203–226. [Google Scholar] [CrossRef]
- Villena-Sanchez, J.; Boschmann, E.E.; Avila-Forcada, S. Daily Travel Behaviors and Transport Mode Choice of Older Adults in Mexico City. J. Transp. Geogr. 2022, 104, 103445. [Google Scholar] [CrossRef]
- Ravensbergen, L.; Varickanickal, J.; Newbold, K.B.; Mohamed, M. A Mixed-Methods Investigation of Older Adults’ Public Transit Use and Travel Satisfaction. Travel Behav. Soc. 2023, 32, 100577. [Google Scholar] [CrossRef]
- El-Geneidy, A.; Levinson, D.; Diab, E.; Boisjoly, G.; Verbich, D.; Loong, C. The Cost of Equity: Assessing Transit Accessibility and Social Disparity Using Total Travel Cost. Transp. Res. Part A Policy Pract. 2016, 91, 302–316. [Google Scholar] [CrossRef]
- Lyons, T.; Choi, D. Transit Economic Equity Index: Developing a Comprehensive Measure of Transit Service Equity. Transp. Res. Rec. J. Transp. Res. Board 2021, 2675, 288–300. [Google Scholar] [CrossRef]
- Raza, A.; Zhong, M.; Akuh, R.; Safdar, M. Public Transport Equity with the Concept of Time-Dependent Accessibility Using Geostatistics Methods, Lorenz Curves, and Gini Coefficients. Case Stud. Transp. Policy 2023, 11, 100956. [Google Scholar] [CrossRef]
- Camporeale, R.; Caggiani, L.; Fonzone, A.; Ottomanelli, M. Quantifying the Impacts of Horizontal and Vertical Equity in Transit Route Planning. Transp. Plan. Technol. 2017, 40, 28–44. [Google Scholar] [CrossRef]
- Fan, W.; Machemehl, R.B. Optimal Transit Route Network Design Problem with Variable Transit Demand: Genetic Algorithm Approach. J. Transp. Eng. 2006, 132, 40–51. [Google Scholar] [CrossRef]
- Ferguson, E.M.; Duthie, J.; Unnikrishnan, A.; Waller, S.T. Incorporating Equity into the Transit Frequency-Setting Problem. Transp. Res. Part A Policy Pract. 2012, 46, 190–199. [Google Scholar] [CrossRef]
- Camporeale, R.; Caggiani, L.; Ottomanelli, M. Modeling Horizontal and Vertical Equity in the Public Transport Design Problem: A Case Study. Transp. Res. Part A Policy Pract. 2019, 125, 184–206. [Google Scholar] [CrossRef]
- Kim, M.; Kho, S.-Y.; Kim, D.-K. A Transit Route Network Design Problem Considering Equity. Sustainability 2019, 11, 3527. [Google Scholar] [CrossRef]
- Park, S.J.; Kang, S.; Byon, Y.-J.; Kho, S.-Y. Multiobjective Approach to the Transit Network Design Problem with Variable Demand Considering Transit Equity. J. Adv. Transp. 2022, 2022, 5887985. [Google Scholar] [CrossRef]
- Jiang, Y. Reliability-Based Equitable Transit Frequency Design. Transp. A Transp. Sci. 2022, 18, 879–909. [Google Scholar] [CrossRef]
- Zhang, W.; Zhao, H.; Song, Z. Integrating Transit Route Network Design and Fast Charging Station Planning for Battery Electric Buses. IEEE Access 2021, 9, 51604–51617. [Google Scholar] [CrossRef]
- Ahern, Z.; Paz, A.; Corry, P. Approximate Multi-Objective Optimization for Integrated Bus Route Design and Service Frequency Setting. Transp. Res. Part B Methodol. 2022, 155, 1–25. [Google Scholar] [CrossRef]
- Nikolić, M.; Teodorović, D. Mitigation of Disruptions in Public Transit by Bee Colony Optimization. Transp. Plan. Technol. 2019, 42, 573–586. [Google Scholar] [CrossRef]
- Kechagiopoulos, P.N.; Beligiannis, G.N. Solving the Urban Transit Routing Problem Using a Particle Swarm Optimization Based Algorithm. Appl. Soft Comput. 2014, 21, 654–676. [Google Scholar] [CrossRef]
- Nayeem, M.A.; Rahman, M.K.; Rahman, M.S. Transit Network Design by Genetic Algorithm with Elitism. Transp. Res. Part C Emerg. Technol. 2014, 46, 30–45. [Google Scholar] [CrossRef]
- Mahdavi Moghaddam, S.M.H.; Rao, K.R.; Tiwari, G.; Biyani, P. Simultaneous Bus Transit Route Network and Frequency Setting Search Algorithm. J. Transp. Eng. Part A Syst. 2019, 145, 04019011. [Google Scholar] [CrossRef]
- Vermeir, E.; Engelen, W.; Philips, J.; Vansteenwegen, P. An Exact Solution Approach for the Bus Line Planning Problem with Integrated Passenger Routing. J. Adv. Transp. 2021, 2021, 6684795. [Google Scholar] [CrossRef]
- Arbex, R.O.; Da Cunha, C.B. Efficient Transit Network Design and Frequencies Setting Multi-Objective Optimization by Alternating Objective Genetic Algorithm. Transp. Res. Part. B Methodol. 2015, 81, 355–376. [Google Scholar] [CrossRef]
- Asadi Bagloee, S.; Ceder, A. Transit-Network Design Methodology for Actual-Size Road Networks. Transp. Res. Part B Methodol. 2011, 45, 1787–1804. [Google Scholar] [CrossRef]
Disclaimer/Publisher’s Note: The statements, opinions and data contained in all publications are solely those of the individual author(s) and contributor(s) and not of MDPI and/or the editor(s). MDPI and/or the editor(s) disclaim responsibility for any injury to people or property resulting from any ideas, methods, instructions or products referred to in the content. |
© 2025 by the authors. Licensee MDPI, Basel, Switzerland. This article is an open access article distributed under the terms and conditions of the Creative Commons Attribution (CC BY) license (https://creativecommons.org/licenses/by/4.0/).