Abstract
This study addresses the operational and environmental pressures of last-mile delivery in dense cities under limited urban logistics hubs. We propose a resource-efficient framework that repurposes existing convenience stores as robotic delivery hubs and formalize its operation via a two-stage optimization coupling truck and robot routing. In controlled simulations, and in a Seoul street network scenario, the approach reduces total completion time relative to a truck-only benchmark and lowers truck activity (truck-kilometers and curb idling), leading to lower estimated CO2e under standard emission factors. We also observe a nonlinear relationship between the number of hubs and efficiency, suggesting a coverage “sweet spot”. These results indicate that with minimal new infrastructure, reusing commercial assets can improve operational performance and environmental proxies; social and labor outcomes are not measured here and are left for future field evaluation.
1. Introduction
A preliminary version of this work appeared as a conference abstract [1], and this article provides a substantially extended formulation and evaluation. The growth of online markets and the widespread adoption of mobile shopping have rapidly shifted consumption patterns from offline to online. The COVID-19 pandemic further accelerated this transformation; according to the Ministry of Trade, Industry, and Energy of the Republic of Korea (MOTIE, 2025), online channels accounted for 50.6% of sales among major retail distributors in 2024 [2]. This reorientation toward online commerce has naturally led to an explosive rise in demand for last-mile delivery and concentrated investment in that segment of the logistics industry. Because this shift entails environmental and social burdens for logistics systems, responses are required that address not only operational efficiency but also sustainability considerations.
Despite the surge in delivery demand, securing logistics facilities within urban cores remains highly challenging. High real-estate prices and issues of community acceptance, including NIMBY (Not In My Back Yard) reactions, have resulted in logistics hubs being built primarily on the urban periphery rather than in city centers. Consequently, the physical distance between delivery destinations and terminals has increased, reducing delivery efficiency and generating negative externalities that undermine environmental and social sustainability—such as urban traffic congestion, longer truck operating times with associated carbon emissions, and intensified workloads for delivery workers.
As an alternative, many countries have introduced robotic delivery; however, effective operation in dense urban areas requires urban hubs capable of robot charging, maintenance, and temporary storage. Due to the scarcity of such facilities, current practice remains limited to interim measures, such as mobile robot stations or vehicle-mounted robots. For viable urban operations, there is a need for hub alternatives that can enhance accessibility within the neighborhoods where demand actually arises while minimizing the addition of large new facilities.
Accordingly, this study proposes a logistics model that leverages convenience stores—characterized by 24/7 operation and dense spatial coverage—as robotic delivery hubs (robotic hubs). By repurposing existing urban commercial infrastructure, the model aims to minimize new facility inputs, shorten intra-city travel distances, reduce unnecessary stops, and contribute to the mitigation of carbon emissions and traffic congestion. We mathematically model a hybrid truck–robot delivery system, derive optimal delivery routes, and validate the proposed approach through computational experiments and a real-world case application. From a sustainability perspective, this study offers a practical alternative that enhances urban logistics efficiency by utilizing existing infrastructure.
The remainder of the paper is organized as follows. Section 2 reviews prior research on last-mile delivery, robotic delivery systems, and urban logistics hubs, and clarifies the scholarly distinctiveness of this study. Section 3 defines the proposed truck–robot collaborative delivery problem and presents a two-stage sequential optimization model. Section 4 reports numerical experiments that assess time efficiency under controlled factor variations, apply the framework to a Seoul street network scenario, and quantify environmental proxies (truck-kilometers, curb idling, and CO2e). Finally, Section 5 summarizes the findings, discusses implications and limitations, and outlines directions for future research.
2. Related Work
The last-mile segment accounts for a substantial share of total logistics/supply chain costs—approximately 40–50%—and is operationally challenging due to demand volatility and urban constraints [3,4]. Research on this topic has evolved around the vehicle routing problem (VRP) and its variants. The Clarke–Wright savings heuristic and foundational VRP formulations and heuristics provided the groundwork [5,6,7], while algorithms and benchmarks for the VRP with time windows (VRPTW)—for example, the Solomon instances—helped standardize the field [8,9,10]. In parallel, the dynamic VRP (DVRP) has been examined to handle real-time orders and traffic uncertainty by structuring the temporal evolution of information and decision epochs [11]. Although this routing tradition is central, in city logistics contexts—where multiple stakeholders, regulations, and environmental externalities intersect—route-centric optimization alone faces inherent limitations [12].
As a technical alternative to alleviate bottlenecks, drone-based collaborative models have been actively studied. Truck-and-drone formulations (TSP-D/VRP-D) leverage the complementary strengths of short drone range and broader truck coverage, demonstrating potential efficiency gains in theoretical and computational studies [13,14,15,16]. However, in high-density urban areas, commercialization is constrained by safety, noise, and airspace regulation; consequently, ground autonomous delivery robots (ADRs) that use pedestrian and bicycle infrastructure are emerging as a more practical alternative.
Given the lower regulatory risk relative to drones, ADRs have been combined with trucks in truck-and-robot (T&R) models. In mixed operations—where a truck carries and deploys robots, serving some customers directly by truck while others are served by robots—studies report reductions in travel distance, vehicle dwell time, and fleet size [17,18]. Approaches that employ robot depots/stations or optimize truck routes and robot schedules via decomposition–coordination show potential to reduce urban congestion and curbside occupancy and to enhance operational resilience. Nonetheless, the design of fixed hub infrastructure that reliably supports robot charging, maintenance, and storage remains comparatively nascent.
To address hub scarcity, a range of urban logistics strategies have been examined, including urban consolidation centers (UCCs), micro-fulfillment centers (MFCs), and PUDO/parcel lockers. Parcel lockers and PUDO have been shown—through empirical and simulation studies—to reduce failed deliveries and travel distances, thereby improving environmental outcomes [19]. Evidence on UCCs suggests that consolidation and improved load factors can reduce urban vehicle movements and emissions and facilitate the use of low-emission vehicles, although financial viability and stakeholder coordination are frequently cited as determinants of success [20,21]. In addition, within omnichannel strategies, using brick-and-mortar stores as online fulfillment sites demonstrates the repurposing potential of existing commercial infrastructure while improving accessibility and service levels [22]. A recent survey synthesizes these last-mile concepts from an operations research perspective and underscores the need to link them with urban performance metrics such as congestion, emissions, and accessibility [23].
Building on state-of-the-art hybrid last-mile models, recent works extend truck–robot coordination to multi-vehicle and multi-hub settings over realistic urban networks and policy constraints using decomposition- and matheuristic-based methods [24,25], while empirical and simulation studies of micro-hubs and parcel locker systems quantify traffic and emission impacts across alternative infrastructures and business models [26,27]; complementary reviews consolidate sustainability metrics for consistent evaluation [28] and synthesize challenges and methods for collaborative truck–robot deliveries [29], providing the immediate backdrop for our convenience store repurposing approach.
A synthesis of prior work indicates three streams that have largely progressed in parallel: (1) optimization of last-mile delivery, (2) delivery models leveraging robotic technologies, and (3) strategies for urban logistics hubs. Yet integrative research that unifies these strands remains scarce. In particular, few studies designate the citywide convenience store network—part of the existing commercial infrastructure—as a formal hub for robotic delivery and, on that basis, mathematically model and optimize the operations of an integrated truck–robot delivery system. To address this gap, the present study develops a mathematical model that couples the repurposing of a citywide convenience store network into a distributed robotic-hub system with hybrid truck–robot operations and assesses both operational efficiency and urban outcomes.
3. Mathematical Model
The mathematical model proposed in this study can be illustrated as in Figure 1 and is built on the following assumptions:
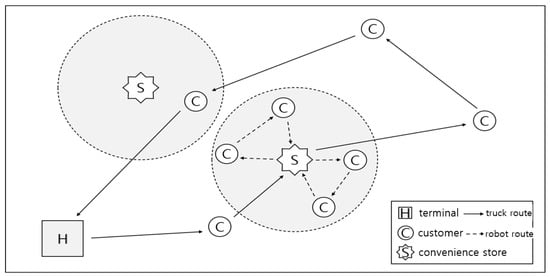
Figure 1.
Hybrid truck–robot delivery routes leveraging convenience stores as robotic hubs.
- The logistics terminal (depot) is located at a single site and serves as both the origin and destination of the truck.
- A single operating truck is considered, and its capacity is not binding (uncapacitated).
- Robots are homogeneous, and each robot has a given payload capacity.
- Each robot departs from its assigned convenience store hub, serves its customer(s), and must return to the same hub. A single round trip must not exceed the predefined maximum service radius ( km; depicted as the dashed circle in Figure 1), and the total operating time per robot must not exceed hours.
- The travel speeds of the truck and robots are constant; exogenous factors such as traffic congestion are not considered.
- Each customer is served exactly once by either a truck or a robot. To reduce the delivery time, the customer located at the top left of Figure 1 is assigned direct truck delivery rather than robot delivery via a convenience store hub.
- The model does not endogenize battery endurance, charging or turnover time at hubs, payload limits, or loading and unloading times. Instead, these are absorbed into technology-agnostic parameters: service radius and maximum operating time, hub and customer dwell times, and, optionally, a robot capacity parameter with customer demand. This preserves tractability while allowing straightforward calibration to different robot platforms and operating policies.
Our modeling choices—constant travel speeds, a single uncapacitated truck, and homogeneous robots—are deliberate abstractions made to isolate the structural effect of repurposing convenience stores as robotic hubs. In dense urban settings, fully capturing congestion, time-dependent travel times, and fleet heterogeneity quickly renders the joint truck–robot routing problem computationally intractable at the scale we study. We therefore focus the optimization on the infrastructure-reuse mechanism and then evaluate environmental implications via ex post proxies (truck-kilometers, curb idling, and robot energy) in Section 4.3, while explicitly delineating real-world limitations and extensions in Section 5.
The objective of this study is to minimize the total delivery time of the truck and robots by using convenience stores as robotic hubs. To address the problem, we adopt a two-stage sequential optimization approach:
- Stage 1 (truck routing). Among all truck-direct customers, determine (i) the subset of convenience store hubs to activate for robot delivery and (ii) the optimal truck tour that visits the selected hubs and all truck-direct customers, so as to minimize total truck travel time.
- Stage 2 (robot delivery). For each convenience store hub selected in Stage 1, determine robot routes that serve the assigned robot-eligible customers, minimizing total robot travel time subject to capacity, radius , and time constraints.
Robot-eligible customers are restricted from truck service; therefore, the Stage 2 objective (robot distance/time) depends on which hubs are activated, not on the order in which the truck visits those hubs. Stage 1 jointly selects the set of hubs to activate and the truck’s direct-serve customers; Stage 2 then optimizes robot tours conditional on the activated hubs. This two-stage structure isolates the infrastructure effect of hub repurposing while keeping the formulation tractable.
3.1. Stage 1: Truck Routing Model
In Stage 1, we build a truck routing model over a set of locations, where the truck starts and ends at a central depot. Convenience stores act as hubs for last-mile robots, and customers within a specified radius of each hub are eligible for robot delivery. Table 1 summarizes the notation used in Stage 1.

Table 1.
Notations for Stage 1.
Objective Function
Constraints
Equation (1) is the objective function, which minimizes the total travel time of the truck from its departure at the logistics depot to its return after completing deliveries. Equations (2) through (8) represent the constraints. Equation (2) ensures that the truck must depart from and return to the logistics depot. Equation (3) is a flow conservation constraint, ensuring that if the truck enters a node, it must also exit that node. Equation (4) restricts the truck from visiting customers who are covered by the robot delivery radius ( km) of a visited convenience store. Equation (5) mandates that customers who cannot be served by robot delivery must be visited directly by the truck. Equation (6) enforces that if there exists at least one customer within radius (km) of a convenience store hub, the truck must visit either that hub or one of those customers along a route that minimizes the objective. Equation (7) prohibits the truck from subsequently visiting the corresponding hub if it has already visited a customer located within that hub’s radius (km). Finally, Equation (8) is the Miller–Tucker–Zemlin [30] subtour elimination constraint.
3.2. Stage 2: Robot Delivery Routing Model
As determined by the Stage 1 model developed in Section 3.1, the truck route that minimizes transportation time is selected, thereby endogenously identifying (activating) the convenience store hubs to be visited. In this stage (Stage 2), we formulate a mathematical model to determine the optimal robot delivery routes originating from the selected hubs, with the objective of minimizing total robot delivery time. Table 2 summarizes the parameter settings and scenario inputs used in Stage 2.
Table 2.
Notations for Stage 2.
Objective Function
Constraints
Equation (9) is the objective function that minimizes the total robot delivery time over the set of convenience store hubs visited by the truck in Stage 1 and all customers within each hub’s service radius. Equation (10) imposes unit in- and out-degree on every customer node: exactly one arc enters and exactly one arc leaves each customer, with predecessors and successors taken from . Equation (11) enforces flow balance at each hub: for any convenience store hub , the number of robot departures from equals the number of robot returns to . In other words, whenever a robot leaves a hub, it must eventually return to the same hub. Equation (12) provides time coupling and subtour elimination via a modified Miller–Tucker–Zemlin (MTZ) formulation. It prevents closed subtours among customer nodes and ensures that the cumulative time along any tour does not exceed the maximum allowed. Specifically, if the robot traverses arc , the cumulative arrival time at node must be at least the cumulative time at node plus the travel time from to . Equation (13) anchors each route to its hub in time. It requires that the cumulative time upon first visiting customer be no smaller than the direct travel time from the hub to , and simultaneously ensures there is enough remaining time to return from to the hub within the robot’s maximum tour time .
4. Numerical Experiments
This section reports numerical experiments that validate the two-stage optimization model in Section 3. The model is implemented in Python 3.12 and, for the problem sizes considered herein, solves in roughly 2–3 s on standard hardware; thus, computational performance is not a bottleneck in our setting. Section 4.1 conducts controlled experiments to evaluate and analyze the framework’s time efficiency across systematic factor variations, while Section 4.2 presents a Seoul-inspired street network simulation. Beyond time efficiency, we also report environmental proxies in Section 4.3—truck-kilometers, curb idling, and total CO2e—computed ex post from the optimized routes using customer/hub dwell times and the emission factors specified therein. For comparative clarity, we use a truck-only system as the canonical single-mode baseline representing the status quo.
4.1. Time Efficiency Analysis
We compare the time efficiency of the proposed convenience-store-based truck–robot framework against a truck-only benchmark. Truck and robot cruise speeds are fixed at 20 km/h and 5 km/h, respectively. The experimental factors are (i) number of convenience store hubs, (ii) number of customers, and (iii) robot service radius. For each factor combination, we generate 500 independent instances. Customer locations are sampled i.i.d. from a 10 × 10 km rectangular region using a uniform distribution; node overlaps smaller than 5 m are resolved by a small random jitter (the random seed is fixed for reproducibility). This stylized, controlled setting is intended to isolate the structural effect of infrastructure reuse by minimizing confounding from demand geography and time-varying congestion. As a realism complement, Section 4.2 reports a Seoul case solved on the actual street network using the Google OR-Tools Routing Solver with time-based arc costs, and Section 4.3 adds ex post dwell times at customers and hubs to compute curb idling and total CO2e.
The total completion time (makespan) is defined as the maximum of the return times of the truck and all robots to their respective origins. Time efficiency is computed as follows:
Figure 2 visualizes a representative instance with four hubs, 30 customers, and a 4.5 km robot radius. In the truck-only solution (left), the truck executes a long contiguous tour with frequent curbside stops and detours to reach dispersed customers. In contrast, under the proposed solution (right), the truck visits only a small subset of hubs while robots serve nearby customers within each hub’s radius via short branch routes. This yields a more skeletal truck path and visibly reduces local zig-zag movements and curbside stops.
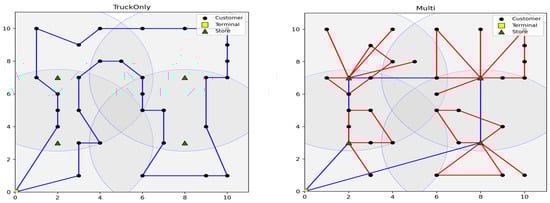
Figure 2.
Optimal routes for a representative instance (4 hubs, 30 customers, 4.5 km radius): (left) truck-only benchmark; (right) convenience-store-based truck–robot solution (truck route in blue; robot branches in red).
Table 3 reports the average time-efficiency over 500 replications for each configuration. The findings can be interpreted along three dimensions:
Table 3.
Percentage time-efficiency improvement of the truck–robot system versus truck-only.
- Effect of Robot Service Radius. The most salient pattern is that time-efficiency increases consistently with the robot’s maximum travel distance across all scenarios. For example, with four hubs and 30 customers, efficiency is only 8.4% at 1.5 km, but rises to 50.1% at 4.5 km. The distance-wise mean efficiency (the last row of the table) similarly jumps from 5.9% at 1.5 km to 35.0% at 4.5 km. This indicates that the robot’s technical capability (maximum tour distance) is a primary driver of system-level efficiency: as coverage expands, more customers become robot-eligible, reducing the number of customers the truck must visit directly. The truck therefore operates a leaner inter-hub route, while multiple robots dispatch in parallel from hubs, jointly producing substantial reductions in total completion time.
- Effect of Customer Count (Density). Holding the number of hubs and robot distance fixed, time-efficiency increases with the number of customers. For instance, with five hubs and a 3 km robot distance, efficiency rises from 16.6% (10 customers) to 34.8% (30 customers), more than a twofold increase. This shows that the proposed model is particularly effective in dense urban settings. As demand density grows, each hub handles more deliveries, creating economies of scale: a single truck stop can hand off a larger volume to robots, so the parallelism of robot deliveries dominates the truck’s marginal dwell and travel time.
- Effect of the Number of Hubs. Unlike the other factors, the number of hubs shows a clear nonlinearity: the hub-wise mean efficiencies are 18.9% (three hubs), 25.7% (four hubs), and 24.8% (five hubs). This indicates that “more hubs” is not always better. Adding hubs initially expands robot-eligible coverage and improves route flexibility, but beyond a coverage sweet spot, the truck’s extra hub visits and detours raise truck travel and dwell time enough to offset the marginal robot gains. The effect is more pronounced when robots can travel longer tours and when customer density is higher, underscoring that strategic hub selection, rather than mere proliferation, is critical for performance. To operationalize this finding, we evaluate the model over a shortlist of candidate convenience stores for s = 1, …, S and compute time efficiency E(s) relative to the truck-only baseline. We then choose the smallest s that reaches at least 95% of the best E(s), or stop when the marginal gain ΔE(s) = E(s) − E(s−1) falls below a preset threshold (e.g., 1–2 percentage points) while truck stop burden increases.
4.2. Seoul Street Network Scenario (Simulation)
This subsection presents a Seoul-inspired street network simulation, not a field deployment. The depot is set at a C-company terminal in Geumcheon-gu. From a point 200 m northeast of the terminal, we define a 2.8 km × 4 km rectangular service area and synthetically generate 100 customers uniformly at random; we run 10 replications. Two convenience store hubs are used: an E-company store in Daerim-dong and a C-company store in Sinsa-dong. The area mixes commercial and residential zones, offering diverse delivery demand; both stores lie near neighborhood centers and thus have high potential as hubs. Considering the real-world risks of theft, damage, and breakdown for long-range operations, the robot maximum tour distance is capped at 3 km (hub → customer(s) → hub), corresponding to a service radius of 1.5 km. Because routes are computed on the actual Seoul road network, exhaustive TSP enumeration is impractical. Accordingly, we obtain truck and robot routes using the Google OR-Tools Routing Solver with time-based arc costs on road segments, thereby reflecting network geometry and asymmetric travel times. No field deployment was conducted.
Figure 3 compares the truck-only optimal tour (left) and the truck–robot solution (right). Even with only two existing stores as hubs, customers within 1.5 km of a hub are absorbed by robots, while the truck is reallocated to inter-hub and residual customers. Consequently, inter-neighborhood truck segments shorten, curbside stops decrease, and local zig-zags are replaced by compact robot branches. On average, 48 out of 100 customers are served by robots, yielding an average time-efficiency of 34.0% relative to the truck-only baseline; the best observed improvement is 41.6%. This aligns with the simulation evidence in Section 4.1 and indicates that reusing existing commercial infrastructure alone can deliver meaningful time savings.
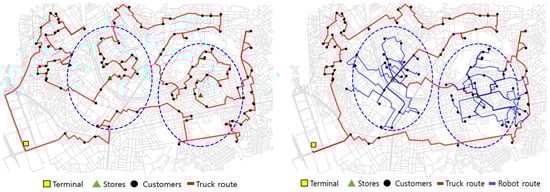
Figure 3.
Seoul-inspired street network scenario (simulation): truck-only optimal tour (left) and convenience-store-based truck–robot solution (right); robot service radius = 3 km (blue dotted circles), 100 synthetic customers, 2 real store coordinates.
4.3. Environmental Proxies
Beyond delivery time, we compare total greenhouse gas emissions between the truck-only benchmark and the proposed truck–robot system. Truck tailpipe CO2e combines movement and idling, and robot CO2e is modeled with a constant per-kilometer factor:
Here, is the distance on the same basis as Section 4.1 and Section 4.2; is the truck arc decision; is the robot arc decision associated with hub ; denotes the set of admissible robot arcs for hub (arcs among the robot-eligible customers assigned to ); and are truck dwell times at customer and hub (minutes); and are the truck motion and idling emission factors, respectively; and is the constant robot per-km emission factor. We set (urban delivery speed bin near 20 km/h), , min (customers), and (hubs). These parameter choices are grounded in summaries by the International Council on Clean Transportation (ICCT) of the EU Vehicle Energy Consumption Calculation Tool (VECTO), the diesel idling literature, and platform-based reasoning for small delivery robots.
Using these parameters, we estimate total CO2e emissions under both systems. The results are summarized in Table 4, which reports the CO2-equivalent (CO2e) reduction in the proposed truck–robot system relative to a truck-only baseline. The emission proxy includes truck movement and idling at customer and hub stops, and a small constant per-kilometer term for robot energy use. Across all configurations, the model yields a mean CO2e reduction of 19.4%. The magnitude of reduction grows with robot service radius and customer density, mirroring the time-efficiency patterns in Table 3. This pattern indicates that the primary drivers of emission reductions are fewer truck-kilometers and shorter curb idling times, rather than marginal differences in robot energy consumption.
Table 4.
Percentage CO2e reduction of the truck–robot system versus truck-only.
- Effect of Robot Service Radius. As the robot’s maximum travel distance expands from 1.5 km to 4.5 km, the average emission reduction rate rises sharply—from 3.2% to 28.5%. The results exhibit a nonlinear relationship: emission reductions increase rapidly as robot range expands up to around 3.75 km, but the improvement rate tapers off or slightly declines beyond that point, suggesting diminishing returns once most customers are already within robot coverage. This indicates that while extending robot range substantially improves environmental performance in the early stages, additional range offers limited benefits after a threshold is reached because incremental coverage gains become marginal and truck activity can no longer be reduced proportionally.
- Effect of Customer Count (Density). Holding the number of hubs constant, emission reduction increases monotonically with customer count. For example, with four hubs and a 3 km radius, reduction improves from 11.9% (10 customers) to 32.5% (30 customers). Denser demand intensifies the truck’s marginal burden under the baseline, while the hybrid system benefits from parallel robot service that amortizes the truck’s approach emissions over more deliveries per stop. Consequently, emission efficiency strengthens with urban density—implying that robot integration is particularly valuable in dense metropolitan cores.
- Effect of the Number of Hubs. The number of hubs exhibits a non-monotonic pattern: average reductions are 16.3% (three hubs), 21.8% (four hubs), and 20.0% (five hubs). While initial hub additions enlarge robot-eligible coverage, excessive hubs increase truck detours and dwelling time, offsetting the environmental benefit. This confirms the existence of an environmental “sweet spot” consistent with the time-efficiency analysis—beyond an optimal hub density, marginal gains in robot substitution are outweighed by additional truck activity.
Overall, Table 4 demonstrates that repurposing existing convenience store infrastructure can reduce CO2e emissions by roughly 15–30% under realistic urban conditions. The reduction stems from both electrified last-mile delivery and systemic routing synergy—shorter truck tours, fewer stops, and parallel robot dispatches. These findings highlight the potential of achieving measurable carbon mitigation through infrastructure reuse and operational optimization rather than large-scale fleet electrification.
While the present analysis emphasizes environmental proxies rather than explicit cost metrics, these results provide the quantitative basis for future cost–benefit evaluation discussed in Section 5.
5. Conclusions
This study proposes a truck–robot collaborative delivery framework that repurposes the dense urban network of convenience stores as robotic hubs. We formulate a two-stage optimization that separates truck routing and robot routing and evaluate it in controlled simulations and a Seoul street network simulation. Relative to a truck-only baseline, the approach reduces total completion time and lowers truck activity (truck-kilometers and curb idling), leading to lower estimated CO2e under the emission factors specified in Section 4.3. We also observe a nonlinear relation between the number of hubs and efficiency: adding hubs initially improves coverage and shifts more customers to robot service, but diminishing returns arise once additional truck detours and hub stops offset marginal robot gains, indicating a coverage “sweet spot.” These effects are more pronounced when robots have a longer maximum tour distance and when customer density is higher, underscoring that strategic hub selection, rather than indiscriminate expansion, is important for system performance. Future work will extend the framework to a joint location–routing formulation that endogenizes hub placement and activation, enabling planners to determine the number and placement of hubs under given demand geography and policy constraints.
Beyond robot technology per se, our results point to an urban infrastructure-repurposing perspective: performance depends not only on robotic capabilities but also on how existing commercial assets are integrated into the logistics network. Practically, this suggests a potential pathway for improving operational performance and environmental outcomes with limited new infrastructure by leveraging the pre-existing convenience store network. At the same time, our optimization model intentionally abstracts from time-varying congestion and fleet heterogeneity to preserve tractability and to foreground the hub-repurposing mechanism; environmental impacts are reported via post-optimized proxies (Section 4.3), not a full life-cycle assessment.
This study has several limitations. First, the sustainability evaluation relies on environmental proxies—truck-kilometers, curb idling time, and estimated truck and robot CO2e—rather than direct measurement of emissions, noise, costs, or labor outcomes; a comprehensive life-cycle and socio-economic assessment would provide a more complete view. Second, the optimization assumes a simplified, static environment (constant travel speeds, a single uncapacitated truck, and homogeneous robots). These assumptions improve tractability but limit applicability where congestion is time-dependent and fleets are heterogeneous; stochastic or robust extensions could capture such uncertainty. The robot module abstracts from explicit charging cycles, hub turnover logistics, and heterogeneity in item weight and volume; future work can internalize these features via time-expanded or queue-constrained hub models and optional capacity/turnover constraints calibrated to platform-specific data. Third, the model does not incorporate the economic and institutional dimensions of implementing convenience-store-based hubs (e.g., hub adaptation costs, space rental, maintenance, workforce management, governance, or contractual coordination with store operators); integrating such considerations into a comprehensive cost–benefit framework remains an important next step. Fourth, this study does not benchmark against alternative last-mile systems such as parcel lockers, UCCs, or truck–drone models, each of which entails distinct infrastructure and modeling assumptions; future research can align these baselines under unified demand and cost structures for fairer comparison. Finally, the two-stage sequential optimization cannot guarantee a global optimum because truck and robot decisions are solved separately. While the scheme captures the structural role of hub activation and offers computational tractability, it may be suboptimal when hub selection and robot-routing costs are tightly interdependent. Extending the model with Benders-style cuts or value-function terms so that Stage 1 internalizes Stage 2 costs is a useful direction. Scaling to city-scale instances with multiple trucks, clustered demand, heterogeneous parcels, and hub-specific robot fleets will also benefit from stronger subtour-elimination families (e.g., flow/cutset with branch and cut), decomposition, and matheuristics (e.g., LNS/ALNS with exact polishing).
In addition, future research should explicitly link the economic and environmental dimensions. On the economic side, assessing the financial feasibility and governance of convenience-store-based hubs would complement the current operational focus. On the environmental side, coupling congestion-dependent emission factors with the routing model could enable a unified optimization framework that minimizes both delivery time and CO2e.
Author Contributions
Conceptualization, J.-D.S.; methodology, J.-D.S.; validation, S.-M.K. and J.-D.S.; formal analysis, S.-M.K.; writing—original draft, S.-M.K.; writing—review and editing, J.-D.S.; visualization, S.-M.K.; supervision, J.-D.S. All authors have read and agreed to the published version of the manuscript.
Funding
This research received no funding.
Institutional Review Board Statement
Not applicable.
Informed Consent Statement
Not applicable.
Data Availability Statement
Data are contained within the article.
Conflicts of Interest
The authors declare no conflicts of interest.
References
- Kim, S.-M.; Son, J.-D. Last-Mile Robot Delivery Model: Establishing Convenience Stores as Robot Hubs. In Proceedings of the 19th International Conference on Innovative Computing, Information and Control (ICICIC 2025), Kitakyushu, Japan, 29 August 2025. [Google Scholar]
- MOTIE (Ministry of Trade, Industry and Energy). Annual Sales of Major Retailers Up 8.2% in 2024. 2025. Available online: https://www.motie.go.kr/attach/down/095a2dda9c864e1d90d751f7668a1117/3a51ff78d9c38d0a5073810b059cd6b4 (accessed on 5 November 2025).
- Capgemini Research Institute. The Last Mile Sprint: Reshaping the Consumer Experience to Win; Capgemini Research Institute: Navi Mumbai, India, 2019. [Google Scholar]
- McKinsey & Company. Parcel Delivery: The Future of Last Mile; McKinsey & Company: Brussels, Belgium, 2016. [Google Scholar]
- Clarke, G.; Wright, J.W. Scheduling of vehicles from a central depot to a number of delivery points. Oper. Res. 1964, 12, 568–581. [Google Scholar] [CrossRef]
- Toth, P.; Vigo, D. (Eds.) The Vehicle Routing Problem; SIAM: Philadelphia, PA, USA, 2002. [Google Scholar]
- Cordeau, J.-F.; Gendreau, M.; Laporte, G.; Potvin, J.-Y.; Semet, F. A guide to vehicle routing heuristics. J. Oper. Res. Soc. 2002, 53, 512–522. [Google Scholar] [CrossRef]
- Solomon, M.M. Algorithms for the vehicle routing and scheduling problems with time window constraints. Oper. Res. 1987, 35, 254–265. [Google Scholar] [CrossRef]
- Bräysy, O.; Gendreau, M. Vehicle routing problem with time windows, Part I: Route construction and local search algorithms. Transp. Sci. 2005, 39, 104–118. [Google Scholar] [CrossRef]
- Bräysy, O.; Gendreau, M. Vehicle routing problem with time windows, Part II: Metaheuristics. Transp. Sci. 2005, 39, 119–139. [Google Scholar] [CrossRef]
- Pillac, V.; Gendreau, M.; Guéret, C.; Medaglia, A.L. A review of dynamic vehicle routing problems. Eur. J. Oper. Res. 2013, 225, 1–11. [Google Scholar] [CrossRef]
- Savelsbergh, M.W.P.; Van Woensel, T. City logistics: Challenges and opportunities. Transp. Sci. 2016, 50, 579–590. [Google Scholar] [CrossRef]
- Murray, C.C.; Chu, A.G. The flying sidekick traveling salesman problem: Optimization of drone-assisted parcel delivery. Transp. Res. Part C 2015, 54, 86–109. [Google Scholar] [CrossRef]
- Agatz, N.; Bouman, P.; Schmidt, M. Optimization approaches for the traveling salesman problem with drone. Transp. Sci. 2018, 52, 965–981. [Google Scholar] [CrossRef]
- Wang, X.; Poikonen, S.; Golden, B. The vehicle routing problem with drones: Several worst-case results. Optim. Lett. 2017, 11, 679–697. [Google Scholar] [CrossRef]
- Carlsson, J.G.; Song, S. Coordinated logistics with a truck and a drone. Manag. Sci. 2018, 64, 4052–4069. [Google Scholar] [CrossRef]
- Heimfarth, A.; Ostermeier, M.; Hübner, A.H. A mixed truck and robot delivery approach for the daily supply of customers. Eur. J. Oper. Res. 2022, 303, 401–421. [Google Scholar] [CrossRef]
- Ostermeier, M.; Heimfarth, A.; Hübner, A.H. Cost-optimal truck-and-robot routing for last-mile delivery. Networks 2021, 79, 364–389. [Google Scholar] [CrossRef]
- Iwan, S.; Kijewska, K.; Lemke, J. Analysis of parcel lockers’ efficiency as the last mile delivery solution—The results of the research in Poland. Transp. Res. Procedia 2016, 12, 644–655. [Google Scholar] [CrossRef]
- Allen, J.; Browne, M.; Woodburn, A.; Leonardi, J. The role of urban consolidation centres in sustainable freight transport. Transp. Rev. 2012, 32, 473–490. [Google Scholar] [CrossRef]
- Allen, J.; Browne, M.; Woodburn, A.; Leonardi, J. A review of urban consolidation centres in the supply chain based on a case study approach. Supply Chain Forum Int. J. 2014, 15, 100–112. [Google Scholar] [CrossRef]
- Lim, S.F.; Jin, D.; Srai, J.S. An exploratory study of an omni-channel retail distribution network: A research agenda. Int. J. Phys. Distrib. Logist. Manag. 2018, 48, 754–775. [Google Scholar]
- Boysen, N.; Fedtke, S.; Schwerdfeger, S. Last-mile delivery concepts: A survey and classification of approaches from a rich vehicle routing perspective. Eur. J. Oper. Res. 2021, 294, 1–21. [Google Scholar]
- Ostermeier, M.; Heimfarth, A.; Hübner, A. The Multi-Vehicle Truck-and-Robot Routing Problem for Last-Mile Delivery. Eur. J. Oper. Res. 2023, 310, 680–697. [Google Scholar] [CrossRef]
- Alfandari, L.; Ljubić, I.; da Silva, M.D.M. A tailored Benders decomposition approach for last-mile delivery with autonomous robots. Eur. J. Oper. Res. 2022, 299, 510–525. [Google Scholar] [CrossRef]
- de Bok, M.; Giasoumi, S.; Tavasszy, L.; Thoen, S.; Nadi, A.; Streng, J. A simulation study of the impacts of micro-hub scenarios for city logistics in Rotterdam. Res. Transp. Bus. Manag. 2024, 56, 101186. [Google Scholar] [CrossRef]
- Ranjbari, A.; Diehl, C.; Dalla Chiara, G.; Goodchild, A. Do Parcel Lockers Reduce Delivery Times? Evidence from the Field. Transp. Res. Part E 2023, 172, 103070. [Google Scholar] [CrossRef]
- Boysen, N.; Fedtke, S.; Schwerdfeger, S. Last-mile delivery concepts: A survey from an operational research perspective. OR Spectr. 2021, 43, 1–58. [Google Scholar] [CrossRef]
- Yu, S.; Puchinger, J. Collaborative truck–robot deliveries: Challenges, models, and methods. In Annals of Operations Research; Springer: Berlin/Heidelberg, Germany, 2024. [Google Scholar]
- Miller, C.E.; Tucker, A.W.; Zemlin, R.A. Integer programming formulation of traveling salesman problems. J. ACM 1960, 7, 326–329. [Google Scholar] [CrossRef]
Disclaimer/Publisher’s Note: The statements, opinions and data contained in all publications are solely those of the individual author(s) and contributor(s) and not of MDPI and/or the editor(s). MDPI and/or the editor(s) disclaim responsibility for any injury to people or property resulting from any ideas, methods, instructions or products referred to in the content. |
© 2025 by the authors. Licensee MDPI, Basel, Switzerland. This article is an open access article distributed under the terms and conditions of the Creative Commons Attribution (CC BY) license (https://creativecommons.org/licenses/by/4.0/).