Abstract
Using panel data from 182 county-level cotton-growing regions in the Middle and Lower Reaches of the Yangtze River (2000–2022), this study investigates the drivers of cotton planting area contraction, focusing on the synergistic impacts of non-farm employment, agricultural policies, and their synergies, while verifying mechanisms via rural labor outflow and cotton economic returns. From a sustainability perspective, cotton planting area and output were relatively stable with fluctuations in 2000–2010, but plummeted by 80.6% and 82.8%, respectively, by 2022 (a “cliff-like” decline). Empirical results from the Spatial Durbin Model (SDM) show: (1) Non-farm employment significantly reduces local cotton cultivation and exhibits spatial spillover effects—counties neighboring or economically similar to regions with higher non-farm employment experience greater pressure for contraction; (2) This contraction is more pronounced in counties with smaller rural populations and lower cotton returns, confirming that labor scarcity and low profitability are key channels; (3) Agricultural policies exacerbate the decline: the 2005 Reward Policy for Major Grain-Producing Counties triggers cotton-to-grain substitution, while the 2014 shift from cotton temporary stockpiling to target price subsidies further accelerated the contraction of cotton cultivation in inland regions. This study contributes to understanding agricultural system transitions in the Yangtze River Basin, offering insights for optimizing sustainable planting structure adjustment and balancing food security with cash crop development under rural economic transformation.
1. Introduction
The Middle and Lower Reaches of the Yangtze River, as China’s traditional cotton production heartland [1] and a representative case of global agricultural core area transformation, has witnessed a remarkable contraction in cultivation scale over the past three decades [2]. This trend also observed in other historical cash crop hubs worldwide, such as the Mississippi Delta (U.S.) for cotton [3] and the Ganges Basin (India) [4] for jute. According to data from China’s National Bureau of Statistics, the cotton planting area in this region plummeted from 1.163 million hectares to 238,000 hectares between 2000 and 2022, marking a dramatic 79.5% decline that significantly exceeded China’s national average. This “core area decline” phenomenon raises critical questions for global agricultural sustainability: How do traditional high-value crop regions adapt to labor loss and policy shifts? And what lessons can be drawn for balancing regional crop uniqueness with global supply chain stability? The basin’s unique climatic conditions support high-quality cotton production [5], and its geographical proximity to downstream textile industrial clusters in the Yangtze River Delta reduces raw material transportation costs [6], enhancing the competitiveness of global textile value chains. These advantages cannot be fully replicated by other major cotton-producing regions: arid northern China relies on irrigation [7], while major global producers like India [8] and Pakistan [9] face challenges of erratic monsoons and pest infestations that disrupt supply stability. This “small but critical” role underscores its lingering irreplaceability in safeguarding the stability and efficiency of China’s cotton industry chain. Such a scenario, where a traditional core production area experiences steep cultivation decline yet retains unique supply value, makes its production pattern transformation particularly relevant to national-scale cotton security. This precipitous shrinkage has prompted in-depth academic inquiry into the driving mechanisms behind the transformation of regional agricultural production patterns.
Existing research primarily explains this phenomenon through two dimensions: On one hand, rapid urbanization has led to sustained rural labor outflow [10]. This mirrors labor migration patterns in other developing economies: just as rural workers in Southeast Asia (e.g., Vietnam, Thailand) migrate to urban industrial hubs for higher wages [11], the Middle and Lower Reaches of the Yangtze River, adjacent to the Yangtze River Delta (a core global manufacturing cluster), has seen accelerated rural labor transfer. Urban sectors in the Delta, such as manufacturing, logistics, and services, offer significantly higher salaries and more stable employment conditions [12], creating a “pull effect” that is consistent with global rural–urban migration dynamics. The outflow of rural labor has been further intensified by the rise in agricultural production costs. Together, these factors have substantially undermined the comparative advantage of labor-intensive cotton cultivation [13]. Unlike food crops, such as wheat and rice, which have benefited from widespread mechanization and thus reduced their reliance on labor [14], cotton planting in this region still depends heavily on the manual work: sowing requires precise spacing, weeding demands frequent care, and picking cannot be fully replaced by machinery [15]. This makes cotton cultivation extremely vulnerable to labor shortages. This trend is consistent with Lewis’ Dual Sector Model, a classical framework that explains how rural surplus labor shifts to non-agricultural sectors as urban industrialization progresses [16]. On the other hand, food security-oriented policy adjustments altered farmers’ planting preferences [17]. Implemented nationally in 2005 the Reward Policy for Major Grain-Producing Counties provides multi-faceted support to counties that meet grain production targets: this support includes direct fiscal rewards, investments in farmland water conservancy facilities, and preferential agricultural loan policies. These measures have directly boosted the economic returns of grain cultivation. Meanwhile, reforms to the cotton subsidy system, specifically the 2014 shift from the temporary cotton stockpiling policy to the target price subsidy policy, has yielded differential impacts on cotton farmers in the Middle and Lower Reaches of the Yangtze River. Unlike cotton production in Xinjiang, which features large-scale, mechanized operations organized by cooperatives [18], cotton planting in the study area is dominated by small-scale, fragmented farming. For these smallholder farmers, the high costs of accessing subsidy information, cumbersome verification procedures, and delays in subsidy disbursement reduce the real benefits they receive from the policy. In some cases, farmers even abandon subsidy applications due to excessively high time and labor costs [19], which further weakens their willingness to grow cotton. China’s reward policy for major grain-producing counties (implemented in 2005) and cotton subsidy reforms echo policy trade-offs faced by other countries: for instance, the European Union’s Common Agricultural Policy (CAP) prioritizes cereal production to ensure food self-sufficiency [20], while India’s Minimum Support Price (MSP) system has shifted cropping patterns away from cash crops like cotton toward rice and wheat [21]. These policy-driven crop substitutions raise global questions about balancing food security with the sustainability of cash crop sectors, which are critical for rural livelihoods in many developing regions [22].
Against these research gaps, this study contributes three key innovations. First, data-wise, it uses 23-year 2000–2022 panel data from 182 county-level cotton-growing units in the study area, capturing spatial heterogeneity in cotton acreage changes without overlooking local differences due to aggregated data. Second, methodologically, it adopts a Spatial Durbin Model SDM to examine the spatial spillover effects of non-farm employment and employs Bartik instrumental variables to address potential endogeneity issues, enhancing the robustness of empirical results. Third, for mechanism analysis, it moves beyond existing single-factor analysis of either non-farm employment or agricultural policies to quantify the “synergistic amplification effect” between the two; their interaction accelerates the withdrawal of production factors from cotton cultivation, forming a “dual squeeze” mechanism that provides a more comprehensive explanation for the post-2011 “cliff-like” decline in cotton acreage. Beyond China, these findings offer insights for other regions facing similar challenges: for example, how to mitigate labor loss in labor-intensive cash crops (e.g., cotton in West Africa, sugarcane in Latin America) and how to design policies that balance food security with cash crop sector resilience.
The paper is structured as follows: Section 2 systematically examines the spatiotemporal evolution characteristics of cotton cultivation and relevant policy backgrounds; Section 3 details data sources and research methodologies; Section 4 presents baseline regression results and robustness tests; Section 5 focuses on Heterogeneity, Mechanisms, and Spatial Effect, including the analysis of temporal dynamics, regional heterogeneity, transmission mechanisms (via rural labor outflow and cotton economic returns), and spatial spillover effects based on the Spatial Durbin Model; Section 6 summarizes research findings and proposes policy recommendations.
2. Factual Statement of the Sample
From 2000 to 2022, the changing trends of cotton planting area and output in the Middle and Lower Reaches of the Yangtze River were largely consistent. Both exhibited a pattern of initial fluctuating stability followed by a substantial decline, with clear signs of cotton cultivation contraction. As depicted in Figure 1a, during the period from 2000 to 2005, the cotton planting area and output increased by 17.5% and 15.7%, respectively, exhibiting a slight upward trend amid minor fluctuations. From 2006 to 2010, both of them showed a downward trend, with only a slight increase in 2009. However, from 2011 to 2022, the planting area and output witnessed a “cliff-like” decline, dropping by 80.6% and 82.8%, respectively. From the perspective of inter-provincial differences, as presented in Figure 1b, the cotton planting areas in the six provinces of the Middle and Lower Reaches of the Yangtze River generally decreased, following a consistent trend. Among them, the cotton planting areas in Hubei, Anhui, and Jiangsu provinces, due to their relatively large proportions, showed particularly prominent signs of the retreat of cotton-growing areas. Especially after 2011, all three provinces experienced a “cliff-like” decline. Correspondingly, over the past two decades or so, the changes in the cotton planting areas in Hunan, Jiangxi, and Zhejiang provinces were less pronounced, yet there were still signs of the retreat of cotton-growing areas.
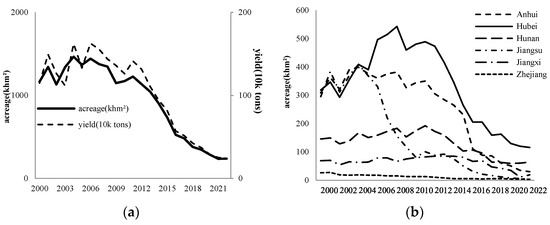
Figure 1.
Changes in the cotton-growing areas in the Middle and Lower Reaches of the Yangtze River: 2000–2022. (a) Cotton planting acreage and yield in the Middle and Lower Reaches of the Yangtze River by years; (b) Cotton planting acreage of six provinces by year.
Furthermore, the retreat of cotton-growing areas in the Middle and Lower Reaches of the Yangtze River and the food security strategy have exhibited an alternating dynamic. Different from the current situation of cotton planting, the food production in the Middle and Lower Reaches of the Yangtze River has benefited from comprehensive support policies, price protection, and complementary technologies [23]. Regarding support policies, the Ministry of Finance initiated the reward policy for major grain-producing counties in 2005, effectively incentivizing county-level governments to actively develop grain production [24]. In terms of price protection and the promotion of agricultural technologies, with the subsidy policies for improved seeds, agricultural machinery, and farmland protection, as well as the in-depth advancement of agricultural mechanization transformation, the guarantee for the net income from grain cultivation has been significantly enhanced, and a widening gap has emerged in the net income derived from grain versus cotton cultivation. During the same period, the cotton subsidy policy has undergone transformations [25]. From 2011 to 2013, the temporary purchase and storage policy played a positive role in stabilizing the cotton market price. The state purchased cotton at a fixed price, preventing excessive market price drops and ensuring the planting income of cotton farmers, thus largely stabilizing the scale of cotton planting [26]. However, over time, the drawbacks of this policy gradually emerged. The domestic cotton price was inflated due to the purchase and storage, becoming disconnected from the international market. This led to a substantial increase in the production costs of domestic cotton textile enterprises and a decline in the market competitiveness of textile products [27], thereby reducing the demand for local cotton. In 2014, the target price subsidy policy for cotton was implemented in Xinjiang, and the temporary purchase and storage policy for cotton in inland cotton-growing areas was abolished, resulting in a decline in the enthusiasm of inland cotton farmers for production [28]. With the gradual expansion of the target price subsidy policy for cotton to cover inland cotton-growing areas, the basic income of cotton farmers was ensured. This also encouraged cotton farmers to adjust the quality and output of cotton according to market demand, enhancing the market adaptability of the cotton industry. However, in the actual implementation process, for cotton farmers in the Middle and Lower Reaches of the Yangtze River, who mainly engage in small-scale and fragmented operations, there are issues such as high costs of obtaining subsidies and cumbersome subsidy distribution procedures. Some cotton farmers have been unable to receive subsidies in full and on time. Especially when the market price fluctuates significantly, it is difficult to effectively guarantee the income from cotton planting [29], thus affecting the enthusiasm of cotton farmers for cultivation.
It can be observed that there are three main reasons for the retreat of cotton-growing areas in the Middle and Lower Reaches of the Yangtze River. Firstly, during the process of urban-rural development in China, the increasing non-farm employment opportunities have highlighted the relative income gap between agricultural and non-farm employment, leading to the non-agricultural transfer of rural surplus labor [30]. Secondly, cotton planting itself faces development challenges. Particularly, the labor constraints in the process of cotton planting have not been effectively mitigated through the development of cotton mechanization and the agricultural socialized service system for factor substitution. Moreover, the decline of cotton subsidy policies has exacerbated the problem of high costs and low returns in cotton planting. Thirdly, the “dividends” of the food security policy package have highlighted the relative disadvantages of cotton planting. As a result, farmers inevitably need to weigh the cost–benefit changes resulting from factor allocation and crop variety selection. Under the combined influence of these factors, abandoned cotton fields were either left fallow or converted to other uses, resulting in a large amount of idle arable land. Guided by food security policies, these arable lands have gradually shifted towards food crops that require less labor and have a higher level of mechanization, such as wheat and rice. With the support of agricultural machinery subsidies and the continuous improvement of the agricultural socialized service system, these food crops can be cultivated on a large scale and with high efficiency. This transformation has further compressed the space for cotton planting, leading to a further reduction in the scale of cotton-growing areas in this basin.
3. Method
3.1. Data Source
This paper selects data from 182 county-level administrative units (including districts, county-level cities, and counties) across 49 prefecture-level cities (with 1 autonomous prefecture) in 6 provinces of the Middle and Lower Reaches of the Yangtze River, yielding a total of 4186 observations. Specifically, data on cotton planting area and agricultural chemical fertilizer application (in converted stock) for each county are derived from the statistical yearbooks of their affiliated prefecture-level cities spanning 2001–2023, supplemented by the statistical bulletins on national economic and social development of the respective counties for corresponding years. Data on major grain-producing counties are obtained from policy documents issued by the Ministry of Finance of the People’s Republic of China, including the Measures for the Central Fiscal Rewards to Major Grain-Producing Counties, the Interim Measures for the Administration of Reward Funds for Major Grain (Oil)-Producing Counties, and the National Plan for Increasing Grain Production Capacity by 50 billion Kilograms (2009–2020). Counties implementing the cotton target price subsidy policy are compiled based on the websites of provincial departments of agriculture and rural affairs and relevant normative documents. Additionally, data on the added value of the secondary and tertiary industries, administrative area land area, effective irrigation area, total grain output, and total agricultural machinery power are sourced from the China Rural Statistical Yearbook (2001–2023). Annual precipitation represents the yearly average of total daily precipitation for the year, measured in millimeters. The data source is the ERA5-Land dataset released by organizations such as the European Union and the European Centre for Medium-Range Weather Forecasts. For counties with missing data in certain years, we employed linear interpolation.
3.2. Description of Variables
3.2.1. Dependent Variables
Non-farm employment () is defined as follows. This paper follows the approach of Li et al. (2021) by employing the number of workers in the non-farm sector as a proxy variable for non-farm employment [31]. Specifically, the number of workers in the non-farm sector is defined as the total number of rural employed persons minus the number of persons employed in agriculture, forestry, animal husbandry, and fisheries.
The reward policy for major grain-producing counties () is an interaction term between the policy dummy variable and time, denoted as . For a sample county, if it is included in the central fiscal reward list for major grain-producing counties, then = 1; otherwise, = 0. is a dummy variable indicating the year when the grain-producing county reward policy is implemented: = 1 for the year of policy implementation and all subsequent years, and = 0 otherwise.
Cotton target price subsidy policy () is measured as follows. The effect of the cotton target price subsidy policy is captured by the interaction term of the policy dummy variable . For a sample county, if it is included in the list of cotton target price subsidies, then = 1; otherwise, = 0. Similarly, is a time dummy variable ( = 1 from the year of policy implementation onward, and = 0 otherwise).
3.2.2. Control Variables
The control variables in this paper mainly include:
- (1)
- Total agricultural machinery power (): Reflects the level of agricultural mechanization, as mechanization affects labor input requirements for cotton cultivation;
- (2)
- Agricultural chemical fertilizer application (): Measured in converted stock quantity, capturing the intensity of agricultural inputs that influence crop yield and planting decisions;
- (3)
- Effective irrigation area (): An indicator that measures the level of water conservancy development and the stability of agricultural production in agricultural units and regions, and it is also an important variable affecting cotton planting area;
- (4)
- Annual precipitation (): As cotton is not tolerant to waterlogging, under conditions of low rainfall and partial drought, sufficient light and heat, coupled with relatively easy manual regulation of soil moisture, enable the full exploitation of light and heat resources to boost yields; whereas under conditions of heavy rainfall and consequent waterlogging, the combination of light, heat, and water is often unfavorable or even harsh [32];
- (5)
- Total grain output (): Since land is a critical scarce factor in agricultural production, farmers necessarily forgo the benefits of planting other crops when they choose a specific crop. As total grain output rises, farmers tend to prefer growing food crops, thereby reducing the cultivation of cash crops such as cotton.
The variance inflation factor (VIF) is calculated for all control variables and core explanatory variables. Results show a mean VIF of less than 1.7, with all individual VIF values < 3 (far below the threshold of 10), confirming that there are no severe multicollinearity issues that would distort the regression results. The definitions, assignments, and descriptive statistics of the variables are presented in Table 1.

Table 1.
Descriptive statistics.
3.3. Research Methodology
To examine the superimposed impact of non-farm employment and policies on the decline of cotton-growing areas in the Middle and Lower Reaches of the Yangtze River, the benchmark model is constructed as follows:
In Equation (1), subscripts and denote region and year, respectively; denotes cotton planting acreage; denotes non-farm employment; denotes the two policies: the grain-producing county reward policy and the cotton target price subsidy policy. denotes control variables; and denote region and year fixed effects, respectively, and denotes a randomized disturbance term.
4. Results
4.1. Baseline Results
The results of the Hausman test indicate that we should adopt a two-way fixed effects model to analyze the impact of non-farm employment on the contraction of cotton-growing areas in the Middle and Lower Reaches of the Yangtze River. The results of the parallel trend test (as shown in Figure A1 in Appendix A) show that the difference-in-differences model satisfies the parallel trend assumption. To further verify the robustness of the policy impact estimates, we also conducted a placebo test by randomly assigning policy implementation status to counties, and the results are shown in Figure A2 in Appendix A. The false policy shocks do not produce significant negative effects on cotton planting area, which rules out the interference of unobserved confounding factors and further supports the validity of the baseline DID results. In Table 2, Column (1) is used to examine the impact of non-farm employment on the area of cotton-growing regions in the Middle and Lower Reaches of the Yangtze River; Column (2) is used to examine the combined impact of non-farm employment and policy interventions on cotton-growing areas; Columns (3) and (4) are used to test the difference-in-differences model to test the respective effects of the reward policy for major grain-producing counties and the cotton target price subsidy policy on cotton-growing areas.
Table 2.
Benchmark regression results.
In Table 2, the results in Column (1) indicate that non-farm employment significantly reduces the cotton planting area, suggesting that rural labor migration leads to a contraction in cotton cultivation. This may be attributed to the fact that the growth of rural non-farm employment diversifies the occupational choices of rural household laborers, leading to a continuous transfer of surplus labor to non-agricultural sectors. Consequently, a relative labor shortage is caused in cotton cultivation [33]. Given that cotton farming in the Middle and Lower Reaches of the Yangtze River is typically labor-intensive, these factors (i.e., rural labor migration and labor shortage) collectively contribute to the shrinkage of cotton-growing areas. The estimation results in Column (2) show that after incorporating policy factors, the negative impact of non-farm employment on cotton planting area is further strengthened. This suggests that the contraction effect of non-farm employment on cotton area is amplified under policy interaction. A possible explanation is that the reward policy for major grain-producing counties directs resources toward grain production. This creates a synergy with non-farm employment, thereby exacerbating the loss of critical inputs like labor and land from cotton cultivation. At the same time, it reflects that the cotton target price subsidy policy has failed to effectively counteract the impact of non-farm employment on cotton-growing areas and may have even reinforced this shrinking trend to some extent.
The results in Columns (3) and (4) show that adjustments in cotton-related policies have a significant negative impact on cotton planting area, indicating that cotton planting area experiences a notable reduction after the implementation of the cotton target price subsidy policy. This may be attributed to the fact that cotton cultivation in the Middle and Lower Reaches of the Yangtze River is predominantly small-scale and fragmented. Cotton farmers face high transaction costs in obtaining subsidies, and the procedures and standards for subsidy distribution are often insufficient or unclear, resulting in limited actual benefits for many farmers. Given the persistently low profitability of cotton cultivation, farmers have a clear incentive to scale back their planting area. Furthermore, the reward policy for major grain-producing counties also exerts a significant negative influence on cotton planting area. This can be explained by the fact that the policy offers financial incentives and support to grain-producing counties, enhancing the comparative advantage of grain cultivation and creating a substantial crop substitution effect. In the Middle and Lower Reaches of the Yangtze River, farmers tend to reallocate land resources from cotton to grain production in pursuit of higher returns, thereby directly contributing to the decline in cotton planting area.
4.2. Robustness Analysis
For rural household labor, non-farm employment occurs both within and beyond county boundaries. To accurately evaluate the impact of non-farm employment on the contraction of cotton-growing areas, this study extends the analysis beyond the county-level non-farm employment indicator by incorporating the following measures: first, the level of non-farm employment in the prefecture-level city where the sample county is located (); second, the level of non-farm employment in the province where the sample county is located (); third, considering that the Jiangsu-Zhejiang region is a major destination for rural labor migration from the Middle and Lower Reaches of the Yangtze River, we also incorporate the level of non-farm employment in the Jiangsu-Zhejiang region corresponding to the sample county ().
The results in Columns (1) to (3) of Table 3 indicate that non-farm employment at progressively broader geographic levels has a significant negative impact on cotton-growing areas. The contraction effect is most direct at the prefecture-level city scale, while the effect at the Jiangsu-Zhejiang regional level is relatively weaker. A possible explanation is that prefecture-level cities maintain close economic and geographic ties with their subordinate counties. Short commuting times and high geographical familiarity encourage rural labor in counties to seek non-farm employment in these urban centers, thereby reducing agricultural labor input and contributing to the contraction of cotton cultivation. At the provincial level, inter-regional labor mobility is constrained by geographical distance, administrative barriers, and migration patterns. Most laborers prefer moving from counties to major cities, such as those in the Jiangsu-Zhejiang-Shanghai region, while mobility between cities within the same province remains limited. As a result, the impact of provincial-level non-farm employment is less pronounced than that at the prefecture-city level. In the Middle and Lower Reaches of the Yangtze River, Jiangsu and Zhejiang are major recipients of rural labor migration. The urbanization, industrialization, and marketization in these provinces create a “circular layer” effect in rural labor demand, prioritizing the absorption of local labor before expanding to inter-provincial migrants. Consequently, when considering the entire basin, the combined influence of non-farm employment within counties and in the Jiangsu-Zhejiang Region further dilutes the overall contraction effect on cotton-growing areas.
Table 3.
Endogeneity test.
Moreover, to ensure the robustness of policy effect estimates, this paper employs the Continuous Difference-in-Differences (CSDID) method proposed by Callaway and Sant’Anna (2020) [34]. This approach leverages inverse probability weighting to derive doubly robust DID estimators, effectively addressing the multi-period and multi-group nature of policy implementation (such as the food security-oriented and cotton subsidy policies). The results in Columns (4)–(5) indicate that the Average Treatment Effect on the Treated (ATT) coefficients are statistically significant and negative, indicating that the implementation of food security and cotton subsidy policies has a robust inhibitory effect on cotton acreage in the treated counties. This finding aligns with the baseline regression conclusions, confirming that the policy impacts are not driven by temporal or group-specific confounding factors. By capturing the dynamic and heterogeneous policy effects across different implementation periods and county groups, the CSDID method further solidifies the conclusion that these policies are a key driver of cotton cultivation contraction in the Yangtze River.
To mitigate potential biases caused by endogeneity, this study constructs a Bartik instrumental variable (IV) following the framework proposed by Goldsmith-Pinkham et al. (2020) [35]. The Bartik IV is defined as the interaction between baseline county-level non-farm employment shares and national non-farm sector growth rates, which is specifically calculated as the product of two components: the 2000 (base year) county-level non-farm employment share and the national annual non-farm employment growth rate. On one hand, this Bartik IV exhibits a strong correlation with the core explanatory variable. The baseline county non-farm employment share reflects the initial industrial structure of the region, while the national non-farm growth rate captures aggregate sectoral trends; their interaction effectively predicts the exogenous variation in local non-farm employment opportunities, satisfying the relevance requirement for a valid IV. On the other hand, the Bartik IV possesses high exogeneity. Its variation is primarily driven by two exogenous factors: the pre-determined 2000 baseline employment structure and national-level non-farm sector growth trends. It is thus unlikely to be reversely affected by changes in cotton-growing areas, fully meeting the exogenous requirement for an instrumental variable.
The results in Columns (6) to (7) show that the instrumental variable passes both the under-identification test and the weak instrument test. The regression coefficient of the core explanatory variable remains significantly negative, indicating that after controlling for endogeneity, the contraction effect of non-farm employment and relevant policy guidance on cotton-growing areas in the Middle and Lower Reaches of the Yangtze River remains robust and reliable.
5. Heterogeneity, Mechanisms, and Spatial Effect
Based on the regression results, we further analyze the heterogeneity of influences, mechanisms, and spatial effects of non-farm employment and agricultural policies on cotton planting acreage contraction in the Middle and Lower Reaches of the Yangtze River.
5.1. Heterogeneity Analysis
5.1.1. Cotton Planting Acreage Changes in Different Period
Figure 1 indicates that the cotton planting area in the Middle and Lower Reaches of the Yangtze River exhibited distinct trends across different time periods. Accordingly, the study divides the sample period into three phases—2000–2005, 2006–2010, and 2011–2022— to examine the temporal heterogeneity in the effects of non-farm employment and policies on cotton planting area.
The results in Column (1) of Table 4 indicate that non-farm employment had a significantly positive impact on cotton planting areas in the Middle and Lower Reaches of the Yangtze River during 2000–2005. This phenomenon can be attributed to two main factors: first, despite regional economic development, smallholder farming was still dominant, and local non-farm employment opportunities were limited, both of which helped maintain a stable agricultural labor supply for cotton cultivation; second, as a traditional cotton-growing region, non-farm income at this stage served mainly as a supplement to—rather than a replacement for—agricultural earnings, since underdeveloped scale and specialization in production hindered large-scale transitions of labor away from farming. Column (2) shows that the reward policy for major grain-producing counties had a positive though statistically insignificant effect, likely due to the policy’s recent introduction (it started in 2005), which allowed too little time for farmers to adjust their planting decisions. These findings are consistent with the trends shown in Figure 1, where minor fluctuations are observed alongside an overall slight increase in cotton planting area during 2000–2005, supporting both the statistical records and empirical results.
Table 4.
Non-farm employment to cotton planting in different periods.
The results in Columns (3) and (4) show that both non-farm employment and the reward policy for major grain-producing counties had significantly negative effects on cotton planting areas during 2006–2010. Statistical data reflect an overall decline in cotton cultivation throughout the Yangtze River Basin in this period, with a minor rebound in 2009—a trend that aligns closely with the regression results.
Owing to its geographical proximity to the Yangtze River Delta and Pearl River Delta regions—both major hubs for export-oriented and labor-intensive industries—the Yangtze River Basin provided ample non-farm employment opportunities, especially in its coastal developed areas. This generated a substantial “pull effect,” drawing rural labor away from agriculture and shifting cotton cultivation from a state of fluctuating stability to sustained decline. However, the 2008 global financial crisis severely disrupted China’s export-oriented economy, leading to a sharp reduction in job availability and employment stability. This triggered large-scale return migration of rural laborers to their home regions [36], temporarily increasing the agricultural labor supply and contributing to the rebound in cotton planting area observed in 2009.
Concurrently, the cumulative effect of grain policies gradually became evident through crop substitution. Columns (5) and (6) show that these negative effects intensified during 2011–2022, as reflected in the larger coefficients. In the wake of the financial crisis, economic recovery, government stimulus measures, and restructuring of foreign trade further accelerated urbanization and industrialization, creating a substantial number of non-farm jobs. This wave of labor migration disproportionately impacted cotton production—a labor-intensive sector that is already facing the rising production costs [37]. Meanwhile, the sustained implementation of grain policies widened comparative income gaps between grain and cotton crops, further accelerating the decline of cotton cultivation in the basin.
5.1.2. Interprovincial Differences in Cotton Planting
The development of non-agricultural industries in the Middle and Lower Reaches of the Yangtze River has expanded non-farm employment opportunities for rural laborers, thereby raising the opportunity cost of agricultural production. Due to varying levels of economic development among provinces within the basin, significant heterogeneity exists in both farmers’ access to non-farm employment and their responsiveness to policy incentives. This leads to considerable regional divergence in the opportunity costs of cotton cultivation, which ultimately influences farmers’ planting decisions. Based on the scale of cotton cultivation across provinces, we classify the six provinces in the basin into two groups for comparative analysis: (1) the HAJ group (Hubei, Anhui, and Jiangsu), and (2) the ZJH group (Zhejiang, Jiangxi, and Hunan). This grouping allows for an examination of the differential impacts of non-farm employment and policy guidance on cotton cultivation across regions with distinct cotton production characteristics.
Table 5 (Columns 1–3) shows that in Jiangsu, Anhui, and Hubei (the HAJ group)—provinces characterized by larger-scale cotton cultivation—both non-farm employment and policy incentives had statistically significant negative effects on cotton planting areas. Three interrelated mechanisms help explain these results: (1) The well-developed transportation infrastructure, coastal proximity, and rapid economic growth in these regions created ample non-agricultural employment opportunities, substantially increasing the opportunity costs of labor-intensive cotton farming and leading to crop abandonment. (2) The implementation of the reward policy for major grain-producing counties improved the comparative returns of grain cultivation through subsidies and preferential loans, thereby diverting essential productive resources away from cotton. (3) Although land transfer fees and rising agricultural input costs significantly increased cotton production expenses in these areas, the cotton target price subsidy policy did not adjust compensation standards accordingly, resulting in an uncompensated revenue gap that further encouraged a switch to grain crops as lower-risk alternatives.
Table 5.
Interprovincial impact of non-farm employment on cotton planting.
Columns (4) to (6) reveal distinct patterns in Zhejiang, Jiangxi, and Hunan (the ZJH group): Non-farm employment showed a negative but statistically insignificant effect, which can be attributed to Zhejiang’s mountainous terrain limiting land suitable for cotton cultivation, as well as Jiangxi and Hunan’s traditional cotton-growing regions (such as riverine polder systems) benefiting from stabilizing provincial subsidy policies. The target price subsidy policy exhibited a positive but insignificant effect; while smaller average cultivation scales enhanced coverage efficiency, its overall effectiveness was ultimately dampened by market price volatility. The grain policy had a significant negative impact, though with smaller coefficients than those in the HAJ group, reflecting these provinces’ more diversified agricultural structures—including tea, fruit, and specialty aquaculture—which provided farmers with alternative adjustment pathways and reduced reliance on drastic reductions in cotton area.
5.2. Mechanism Analysis
How does the increase in non-farm employment influence the cotton cultivation process and ultimately affect the cotton planting area? This study examines the transmission mechanisms through which non-farm employment affects cotton cultivation via two key pathways: the outflow of rural labor and changes in the relative income from cotton planting.
5.2.1. Rural Labor Outflow
As a labor-intensive crop, cotton cultivation relies heavily on agricultural labor, particularly in contexts where mechanization cannot effectively replace human effort [38]. The progress of urbanization and marketization has generated extensive non-farm employment opportunities across various industries, leading to a large-scale transfer of rural labor to urban and non-agricultural sectors. The decline in the rural population, especially the outflow of younger and more skilled laborers, has reduced both the quantity and quality of the available agricultural workforce. This trend has compelled cotton farmers to confront two major challenges: first, a shortage of household labor and difficulties in managing high-intensity farm tasks; and second, rising rural labor costs coupled with declining efficiency. The increasing cost and reduced feasibility of hiring external labor have made it difficult to sustain previous production levels. As a result, many farmers have been forced to reduce their cotton planting area.
Therefore, this paper proposes that rural labor outflow serves as a key mechanism through which non-farm employment accelerates the decline in cotton planting area. To capture this mechanism, the county’s annual rural population is selected as a proxy variable for rural labor outflow. If this mechanism holds, the negative effect of non-farm employment on cotton planting area should be more pronounced in counties with relatively smaller rural populations. To test this, an interaction term between the county’s annual rural population () and non-farm employment is introduced into the baseline model. We use the significance and direction of the interaction term coefficient to evaluate the proposed mechanism. The empirical model is specified as follows:
In Equation (2), represents the interaction term between non-farm employment and rural population size; all other variables are defined consistently with Equation (1). As reported in Column (1) of Table 6, the coefficient of this interaction term is significantly negative, indicating that the negative effect of non-farm employment on cotton planting area is more pronounced in regions with smaller rural populations. This result supports the labor outflow mechanism proposed in this study.
Table 6.
Mechanism regression results.
5.2.2. Cotton Yield Ratio
The profitability of cotton cultivation is a critical factor influencing farmers’ planting decisions. As rational economic agents, farmers compare the returns from cotton with those from alternative crops or non-farm activities when deciding whether to plant cotton. The relative income from cotton significantly affects the allocation of land to this crop [39]. The expansion of non-farm employment raises the opportunity cost of agricultural labor, leading to a transfer of labor away from farming—especially from labor-intensive sectors like cotton production. This outflow reduces the agricultural labor supply, thereby increasing labor costs. At the same time, growth in cotton output remains constrained by technological limitations and market price fluctuations, which further dampens the relative return from cotton cultivation. Faced with rising costs and limited revenue potential, farmers are likely to reassess the profitability of cotton. A decline in profit margins may prompt them to reduce cotton acreage and shift to more lucrative crops or non-farm activities [40]. To test this mechanism, we introduce an interaction term between the cotton return ratio () and non-farm employment into the baseline model. The cotton return ratio is defined as the ratio of cotton planting income to per capita county-level disposable income. Cotton income is proxied using provincial-level cotton price data—drawn from the National Compendium of Agricultural Product Cost and Benefit Information (2000–2022)—while per capita county disposable income is obtained from the China Rural Statistical Yearbook (2001–2023). The empirical model is specified as follows:
In Equation (3), represents the interaction term between non-farm employment and the cotton return ratio; all other variables remain consistent with Equation (1). The estimation results for Equation (4) are presented in Column (2) of Table 6. The empirical findings indicate that the negative effect of non-farm employment on cotton planting area is more pronounced in contexts where the return from cotton cultivation is relatively low. These results support the proposed inference regarding the role of profitability in farmers’ planting decisions.
5.3. Spatial Effect Analysis
5.3.1. Spatial Econometric Model
Given the characteristics of the cross-county distribution of non-farm employment and the spatial spillover effects of agricultural policies, this paper constructs a Spatial Durbin Model to re-examine the baseline Equation (1). The relevant model is as follows:
In Equation (4), is the spatial weight matrix, and denotes the spatial autoregressive coefficient. We construct a 0–1 adjacency matrix and an economic distance matrix. The specific details of the matrices constructed are as follows.
- (1)
- 0–1 adjacency matrix (): This is constructed to capture inter-regional spatial dependencies as it can more intuitively reflect direct spatial linkages between geographically contiguous counties, with if county and county share a common border and otherwise.
- (2)
- Economic distance matrix (): The adjacency matrix focuses on geographic proximity, and to complementarily capture economic connection-driven spatial interactions across regions, we select this economic distance matrix to quantify the intensity of cross-regional links based on economic development gaps. We take the per capita () of county and county as a measure and construct an economic distance matrix by using the reciprocal of the absolute value of the difference between their per capita, which is
5.3.2. Spatial Correlation Test
To assess the spatial dependence of variables and validate the use of spatial econometric models, this study conducts Moran’s I test, as shown in Equation (5):
where is the number of counties, is the spatial weight matrix (including the binary adjacency matrix and economic distance matrix ), is the variable value for county , and is the mean of .
Based on the two sets of spatial weight matrices, this study calculates the Moran’s I indices of cotton planting acreage, non-farm employment, and agricultural policies (including the grain-producing county reward policy and the cotton target price subsidy policy) at the county level. The results in Table A1 in Appendix B show that most Moran’s I indices are significantly positive at the 5% significance level, indicating a distinct positive spatial correlation among the research variables.
5.3.3. Spatial Regression
Table A2 in Appendix B. The spatial LM test results under different weight matrices are all statistically significant, reflecting the existence of significant spatial lag effects and spatial error effects among the research variables, which verifies the rationality of constructing spatial econometric models. The LR test results indicate that the Spatial Durbin Model (SDM) cannot be degraded to the Spatial Autoregressive Model (SAR) or the Spatial Error Model (SEM); thus, the SDM is identified as the benchmark regression model. Based on the Hausman test results, the model finally adopts the two-way fixed effects specification of counties and years. It further decomposes the direct effects, indirect effects, and total effects of the core explanatory variables through the partial differential method, so as to clearly reveal the spatial spillover mechanism between variables.
In Table 7, the different results between the two matrices confirm that the spatial mechanism varies depending on the type of interaction. Geographical adjacency dominates policy imitation and short-distance labor mobility, thereby strengthening the spillover effects of the cotton target price subsidy policy and non-farm employment. Economic similarity, by contrast, drives coordinated structural adjustments in agrarian economies, amplifying the cross-county impact of the grain-producing county reward policy. The results in Column (1)–(3) indicate that, under the binary contiguity weight matrix, non-farm employment, the cotton target price subsidy policy, and the grain-producing county reward policy all exert significant negative spatial impacts on cotton planting, with geographical proximity intensifying their spillover effects. The grain-producing county reward policy exhibits the strongest indirect effect, indicating that its implementation in neighboring counties triggers coordinated reallocation of agricultural resources across geographically contiguous regions. Local counties, following the emphasis on grain production in adjacent areas, reallocate resources from cotton to food crops—a trend reinforced by shared agricultural planning and land-use dynamics. The cotton target price subsidy policy also shows notable spatial spillover, as policy diffusion and price signal transmission among geographically proximate counties lead to synchronized reductions in cotton cultivation. Meanwhile, non-farm employment’s cross-county labor siphoning is amplified by adjacency, as short-distance mobility enables neighboring regions to more effectively attract agricultural labor away from cotton farming.
Table 7.
Spatial regression results.
The results in Column (4)–(6) indicate that, under the economic distance matrix, economic similarity strengthens the spatial transmission of structural adjustments driven by policies and non-farm employment. The grain-producing county reward policy displays the largest indirect effect magnitude here, reflecting that counties with similar economic profiles (such as those with agrarian-dominated economies) respond more uniformly to grain incentives. Shared dependence on agricultural income prompts these counties to collectively shift from cotton to food crops, as economic similarity fosters parallel policy adoption and resource reallocation. Non-farm employment’s spatial impact is also magnified under this matrix, as economically similar counties with comparable industrial bases experience simultaneous labor migration. Growth in non-farm sectors in one county is mirrored in neighboring counties with similar economic structures, leading to a collective decline in agricultural labor available for cotton farming. In contrast, the cotton target price subsidy policy shows weaker spatial spillover under the economic distance matrix than under the binary adjacency matrix, suggesting that its effectiveness relies more on geographical proximity than on economic similarity.
6. Conclusions
This study empirically analyzes the synergistic and spatial effects of non-farm employment and agricultural policies on cotton planting area contraction in the Middle and Lower Reaches of the Yangtze River, using 22-year panel data (2000–2022) from 182 counties in the region. Key findings align with the goals of sustainable agricultural development:
- (1)
- Temporally, cotton cultivation shifted from “fluctuating stability” (2000–2010) to “cliff-like decline” (2011–2022), with over 80% of the cotton planting area lost in the latter period, reflecting the long-term impact of structural transformation and policy adjustments;
- (2)
- Non-farm employment is a core driver: it directly reduces agricultural labor supply and generates spatial spillovers; contraction effects are more pronounced in labor-scarce and low-cotton-return counties, highlighting heterogeneous impact across county types;
- (3)
- Differential roles of agricultural policies: The 2005 Reward Policy for Major Grain-Producing Counties drives land and labor reallocation from cotton to grain; the 2014 cotton policy shift (from stockpiling to target price subsidies) fails to offset smallholders’ low returns, exacerbating the decline, which reveals policy-induced resource reallocation dynamics;
- (4)
- Spatial mechanism: Cotton area contraction is a result of the synergistic interaction between non-farm employment-driven labor transformation and policy-guided resource reallocation, with spatial spillovers varying across geographical and economic contexts.
To address cotton area contraction and promote sustainable agricultural development in the Middle and Lower Reaches of the Yangtze River, while offering insights for analogous cash crop regions globally, we propose targeted policy adjustments. These adjustments are aligned with the “environmental-economic-social” sustainability framework and are informed by this study’s findings on regional heterogeneity, spatial spillovers, and the “dual squeeze” of labor scarcity and policy-induced resource misallocation. For regions with cotton comparative advantages, local governments should develop “part-time farming” models by providing vocational training for farmers to engage in nearby non-farm work while retaining cotton cultivation, and provide subsidies for the transition to low-labor, high-value alternative crops suitable for local ecology to prevent arable land abandonment and soil degradation. This approach not only mitigates risks of arable land abandonment and soil degradation but also contributes to broader global efforts to protect land resources and maintain ecological balance within agricultural systems. To strengthen the economic sustainability of cotton production, efforts should focus on increasing investment in labor-saving agricultural technologies and expanding support for inputs that enhance both productivity and environmental performance. Additionally, establishing regional quality inspection and standardized marketing platforms will help improve market returns for cotton producers, which in turn supports stable income levels and encourages the retention of human capital in sustainable agricultural practices. In refining agricultural policy frameworks, introduce a “cotton-grain coordination subsidy” under existing grain support mechanisms to reward regions that maintain a reasonable cotton cultivation scale while meeting core grain production targets. Simultaneously, optimize cotton-specific subsidy policies by streamlining application procedures through digitalization and linking subsidy amounts to production cost fluctuations and adherence to sustainable farming standards. These policy adjustments work to balance the critical goals of food security and cash crop sustainability, while preserving agricultural economic diversity.
Differing from studies on homogeneous policy impacts or aggregated analyses, this study explores the spatial spillover effects of non-farm employment and agricultural policies on Yangtze River cotton planting from a county-level spatial econometric perspective, yet it has key limitations. Relying on secondary statistical data, it lacks on-the-ground verification and faces issues of unaddressed unobserved heterogeneity and policy endogeneity, with results limited to the Middle and Lower Reaches of the Yangtze River without cross-regional comparisons. Future research could integrate remote sensing for dynamic cotton planting area monitoring and use household surveys to validate behavioral mechanisms and to assess policy environmental implications under climate change.
Supplementary Materials
The following supporting information can be downloaded at: https://www.mdpi.com/article/10.3390/su172210039/s1, Table S1: Unit root tests; Table S2: Co-integration tests; Table S3: Heteroscedasticity.
Author Contributions
Conceptualization, Q.W. and J.H.; methodology, Q.W. and J.H.; software, J.H.; validation, Q.W. and J.H.; formal analysis, Q.W. and J.H.; investigation, Q.W.; resources, Q.W.; data curation, J.H. and J.Z.; writing—original draft preparation, Q.W. and J.H.; writing—review and editing, Q.W., J.H. and J.Z.; visualization, Q.W.; supervision, J.H.; project administration, Q.W.; funding acquisition, Q.W. and J.H. All authors have read and agreed to the published version of the manuscript.
Funding
This research was funded by the National Social Science Fund of China (grant number 23BGL264), General Program of the Excellent Young Talents Support Plan for Colleges and Universities in Anhui Province and the Humanities (grant number gxyq2022031) and Excellent Young Scientific Research Projects in Colleges and Universities of Anhui Province (grant number 2024AH030072).
Institutional Review Board Statement
Not applicable.
Informed Consent Statement
Not applicable.
Data Availability Statement
The original contributions presented in this study are included in the article/Supplementary Materials. Further inquiries can be directed to the corresponding author.
Conflicts of Interest
The authors declare no conflicts of interest.
Appendix A

Figure A1.
Parallel trend test. (a) the reward policy for major grain-producing counties. (b) cotton target price subsidy policy.

Figure A2.
Placebo test. (a) the reward policy for major grain-producing counties. (b) cotton target price subsidy policy. Note: The solid line represents the kernel density curve of placebo coefficients, the dashed line indicates the significance threshold (p = 0.1), and the circles denote individual placebo coefficient estimates.
Appendix B
Table A1.
Spatial correlation test results.
Table A1.
Spatial correlation test results.
| W1 | W2 | |||||||
|---|---|---|---|---|---|---|---|---|
| 2000 | 0.096 * (1.230) | 0.029 ** (1.984) | 0.030 ** (2.068) | 0.022 * (1.575) | ||||
| 2001 | 0.147 ** (1.927) | 0.030 ** (2.038) | 0.029 ** (2.016) | 0.087 *** (5.348) | ||||
| 2002 | 0.010 * (0.072) | 0.041 *** (2.688) | 0.030 ** (2.050) | 0.016 * (1.211) | ||||
| 2003 | 0.146 ** (1.910) | 0.055 ** (3.472) | 0.027 * (1.894) | 0.063 *** (3.939) | ||||
| 2004 | 0.145 ** (1.901) | 0.051 *** (3.257) | 0.022 (1.638) | 0.015 (1.180) | ||||
| 2005 | 0.142 ** (1.857) | 0.061 *** (3.822) | 0.128 ** (3.105) | 0.023 * (1.691) | 0.038 ** (2.502) | 0.085 ** (2.736) | ||
| 2006 | 0.144 ** (1.872) | 0.061 *** (3.827) | 0.156 *** (3.521) | 0.038 ** (2.572) | 0.041 *** (2.687) | 0.103 *** (3.012) | ||
| 2007 | 0.141 ** (1.837) | 0.059 *** (3.701) | 0.182 *** (3.897) | 0.028 ** (2.013) | 0.012 * (1.035) | 0.121 *** (3.289) | ||
| 2008 | 0.132 ** (1.708) | 0.045 *** (2.890) | 0.205 *** (4.173) | 0.030 ** (2.569) | 0.033 ** (2.230) | 0.138 *** (3.545) | ||
| 2009 | 0.099 * (1.277) | 0.047 *** (3.028) | 0.227 *** (4.426) | 0.0356 ** (2.420) | 0.047 *** (3.010) | 0.153 *** (3.768) | ||
| 2010 | 0.101 * (1.292) | 0.045 *** (2.906) | 0.243 *** (4.619) | 0.028 * (1.953) | 0.032 ** (2.145) | 0.165 *** (3.924) | ||
| 2011 | 0.029 * (0.454) | 0.036 ** (2.405) | 0.258 *** (4.785) | 0.033 ** (2.243) | 0.089 *** (5.445) | 0.176 *** (4.051) | ||
| 2012 | 0.203 *** (2.521) | 0.033 ** (2.230) | 0.269 *** (4.912) | 0.036 ** (2.385) | 0.032 ** (2.128) | 0.184 *** (4.147) | ||
| 2013 | 0.199 *** (2.474) | 0.037 ** (2.455) | 0.275 *** (5.003) | 0.045 *** (2.944) | 0.033 ** (2.193) | 0.189 *** (4.216) | ||
| 2014 | 0.185 *** (2.291) | 0.023 * (1.680) | 0.052 *** (3.331) | 0.278 *** (5.056) | 0.036 ** (2.430) | 0.041 *** (2.684) | 0.031 ** (2.674) | 0.192 *** (4.259) |
| 2015 | 0.188 *** (2.324) | 0.029 ** (2.0685) | 0.087 *** (3.612) | 0.280 *** (5.082) | 0.035 ** (2.326) | 0.077 *** (4.767) | 0.041 *** (3.015) | 0.194 *** (4.283) |
| 2016 | 0.194 *** (2.408) | 0.036 ** (2.542) | 0.113 *** (3.845) | 0.279 *** (5.071) | 0.042 *** (2.735) | 0.051 *** (3.223) | 0.063 *** (3.287) | 0.193 *** (4.274) |
| 2017 | 0.186 *** (2.303) | 0.034 ** (2.481) | 0.146 *** (4.128) | 0.276 *** (5.035) | 0.036 ** (2.387) | 0.034 ** (2.269) | 0.089 *** (3.542) | 0.190 *** (4.241) |
| 2018 | 0.203 *** (2.515) | 0.030 ** (2.320) | 0.172 *** (4.306) | 0.271 *** (4.982) | 0.034 ** (2.300) | 0.042 *** (2.727) | 0.105 *** (3.716) | 0.186 *** (4.195) |
| 2019 | 0.208 *** (2.588) | 0.029 ** (2.253) | 0.158 *** (3.974) | 0.265 *** (4.908) | 0.035 ** (2.379) | 0.045 *** (2.884) | 0.092 *** (3.408) | 0.181 *** (4.132) |
| 2020 | 0.177 ** (2.188) | 0.024 ** (2.080) | 0.135 ** (3.189) | 0.257 *** (4.815) | 0.035 ** (2.371) | 0.032 ** (2.161) | 0.074 ** (2.753) | 0.175 *** (4.053) |
| 2021 | 0.208 *** (2.586) | 0.054 *** (3.400) | 0.111 ** (2.863) | 0.248 *** (4.706) | 0.036 ** (2.412) | 0.064 *** (3.999) | 0.058 ** (2.439) | 0.168 *** (3.961) |
| 2022 | 0.245 *** (3.056) | 0.042 *** (2.757) | 0.093 ** (2.577) | 0.237 *** (4.582) | 0.054 *** (3.465) | 0.047 *** (3.013) | 0.045 * (2.091) | 0.159 *** (3.854) |
Note: *, **, and *** indicate significant at the 10%, 5%, and 1% levels, respectively; robust standard errors in parentheses.
Table A2.
LM test results.
Table A2.
LM test results.
| W1 | W2 | |||||
|---|---|---|---|---|---|---|
| Spatial error: LM test | 18.760 *** | 2.969 ** | 19.228 *** | 2.313 ** | 0.142 ** | 4.130 ** |
| Spatial error: robust LM test | 0.897 ** | 0.714 * | 1.569 * | 3.177 * | 1.235 ** | 4.008 *** |
| spatial lag: LM test | 24.855 *** | 4.616 ** | 26.308 *** | 0.343 ** | 1.624 ** | 1.074 * |
| spatial lag: robust LM test | 6.992 *** | 2.360 * | 8.649 *** | 1.207 * | 2.717 *** | 0.952 * |
| Spatial lag: LR test | 101.330 *** | 17.130 *** | 89.940 *** | 228.500 *** | 54.110 *** | 231.120 *** |
| Spatial error: LR test | 137.140 *** | 16.960 *** | 116.940 *** | 237.490 *** | 51.310 *** | 244.950 *** |
| Hausman χ2 | 22.060 *** | 28.070 *** | 56.750 *** | 67.570 *** | 168.100 *** | 153.700 *** |
Note: *, **, and *** indicate significant at the 10%, 5%, and 1% levels, respectively.
References
- Meng, H.Y.; Qian, L.; Duan, K. Evaluating the impacts of flooding on crop yields by different meteorological indices: A regional case study in the middle-lower reach of the Yangtze River, China. Ecol. Indic. 2024, 162, 112068. [Google Scholar] [CrossRef]
- Su, Y.X.; Wang, J.; Li, J.H.; Wang, L.Z.; Wang, K.F.; Li, A.; Gao, L.; Wang, Z.; Wang, Z. Spatiotemporal changes and driving factors of reference evapotranspiration and crop evapotranspiration for cotton production in China from 1960 to 2019. Front. Environ. Sci. 2023, 11, 1251789. [Google Scholar] [CrossRef]
- Saseendran, S.A.; William, T.P.; Krishna, N.R.; Ma, L.; Fisher, D.K.; Sui, R. Climate-Optimized Planting Windows for Cotton in the Lower Mississippi Delta Region. Agronomy 2016, 6, 46. [Google Scholar] [CrossRef]
- Sanzidur, R. Impacts of climate change, agroecology and socio-economic factors on agricultural land use diversity in Bangladesh (1948–2008). Land Use Policy 2016, 50, 169–178. [Google Scholar] [CrossRef]
- Yuan, R.; Wang, K.; Ren, D.; Chen, Z.; Guo, B.; Zhang, H.; Li, D.; Zhao, C.; Han, S.; Li, H.; et al. An Analysis of Uncertainties in Evaluating Future Climate Change Impacts on Cotton Production and Water Use in China. Agronomy 2025, 15, 1209. [Google Scholar] [CrossRef]
- Zhang, X.; Zhou, X.; Liu, H.; Zhang, J.; Zhang, J.; Wei, S. The Impact of Factor Price Change on China’s Cotton Production Pattern Evolution: Mediation and Spillover Effects. Agriculture 2024, 14, 1145. [Google Scholar] [CrossRef]
- Bita, M. Assessing crop coefficient variability in arid and semi-arid regions: A meta-analytic approach. Field Crops Res. 2025, 333, 110101. [Google Scholar]
- Ram, A.J.; Dinesh, J.; Anita, K.; Kar, S.K.; Rawat, I.; Kumar, S.; Paramesh, V.; Meena, V.S.; Kaushal, R.; Kumar, K.; et al. Integrated watershed management for transforming dryland livelihoods: A climate-smart strategy for sustainable dryland agriculture in India. Watershed Ecol. Environ. 2025, 7, 159–177. [Google Scholar] [CrossRef]
- Singh, B.; Ehsan, M.A.; Robertson, A.W. Calibrated probabilistic sub-seasonal forecasting for Pakistan’s monsoon rainfall in 2022. Clim. Dyn. 2024, 62, 3375–3393. [Google Scholar] [CrossRef]
- Shwetha, M.N.; Devi, I.S.; Lavanya, T.; Meena, A. Comparative economic analysis of cotton cultivation in Adilabad and Nalgonda districts of Telangana, India: Insights for sustainable farming practices. Arch. Curr. Res. Int. 2024, 9, 309–316. [Google Scholar] [CrossRef]
- Nguyen, N.H.; Nguyen, T.T.T. Assuring Social Equity and Improving Income from an Assessment of Government’s Supports in a Pandemic and Migrant Workers’ Integration in Vietnam. Economies 2022, 10, 94. [Google Scholar] [CrossRef]
- Wang, X.; Ding, S.; Cao, W.; Fan, D.; Tang, B. Research on Network Patterns and Influencing Factors of Population Flow and Migration in the Yangtze River Delta Urban Agglomeration, China. Sustainability 2020, 12, 6803. [Google Scholar] [CrossRef]
- Wang, X.Y.; Li, D.; Yu, Y. Current situation and optimization countermeasures of cotton subsidy in China based on WTO rules. Agriculture 2022, 8, 1245. [Google Scholar] [CrossRef]
- Hao, W.; Hu, X.; Wu, G.; Zhang, Z.; Cai, M.; Zhou, H.; Liu, X. The impact of plot size and farm size on crop production: Evidence from mechanization and labor input perspectives. Energy Nexus 2025, 19, 100530. [Google Scholar] [CrossRef]
- Zhu, Y.; Wang, G.; Du, H.; Liu, J.; Yang, Q. The Effect of Agricultural Mechanization Services on the Technical Efficiency of Cotton Production. Agriculture 2025, 15, 1233. [Google Scholar] [CrossRef]
- Yu, G.; Lu, Z. Rural credit input, labor transfer and urban–rural income gap: Evidence from China. China Agric. Econ. Rev. 2021, 13, 872–893. [Google Scholar] [CrossRef]
- Hashmi, M.S.; Kamran, M.A.; Bakhsh, K.H.; Bashir, M.A. Role of socio-economic factors on scale efficiency of cotton farms. Bulg. J. Agric. Sci. 2016, 22, 358–367. [Google Scholar]
- Zhang, J.; Yang, T.; Deng, M. Ecosystem Services’ Supply–Demand Assessment and Ecological Management Zoning in Northwest China: A Perspective of the Water–Food–Ecology Nexus. Sustainability 2024, 16, 7223. [Google Scholar] [CrossRef]
- Zhang, P.; Hu, S.; Li, W.; Zhang, C. Parcel-level mapping of crops in a smallholder agricultural area: A case of central China using single-temporal VHSR imagery. Comput. Electron. Agric. 2020, 175, 105581. [Google Scholar] [CrossRef]
- Chrysomallidis, C.; Doukas, Y.E. Building Networks in the Agri-Food Chain: EU as Facilitator Toward Digital Transformation and “Greening” of Agricultural Sector. J. Int. Food Agribus. Mark. 2024, 36, 47–67. [Google Scholar] [CrossRef]
- Reshma, S.; Smitha, B. Minimum Support Price and Procurement Mechanism for Smallholder Paddy Farmers: An Effective Tool for Farm Price Risk Mitigation. J. Exp. Agric. Int. 2025, 47, 95–104. [Google Scholar] [CrossRef]
- Yao, L.; Si, W.; Si, R. Evaluating the Effects of the ‘Pilot Zone’ Policy on China’s Agricultural Green Development. Sustainability 2024, 16, 5149. [Google Scholar] [CrossRef]
- Elahi, E.; Zhu, M.; Khalid, Z.; Wei, K. An empirical analysis of carbon emission efficiency in food production across the Yangtze River basin: Towards sustainable agricultural development and carbon neutrality. Agric. Syst. 2024, 218, 103994. [Google Scholar] [CrossRef]
- Ba, X.; Wang, X.; Luo, X.; Zhong, Y. Assessment of the effect of the reward policy for major grain-producing counties on county governments’ incentives to support grain production. Front. Sustain. Food Syst. 2025, 9, 1600573. [Google Scholar] [CrossRef]
- Shi, M. The reduction of cotton cultivation in Shandong Province of China. China Agric. Econ. Rev. 2017, 4, 607–622. [Google Scholar] [CrossRef]
- Yan, W.; Huang, K. The effect of China’s domestic public storage on world market prices: The case of cotton. China Agric. Econ. Rev. 2021, 13, 756–780. [Google Scholar] [CrossRef]
- Yu, Z.; Yang, Y. Carbon footprint of global cotton production. Resour. Environ. Sustain. 2025, 20, 100214. [Google Scholar] [CrossRef]
- Sall, I.; Tronstad, R. Simultaneous Analysis of Insurance Participation and Acreage Response from Subsidized Crop Insurance for Cotton. J. Risk Financ. Manag. 2021, 14, 562. [Google Scholar] [CrossRef]
- Singh, A. Better Water and Land Allocation for Long-term Agricultural Sustainability. Water Resour. Manag. 2022, 36, 3505–3522. [Google Scholar] [CrossRef]
- Chen, L.L.; Peng, J.Q.; Zhang, W.B. Research on the Impact of Rural Land Transfer on Non-Farm Employment of Farm Households: Evidence from Hubei Province, China. Int. J. Environ. Res. Public Health 2022, 19, 15587. [Google Scholar] [CrossRef]
- Li, F.; Feng, S.Y.; Lu, H.L.; Qu, F.T.; Marijke, D.H. How do non-farm employment and agricultural mechanization impact on large-scale farming? A spatial panel data analysis from Jiangsu Province, China. Land Use Policy 2021, 107, 105517. [Google Scholar] [CrossRef]
- Han, W.; Liu, S.; Lei, Y.; Zhang, Y.; Han, Y.; Wang, G.; Feng, L.; Li, X.; Li, Y.; Wang, Z. Climate warming accelerates cotton growth while cultivar shifts extend the growth period. Field Crops Res. 2023, 293, 108850. [Google Scholar] [CrossRef]
- Maertens, M. Horticulture exports, agro-industrialization, and farm–nonfarm linkages with the smallholder farm sector: Evidence from Senegal. Agric. Econ. 2009, 2, 219–229. [Google Scholar] [CrossRef]
- Callaway, B.; Sant’Anna, P.H.C. Difference-in-Differences with multiple time periods. J. Econom. 2020, 225, 200–230. [Google Scholar] [CrossRef]
- Goldsmith-Pinkham, P.; Sorkin, I.; Swift, H. Bartik Instruments: What, When, Why, and How. Am. Econ. Rev. 2020, 110, 2586–2624. [Google Scholar] [CrossRef]
- Zhang, L.X.; Dong, Y.Q.; Liu, C.F.; Bai, Y.L. Off-farm employment over the past four decades in rural China. China Agric. Econ. Rev. 2018, 10, 190–214. [Google Scholar] [CrossRef]
- Chen, L.; Huang, Y.F.; Qin, X.Z.; Xu, W.P.; Qin, Y.W.; Li, X. Return migration and in-situ urbanization of 79 migrant sending counties in China: Characteristic and driving factors. J. Rural. Stud. 2023, 104, 103155. [Google Scholar] [CrossRef]
- Wang, Y.; Peng, S.; Huang, J.; Zhang, Y.; Feng, L.; Zhao, W.; Qi, H.; Zhou, G.; Deng, N. Prospects for cotton self-sufficiency in China by closing yield gaps. Eur. J. Agron. 2022, 133, 126437. [Google Scholar] [CrossRef]
- Sriram, J.; Kannan, S.V.; Ragavan, T.; Sheeba, S.; Sivasankari, B. Mechanization in cotton farming: Addressing labor shortages and enhancing productivity in India. J. Sci. Res. Rep. 2024, 10, 617–630. [Google Scholar] [CrossRef]
- Feng, L.; Wang, G.; Han, Y.; Li, Y.; Zhu, Y.; Zhou, Z.; Cao, W. Effects of planting pattern on growth and yield and economic benefits of cotton in a wheat-cotton double cropping system versus monoculture cotton. Field Crops Res. 2017, 213, 100–108. [Google Scholar] [CrossRef]
Disclaimer/Publisher’s Note: The statements, opinions and data contained in all publications are solely those of the individual author(s) and contributor(s) and not of MDPI and/or the editor(s). MDPI and/or the editor(s) disclaim responsibility for any injury to people or property resulting from any ideas, methods, instructions or products referred to in the content. |
© 2025 by the authors. Licensee MDPI, Basel, Switzerland. This article is an open access article distributed under the terms and conditions of the Creative Commons Attribution (CC BY) license (https://creativecommons.org/licenses/by/4.0/).