Abstract
Integrated urban–rural development is of great significance in promoting coordinated development in underdeveloped areas across provinces and advancing common prosperity. Previous studies have mostly focused on typical counties in single or developed areas, with insufficient exploration of integrated urban–rural development in underdeveloped areas. A total of 71 counties in Wuling Mountain area were taken as the research object, and a conceptual model of “element–structure–function” was constructed based on the theory of the urban–rural integration system. The entropy weight ideal point method, variation coefficient method, coupling coordination model, and obstacle model were employed to analyze the integrated urban–rural development in counties of the Wuling Mountain area during 2010 and 2023 from the five dimensions of population, economy, space, society, and ecology, and to explore their coupling coordination relationship and key obstacle factors. The research results indicate the following: (1) During the study period, the average annual growth rate of integrated urban–rural development was only 1.213%, showing a relatively low level. The spatial evolution exhibited a trend of “overall optimization–gap convergence–multipolar linkage–hot in the south and cold in the north”. (2) The comprehensive coupling coordination increased from 0.6380 in 2010 to 0.7016 in 2023, and the coupling coordination of “population–space” became the dominant mode. Nearly 60% of counties achieved a level upgrade from the transition stage to the coordination stage, and the multidimensional coordination relationship was mainly affected by the dual effects of spatial polarization and ecological constraints. (3) The obstacle of spatial integration ranked first and the mismatch of factors was severe. Land urbanization and population distribution imbalance were key obstacles, and their core contradictions were concentrated in the tripartite dilemma of “extensive land utilization–factor blockage–ecological antagonism”. It is urgent to achieve coordinated and sustainable development of urban and rural integration through market-oriented reforms of two-way factor flow. The conceptual model of “element–structure–function” constructed by the research results can provide a theoretical tool for analyzing the integrated development of urban and rural areas in counties, and can provide decision support for solving the dilemma of element mismatch.
1. Introduction
China has become one of the countries with the most prominent urban–rural conflicts in the world [,]. In the new era, the contradiction between imbalanced urban and rural development and insufficient rural development are more obvious [,,]. Solving the “three rural issues” is the top priority of the Chinese government, and the integrated urban–rural development is an effective way to solve the issues. The coordinated development of urban–rural integration follows Marx’s materialist historical logic on the concept of urban–rural relations from opposition to integration [], and reflects Fei Xiaotong’s “urban–rural organic circulation theory” on the complementary functions of urban–rural areas []. As a bridge for “interacting between workers and peasants, connecting cities and villages, and linking the past and future”, there is a consensus among the academic community that the county can act as an entry point to promote integrated urban–rural development.
At present, the research on the issue of integrated urban–rural development focuses on theoretical discussions and practical exploration. From the ideological collision of the “urban bias” theory and the “rural–urban strategy” [,] to the paradigm improvement of the “urban–rural dynamics” theory and the urban–rural integration system theory [,], theoretical achievements are constantly systematic and theoretical. In terms of practical exploration, the discussion on the measurement of urban–rural integration development at the county level [,], type mode [], scale characteristics [], institutional policies [], and other contents have been continuously deepened, providing scientific support for the construction of theoretical systems and the exploration of practical paths. However, as the research progresses in depth, scholars have gradually discovered the deep tension between classical theories and the practice of urban–rural relations in China. Lewis’s “dual sector model” theory believes that the urban–rural gap will naturally narrow with the deepening of modern sector capital, and its economic duality may even disappear []. It has been proven through practice that China has difficulty in achieving a direct transformation from a dual sector to one sector. It needs to go through the evolution of “dual sector → three sector → one sector”, and its root cause lies in the fact that the dual urban–rural structure is solidified by the system []. Academic and political circles are committed to finding the “Archimedes fulcrum” that leverages the dual integration of urban and rural areas, in order to break the dual system in the evolution process of “solidification → interaction → integration” between urban and rural areas []. However, the urban–rural relationship in counties has evolved into a tripartite structure of distinguished integration in urban and rural areas []. Due to the lack of segmentation and integration mechanisms [], problems such as “spatial mismatch”, “urban disease”, and “rural disease” are still highlighted []. Therefore, the research on urban–rural integration in counties should focus on the localization of theory and practice.
Although the academic community has reached a consensus, the strategic transformation in counties is still in its early stages. It is undoubted that underdeveloped regions are a key and difficult point of Chinese-style modernization, so their high-quality development requires a grasp of their peculiarity from their common characteristics. The regional differences in urban and rural development in the eastern and western counties are extremely significant. The economic scale of the counties in the western part is only equivalent to that of the towns in the eastern part, while the area of the counties in the western part is far greater than that of those in the eastern part. Therefore, the existing research in the academic community focuses on the theoretical connotation of urban–rural integration at the county level [,], internal logic [,], measurement evaluation [,], and strategic paths [,,,,,] under the new research paradigm of “Chinese counties”, but there are still several limitations. First, the research on “county governance” and “integrated urban–rural development” is limited [,,], and there are few combined explorations; in particular, the urban–rural integration research system at the county level is not yet sound. It is urgent to improve the “element–structure–function” analysis framework [], and further explore the core issues such as rural revitalization, county–township, and urban–rural relations in a more in-depth manner. Second, there is a lack of investigation on the construction of element evaluation systems and the combined interaction effects. The focus is biased, and there is insufficient attention to the humanistic, spatial, and ecological dimensions. Third, the research scales are mostly macro, and further exploration is needed for the portrayal of factual characteristics of urban–rural integration at the county-level scale, extraction of coordinated relationships, and diagnosis of obstacle factors.
Wuling Mountain area has multiple characteristics including ethnic minority settlements, contiguous poverty-stricken areas, and regional economic cooperation hubs. The urban–rural development shows a complex dual structure [], and it also faces problems such as factor flow obstacles, insufficient industrial integration, and uneven public services. The ecological environment is relatively fragile, and the development process of urban–rural integration in counties is relatively slow. What primary challenges emerge during county-level urban–rural integration? How do these challenges influence the integration process through element–structure–function mechanisms? How can their coordination relationships be quantified and barrier factors identified? To answer these questions, 71 counties in Wuling Mountain area are selected as the research samples to analyze the urban–rural integration development and coupling coordination relationships at the county level from 2010 to 2023, and to identify key obstacle factors, providing a theoretical reference for integrated urban–rural development in underdeveloped areas in western China. Three principal innovations emerge from this study: (1) The proposed “element–structure–function” conceptual framework theoretically elucidates bidirectional feedback loops within urban–rural composite systems. (2) Integrating the population, economic, spatial, social, and ecological dimensions into the analytical framework yields a more robust evaluation system for county-level urban–rural integration. This approach broadens the scholarly discourse on development challenges specific to less developed regions.
2. Research Areas and Research Methods
2.1. Research Area
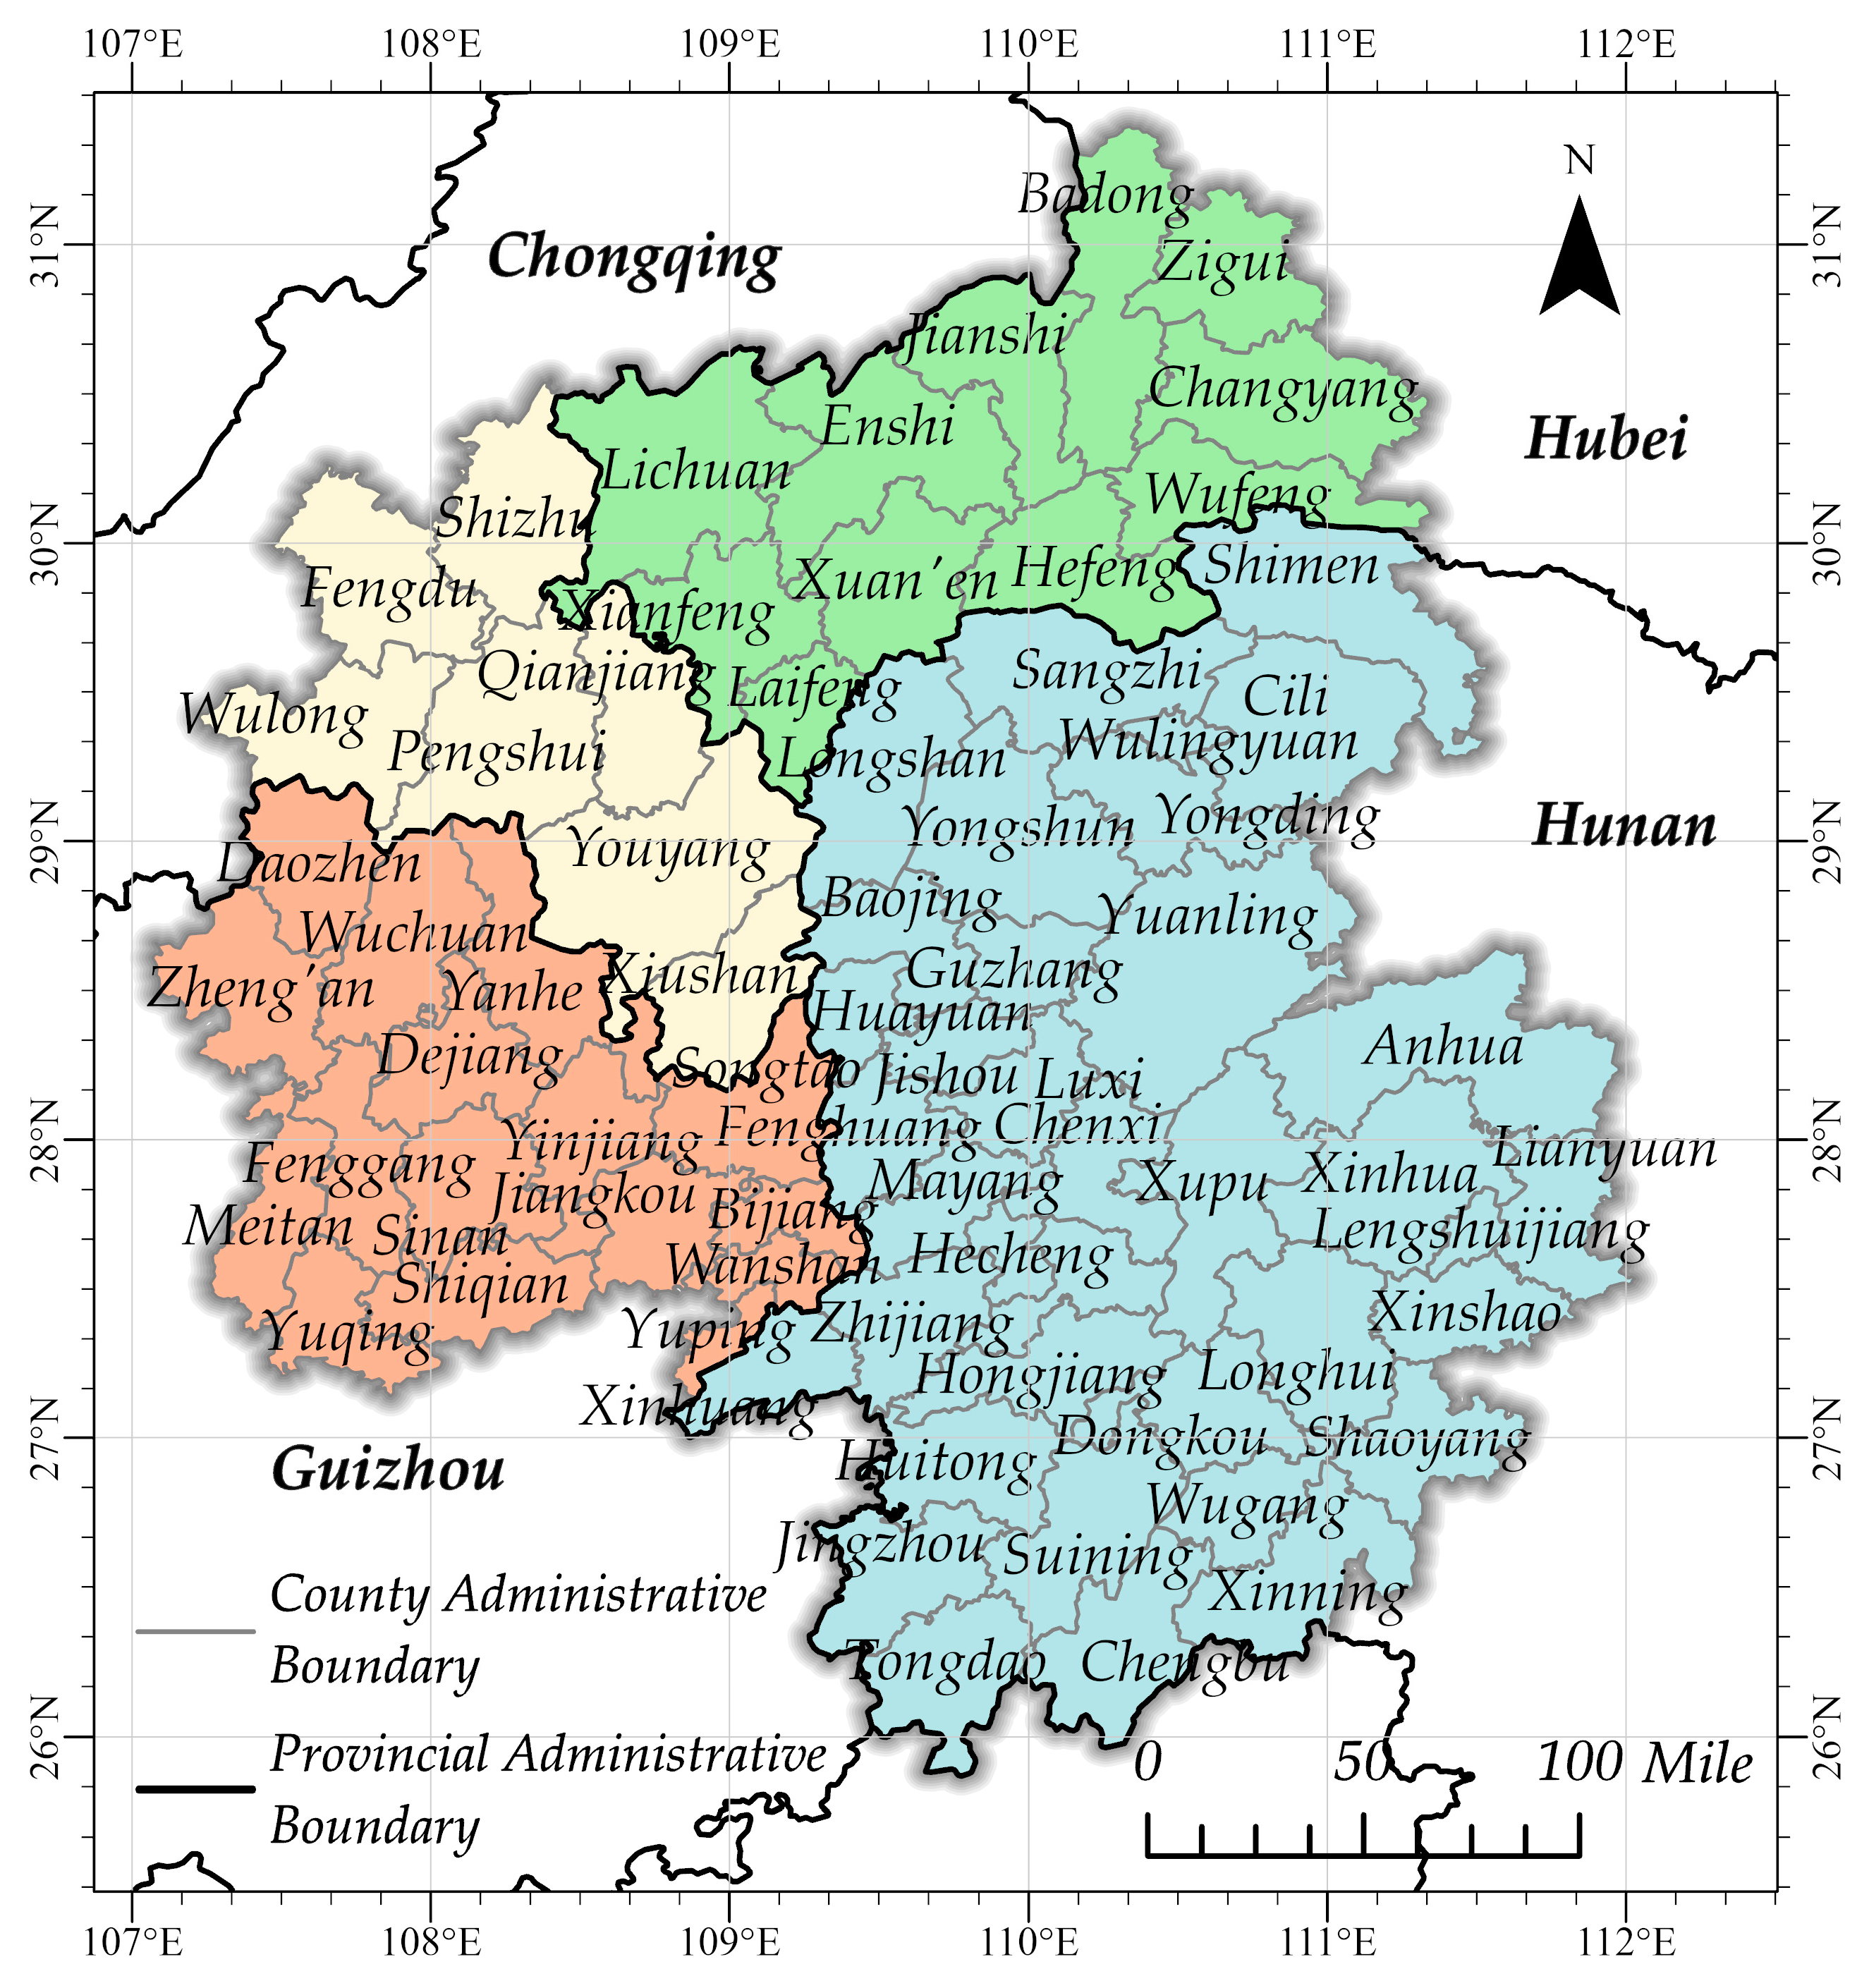
A total of 71 county units (administrative unit second only to prefecture-level cities) are selected in Wuling Mountain area (including counties, municipal districts, county-level cities, and autonomous counties) as the research objects. Wuling Mountain area covers an area of about 110,000 square kilometers and has a population of about 23 million, of which ethnic minorities account for about 48.9%. It is the largest and most populous ethnic minority settlement in China’s inland cross-provincial border area. It is also one of the national key ecological functional areas. Our study comprises 71 county-level administrative units. These are identified through the officially defined geographic coverage in China’s State Council-approved Wuling Mountain Area Regional Development and Poverty Alleviation Plan (2011–2020). This selection framework systematically includes every county-level division within the targeted region. It spans the border areas of Hunan, Guizhou, Hubei, and Chongqing, and covers 71 counties (cities and districts), including 37 in Hunan, 16 in Guizhou, 11 in Hubei, and 7 in Chongqing (Figure 1). Due to the impact of complex terrain and lagging social and economic development, the urbanization rate in the district is lower than the national average by 65.22% []. Since 2011, Wuling Mountain area has been included in the national overall development strategy, and the Wuling Mountain Economic Cooperation Zone has also become one of the key areas for the new round of western development. As of 2021, the urban population of counties and county-level cities accounted for about 30% of the national urban population, and their number accounted for about 65% of the county-level administrative divisions []. According to the existing forecast [], the average population of counties will increase to about 110,000 by 2025, and the proportion of the urban population will remain at about 18%. The six central cities in the district, such as Zhangjiajie, Jishou, Huaihua, Tongren, Enshi, and Qianjiang, play a core leading role in promoting the integrated urban–rural development.
Figure 1.
Location map of Wuling Mountain area. Note: Made strictly based on the base map from the standard map service website of the Map Technology Review Center under the Ministry of Natural Resources (Map Review Number: GS (2024) 0650), with no modification to the boundary.
2.2. Data Source
The time span of this research covered the complete statistical cycle from 2010 to 2023, and the data consisted of basic statistical data and dynamic government data. The former was mainly derived from authoritative publications such as China Urban Statistical Yearbook and China County Statistical Yearbook compiled by the National Bureau of Statistics from 2011 to 2024, and it integrated local statistical yearbooks of Hunan, Guizhou, Hubei, and Chongqing. For the latter, we systematically collected statistical bulletins, annual work reports, and other documents issued by county-level governments, and supplemented them with EPS and Wind professional database information. For key indicators with statistical differences in different provinces or years, the original indicator definitions were strictly checked, and synonymous replacement or calculation rules were uniformly processed according to the latest definition of the National Bureau of Statistics. For individual missing data, reasonable filling was performed with the linear interpolation method, and then data analysis and graph drawing were completed using MATLAB R2024a, Origin 2024, and ArcGIS Pro 3.0 software.
2.3. Research Method
2.3.1. Construction of Evaluation System
Based on the “element–structure–function” analysis framework, the development reality of 71 counties (cities, districts) in Wuling Mountain, and the existing research results of the evaluation index system of integrated urban–rural development [,,,,,], 15 relevant indicators were selected from the five dimensions of population integration, economic integration, spatial integration, social integration, and ecological integration to build a county-level urban–rural integration evaluation index system (Table 1). These five dimensions constitute an interconnected and mutually constraining system. Population integration acts as the core driver, restructuring urban and rural elements. Serving as the crucial link, economic integration fosters interactive development between urban and rural economies. Spatial integration provides the physical foundation for functional connectivity across urban and rural areas. Functioning as a key safeguard, social integration enhances equity in resident well-being. Ecological integration establishes a sustainable basis, maintaining a symbiotic environment for both communities. Collectively, they shape a progressive development pathway for the urban–rural system: initiating with element mobility (elements), advancing through structural optimization (structure), and culminating in functional enhancement (function).
Table 1.
Evaluation index system of integrated urban-rural development at county level.
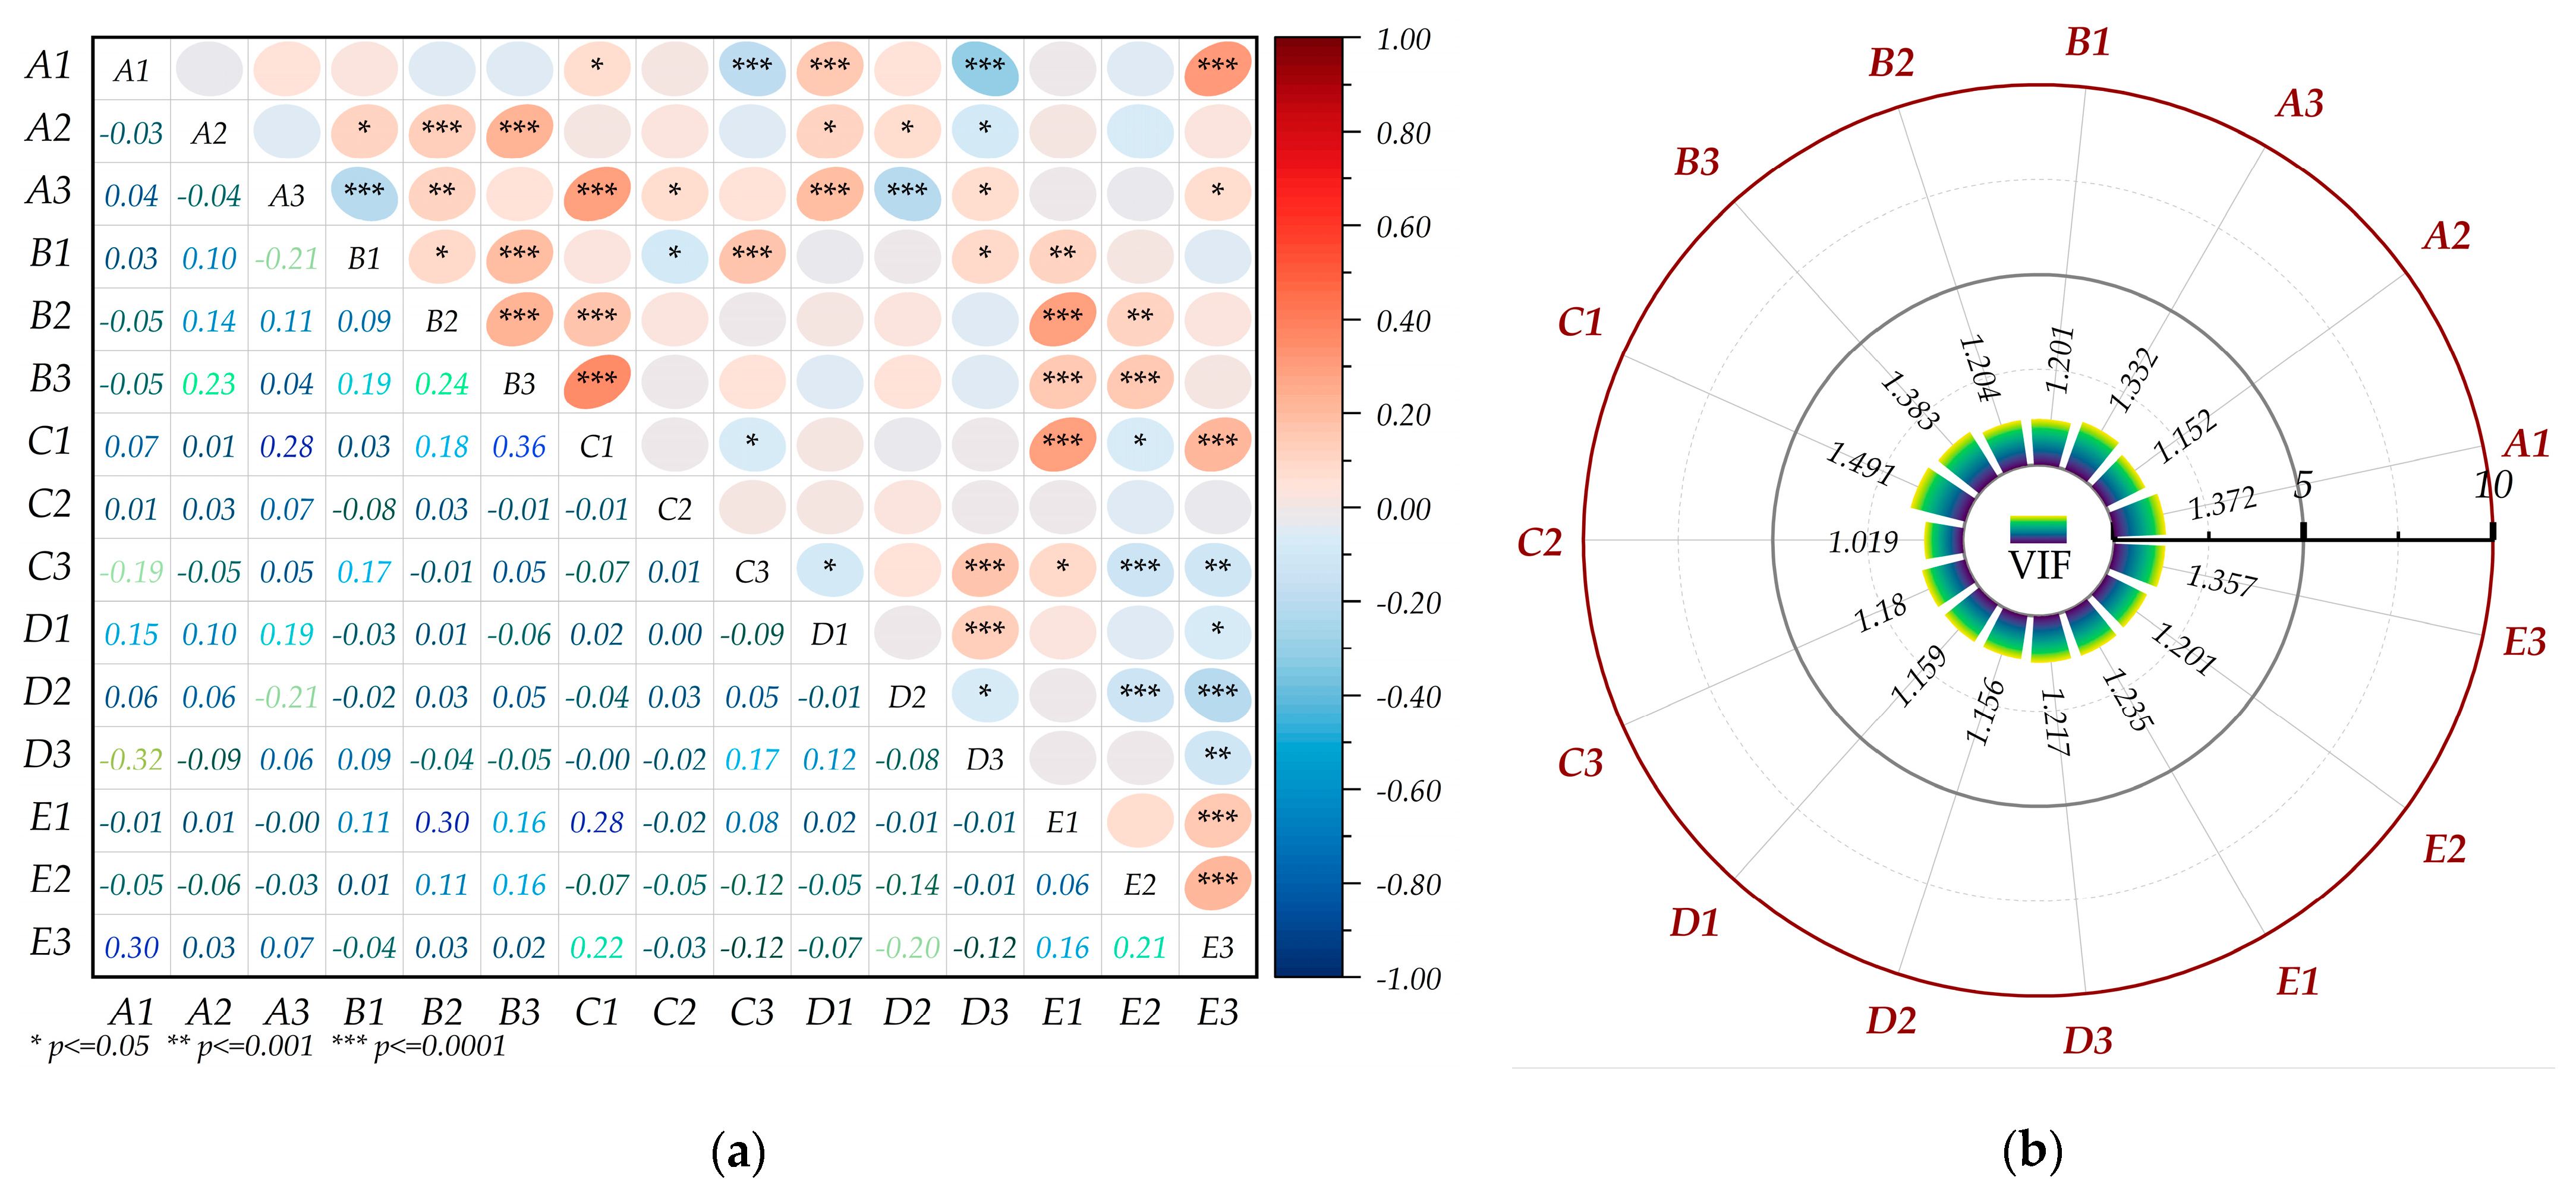
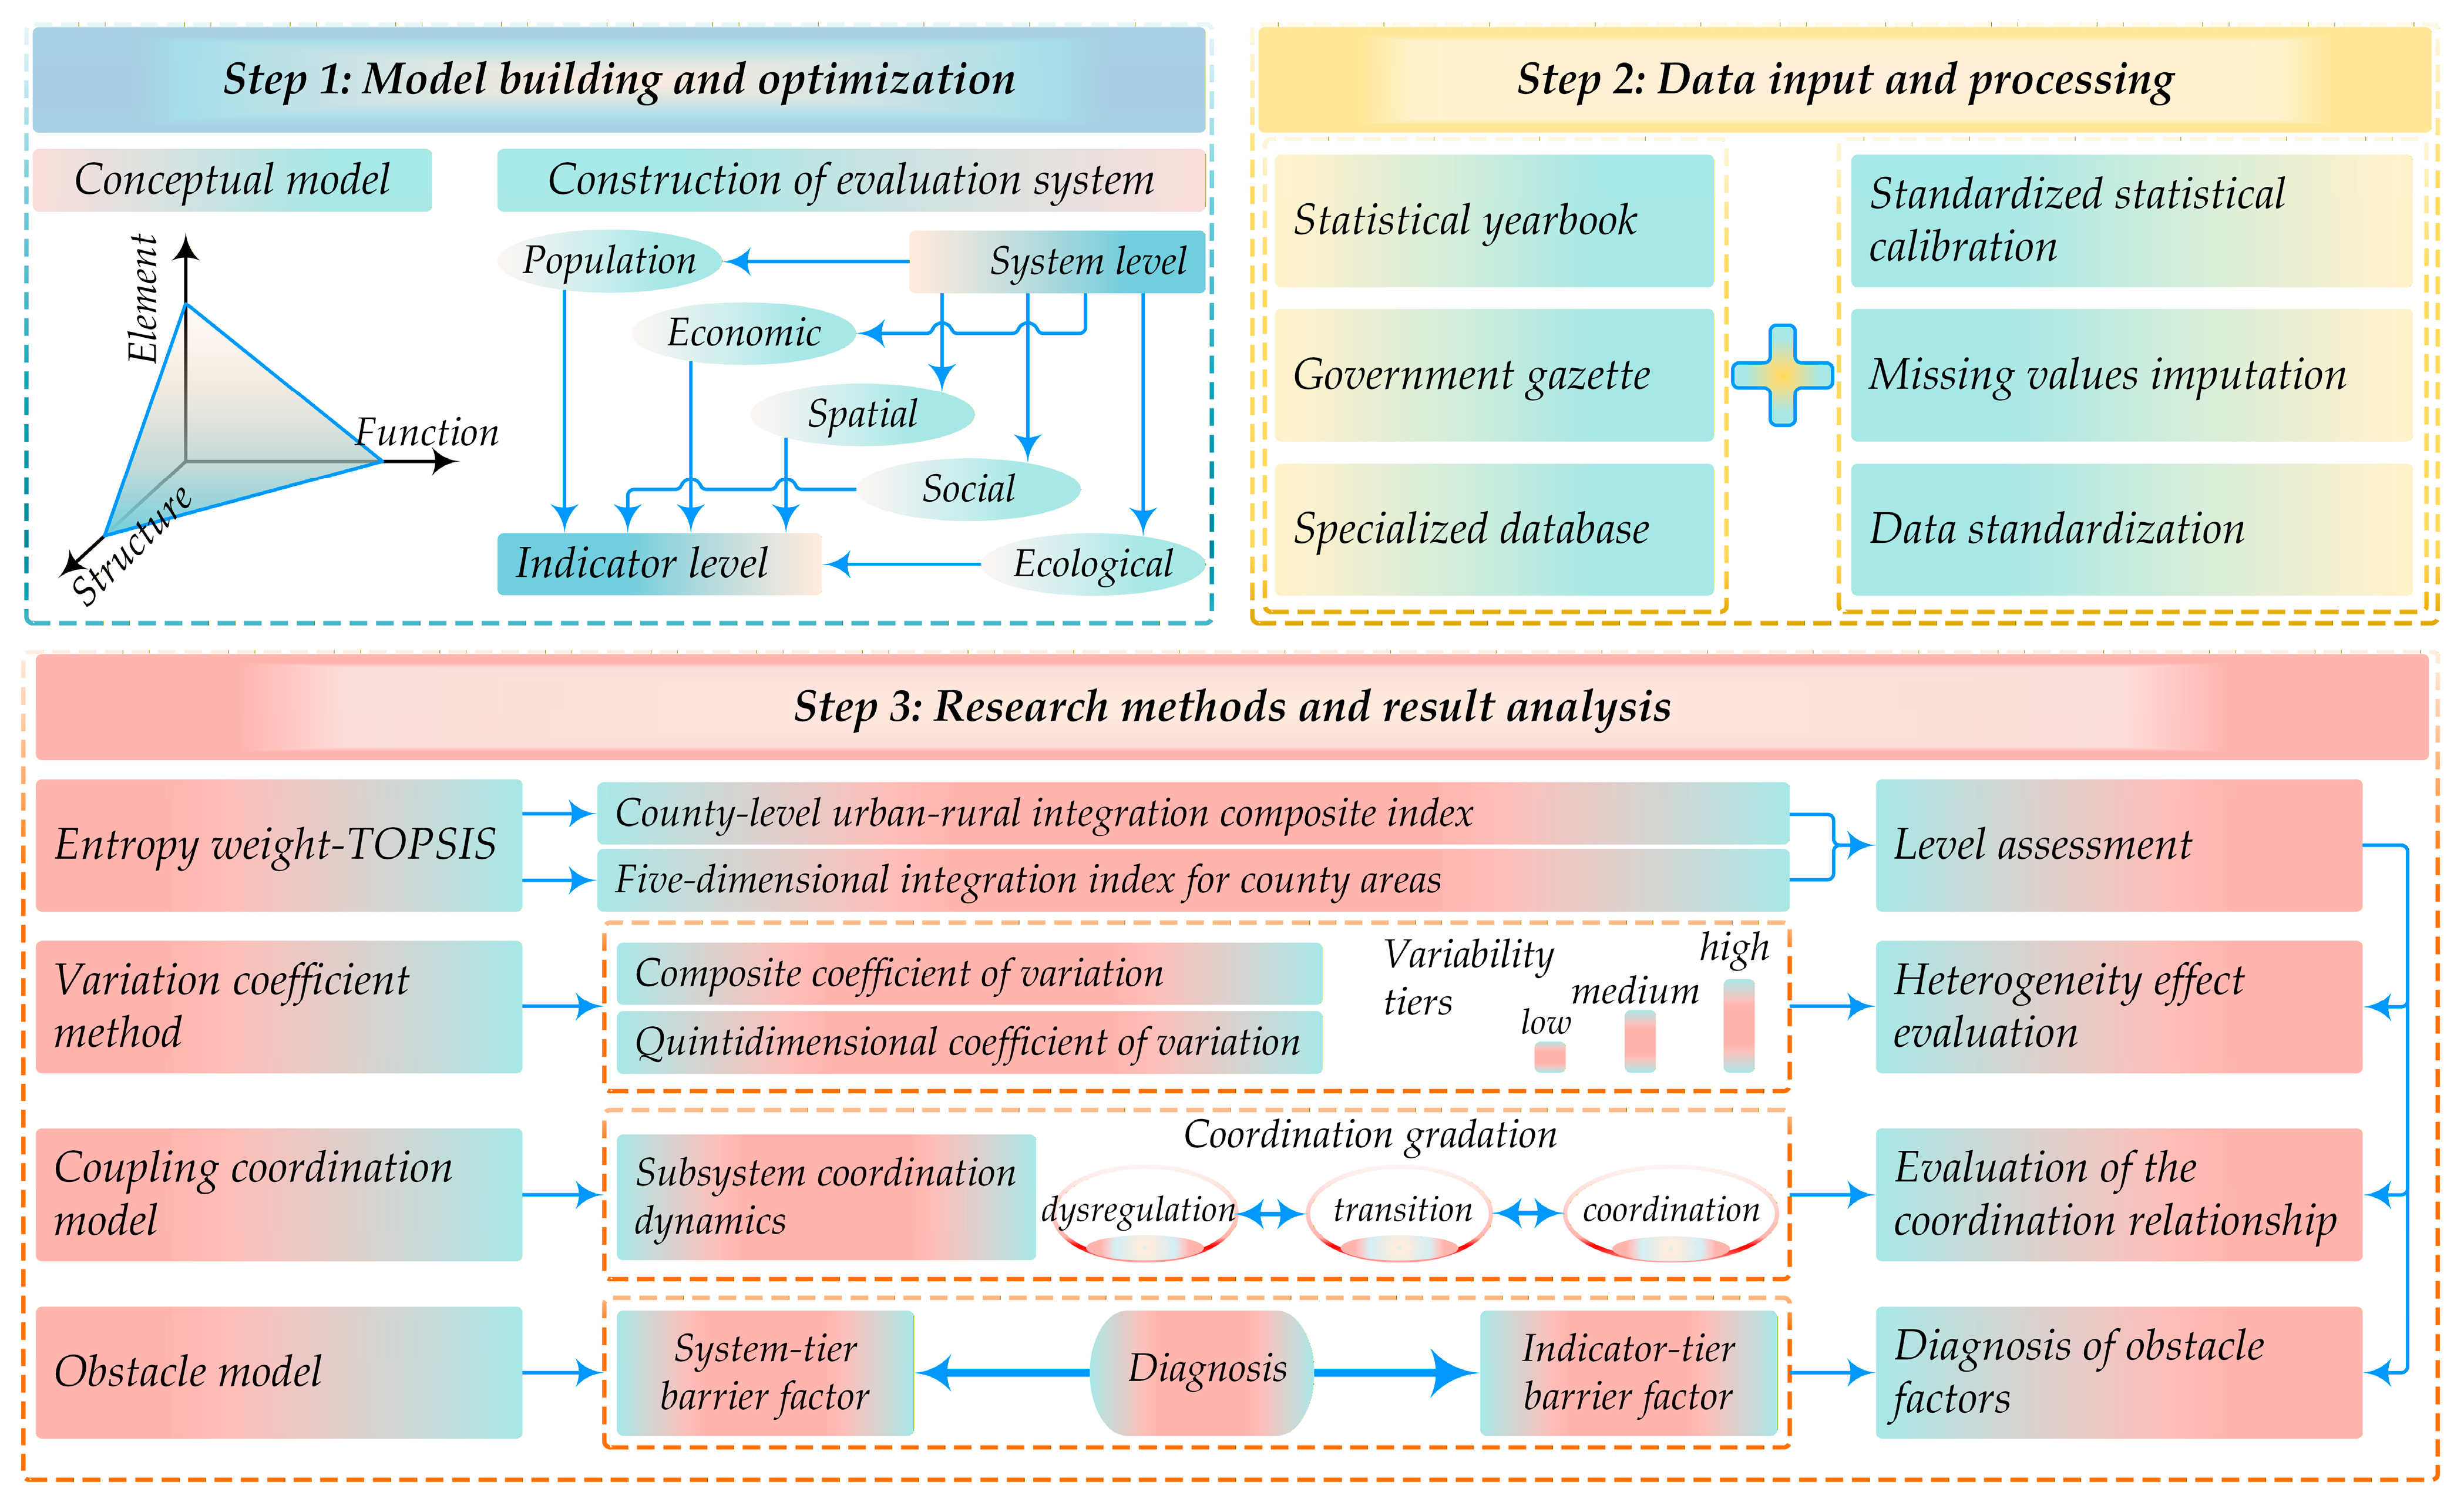
Although certain indicators share conceptual associations, they measure distinct yet complementary aspects within the same dimension. Their complementarity empirically outweighs potential overlap. The principle for assigning indicator directionality is clear: a positive indicator signifies that higher values correspond to greater integration levels, while a negative indicator denotes that increased values impede integration progress. Key examples illustrate this logic. For instance, higher values in ratio indicators such as “urban–rural income gap” (B1) and “urban–rural consumption gap” (B2) reflect a widening gap, negatively impacting integration; hence, both are negative. Similarly, a higher value for “environmental agriculture production” (E3)—indicating greater fertilizer application per unit sown area—signals increased environmental pressure, justifying its negative designation. To assess potential multicollinearity, this study calculated the Pearson correlation coefficient matrix among indicators and their corresponding Variance Inflation Factors (VIFs), presented in Figure 2. Analysis shows that the absolute values of all correlation coefficients remain under 0.8, and every VIF value is well below the threshold of 5. These results confirm the absence of severe multicollinearity. The observed independence among indicators thus validates their suitability for model construction. Because indicator selection must balance complexity, data availability, and scientific rigor, no index system can be fully exhaustive, and subjective arbitrariness must be avoided. Given the significant regional variations in population, land use, and culture across the 71 Wuling Mountain counties, this study employed relative indicators. Entropy weight–TOPSIS was then applied to measure county-level urban–rural integrated development. The technical pathway is detailed in Figure 3: evaluation index system of integrated urban–rural development at the county level.
Figure 2.
The indicator correlation matrix and Variance Inflation Factor (VIF): (a) Pearson correlation coefficient matrix; (b) Variance Inflation Factor (VIF).
Figure 3.
Technical pathway.
2.3.2. Conceptual Framework Model
The “city” within a county refers to the county and the central town, which is the core gathering place for population, industry, and services [,,]. The “town” refers to the rural settlements outside the county and the central town and the space they carry [,]. As an advanced form of the evolution of the relationship between the two, the internal mechanism of integrated urban–rural development at the county-level can be systematically deconstructed through the “element–structure–function” system analysis framework. “Elements” are the source of power and the logical starting point for urban–rural integration. Their free, two-way, and efficient flow are the fundamental prerequisites for breaking down the dual barriers between urban and rural areas and generating integrated power []. They not only cover the population represented by the index levels A1 and A2, and the land referred to by C1 and C3, but also include core resources such as capital, industry, and technology reflected by B3 and A3. The city and the town closely interact through the flow of people, logistics, capital, and information, and complement each other in functions. The city focuses on public services, employment market, and technology diffusion, while the town focuses on the supply of ecological products and agricultural products and cultural heritage [,,,,]. The “structure” is composed of five system levels, and the relatively stable system synergy relationship formed by the combination of specific elements and interactions is not a simple pile of indicators. The coupling coordination degree of the five system levels is intended to reveal the connection density and operating order between subsystems within urban and rural systems, and their coordination level is positively correlated with the overall efficiency of the system. The “function” refers to the specific performance output displayed by the system under the support of a specific structure, and it ultimately promotes the qualitative change and leap in the overall value of urban–rural integration at the county-level from basic guarantee and dominance to the hierarchical and progressive value manifestation of derived values.
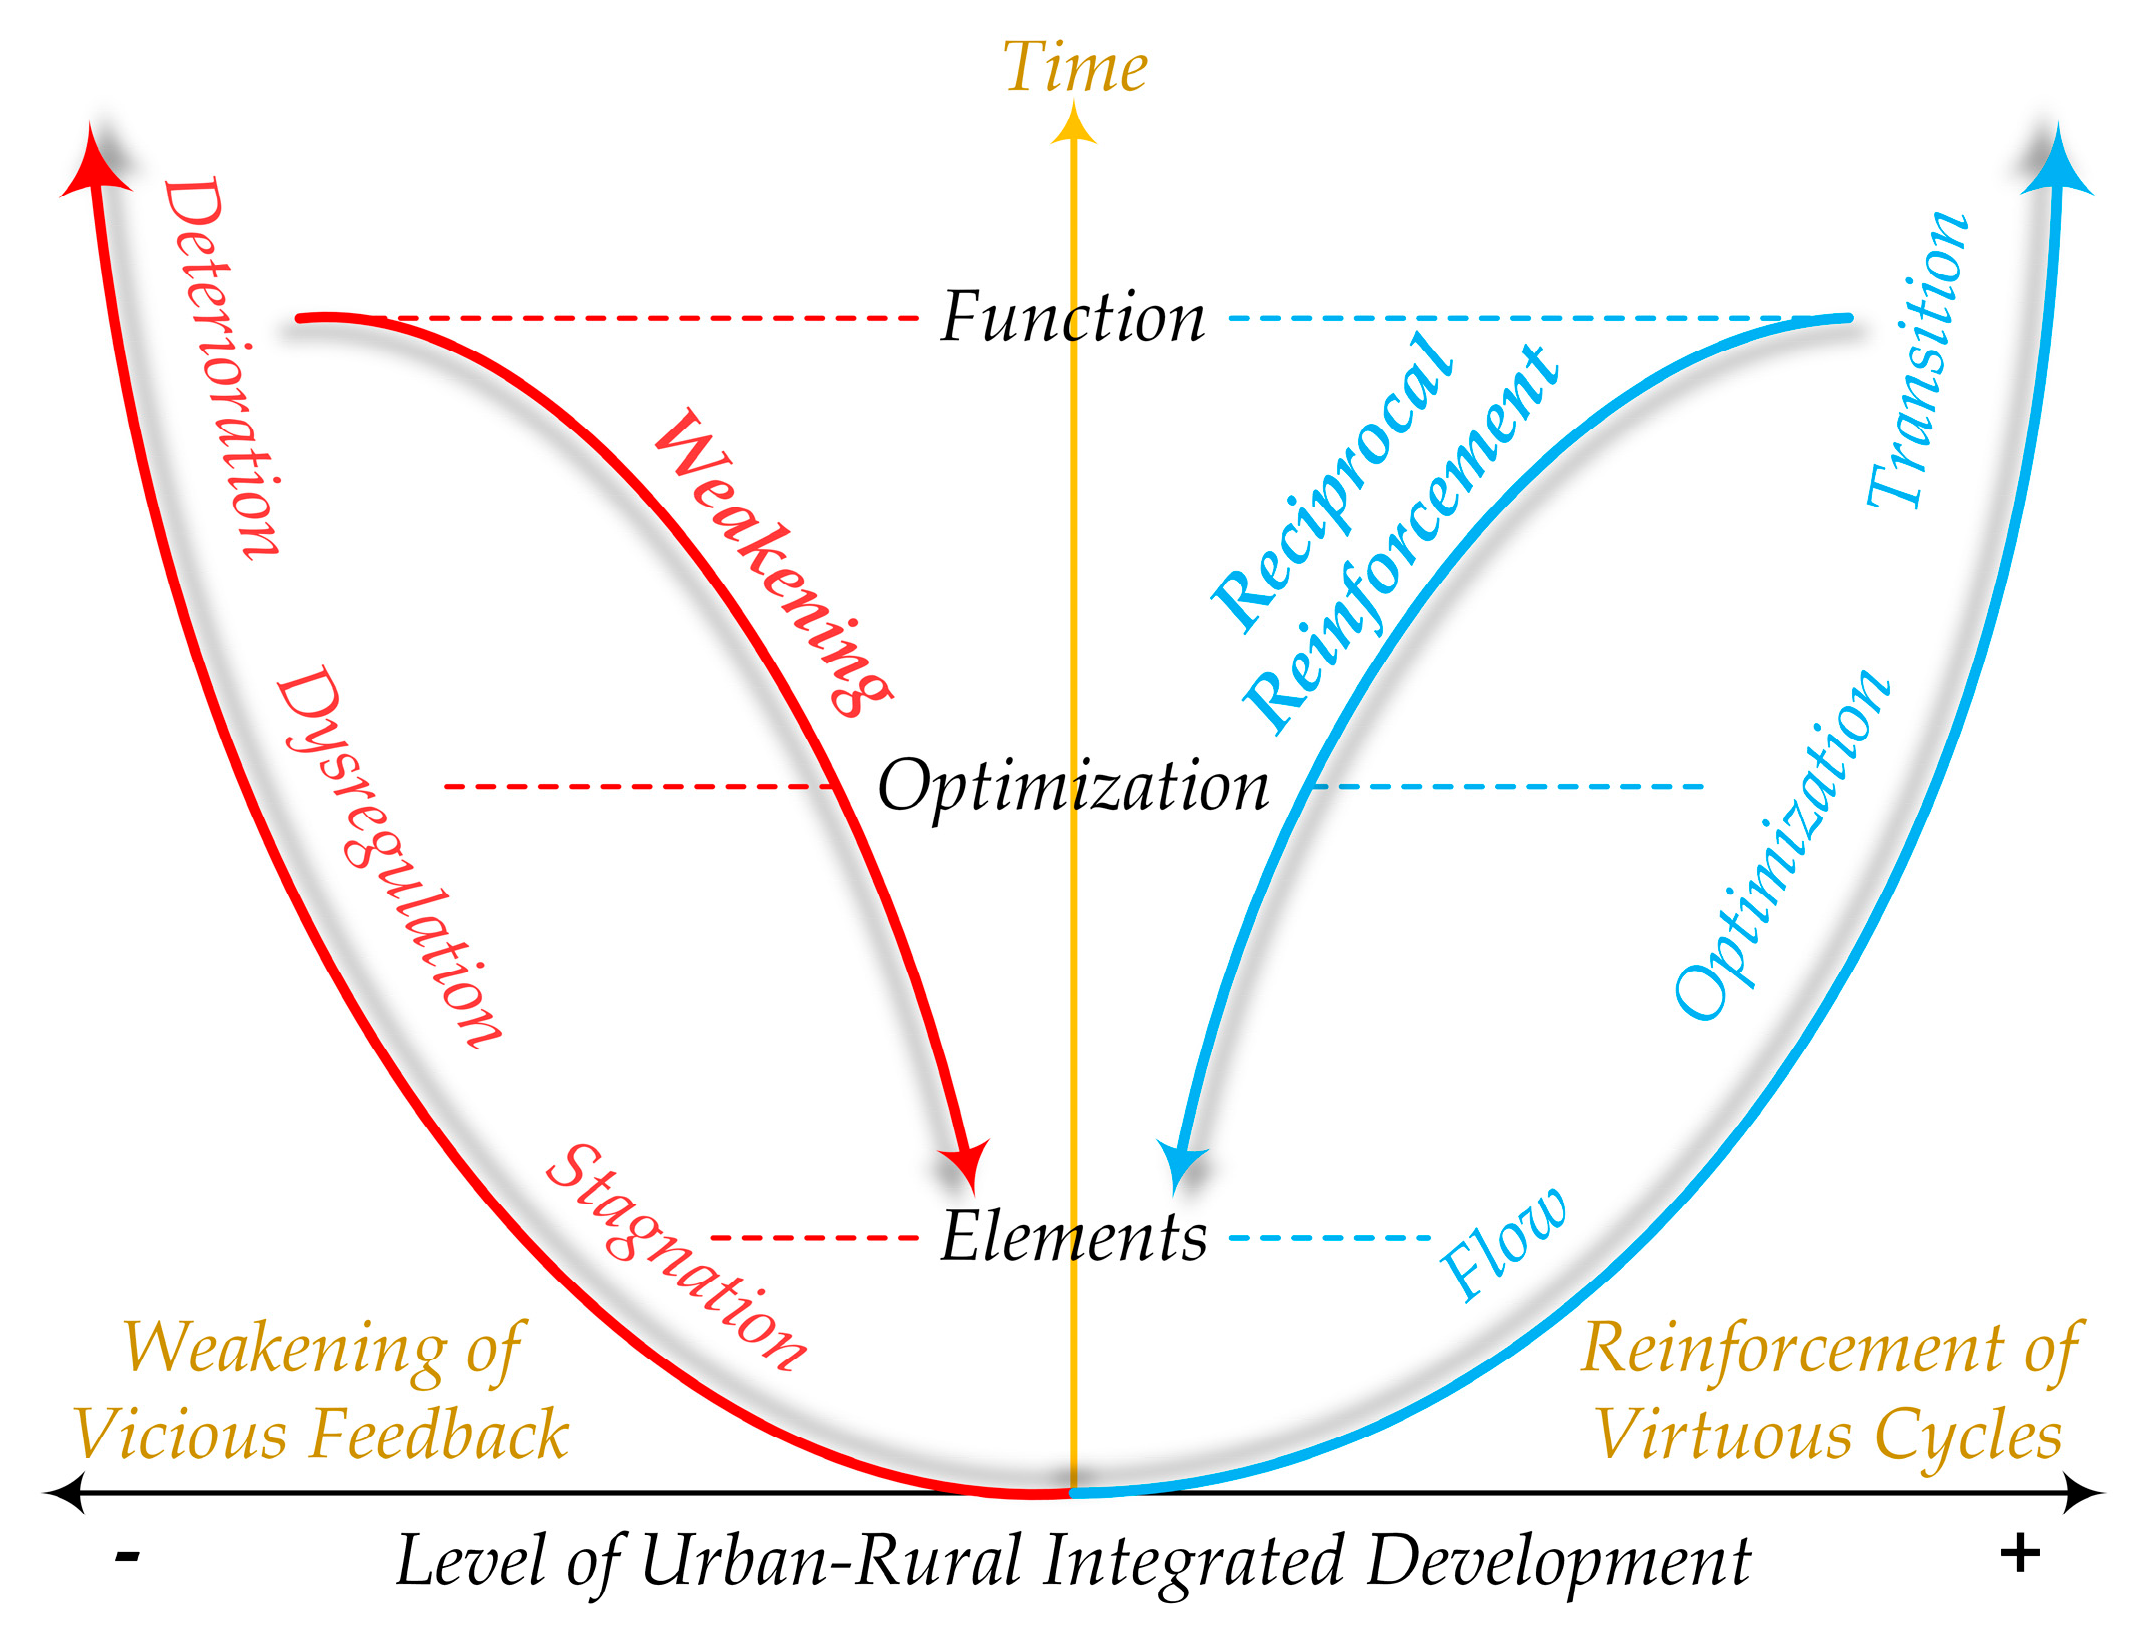
The evolution of urban–rural integration follows the closed-loop feedback path of “element → structure → function”. Indeed, the tripartite dilemma of “extensive land utilization–factor blockage–ecological antagonism” is a negative cycle of this feedback path. Because the “extensive land utilization” poses physical and institutional obstacles to the flow of high-quality elements such as capital and talents, it has caused “factor blockage”. At this time, if the flow of elements is hindered, the urban and rural system structure is unbalanced and difficult to optimize, resulting in the stagnation of the process of industrial upgrading and public service equalization. In order to maintain operation, the system is forced to break through the “ecological threshold” of the ecosystem carrying capacity at the expense of long-term interests, and it causes functional decline—“ecological antagonism”. The deterioration of the functional level will also affect the element level, further weakening the regional attractiveness and aggravating the loss of elements. It thus forms a closed loop of weakened vicious feedback, locking the county into the dilemma of low-level development. The closed loop strengthened by a virtuous cycle is the opposite. This study is supported by the theory of the urban–rural integration system, and has established a conceptual framework model of “factor flow → structural adaptation → functional realization” (Figure 4) based on experience from the literature [,]. This model reveals the systematic evolution logic of urban–rural integration, and also integrates dynamic feedback and multidimensional coupling mechanisms, providing theoretical references and practical guidance for urban–rural integration research.
Figure 4.
Conceptual model of “element–structure–function” for urban–rural integration.
2.3.3. Coupling Coordination Model
Methods such as the entropy weight–TOPSIS [,], variation coefficient method [], coupling coordination model [], and obstacle model [] are employed in this study. Entropy weight–TOPSIS characterizes its contribution weight to the system level through the information of each evaluation indicator, and accurately quantifies the level of urban–rural integration in counties. The variation coefficient method represents the degree of dispersion between integrated urban–rural development elements and reveals their heterogeneity characteristics. The coupling coordination model analyzes multidimensional coordination relationships such as population, economy, space, society, and ecology and their impact on the integrated development of urban and rural areas at the county level. In order to accurately trace the source and diagnose the core shortcomings that restrict the integration process of each county, an obstacle model has been introduced. In other words, the combination of the four forms a relatively complete closed loop, which is suitable for research on the integrated development of urban and rural areas in Wuling Mountain. Admittedly, the above methods still have certain limitations. The entropy weight method relies on data distribution. If the numerical variation in a certain indicator is extremely small, its weight may be underestimated. The TOPSIS results are more sensitive to extreme values and are still within the category of objective empowerment. The availability, timeliness, and statistical differences in cross-sectional data at the county level are relatively limited in explanation, which may restrict the depth of analysis. The validity of the coupling coordination model and obstacle model is heavily reliant on the scientific soundness and data quality of the index system.
Based on Cong Xiaonan’s coupling degree model [], the overall and sub-dimensional levels of urban–rural integration in Wuling Mountain area have been measured. The calculation formula is
where is the system value, is the number of systems (), and C is the coupling degree, with a value between 0 and 1, and the coupling degree is meaningless in the case of . Since the coupling degree can only characterize the interaction relationship between each subsystem, it fails to effectively reflect the coordination status of each subsystem. Therefore, it is necessary to further introduce a coupling coordination model to measure the coordination status of interactive coupling between each subsystem. The calculation formula is
where is coupling coordination; is coordination index; and are the coefficients to be determined, respectively. Considering that the five subsystems of population, economy, space, society, and ecology are equally important and cannot be biased, they are all 1/5.
In order to further reveal the main obstacle factors affecting the coordination of urban and rural integration and their effects on the coupling coordination relationship in Wuling Mountain area, an obstacle model has been introduced for measurement and sequencing. The calculation formula is
where is the obstacle degree of each subsystem, is the obstacle degree of the th index, is the index value of the dimensionless process, is the weight of the th index, and is the number of indicators.
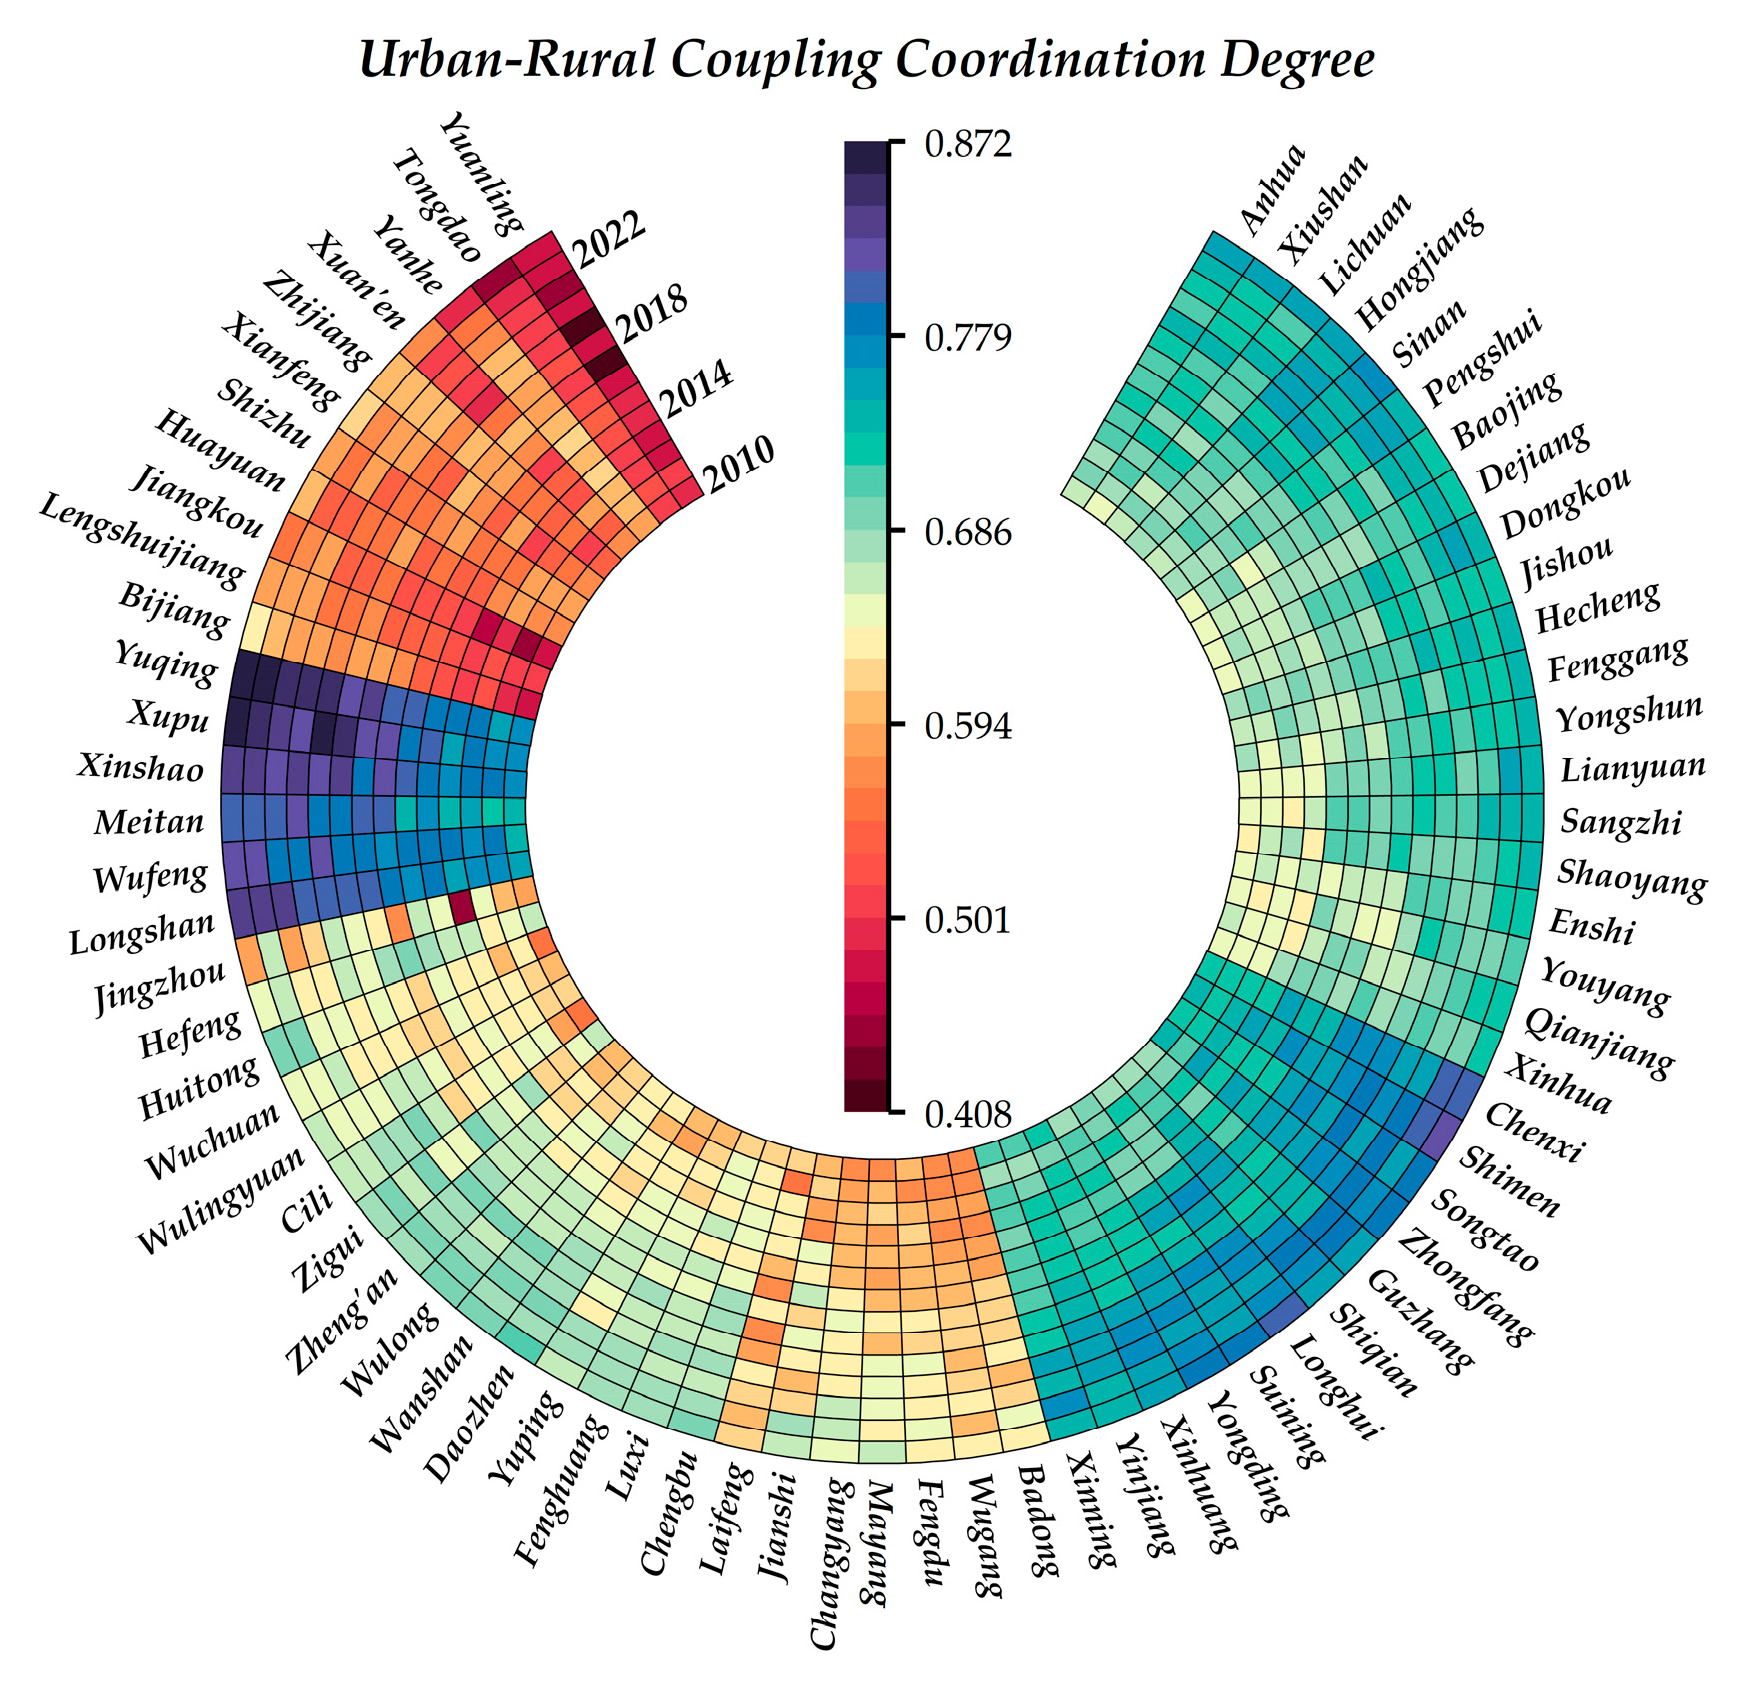
With reference to existing research experience [,], the coupling coordination levels of urban–rural integration in Wuling Mountain area have been classified based on the characteristics of the research area (Table 2). Since the value range of coupling degree is (0, 1] in the model, the value is calculated from the coupling of five subsystems: population, economy, space, society, and ecology. The closer is to 1, the higher the coupling coordination of the system. Each subsystem is equally important, and the to-be-determined coefficients are all assigned to 1/5. If the values of each subsystem are small, then the value is smaller, and vice versa. From the system values after standardization, the relationship between the values of the five subsystems is not completely positively correlated. If the system value of the economy is smaller, the system values of space, society, and ecology are larger. It can be seen that the greater value is superior to the model alone, but it is not ideal from the perspective of the system values. It is generally believed that the value of coupling coordination is basically determined by taking 0.5 as the critical point of judging the deviation and coordination, with fewer <0.1 and >0.9 [,]. In addition, from the five subsystem values in Figure 5, the other subsystem values are generally less than 0.5, except for the economic subsystem. Considering that the counties with system values greater than 0.6 in Figure 6 have presented higher urban–rural integration levels, they are basically found to be between 0.4 and 0.9 from the numerical values of urban–rural integration coordination in the 71 counties in Figure 7. Therefore, based on the above-mentioned experience and critical points, the value is divided into ten levels by aliquot and classified into the three stages of offset, transition, and coordination.
Table 2.
Classification standards for coupling coordination degrees.
Figure 5.
Five-dimensional urban–rural integration in Wuling Mountain area: spatiotemporal trends across four provincial regions. It shows regionalization of (a) five-dimensional evolution trajectories and (b) evolution trajectories of four provinces (cities).
Figure 6.
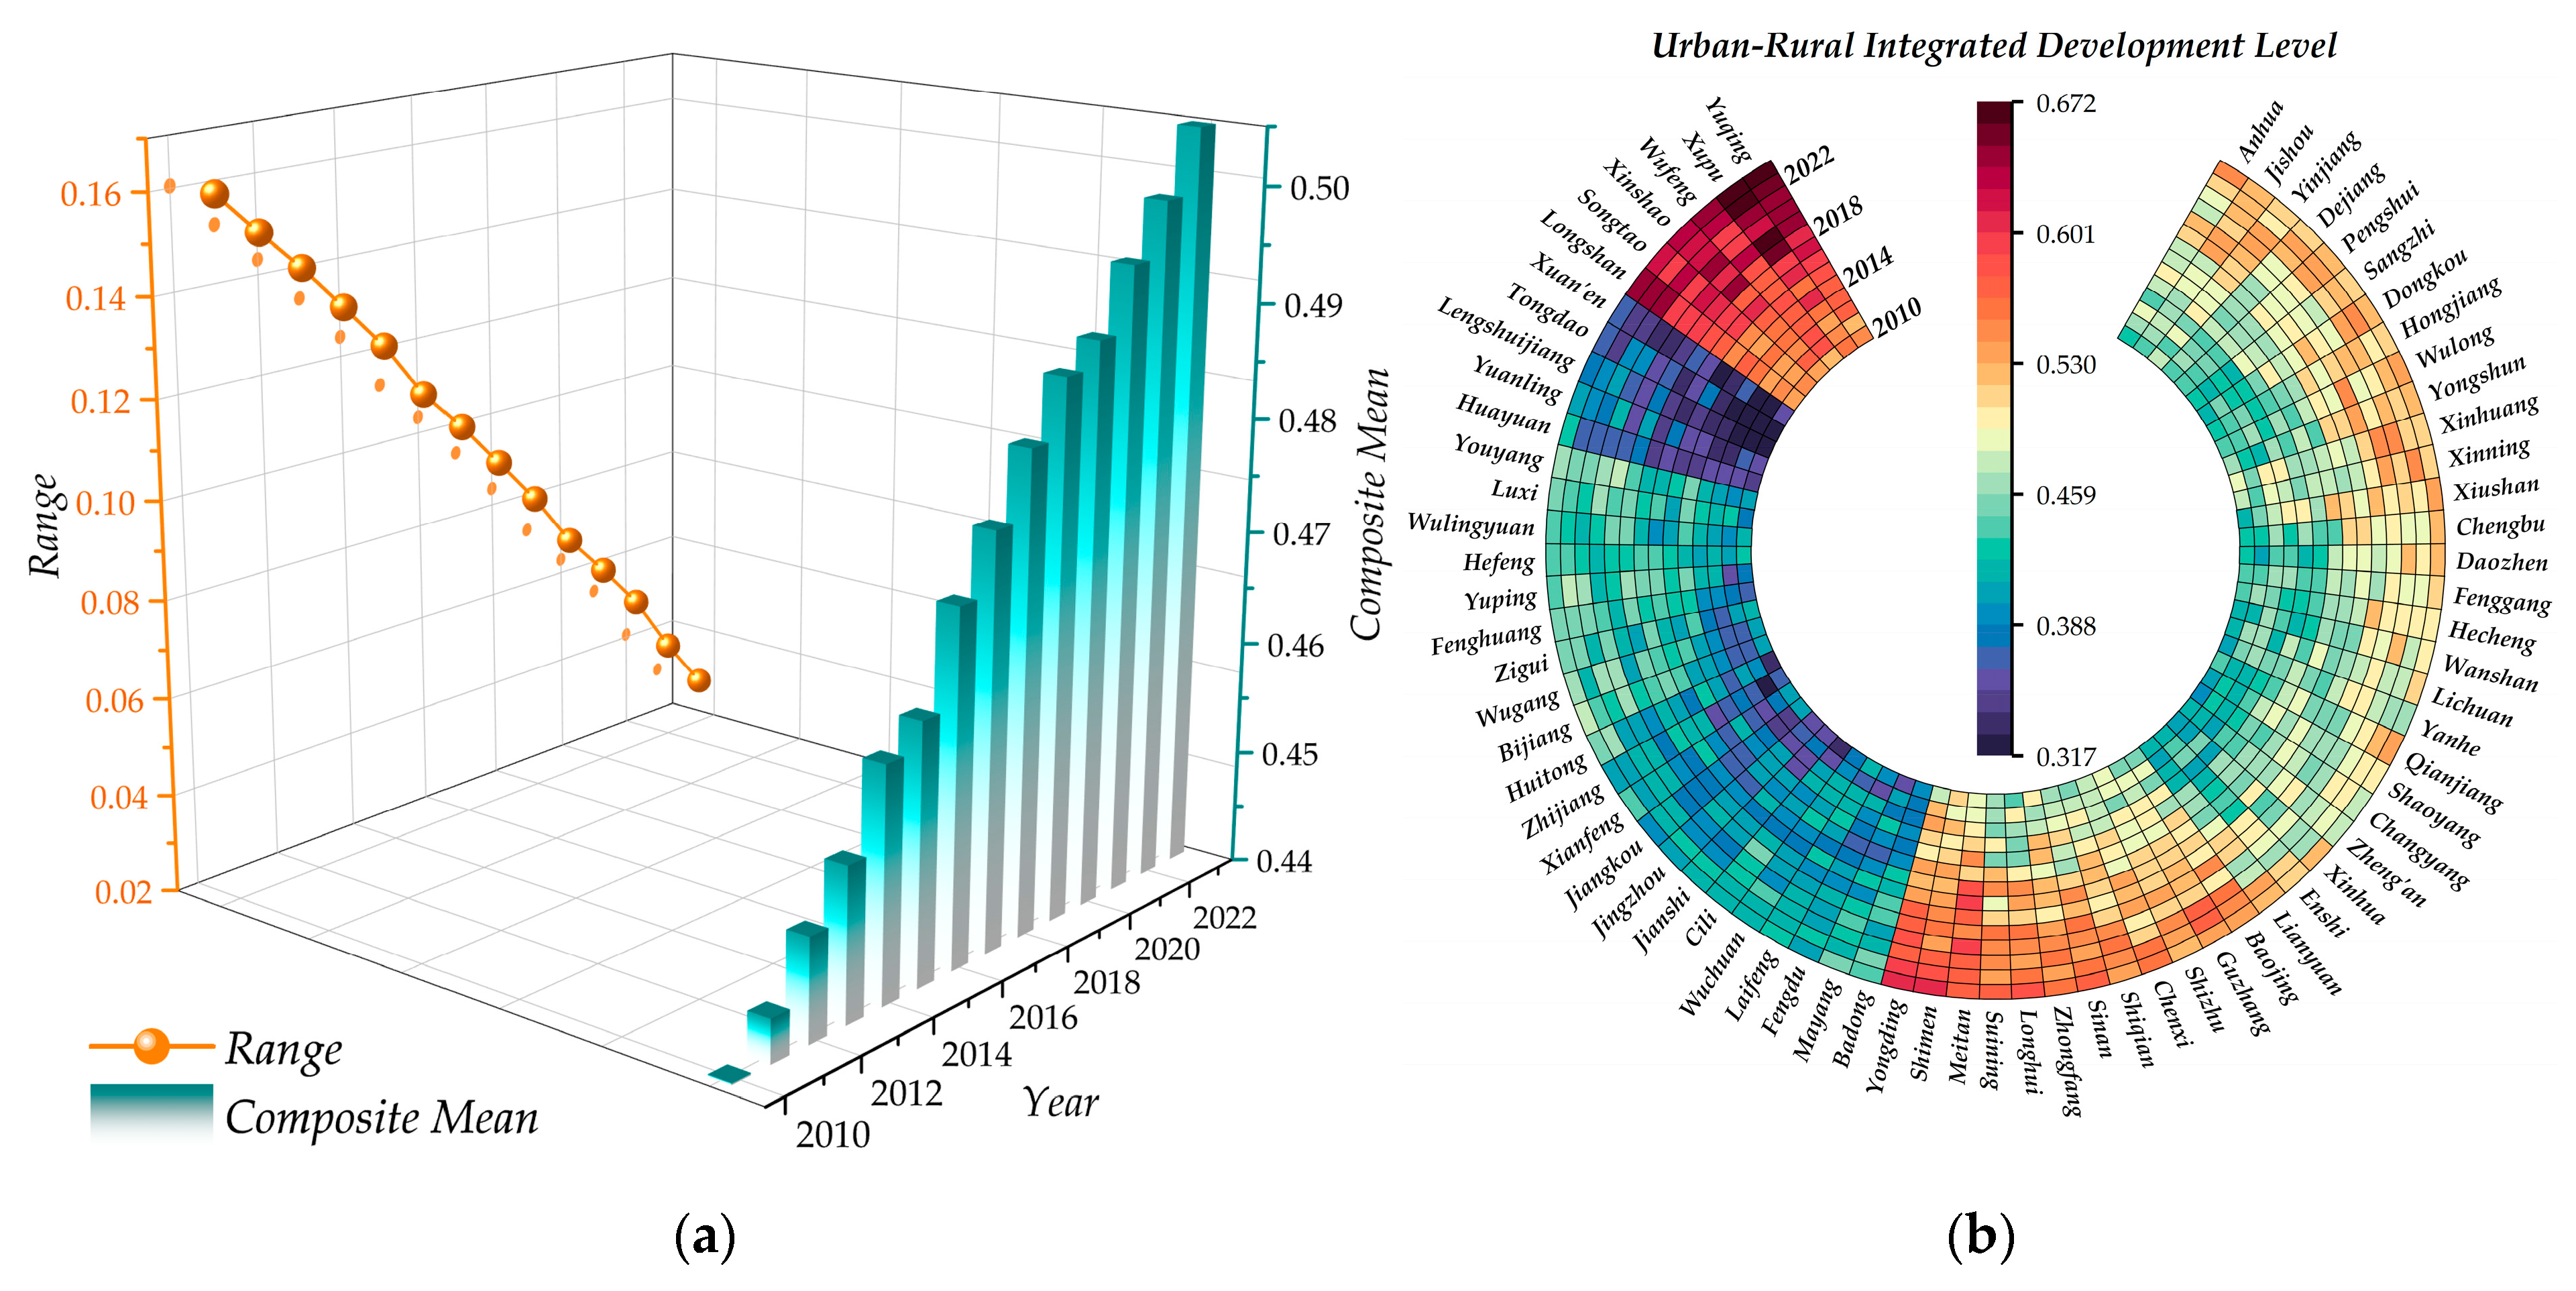
Temporal characteristics of urban–rural integration development levels in the counties of the Wuling Mountain area. The figure shows (a) the comprehensive mean and range values and (b) the evolving trends across 71 counties.
Figure 7.
Variations in the urban–rural integration coupling coordination degree across the 71 counties in the Wuling Mountain area.
3. Result Analysis
3.1. Evolution Trajectories of Integrated Urban–Rural Development in Counties of Wuling Mountain Area
The evolution trajectories of integrated urban–rural development in 71 counties of Wuling Mountain area from 2010 to 2023 have shown the staged transition of “element aggregation–efficiency optimization–innovation diffusion”. The specific analysis is described below.
3.1.1. Analysis of the Evolution Characteristics of Urban–Rural Integration
As shown in Figure 5, the urban–rural integration in the four dimensions of population, space, society, and ecology showed a fluctuating and slow upward trend from 2010 to 2023, while the economic dimension slowly decreased from 0.547 in 2010 to 0.521 in 2023, and each dimension gradually approached 0.50. From the comprehensive mean (Figure 5a), the integrated urban–rural development in the counties of Wuling Mountain area has shown a steady upward trend but is generally low, rising from 0.428 in 2010 to 0.502 in 2023, with an average annual growth rate of only 1.213% and a rise of only 17.38%. This indicates that there is significant room for improvement in the integrated urban–rural development in the sample counties. From the perspective of various provinces and cities (Figure 5b), there is an imbalance in the average annual growth rate of integrated urban–rural development at the county-level in the four provinces and cities, showing a hierarchical pattern of “Hunan Province > Chongqing City > Guizhou Province > Hubei Province”, with average annual growth rates of 1.46%, 1.23%, 1.15%, and 1.00%, respectively.
From the calculation results of staged growth (Table 3), the integrated urban–rural development stage in Wuling Mountain area can be divided into three periods: element-driven stage (2010–2013), efficiency-driven stage (2014–2018), and innovation-driven stage (2019–2023). The scale, breadth, and efficiency of integrated urban–rural development increased by 0.0116, 0.0310, and 0.0161, respectively, from the five dimensions, with corresponding contribution rates of 22.92%, 61.16%, and 15.91%, indicating that the spatial and social construction has driven the integrated urban–rural development in the county. In the efficiency-driven stage (2014–2018), the economic structure was initially optimized, and the levels of the three indicators were further improved. The contribution rate of scale increased to 24.07%, while the breadth remained the dominant driving force. In the innovation-driven stage (2018–2023), the focus of development shifted towards quality and ecological synergy, with the contribution rate of breadth decreasing to 53.10% and the contribution rate of benefits increasing to 21.14%. This indicates that the economic structure was optimized, the population agglomeration effect was enhanced, and the awareness of green development deepened. However, the urban–rural integration in Wuling Mountain area shifted from a single-point breakthrough to multipolar coordinated development. During the research period, the range values of integrated urban–rural development in five dimensions continued to decline (Figure 6a) from 0.244 in 2010 to 0.075 in 2023.
Table 3.
Development trajectories: composite index and stage-wise growth in a multidimensional framework.
3.1.2. Analysis of the Hierarchical Distribution of Urban–Rural Integration in Counties
From the perspective of each county (Figure 6b), the integrated urban–rural development in 71 counties of Wuling Mountain area showed a continuous gradient upward trend from 2010 to 2023, demonstrating the spatiotemporal evolution characteristics of “overall optimization–gap convergence–multipolar linkage–hot in the south and cold in the north”. The 71 counties can be divided into three groups. The high-development group, such as Xupu County (0.607), Yuqing County (0.604), Xinshao County (0.591), Wufeng County (0.588), Longshan County (0.583), Songtao County (0.580), and other counties, relied on the value chain of “ecological capital–cultural tourism economy–carbon sink trading” to achieve superlinear growth, all of which were higher than 0.55 due to the leverage effect of the “ecological functional zoning” policy after 2018 and the “targeted poverty alleviation” policy before 2020. In the medium-development group, 39 counties formed a catching up trend through the diversified interaction of “characteristic agriculture–industry cluster–public services”, but their development level was always between 0.45 and 0.55. In the low-development group, the integrated urban–rural development of 26 counties improved, but there was still a gap, and all were less than 0.45. When local governments and enterprises were cultivating characteristic industrial clusters and market-oriented element allocation, they faced three constraints: industrial singularity, geographical marginalization, and lagging policy response. Combined with path dependence, they constrained the efficiency of two-way factor flow, resulting in a “lock-in effect” in resource-based counties such as Wanshan District (mercury mine), Wuchuan County (bauxite mine), Lengshuijiang City (antimony mine), Huayuan County (manganese mine), Jianshi County (coal mine), and Xianfeng County (natural gas mine). It was also difficult to break through.
3.2. Heterogeneity Effect Evaluation of Integrated Urban–Rural Development in Counties of Wuling Mountain Area
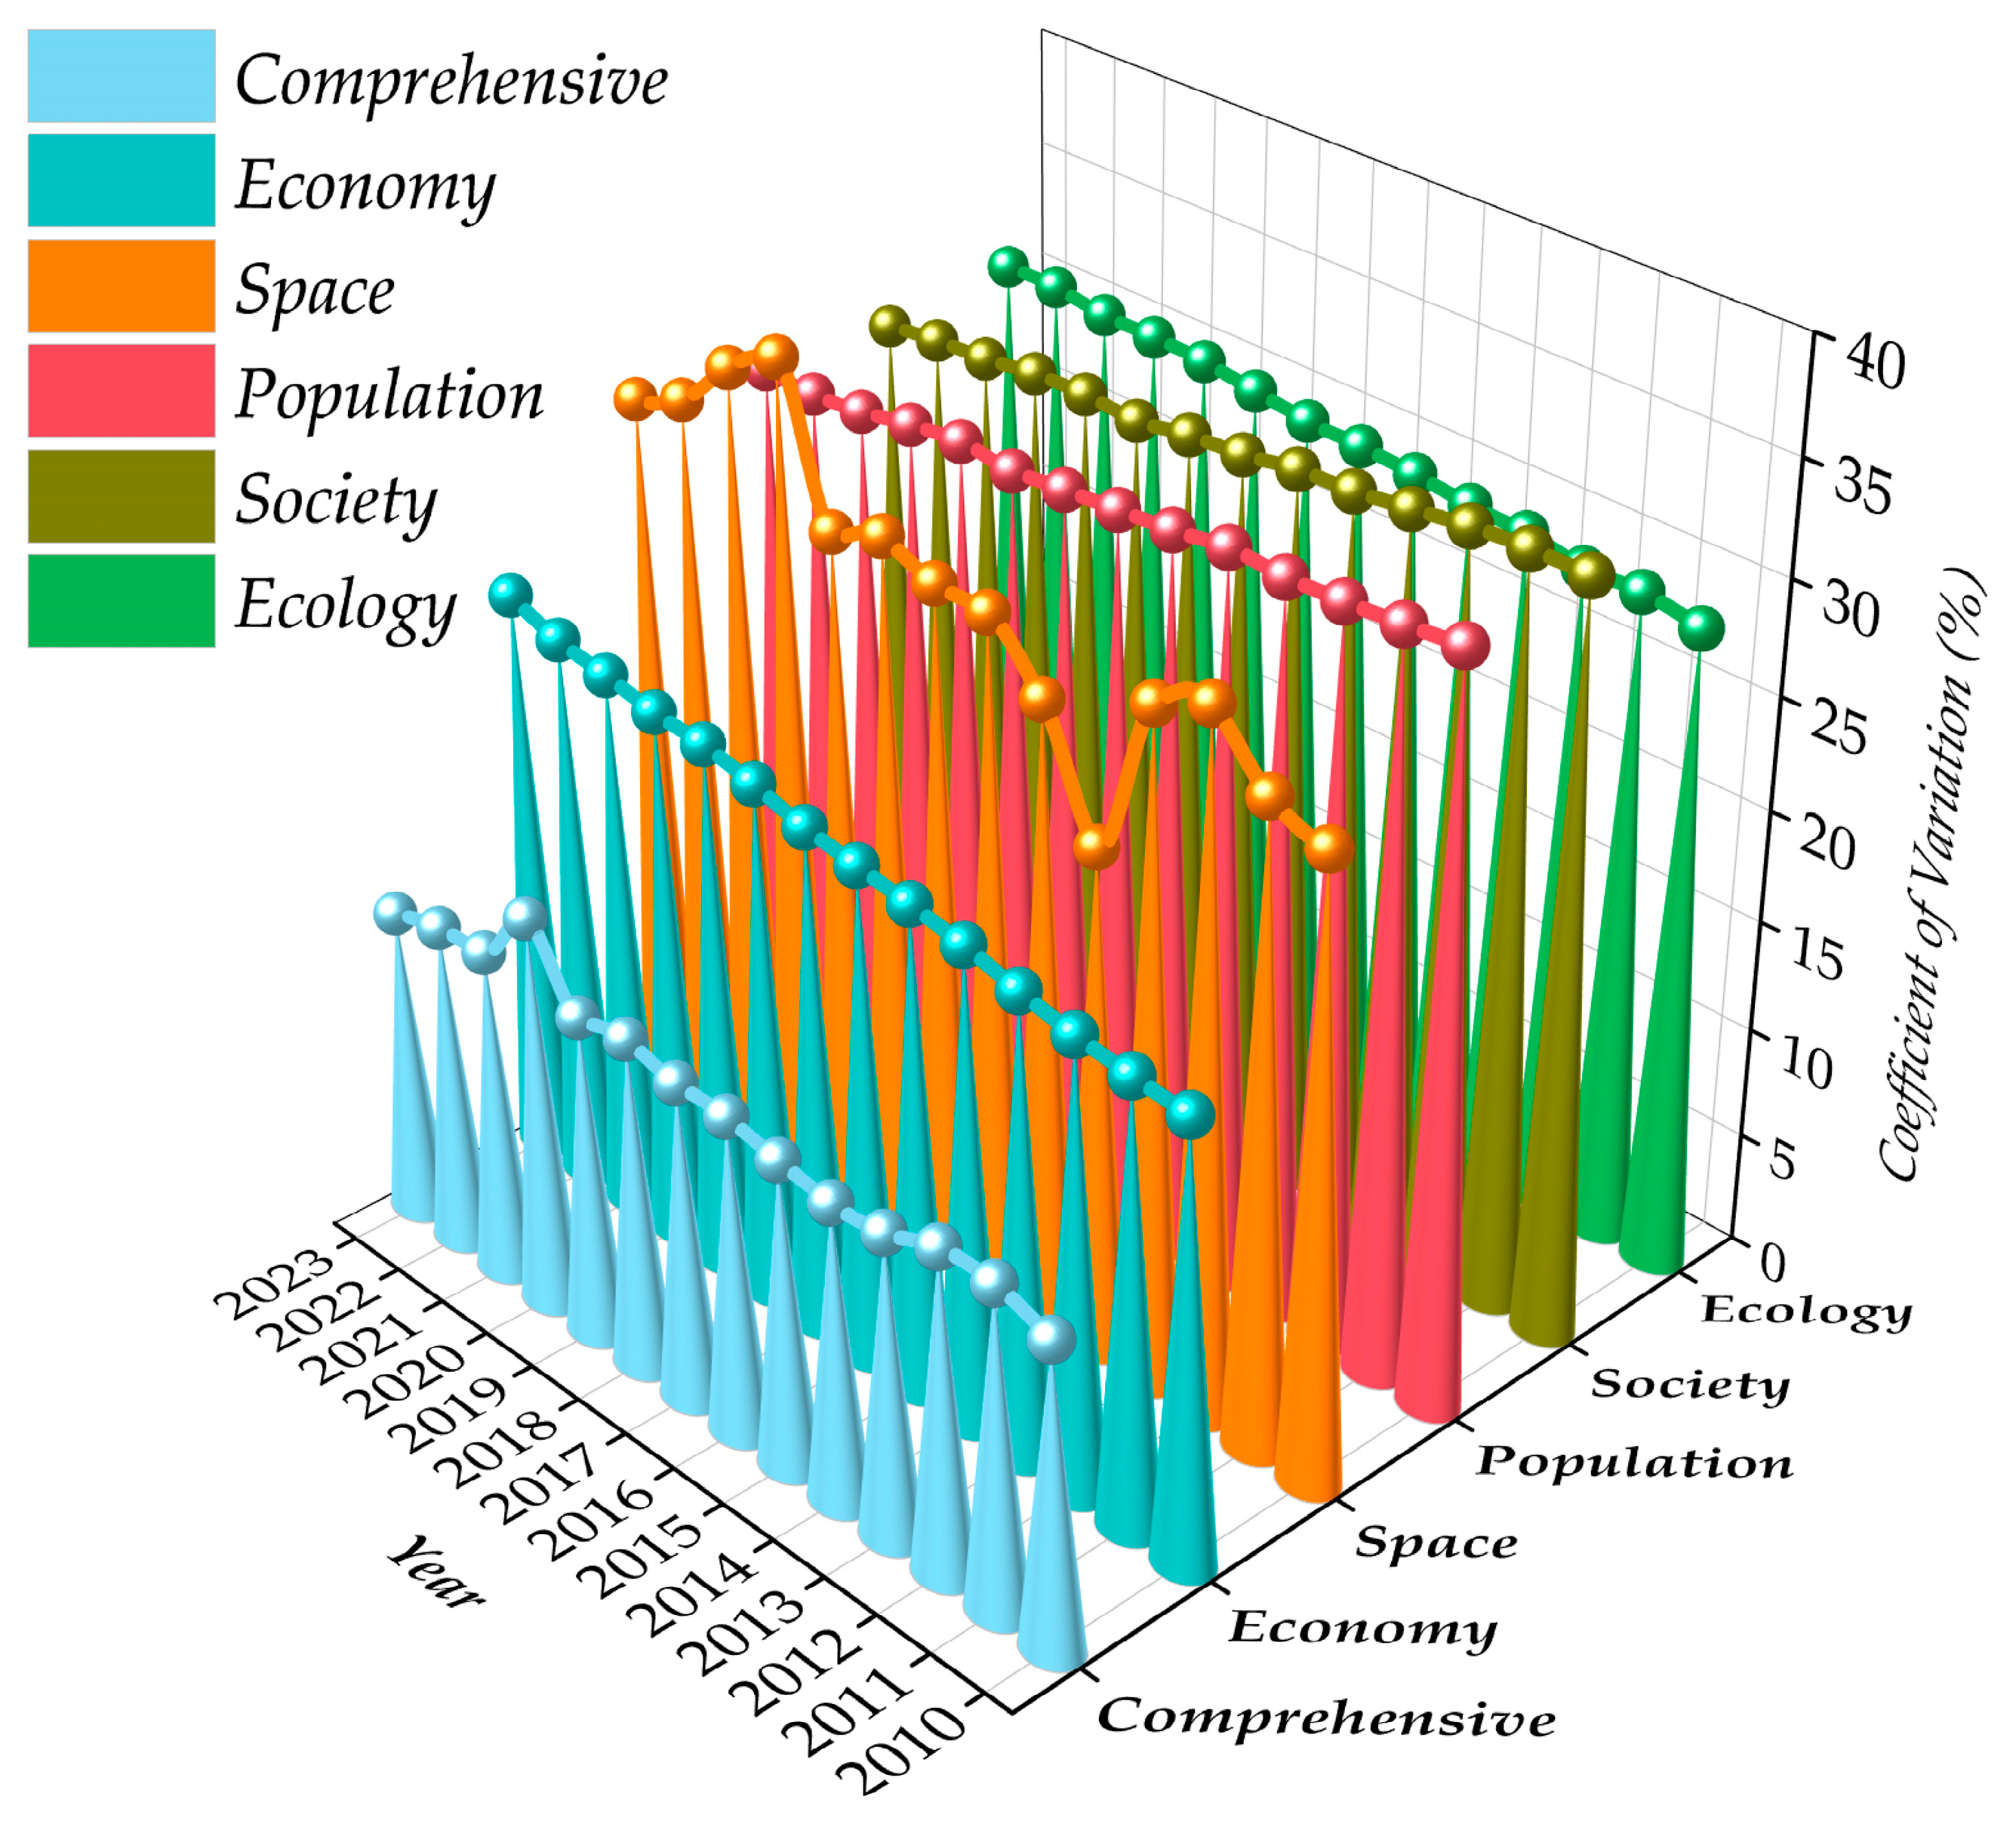
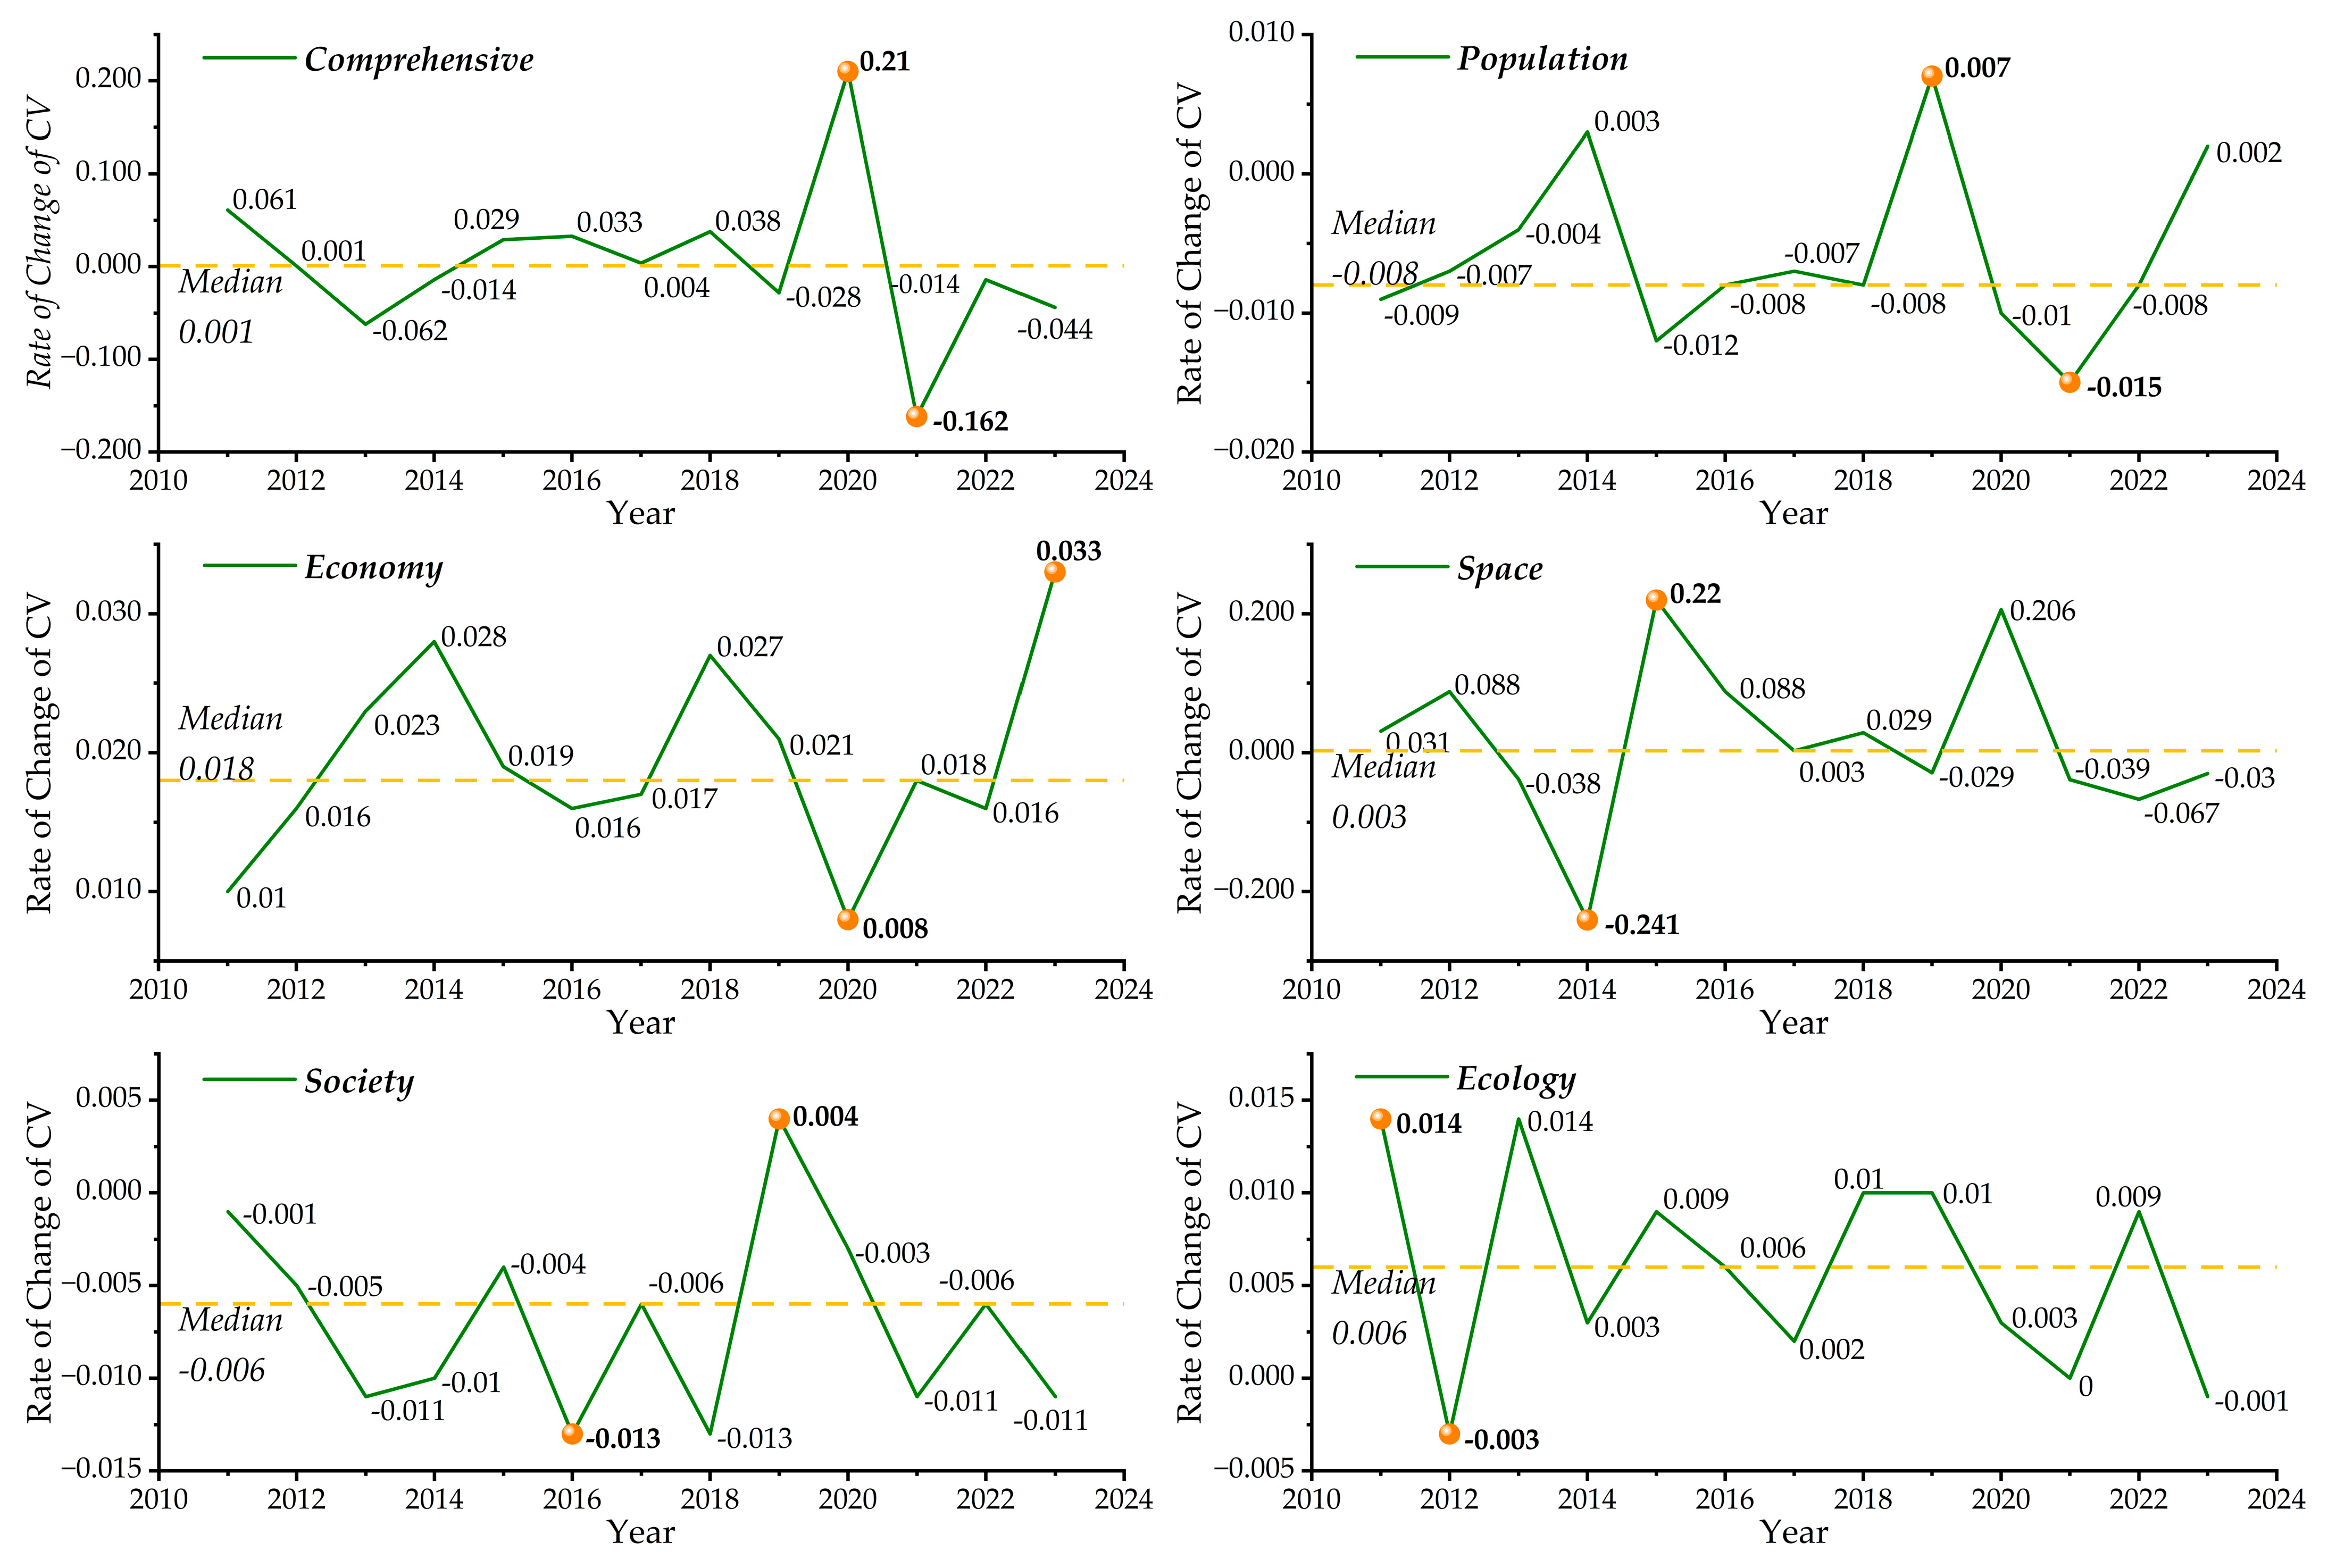
Based on the variation coefficient (Figure 8) and its rate of change (Figure 9), the degree of variation in the urban–rural integration in counties of Wuling Mountain area was classified into the following three levels with reference to the experience from the literature []: Low variation was referred to as 0 < CV ≤ 15%; 15% < CV ≤ 30% was considered moderate variation; and CV > 30% indicated high variation. The resonance was formed between the comprehensive CV change rate and the drastic fluctuations in the economic and spatial dimensions, while the negative change rate in the population and social dimensions confirmed that its heterogeneity slowed down but was not reversed. The specific analysis is detailed below.
Figure 8.
Variation coefficients of integrated urban–rural development in Wuling Mountain area.
Figure 9.
Rates of change in comprehensive and dimension-specific variation coefficients of integrated urban–rural development. Note: The circles and bold text in the figure indicate the respective maximum and minimum values, along with the corresponding years.
3.2.1. Evolution of Comprehensive Heterogeneity in the Integrated Urban–Rural Development at the County Level
As shown in Figure 8, the comprehensive coefficient of variation showed a fluctuating upward trend during the sample period, and the overall heterogeneity level was in the low-variation range. In 2014, the comprehensive CV dropped to the lowest point of 13.614%, while it rose to the highest point of 17.741% in 2020, with a particularly significant difference between the two peaks. In Figure 9, the comprehensive CV growth rate reached 0.210 in 2020, far higher than other years. At this time, the mid-term evaluation of the 13th Five Year Plan, the launch of the 14th Five Year Plan, and the impact of the epidemic hindered the cross-regional flow of labor, capital, and other factors between urban and rural areas.
3.2.2. Dimensional Heterogeneity Characteristics of Integrated Urban–Rural Development at the County Level
From the perspective of CV values across various dimensions (Figure 9), the “society > population > ecology > space > economy” in 2010 shifted to “space > ecology > population > society > economy” in 2023. In 2014, the spatial coefficient of variation dropped sharply to 22.758%, while it soared to 36.493% in 2020. Since then, the fluctuation showed a decreasing trend, reflecting the impact of the “multi-regulation integration” policy and sudden public events on the rational layout of infrastructure in the affected area. The ecological CV values remained relatively stable during the sample period, and the growth rate of ecological CV slowed down after 2020, but remained between moderate and high variation, indicating the implementation of the unified ecological protection policy in Wuling Mountain area. The population CV decreased slightly from 33.145% in 2010 to 30.704% in 2023, but its average was as high as 31.82% and the rate of change was mostly negative. The social CV was also in the high-variation zone during the sample period, but its magnitude of change was the smallest and the rate of change was mostly negative. The economic CV increased from 19.94% in 2010 to 25.604% in 2023. The growth rate significantly accelerated since 2017, with an average interannual variation rate of 0.023, showing a monotonic increase and approaching high variation. The population CV showed a gradually increasing trend of change. The flow of rural population to urban areas and the migration of the labor force from agricultural to non-agricultural employment is an inevitable trend. However, the proportion of elderly, young, and low-educated people is high in the rural population, and there is a shortage of young and middle-aged labor force and technical talents, which is not suitable for the needs of modern agricultural development. Therefore, the heterogeneity characteristics of the population should be focused on.
3.3. Evaluation of the Coordination Relationship for Integrated Urban–Rural Development in Counties of Wuling Mountain Area
The multidimensional coordination relationship of urban–rural integration in Wuling Mountain area is mainly constrained by spatial polarization and ecological constraints. Under unbalanced development, counties in the stage of imbalance gradually form spatial agglomeration poles, while counties in the stage of coordination are constrained by element mismatches. The specific analysis is detailed below.
3.3.1. Spatiotemporal Evolution and Gradient Characteristics of Coupling Coordination Degree
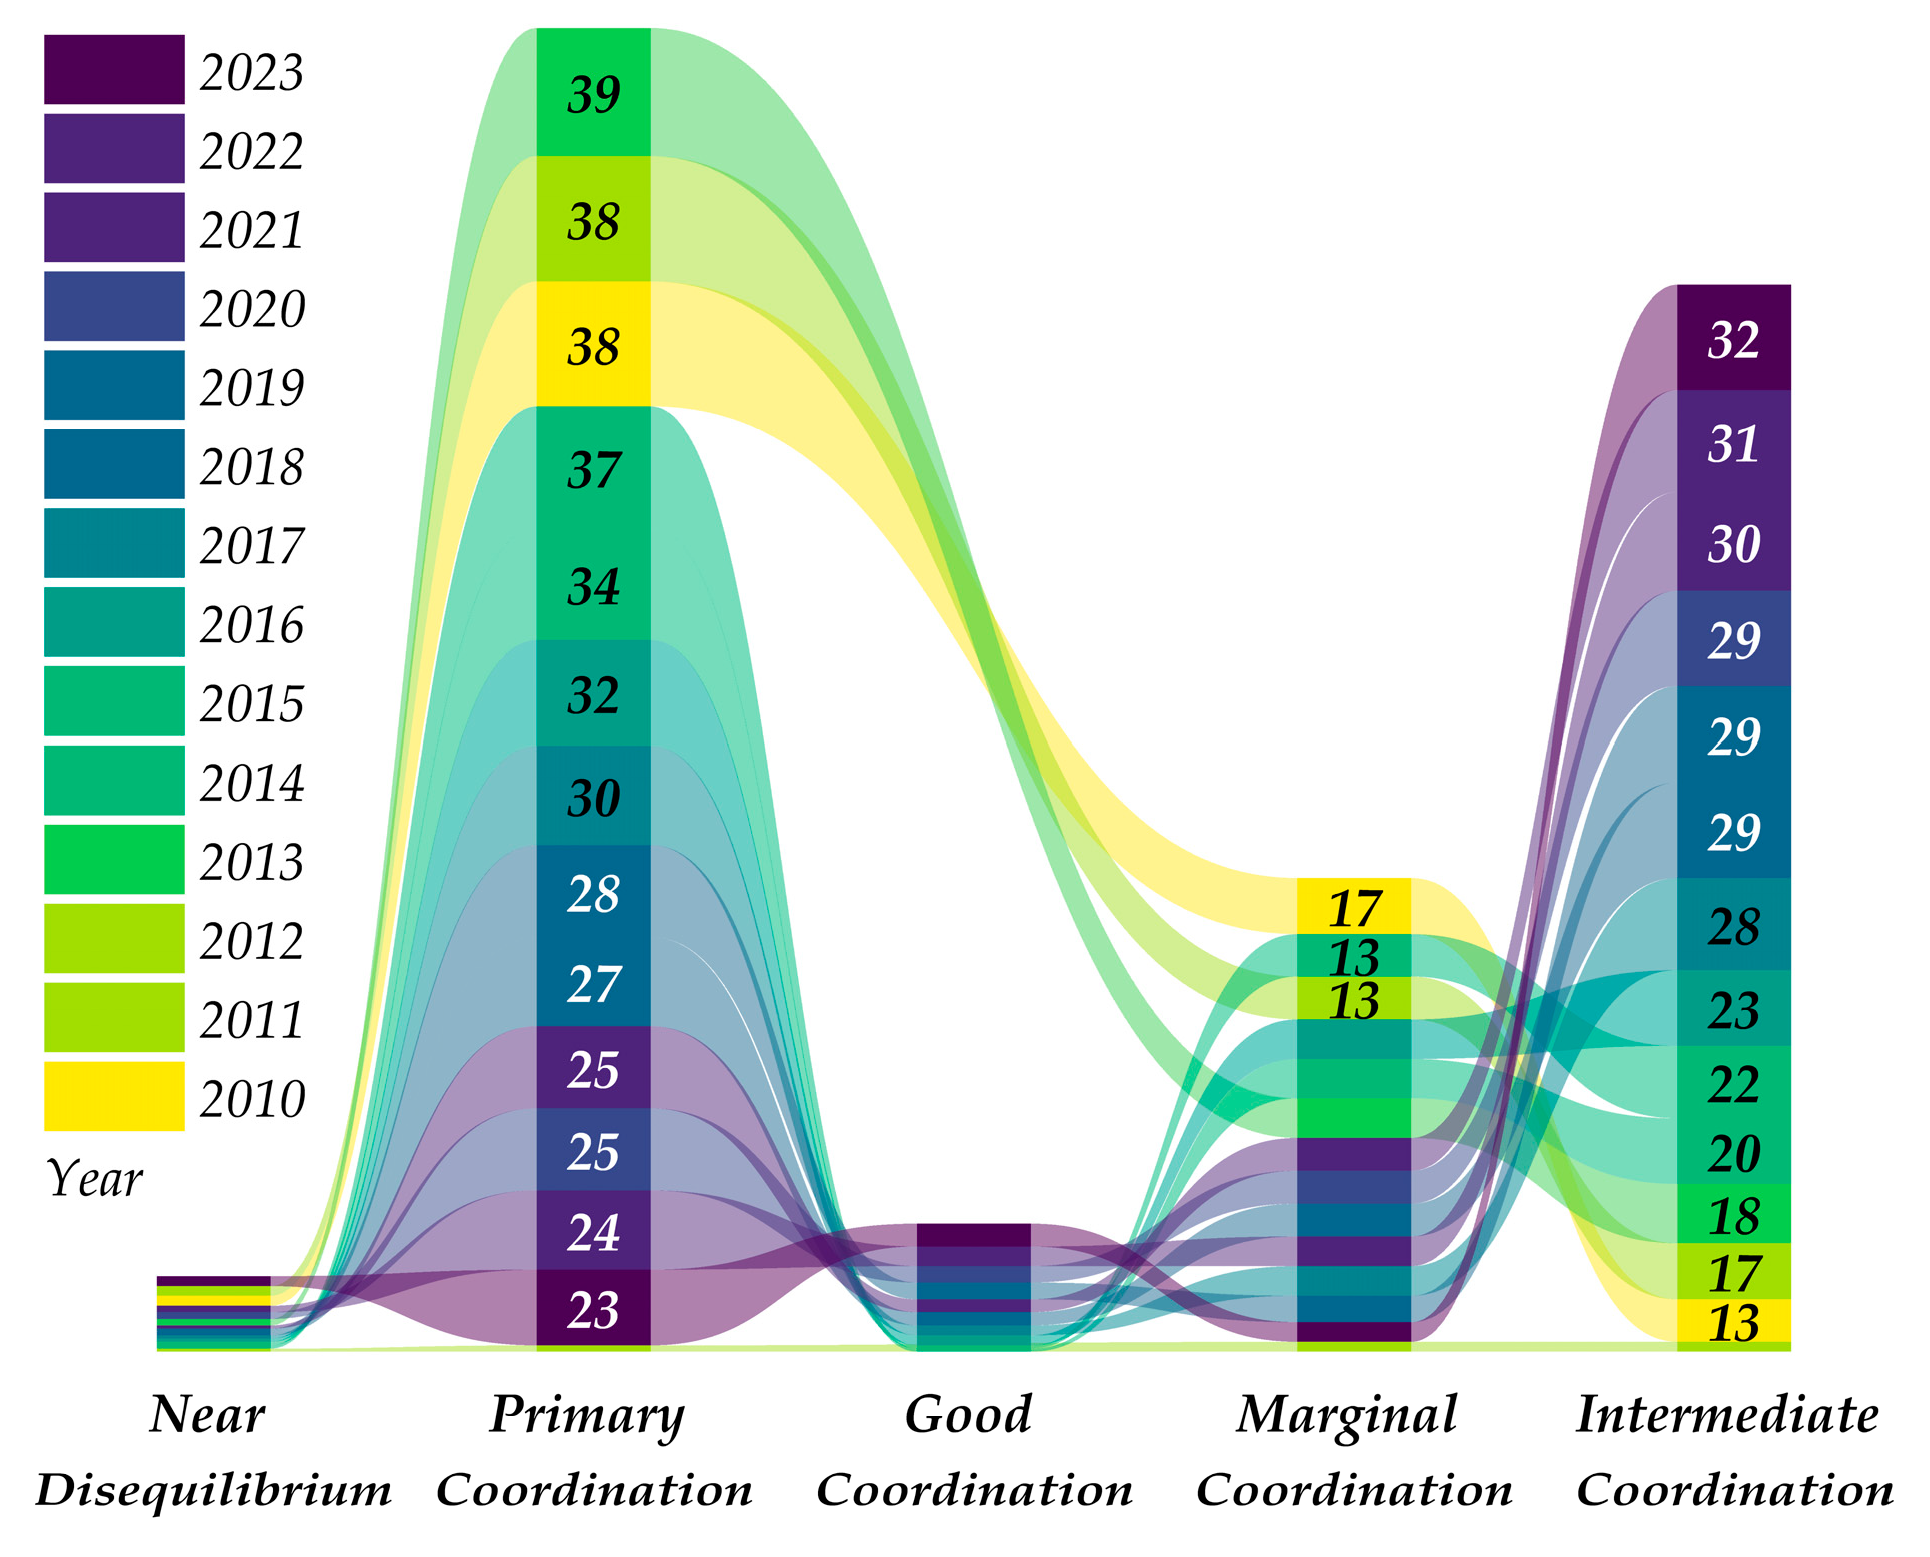
Figure 10 shows the change path of the coupling coordination degree among 71 counties (cities, districts) in Wuling Mountain area from 2010 to 2023. Although it was generally in the coordination stage, the primary coordination was still the main focus. Figure 7 shows Lengshuijiang City (0.505), Tongdao County (0.512), and Zhijiang County (0.545) in 2010, while 13 counties including Xupu County (0.777), Yuqing County (0.773), and Xinshao County (0.765) exceeded the intermediate coordination threshold, and another 17 counties were in a barely coordinated state. In 2014, the number of intermediate coordinated counties increased to 20, and the number of barely coordinated counties was reduced to 12, optimizing the coordination pattern. For example, Meitan County increased the value of the tea industry chain and improved coupling coordination. In 2018, the coupling coordination status began to trend towards spatial polarization, and 29 counties including Xinshao County (0.839), Wufeng County (0.818), and Longshan County (0.8) reached a good coordination level, while 10 counties including Yanhe County (0.593) and Laifeng County (0.581) were trapped in primary imbalance. In 2023, the coordination degree of the counties showed the characteristics of “polarization convergence”. Seven well-coordinated counties, including Yuqing County (0.871), Xupu County (0.859), and Longshan County (0.837), became leaders in coupling coordination degree through cross-regional element integration. Although the number of barely coordinated counties sharply decreased to six in 2023, the coupling coordination degree of Yanhe County, Yuanling County, and Daotong County continued to hover at a low level due to traffic congestion and resource mismatch.
Figure 10.
Pathways in the urban–rural integration coupling coordination degree across the 71 counties in the Wuling Mountain area. Note: The numbers in figure indicate the number of counties at each coupling coordination degree level for the corresponding year.
3.3.2. Differentiation in Subsystem Coupling Coordination Degree and Typical Paths
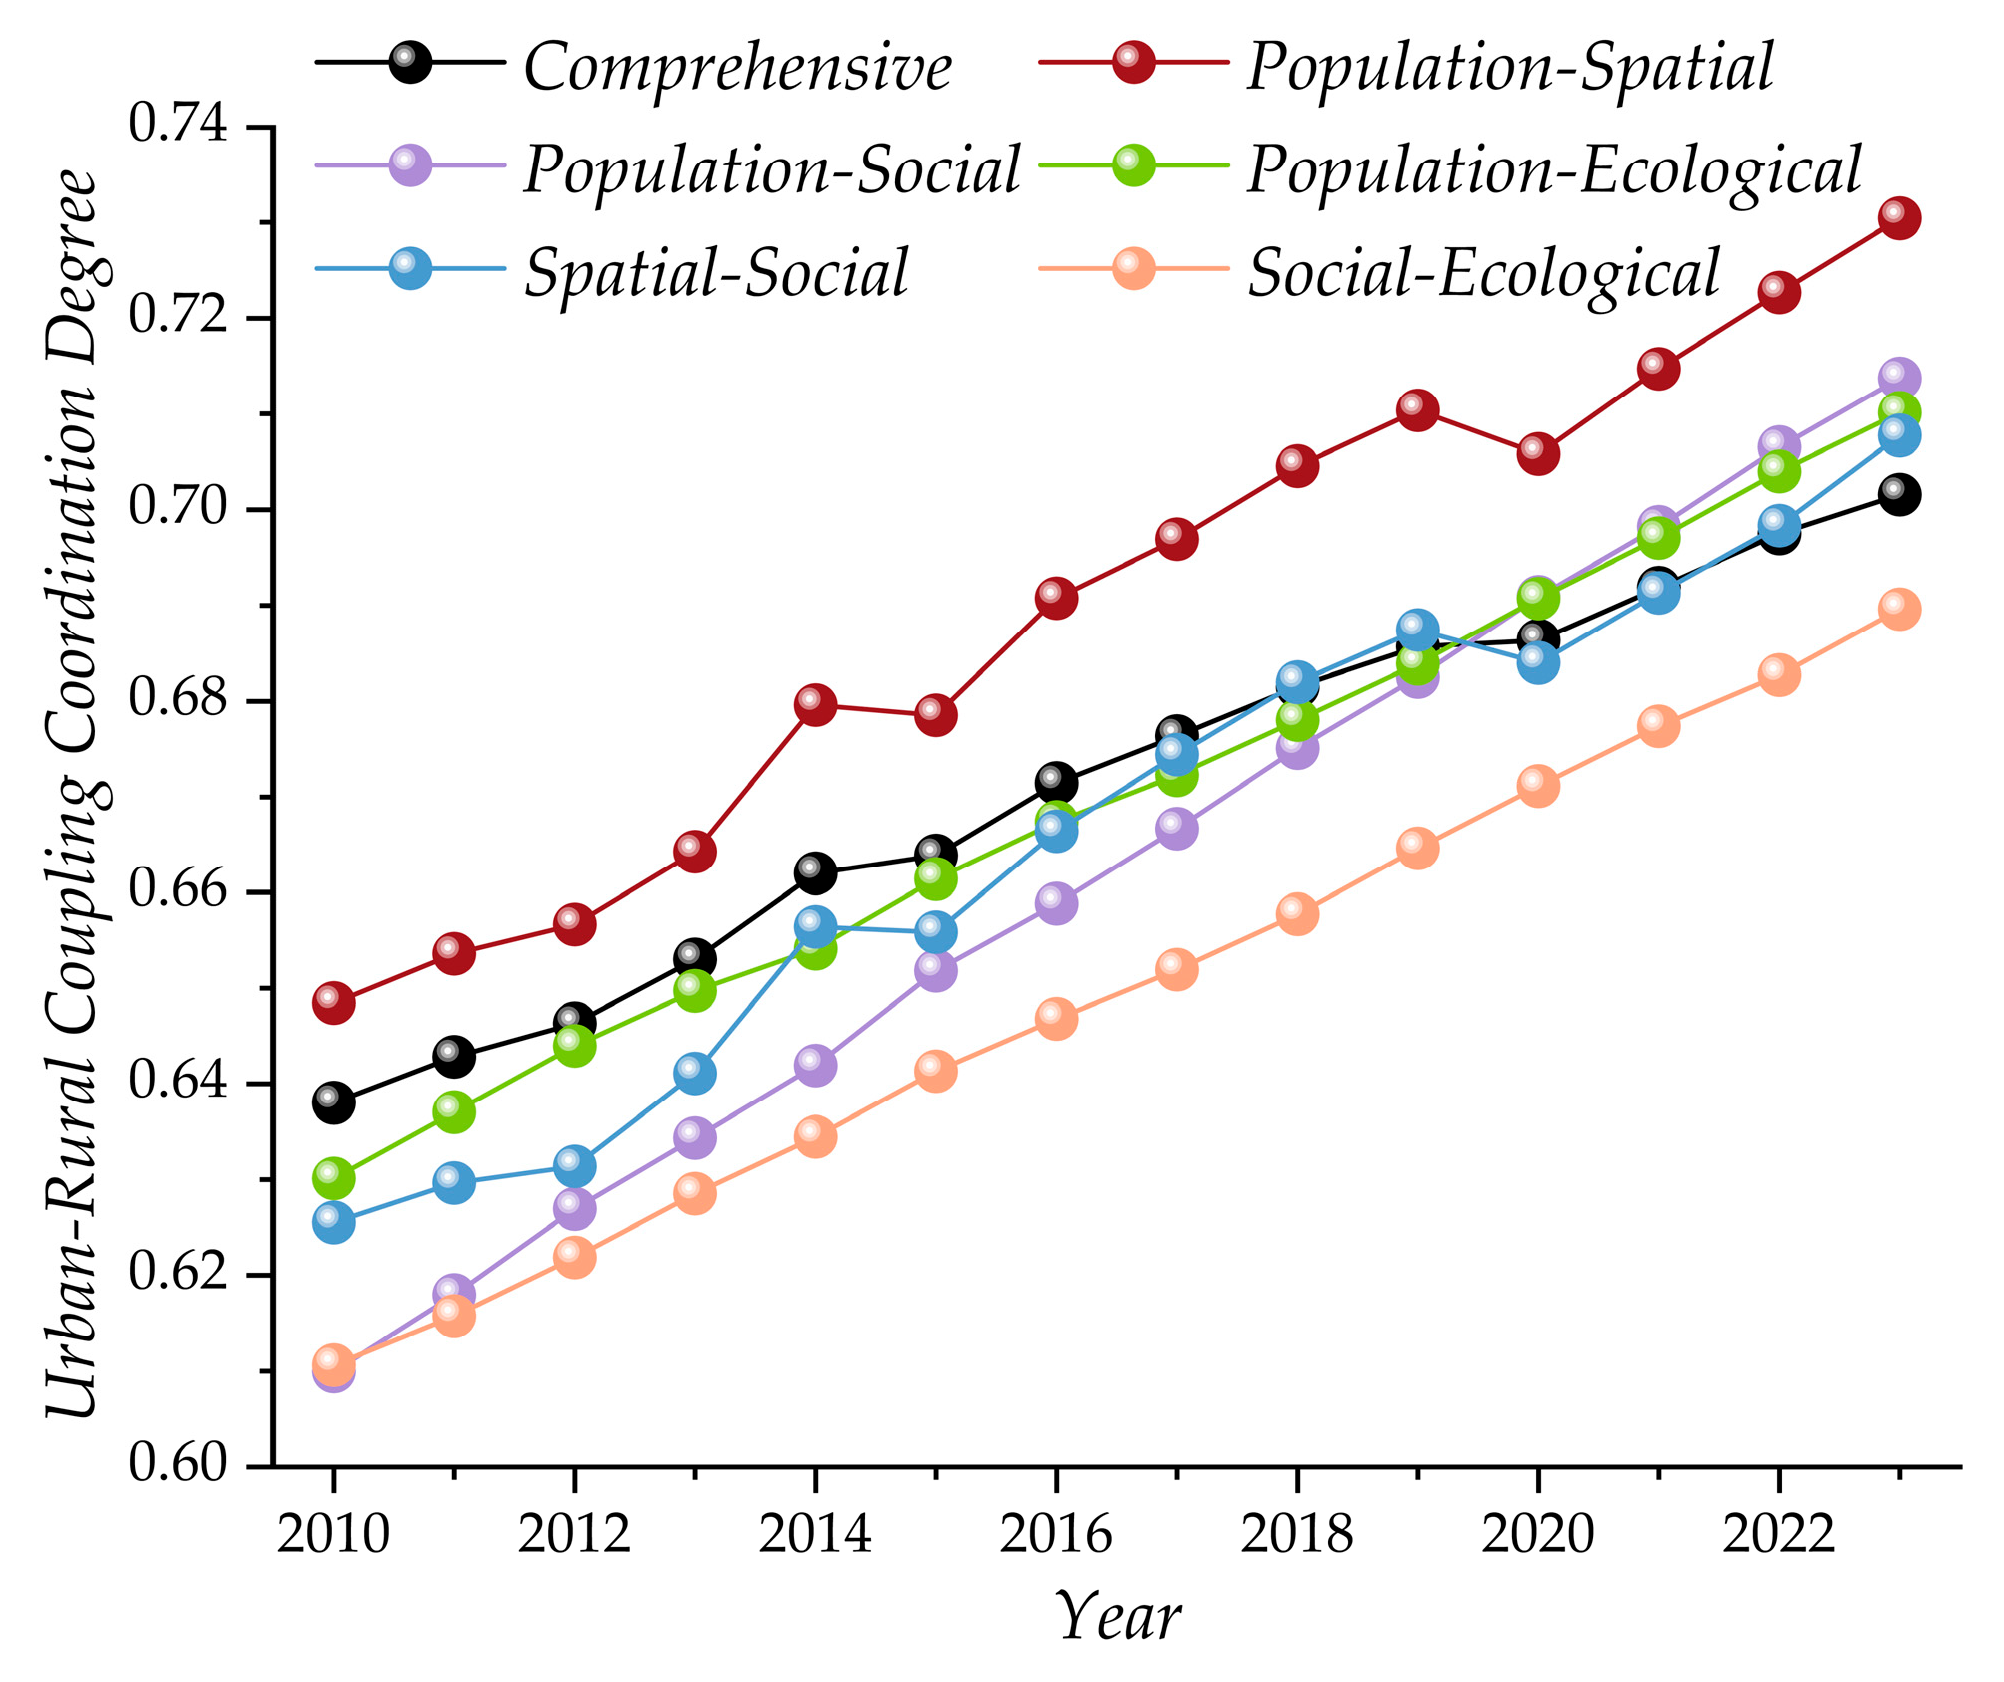
As shown in Figure 11, the interactive efficiency of the urban–rural integration system in Wuling Mountain area steadily improved, and its comprehensive coupling coordination degree increased from 0.6380 in 2010 to 0.7016 in 2023, with an average annual growth rate of 0.52%. The coupling coordination degree between subsystems varied significantly, and there was a strong correlation between labor quality and industrial efficiency, supporting the sustained high coupling coordination degree of the “population–economy”. The contradiction between ecological constraints and growth was not fully resolved, which constrained “economy–ecology” to a gradual increase in its fluctuations. The growth rate of “space–society” was the fastest, with an average annual rate of 1.14%, because local governments have steadily promoted the equalization of urban and rural infrastructure and public services. Further research has found that the evolutionary path exhibits multidimensional driven differentiation characteristics. For example, Meitan County has formed an endogenous growth pole through the integration of tea and tourism, Wufeng County has achieved a breakthrough in the “economic ecological” dimension through the capitalization of its ecological resources, while Yanhe County was once trapped in a “low-level equilibrium of ecological constraints” due to geographical marginalization and factor flow limitations.
Figure 11.
Evolution trends of multidimensional coupling coordination for urban–rural integration in Wuling Mountain area. Note: There are a total of twenty-six coupling modes in five dimensions, and only five types of element combinations with significant changes are shown here.
In summary, the urban–rural integration in counties of Wuling Mountain area has shifted towards structural optimization, but the ecological carrying capacity threshold and path dependence constitute key constraints. In recent years, industrial restructuring and long-term accumulation of social capital led to the dominant mode of “population–space” coupling coordination, accounting for 23.1%. Only 7.7% of counties were in the stage of ecological coordination, indicating significant potential for value transformation. After 2018, urbanization accelerated and the coupling coordination between population and ecology partially declined. From the perspective of level transition (Figure 10), 60% of counties achieved a level upgrade from the transition stage to the coordination stage, and the degree of advancement showed a “gradient increasing” trend. Potential counties with “high-quality coordination” such as Wufeng County and Yuqing County improved their coordination level through the dual-wheel drive of “ecological industrialization–industrial ecology”. The upgrading rate of primary coordination counties reached 82.4%, while only 57.1% of intermediate coordination counties achieved a leap, indicating that the increase in system complexity significantly improved the resistance to advanced coupling coordination.
3.4. Diagnosis of Obstacle Factors for Integrated Urban–Rural Development in Counties of Wuling Mountain Area
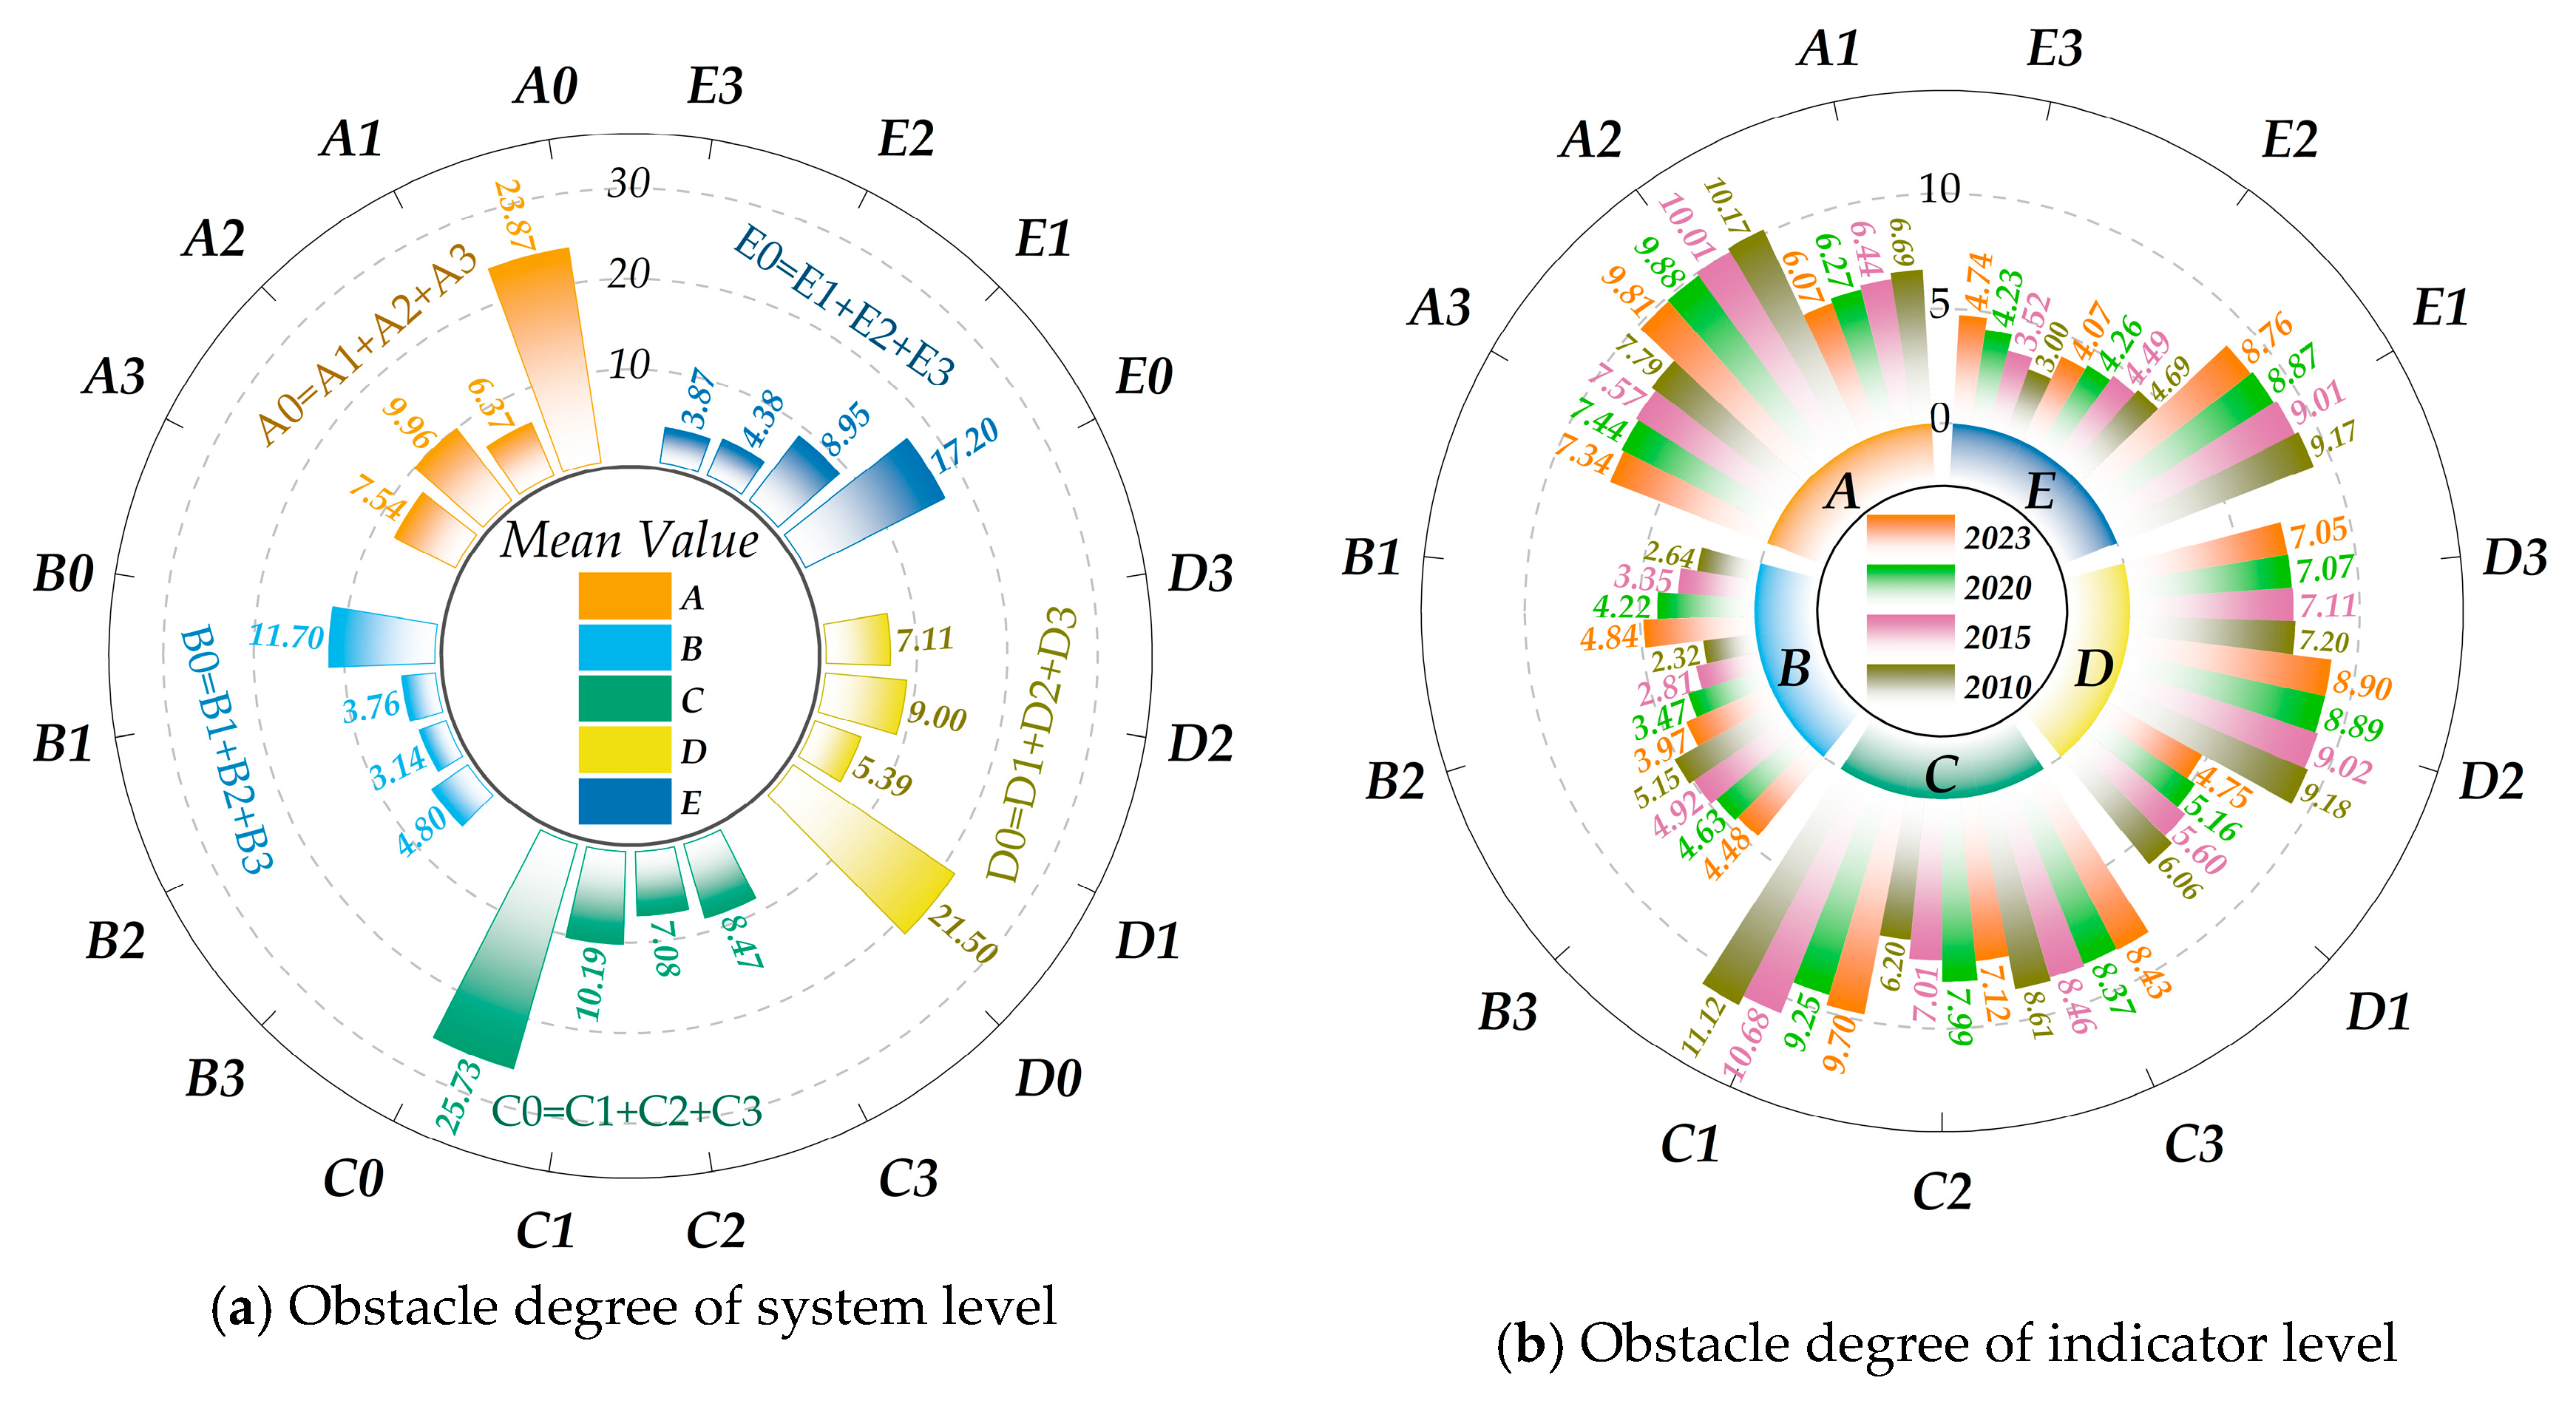
In order to further explore the obstacles and factors that constrain the integrated urban–rural development of counties in Wuling Mountain area, the obstacle degree model was employed to calculate the obstacle degrees at the system and indicator levels in 2010, 2015, 2020, and 2023. The calculation results are shown in Figure 12.
Figure 12.
System-level (a) and indicator-level (b) obstacle degrees (%) of integrated urban–rural development in counties of Wuling Mountain area. Note: A–E, A0–A3, B0–B3, C0–C3, D0–D3, and E0–E3 in the figure correspond to the obstacle degrees of population, economy, space, society, and ecology at the system and indicator levels, respectively.
3.4.1. Obstacle Assessment at System Level
From the perspective of obstacles at the system level (Figure 12a), the degrees of obstacles to the integration of urban and rural development in the counties of Wuling Mountain area were ranked in the order of space > population > society > economy > ecology. The obstacle level of the spatial integration system was as high as 25.733%, which was the highest obstacle level. The population integration system (23.868%) was followed by the social integration system (21.498%), and both showed a slow downward trend. The obstacle levels of the ecological integration system and economic integration system to the integrated urban–rural development system were relatively low, but they showed an upward trend, opposite to the trend of population integration and social integration. In recent years, the industrial structure and factor flow between urban and rural regions in Wuling Mountain area have tended to be benign, narrowing the income gap between urban and rural residents to a certain extent, and the consumption hierarchy between urban and rural areas has also gradually converged. At the same time, local governments have further promoted the integrated development of urban and rural ecology through ecological compensation mechanisms and green industry support policies. However, there are still institutional barriers such as unclear land ownership and lack of cross-regional governance in Wuling Mountain area, as well as social differentiation such as supply gaps in public services and weakened cultural identity in central counties such as Enshi County and Zhangjiajie County, which jointly constrain the two-way flow and collaborative process of factors.
3.4.2. Analysis of Obstacles at Indicator Level
As shown in Figure 12b, the top five obstacle factors at the indicator level were ranked as land urbanization (C1) > urban population density (A2) > cultural service supply (D2) > green coverage rate (E1) > urban–rural land allocation (C3), with corresponding obstacle degrees of 10.190%, 9.964%, 8.997%, 8.954%, and 8.466%, respectively. The first obstacle factor was land urbanization, indicating that the mismatch of factors such as “non-grain production” of arable land and land fragmentation may have endangered agricultural production space and ecological security patterns. The second obstacle factor was urban population density, indicating that regional population distribution imbalance, urban–rural population structure discontinuity, and other phenomena still existed. Some counties had a large outflow of rural labor, which posed a risk of hollowing and decline. The third obstacle factor was the supply of cultural services. Due to the decoupling of cultural service products from ethnic culture and folk customs, and the homogenization of supply models, it was difficult to meet the needs of diverse groups, resulting in a gradient difference in the allocation of public cultural resources between urban and rural areas from the center to the edge. The fourth obstacle factor was green coverage, indicating a game between ecological protection and economic development. Ecological protection counties such as Hefeng County and Wufeng County have higher forest coverage. The green area in counties under the jurisdiction of prefecture-level cities such as Jishou and Tongren, which are in the stage of accelerated industrialization, decreased. The fifth obstacle factor was the element mismatch for the allocation of urban and rural land. Coupled with the imperfect market-oriented land transfer mechanism, it seriously restricted the integration of industries and the co-construction and sharing of infrastructure.
4. Discussion
4.1. Essential Characteristics and Roots of Integrated Urban–Rural Development in Wuling Mountain Area
The biggest inadequacy in urban and rural development is the inadequacy in rural development, and mountainous areas, especially those with contiguous and multi-ethnic living conditions, are at the bottom of the imbalance and are a typical example of inadequacy. Wuling Mountain area integrates ethnic minority settlements, contiguous poverty alleviation, and ecological barriers, and the complexity of urban–rural integration far exceeds that of ordinary regions. This study found that the overall level of integrated urban–rural development is on the rise, but the regional gap continues to widen, which is consistent with existing research on spatial differentiation patterns [] and high-level clustering areas []. The existing research on the transformation of “element–function” in developed regions of eastern China is relatively mature [], but the exploration of the mechanism of the “policy–ecology–culture” interaction in underdeveloped regions is clearly insufficient. Therefore, a conceptual framework model of “element–structure–function” has been established for urban–rural integration based on previous research [,,], in order to break through the traditional “economic orientation” paradigm. For the first time, geographical and policy attributes are included in the evaluation system of urban–rural integration in underdeveloped areas, revealing the deep institutional causes of spatial mismatch and the crux of ecological capital transformation.
The multidimensional coordination of urban–rural integration is essentially a dynamic adjustment process of “factor flow–structure adaptation–function manifestation” []. It was found that the obstacle degree of the spatial integration subsystem in Wuling Mountain area was significantly higher than that in economically developed regions such as the Yangtze River Delta [] and the Pearl River Basin []. At its root, the sample area combines the dual characteristics of mountainous complex ecosystems and ethnic minority settlements. Its urban–rural integration faces the structural contradiction of “extensive land utilization–income differentiation” [], and the tension between ecological service functions and economic development demands [,]. Meanwhile, unlike the factor aggregation mechanism driven by industrial clusters in the eastern region [,], the urban–rural integration development model in Wuling Mountain area overly relied on policy driving and single-factor breakthroughs, and its subsystem coordination was deeply trapped in the dual dilemma of ecological threshold limitations and institutional path dependence. Compared with the mature “village–town–city” linkage model in eastern coastal counties [], Wuling Mountain area presented a special “dual duality”, and its core contradiction stemmed from the structural mismatch of elements at the urban–rural system level. Divergence in urban–rural integration occurred at both domestic regional levels and in cross-national comparisons. Contrasting with Nordic models of spatial homogenization or Latin America’s passive urbanization trajectories, the Wuling Mountain area presents dual ecological–cultural constraints []. These closely mirror the compound challenges characteristic of Southeast Asian highland countries []. On the one hand, due to the inversion of urban administrative scale and population agglomeration capacity, the population density in its counties was lower than that in the eastern counties. On the other hand, influenced by terrain and landforms, the service radius of administrative villages as basic spatial governance units was much higher than that of those in eastern counties, while their service efficiency was the opposite. At the level of factor allocation, institutional rigidity has further weakened spatial production elasticity. Unlike the “exogenous capital-driven” urban–rural interaction in the Pearl River Delta and Yangtze River Delta [,,], the land allocation in Wuling Mountain area was constrained by the combination of terrain barriers and property rights solidification, which can lead to the development paradox of “economy ahead and ecology behind”. It is necessary to deepen the understanding of the inherent mechanism of land system participation in urban–rural integration [,].
4.2. Future Research and Prospects of Integrated Urban–Rural Development in Wuling Mountain Area
Previous studies have constructed an evaluation index system for integrated urban–rural development from different dimensions [,,,,,]. Although multidimensional factors have been fully considered, the dynamic feedback mechanism and collaborative evolution between multidimensional factors have not been revealed. Therefore, the “element–structure–function” framework is taken as the core in constructing the evaluation index system, and factors such as population, economy, space, society, and ecology are comprehensively considered. It is also found that counties with strong factor siphoning have achieved multi-level linkage through spatial reconstruction, while counties with weak population absorption have gradually become marginalized, forming a polarization effect of gradient differentiation. This is consistent with the existing research on the urban–rural ternary structure [], factor mismatch [], and path dependence []. The analysis of the coupling coordination model shows that the collaborative level exhibits a gradient evolution trend, which is basically consistent with the conclusions of existing studies [,,]. The obstacle degree model further diagnoses that factors such as land urbanization, urban population density, cultural service supply, and green coverage have strong explanatory power, which is similar to the results of existing studies [,,,,]. Nevertheless, this study faces methodological and conceptual limitations, as detailed in the following discussion of constraints. Future research should therefore strengthen empirical exploration and theoretical refinement concerning positive feedback loops versus vicious feedback mechanisms within urban–rural integration.
The model and method employed in this paper have a certain novelty and applicability in the study of multidimensional coupling coordination and obstacle factors between urban and rural areas in mountainous counties, but they also have potential limitations. Therefore, future research needs to incorporate the urban–town–village regional system into the framework of integrated urban–rural development [] in order to break out of the limitations of phenomenalism. Furthermore, spatial heterogeneity and institutional adaptability [,] shall be comprehensively considered to further analyze the coordination relationship among economy, space, and society, and discuss resistance patterns to achieve a combination of subjective and objective science. Due to the widespread lack of an endogenous driving force [], especially the short-term effects of policy intervention, it is necessary to enhance the endogenous driving force through market-oriented reforms with a two-way flow of factors in the future. Focusing on the long-term impact of path dependence, and combined with on-site research and correction results, the spatial mismatch is accurately analyzed, and the risk of misjudgment is reduced, helping to deepen the understanding of the tripartite interaction, enrich the research on the integrated development of urban and rural areas in counties, and provide theoretical support and practical guidance for the development of similar regions.
Educational disparities directly hinder skill transferability and economic mobility, limiting rural human capital contribution to urban–rural integration. Simultaneously, reluctance toward rural-to-urban migration, often stemming from institutional barriers and cultural attachments, constrains essential labor reallocation and knowledge exchange between these areas. Such methodological challenges are common in developing economies’ transition studies. For instance: India’s rural education deficits restrict labor mobility [] and Brazil’s favelas demonstrate passive compliance in settlement formation []. Furthermore, China’s current approach to urban–rural integration operates on a “dual-wheel drive” principle. The first component tackles institutional rigidities through land system reforms and ecological compensation policies; a key example is permitting market entry for collectively owned commercial construction land [,]. The second component fosters endogenous development by leveraging county-level industrial clusters []. The Wuling Mountain area demonstrates a coordinated “policy–ecology–culture” framework. This model holds relevance for ecologically sensitive, less-developed regions seeking reference points. However, the area’s distinct mountainous conditions necessitate caution. Direct application of strategies like Japan’s localized “One Village, One Product” initiative [], or the underlying logic guiding public service allocation in Germany’s “urban–rural equivalence” concept, requires careful consideration and adaptation [].
This study acknowledges several limitations. Firstly, the evaluation index system could not incorporate factors like land ownership definition [], cultural identity mechanisms [], cross-domain governance effectiveness [], and quantitative data on sports/fitness infrastructure due to their current limited influence and data constraints. Secondly, data availability and indicator dimensionality issues hindered the full inclusion of key socio-cultural dimensions; notably, educational disparities and migration patterns remained underrepresented, potentially diminishing the measured role of human agency in factor flows. Third, while the “element–structure–function” framework provides structure, its capacity to analyze dynamic processes and interpret complex feedback mechanisms within integration remained constrained.
5. Conclusions
Based on the conceptual framework model of “element–structure–function”, methods such as entropy weight–TOPSIS, the coupling coordination degree model, and the obstacle degree model are employed to analyze the spatiotemporal characteristics, coordination relationships, and obstacle factors of integrated urban–rural development in 71 counties of Wuling Mountain area from 2010 to 2023. The main conclusions are as follows:
- (1)
- The integrated urban–rural development in counties of Wuling Mountain area showed a spatiotemporal evolution characteristic of “overall optimization–gap convergence–multipolar linkage–hot in the south and cold in the north”, with a relatively low level but significant room for improvement. From 2010 to 2023, the comprehensive average slowly increased from 0.428 to 0.502, with an average annual growth rate of only 1.213%, showing a continuous gradient upward trend but limited development effectiveness. The interprovincial average annual growth rate followed a hierarchical pattern of “Hunan Province > Chongqing City > Guizhou Province > Hubei Province”. Counties with strong factor siphoning achieved multipolar linkage through spatial reconstruction, while counties with weak population absorption gradually became marginalized, forming a polarization effect of gradient differentiation. Meanwhile, the CV showed the heterogeneity characteristics of “space > ecology > population > society > economy” in 2023.
- (2)
- The multidimensional coordination relationship was mainly influenced by the dual effects of spatial polarization and ecological constraints, its evolutionary path exhibited differentiated characteristics driven by multiple dimensions, and the “population–space” coupling coordination became the dominant mode. The comprehensive coupling coordination degree increased from 0.6380 in 2010 to 0.7016 in 2023, with an average annual growth rate of 0.52%. There was a significant difference in the coupling coordination between subsystems. During the sample period, the overall coupling coordination degree of 71 counties (cities, districts) was in the coordination stage, but it was still dominated by primary coordination. In 2018, the coupling coordination state began to trend towards spatial polarization, while the county coordination degree showed a characteristic of “polarization convergence” in 2023. Nearly 60% of counties achieved a level upgrade from the transition stage to the coordination stage, and the degree of advancement showed a “gradient increasing” trend.
- (3)
- The obstacle of spatial integration ranked first and the mismatch of factors was severe. The core constraint factors were the imbalance between land urbanization and population distribution. It urgently requires market-oriented reforms to solve structural contradictions. The obstacle degrees at the system level were ranked as space > population > society > economy > ecology. Among them, the spatial integration system had a high obstacle degree of 25.733%, becoming the largest obstacle level. The top five obstacle factors at the indicator level were ranked as land urbanization > urban population density > cultural service supply > green coverage rate > urban–rural land allocation, with average obstacle levels of 10.190%, 9.964%, 8.997%, 8.954%, and 8.466%, respectively. The core contradiction of the integrated urban–rural development in counties of the Wuling Mountain area is concentrated in the tripartite dilemma of “extensive land utilization–factor blockage–ecological antagonism”, and it is urgent to enhance its endogenous driving force through the market-oriented reform of two-way factor flow.
Author Contributions
Conceptualization, J.C., D.L. and J.Y.; methodology, software, formal analysis, validation, visualization, writing—original draft preparation, and visualization, J.C., T.H. and D.Y.; supervision and project administration, J.Y. and D.L.; investigation and data curation, J.C. and J.Y.; writing—review and editing, J.C., D.L. and F.W.; funding acquisition, D.L. All authors have read and agreed to the published version of the manuscript.
Funding
This research was funded by the Annual Project of Guizhou Province 2024 Philosophy and Social Sciences Planning, grant number 24GZYB38; the Special Research Project on the Study and Interpretation of the Spirit of the Third Plenary Session of the 20th Central Committee of the Communist Party of China, Tongren University; and the Engineering Research Center of Intelligent Monitoring and Policy Simulation of Mountainous Territorial Space, Higher Education Institutions of Guizhou province, grant number 2023045.
Institutional Review Board Statement
Not applicable.
Informed Consent Statement
Not applicable.
Data Availability Statement
The data presented in this study is available on request from the corresponding author. The data is not publicly available due to ethical restrictions.
Conflicts of Interest
The authors declare no conflicts of interest.
References
- Liu, Y.; Li, Y. Revitalize the world’s countryside. Nature 2017, 548, 275–277. [Google Scholar] [CrossRef]
- Zhu, X.; Yu, F. Evolution characteristics, regional differences and influencing factors of urban-rural integrated development at the county scale: Take 64 counties in Wuling Mountain Area as examples. J. Nat. Resour. 2025, 40, 1386–1411. [Google Scholar] [CrossRef]
- Chen, K.; Long, H. The progress and prospects of land system optimization promoting rural development transformation. J. Geogr. Res. 2022, 41, 2932–2945. [Google Scholar]
- Lin, J. Promoting Chinese path to modernization with high-quality urban-rural integration development. Frontiers 2024, 30–36. [Google Scholar] [CrossRef]
- Wang, L.; Zhu, P. The connotation, challenge and path of urbanization construction with county seat as an important carrier. J. Cent. Univ. Financ. Econ. 2023, 6, 3–11. [Google Scholar]
- Fei, X.T. Fei Xiaotong’s Discussion on Building of Small Towns; The Commercial Press: Beijing, China, 2021. [Google Scholar]
- Long, H.; Tu, S.; Ge, D.; Li, T.; Liu, Y. The allocation and management of critical resources in rural China under restructuring: Problems and prospects. J. Rural Stud. 2016, 47, 392–412. [Google Scholar] [CrossRef]
- Friedmann, J.; Douglass, M. Agropolitan Development: Towards a New Strategy for Regional Planning in Asia; University of California: Los Angeles, CA, USA, 1975; pp. 38–55. [Google Scholar]
- Lynch, K. Rural-Urban Interaction in the Developing World: Perspective on Development; Routledge: London, UK, 2005; pp. 45–60. [Google Scholar]
- Liu, Y.; Long, H.; Li, Y. Human geography research based on the new thinking of global rural-urban relationship. J. Acta Geogr. Sin. 2021, 76, 2869–2884. [Google Scholar]
- Zhou, D.; Zhong, W.; Zhang, J.; Wang, J.; Qi, J. Evaluation and differential development path of urban-rural integration at county level: A case study of 26 mountainous counties in Zhejiang Province. J. Sci. Geogr. Sin. 2023, 43, 1803–1814. [Google Scholar]
- Zhai, G.; Zhang, M.; Hu, Y.; Chen, Y.; Wu, C.; Lu, Y.; He, T. Nighttime light metrics for analysing urban-rural economic disparities: A case study in 36 Chinese metropolitan areas. Cities 2025, 162, 105930. [Google Scholar] [CrossRef]
- Yuan, F.; Zhou, W. The dynamic mechanism and logic of the urban-rural integration at the county-level in the process of Chinese path to modernization. J. Cent. China Norm. Univ. (Humanit. Soc. Sci.) 2023, 62, 49–59. [Google Scholar]
- Cheng, D.; Zhang, X.; Li, H.; Hu, X. Multi-scale differentiation and integration of terrain from an urban-rural perspective. J. Acta Geogr. Sin. 2025, 80, 304–323. [Google Scholar]
- Tu, S. The internal logic, basic orientation and advancement pathways of urban-rural integration development in county areas. J. Jiangxi Soc. Sci. 2024, 44, 35–45+205–206. [Google Scholar]
- Lewis, W.A. Economic Development with Unlimited Supplies of Labour; The Manchester School of Economic and Social Studies: Manchester, UK, 1954; Volume 22, pp. 139–191. [Google Scholar]
- The Group of Agricultural Ministry in the Center Research of State Council Development; Ye, X.; Xu, X. From urban-rural dualism to urban-rural integration: The prominent contradiction and future trend of urban-rural dualism in China. J. Manag. World 2014, 1–12. [Google Scholar] [CrossRef]
- Yao, Y.; Liang, M. The urban-rural relationship in the people’s republic of China: Its development, logic and prospect. J. Jilin Univ. J. Humanit. Soc. Sci. 2020, 60, 120–129+222. [Google Scholar]
- Gui, H. Research on county urbanization from the perspective of urban-rural triplex structure. People’s Trib. 2021, 14, 64–66. [Google Scholar]
- Luo, B.; Geng, P. Understand the integrated development of urban and rural areas within the county. J. Nanjing Agric. Univ. (Soc. Sci. Ed.) 2023, 23, 16–28. [Google Scholar]
- Jin, X.B.; Ye, C.; Yue, W.Z.; Ma, L.B.; Luo, Z.D.; Yang, R.; Lyu, X.; Wang, C.; Li, C.W.; Zhang, G.J.; et al. Urban-rural integrated development in China in the New Era: Challenges and paths. J. Nat. Resour. 2024, 39, 1–28. [Google Scholar] [CrossRef]
- Zhao, W.; Pan, W.; Li, Y. Urban-rural integration within the county territory: Theoretical connotation and research progress. J. Geogr. Res. 2023, 42, 1445–1464. [Google Scholar]
- Zhang, R.F.; Sun, Y.L. The internal logic and development approaches of the integrated development of the urban-rural areas at the county level in China in the perspective of the systematic analysis framework of "element-structure-function". J. Yunnan Minzu Univ. (Philos. Soc. Sci. Ed.) 2024, 41, 82–91. [Google Scholar]
- Sun, J.; Zhang, L. The production-life theoretical framework and key issues of county-level urban-rural integration development. J. Yunnan Minzu Univ. (Philos. Soc. Sci. Ed.) 2024, 44, 45–54. [Google Scholar]
- Chen, Q.; Wang, Z. Spatio-temporal coupling and interactive effects of land development intensity and economic resilience in the Wuling Mountains Area. Econ. Geogr. 2023, 43, 41–50. [Google Scholar]
- National Development and Reform Commission (NDRC). Press Briefing on the Implementation Guidelines for Promoting County-Level Urbanization Issued by the General Offices of the CPC Central Committee and the State Council (7 May 2022). Available online: https://www.gov.cn/zhengce/2022-05/07/content_5689006.htm (accessed on 21 July 2025).
- Su, H. Foundation, Trend and promotion of county’s urbanization in China. Economist 2021, 269, 110–119. [Google Scholar]
- Zheng, Y.; Long, H. Measurement and spatio-temporal pattern of urban-rural integrated development in China. J. Acta Geogr. Sin. 2023, 78, 1869–1887. [Google Scholar]
- He, T.; Lu, Y.; Yue, W.; Xiao, W.; Shen, X.; Shan, Z. A new approach to peri-urban area land use efficiency identification using multi-source datasets: A case study in 36 Chinese metropolitan areas. Appl. Geogr. 2023, 150, 102826. [Google Scholar] [CrossRef]
- Ma, Z.F.; Song, W.X.; Wang, J.K.; Chen, Y.R.; Xiong, Y.Q. The development level, evolution and influencing factor of urban-rural integration in the Yangtze River Delta. J. Nat. Resour. 2022, 37, 1467–1480. [Google Scholar] [CrossRef]
- Wang, K.; Liu, M.; Tan, J.; Guan, R.; Gan, C. Urban-rural integration effect of the spatial correlation network of tourism economy in the Wuling Mountain Area. Prog. Geogr. 2024, 43, 246–261. [Google Scholar] [CrossRef]
- Huang, Q.; Pan, T. The influence of new quality productivity on rural-urban integration development and its inner mechanisms. J. Chongqing Univ. (Soc. Sci. Ed.) 2025, 31, 1–16. [Google Scholar]
- Zhu, H.; Yu, M. Statistical evaluation of high-quality development level of county economy-Taking Hubei Province as an example. Stat. Decis. 2024, 40, 132–137. [Google Scholar]
- Wang, P.; Chen, Y.; Cheng, Y.; Song, J. Evolution and driving mechanism of urban-rural relationship in Hainan Province. World Reg. Stud. 2022, 31, 849–861. [Google Scholar]
- Chen, H.; Hua, Y. Measurement, Evolution and obstacle factors of high-quality development level of urban-rural integration in the core area of the Yangtze River Delta. Resour. Environ. Yangtze Basin 2024, 33, 2071–2084. [Google Scholar]
- Tan, J.; Wang, K. Coordination relationship and identification of obstacle factors between harmonious and beautiful rural construction and tourism urbanization: Take Wuling Mountain Area as an example. J. Nat. Resour. 2024, 39, 768–787. [Google Scholar] [CrossRef]
- Cong, X. Expression and mathematical property of coupling model, and its misuse in geographical science. Econ. Geogr. 2019, 39, 18–25. [Google Scholar]
- Han, D.; Yu, D.; Qiu, J. Assessing coupling interactions in a safe and just operating space for regional sustainability. Nat. Commun. 2023, 14, 1369. [Google Scholar] [CrossRef]
- Si, L.; Yan, F.; Pei, S. Factor integration and model selection: How can science and technology empower watershed ecological protection? Comparative analysis based on the experience of the Yangtze River, Pearl River and Yellow River basins. Qinghai Soc. Sci. 2023, 46–59. [Google Scholar] [CrossRef]
- Griffin, E.; Ford, L. A model of Latin American city structure. Geogr. Rev. 1980, 70, 397–422. [Google Scholar] [CrossRef]
- Scott, J.C. The Art of Not Being Governed: An Anarchist History of Upland Southeast Asia; Yale University Press: New Haven, CT, USA, 2009. [Google Scholar]
- He, T.; Song, H. A novel approach to assess the urban land-use efficiency of 767 resource-based cities in China. Ecol. Indic. 2023, 151, 110298. [Google Scholar] [CrossRef]
- Jiang, J.; Liu, Y.; Cui, X.; Zhang, Y. Spatial-temporal evolution and driving factors of market towns across Chengdu municipality, China from 2000 to 2020. Mt. Res. 2025, 43, 271–285. [Google Scholar]
- Munshi, K.; Rosenzweig, M. Traditional institutions meet the modern world: Caste, gender, and schooling choice in a globalizing economy. Am. Econ. Rev. 2006, 96, 1225–1252. [Google Scholar] [CrossRef]
- Perlman, J.E. The Myth of Marginality: Urban Poverty and Politics in Rio de Janeiro; University of California Press: Berkeley, CA, USA, 1976. [Google Scholar]
- An, X.; Meng, L.; Zeng, X.; Ma, L. How Urban–Rural Integration Symbiosis Can Ameliorate the Socioeconomic Inequity in Ecological Space: Evidence from Yunnan, China. Sustainability 2025, 17, 2895. [Google Scholar] [CrossRef]
- Wang, Z.F.; Xu, X.M.; Li, W.X.; Ge, X.N. The Impacts of Rural Collective Operating Construction Land Marketization on Local Government Land Leasing Behavior. Chin. Rural. Econ. 2025, 10, 54–70. [Google Scholar]
- Zhu, Y. Viscosity Matching: Operation Mechanism and Path Exploration of Wealthy Individuals’ Industry Landing in County Areas. J. Nanjing Agric. Univ. (Soc. Sci. Ed.) 2025, 25, 72–82. [Google Scholar]
- Claymone, Y.; Jaiborisudhi, W. A study on one village one product project (OVOP) in Japan and Thailand as an alternative of community development in Indonesia. Thai J. East Asian Stud. 2011, 16, 51–60. [Google Scholar]
- Bartl, W. Measuring “Equivalent Living Conditions”? The Use of Indicators in German Federal Spatial Planning. In Räumliche Ungleichheit-wie ein Föderalstaat sehen: Entwicklung und Folgen einer quantifizierenden Territorialpolitik in Deutschland; Springer: Wiesbaden, Germany, 2024; pp. 301–345. [Google Scholar]
Disclaimer/Publisher’s Note: The statements, opinions and data contained in all publications are solely those of the individual author(s) and contributor(s) and not of MDPI and/or the editor(s). MDPI and/or the editor(s) disclaim responsibility for any injury to people or property resulting from any ideas, methods, instructions or products referred to in the content. |
© 2025 by the authors. Licensee MDPI, Basel, Switzerland. This article is an open access article distributed under the terms and conditions of the Creative Commons Attribution (CC BY) license (https://creativecommons.org/licenses/by/4.0/).