Abstract
Achieving carbon neutrality is a global priority, and China’s “dual-carbon” goals place urgent demands on emission reduction. In this context, the digital economy and industrial structure transformation are key drivers of synergistic carbon mitigation and sustainable development. This study constructs an integrated analytical framework, combining an improved three-system coupling coordination model, exploratory spatial data analysis, and panel vector autoregression, using panel data from 30 Chinese provinces between 2013 and 2022. The results reveal three main findings: (1) Spatial heterogeneity: The digital economy follows an “advanced East—catching-up Central—lagging West” pattern, while carbon emissions show a “higher North—lower South” gradient. (2) Improving coordination with regional disparities: Overall coupling coordination has steadily increased, but Eastern provinces exhibit stronger synergistic capabilities than Central and Western regions. (3) Bidirectional interactions and self-reinforcing effects: Digital economy development drives industrial structure upgrading, which in turn promotes long-term carbon reduction; all three systems display self-reinforcing dynamics. These findings provide robust empirical evidence on the complex co-evolution of digital economy, industrial transformation, and carbon emissions, offering actionable insights for policymakers to design region-specific strategies for coordinated low-carbon development.
1. Introduction
In the critical stage of global sustainable development, achieving carbon neutrality has become a shared objective among nations. China has elevated green and low-carbon development to a national strategic priority by setting ambitious “dual carbon” goals—peaking carbon emissions before 2030 and achieving carbon neutrality by 2060—and integrating these objectives into the framework of ecological civilization. To accelerate this transformation, the Chinese government has introduced a series of strategic policies promoting the green transition, digital innovation, and high-quality economic growth.
Amid this transformation, the digital economy has emerged as a new engine for sustainable growth, reshaping industrial organization, production efficiency, and energy utilization. Its technological applications—such as big data, artificial intelligence, and the Internet of Things—offer innovative pathways to decarbonize traditional sectors, enhance resource allocation, and drive industrial upgrading. At the same time, industrial restructuring remains the cornerstone of low-carbon transformation, as it shifts economic activity from high-emission, energy-intensive industries toward advanced manufacturing and service sectors. The dual processes of digitalization and industrial upgrading are thus closely intertwined with carbon emission reduction, forming a new paradigm of coordinated economic and environmental transformation. Nevertheless, carbon emissions remain one of the greatest challenges to sustainable development. As one of the world’s largest emitters, China faces the dual task of maintaining economic growth while reducing carbon intensity. The process of carbon reduction is both a result and a catalyst of industrial upgrading—carbon constraints stimulate the emergence of digital innovations and green technologies that improve monitoring, management, and efficiency in production. Consequently, carbon emissions, industrial restructuring, and digital economic development are deeply interlinked, jointly shaping China’s pathway toward carbon neutrality.
The interplay among these three dimensions provides a unique perspective for analyzing how digitalization supports sustainable transformation. On the one hand, digital technologies are increasingly embedded in production, distribution, and service processes, enabling intelligent and flexible industrial operations [,]. On the other hand, the digital economy transcends traditional industrial boundaries, giving rise to new forms such as the sharing economy and digital trade []. Through the integration of industrial internet platforms, upstream and downstream resources are better coordinated, enhancing total factor productivity and promoting the green upgrading of traditional sectors [,].
Meanwhile, industrial restructuring plays a crucial role in achieving carbon reduction targets. The government encourages high-energy-consuming industries to adopt digital technologies to enhance efficiency and promote the development of low-carbon sectors such as renewable energy and digital services []. Digital transformation also stimulates green innovation in production processes—for instance, the integration of carbon capture and real-time monitoring systems significantly improves the precision and effectiveness of emission reduction strategies [,]. Furthermore, growing international low-carbon trade regulations compel firms to accelerate transformation and adapt to global green supply chains [,].
At the same time, the dual carbon goals and the digital economy have developed a mutually reinforcing relationship. The pressure of carbon reduction drives innovation in digital green technologies such as energy-efficient data centers and AI-optimized regional energy systems [,]. In turn, digital technologies facilitate carbon mitigation through the integration of renewable energy and carbon-inclusive platforms that use credit-based incentives to encourage public participation in low-carbon activities [,]. Moreover, carbon data itself is becoming an important production factor in the digital economy. Enterprises now transform carbon-related data collected via IoT technologies into tradable carbon assets, promoting the integration of carbon and data factor markets and supporting the growth of green finance [,].
However, existing studies predominantly explore bilateral relationships, focusing on two-way interactions such as “digital economy–carbon emissions” or “industrial structure–carbon emissions,” while systematic analyses of their tripartite coupling mechanisms remain scarce [,,]. As a result, the complex feedback loop among digital innovation, structural transformation, and emission reduction—particularly their spatiotemporal co-evolution and dynamic coordination—has not been fully addressed. Bridging this gap is essential for understanding how technological and structural transformations jointly contribute to achieving carbon neutrality.
To address this gap, this study constructs a spatiotemporal dynamic analytical framework that integrates the digital economy, industrial restructuring, and carbon emissions into a unified system. Specifically, it seeks to answer three research questions:
- (1)
- What are the spatiotemporal differentiation patterns of the digital economy, industrial restructuring, and carbon emissions across Chinese provinces from 2013 to 2022?
- (2)
- How do these three systems co-evolve and interact, as measured through a modified coupling coordination degree model and Exploratory Spatial Data Analysis?
- (3)
- What are the dynamic interaction mechanisms among these systems, as examined using a Panel Vector Autoregression model combined with GMM estimation, impulse response functions, and variance decomposition?
By integrating digital economy, industrial transformation, and carbon emissions into a cohesive analytical framework, this study makes several contributions. First, it provides a comprehensive examination of how the digital economy, industrial transformation, and carbon emissions interact under China’s “dual-carbon” strategy. Second, the use of an improved three-system coupling coordination model enhances the methodological rigor and depth of sustainable development research. Third, it offers empirical evidence on the spatial and temporal dynamics of regional coordinated development, providing valuable policy insights for balancing digital growth with low-carbon transformation. Overall, the findings advance both theoretical understanding and practical strategies for achieving a synergistic green and digital transition.
2. Research Method and Data
2.1. Research Framework
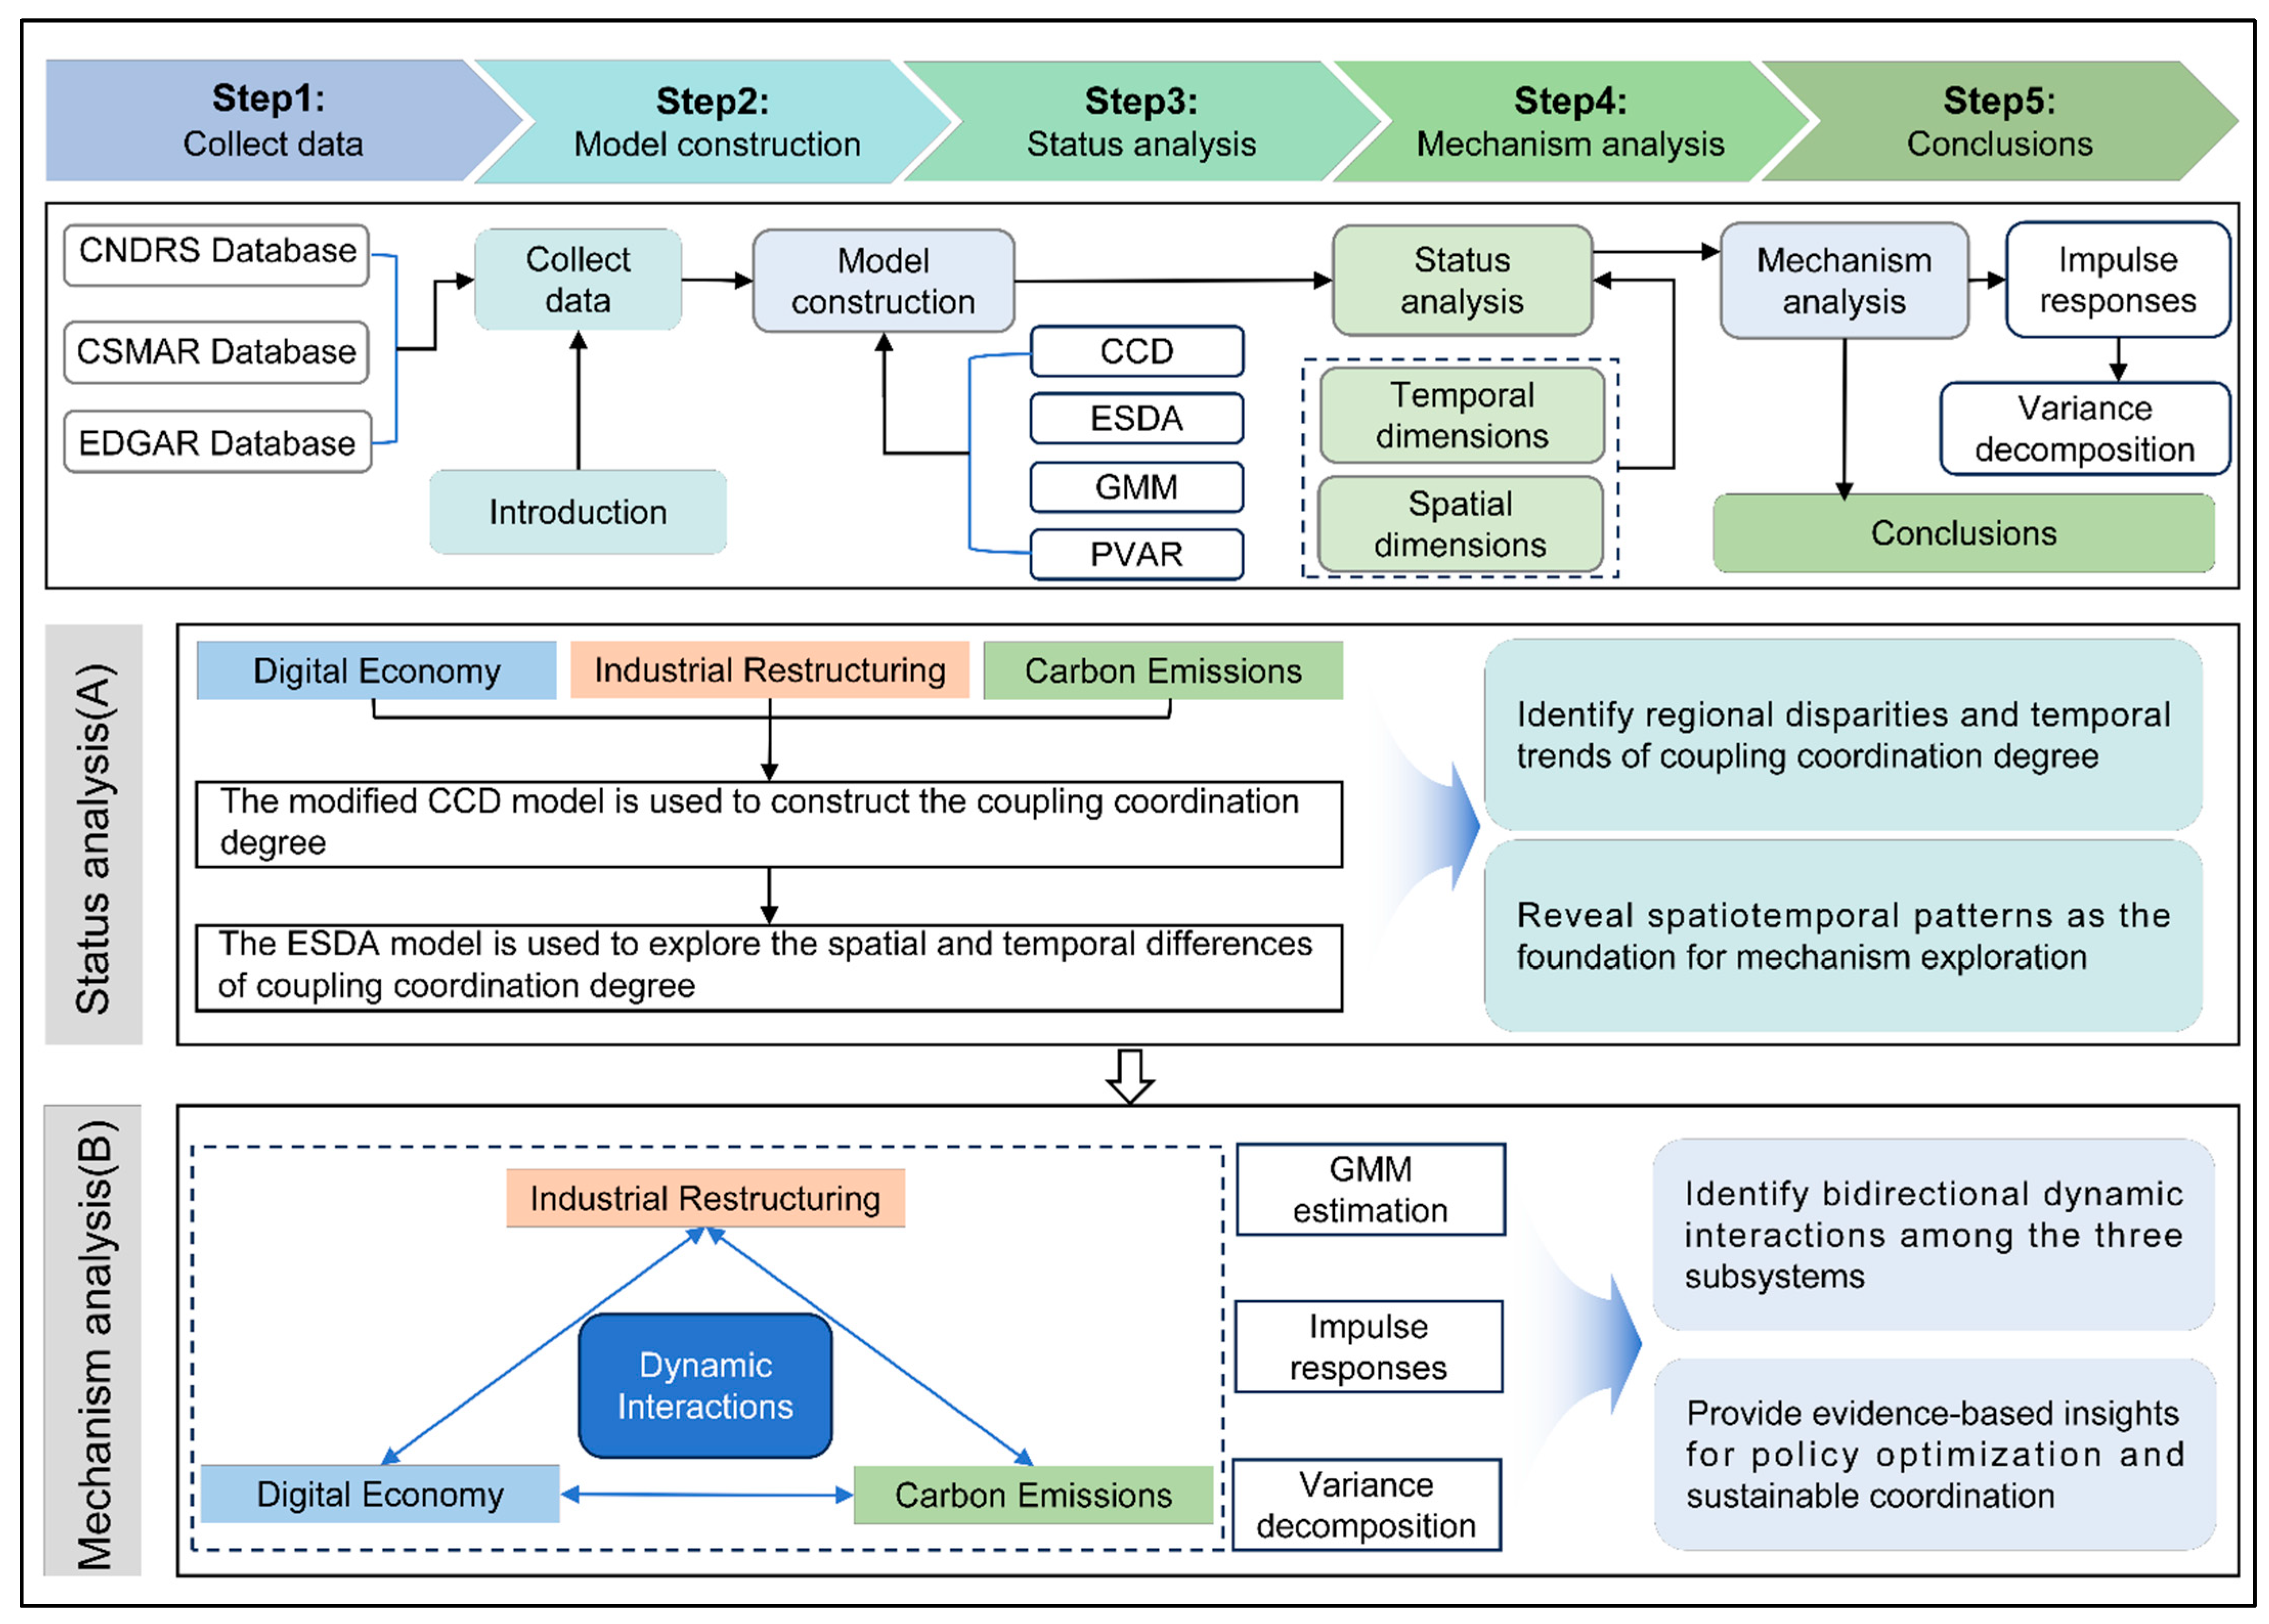
To systematically illustrate the logical structure of this study, Figure 1 presents the overall research framework, which integrates data collection, model construction, status analysis, mechanism analysis, and policy implications.
Figure 1.
Research framework. Note: Steps 3 and 4 are illustrated in detail in the lower panels—Status Analysis (A) and Mechanism Analysis (B)—which present the specific methodologies and analytical objectives of each stage.
In Step 1, panel data from multiple authoritative sources—including the CSMAR, CNRDS, and EDGAR databases—are collected to construct a comprehensive dataset covering 30 Chinese provinces during 2013–2022.
In Step 2, a series of analytical models are established. These include a modified Coupling Coordination Degree (CCD) Model to measure the synergistic interaction among the digital economy, industrial restructuring, and carbon emissions; the Exploratory Spatial Data Analysis (ESDA) model to capture spatial dependence and heterogeneity; and a Panel Vector Autoregression (PVAR) model combined with GMM estimation to reveal the dynamic interaction mechanism and feedback effects among the three systems.
In Step 3, the status analysis focuses on examining the temporal evolution and spatial distribution of the three subsystems and their coupling coordination degree, revealing regional disparities and temporal trends in coordinated development.
In Step 4, the mechanism analysis employs the PVAR and GMM models to identify bidirectional dynamic interactions, transmission pathways, and long-term equilibrium relationships among the subsystems. Impulse response and variance decomposition techniques are further used to evaluate short-term shocks and long-term adjustment effects.
Finally, Step 5 summarizes the main findings and provides policy implications aimed at promoting coordinated and sustainable development among digital transformation, industrial upgrading, and carbon reduction.
This integrative framework highlights the analytical logic of the study, linking empirical models with theoretical objectives and demonstrating how data-driven evidence informs strategic policy insights.
2.2. Indicator Measurement
2.2.1. Measurement of Digital Economy Index
For the measurement of the digital economy, this study builds upon established evaluation frameworks proposed by previous scholars [,], while reconstructing a refined indicator system tailored to the research objectives. The framework comprises three primary dimensions: digital infrastructure, industrial digitization, and digital industrialization. A detailed breakdown of secondary and tertiary indicators is provided in Table 1.
Table 1.
Digital Economy Measurement Indicator System.
The entropy method is widely adopted in the construction of composite evaluation indices due to its objectivity and data-driven weighting mechanism []. In this study, the entropy method is employed to measure the digital economy based on the previously established indicator system.
Given the varying units and scales of the selected indicators, data standardization is performed prior to the entropy calculation to ensure comparability across variables. The specific computational steps are as follows:
Positive indicators:
Negative indicators:
where yij represents the standardized value; min(xij) and max(xij) are the maximum and minimum values in year i.
The process of calculating entropy values and weights:
In Equations (3) and (4), Ej and pij are the entropy and proportion values, respectively; Wi is the entropy weighting method in Equation (5); S denotes the total number of indicators included in the analysis.
2.2.2. Measurement of Industrial Structure Transformation
Drawing on prior research on industrial structure measurement [,] and in alignment with the current trajectory of China’s industrial Structure Transformation, this study adopts industrial structure sophistication as a proxy for the degree of industrial transformation. This indicator captures both the depth and quality of structural change and is widely regarded as an effective reflection of industrial Structure Transformation. Accordingly, industrial structure sophistication is used to quantify the outcomes of provincial-level industrial Structure Transformation. The specific calculation formula is as follows:
2.2.3. Measurement of Carbon Emissions
Various approaches have been proposed to measure carbon emissions and carbon intensity [,,]. Following the mainstream practice in high-impact empirical studies, this paper adopts data from the Emissions Database for Global Atmospheric Research (EDGAR), developed jointly by the European Commission’s Joint Research Centre and the Netherlands Environmental Assessment Agency. EDGAR is widely recognized as one of the most authoritative and comprehensive global databases for anthropogenic greenhouse gas emissions.
The database provides consistent and comparable emission estimates across countries and regions, based on harmonized methodologies and verified energy statistics. It offers high spatial and temporal resolution and covers multiple emission sources, including fossil fuel combustion, industrial processes, and agriculture. These characteristics ensure the accuracy and reliability of long-term emission trend analyses.
EDGAR’s standardized estimation framework minimizes measurement bias and enhances international comparability, which is particularly valuable for cross-provincial and time-series analyses. Therefore, this study adopts EDGAR as the core data source for provincial carbon emissions, ensuring methodological consistency and analytical robustness throughout the empirical analysis.
2.3. Coupling Coordination Degree Model
Traditional coupling coordination degree models primarily focus on the interaction between two systems [,]. To comprehensively examine the tripartite relationship among the digital economy, industrial structure transformation, and carbon emissions, this study extends the conventional dual-system model by deriving a three-system coupling coordination degree model. This extended framework captures the dynamic interdependence and synergy among the three subsystems. For clarity, the digital economy, industrial structure transformation, and carbon emissions systems are hereafter referred to as the D-I-C system.
Due to differences in the attributes and scales of the digital economy index (DEI), industrial structure sophistication index (IND), and the logarithmic total carbon emissions (lnCEI), data standardization is applied prior to analysis. This step ensures comparability across indicators and eliminates the influence of dimensional inconsistency.
By applying the coupling coordination degree (CCD) model, we can quantitatively assess the level of interactive development among the three subsystems, revealing whether they evolve in a harmonious manner and identifying spatial and temporal disparities in their coordination. In particular, the CCD captures the extent to which the growth of the digital economy and the transformation of industrial structures contribute synergistically—or conflict—with carbon reduction objectives. This analysis also provides a foundation for subsequent spatial econometric and dynamic studies, as the resulting coordination patterns and their evolution over time offer insights into how and why the three systems interact differently across regions and periods. In essence, the CCD transforms complex interactions among digitalization, industrial upgrading, and carbon mitigation into measurable indicators that reflect the overall quality and sustainability of regional development.
The dual-system coupling coordination model is expressed as Equation (7):
The three-system coupling coordination model is defined by Equations (8)–(10):
In this framework, D2 denotes the coupling coordination degree of the dual-system model, where ρ and λ represent the assigned weights of each subsystem. D3 corresponds to the coupling coordination degree of the three-system model. Specifically, C3 indicates the coupling degree among the three subsystems, and T3 represents the comprehensive development index. The coefficients α, β, and γ are used to assign weights to the three subsystems. Assuming equal contributions from the digital economy, industrial structure transformation, and carbon emissions, we set α = β = γ = 1/3. The functions f(x), g(x), and h(x) denote the standardized indices of the digital economy, industrial structure sophistication, and logarithmic total carbon emissions, respectively.
The traditional coupling coordination degree model effectively captures the degree of interaction among subsystems but exhibits several notable limitations, such as weak discriminative power, boundary calculation errors, and the overlap between coupling and coordination measurements. To address these issues, this study adopts an improved version of the model based on recent methodological advances proposed [,].
Specifically, the modified coupling degree function is redefined to enhance its sensitivity to differences among subsystem values while ensuring the coupling and coordination components are conceptually independent. The revised Equations (11)–(13) are expressed as follows:
In this framework, corresponds to the coupling coordination degree of the improved three-system model. Specifically, indicates the coupling degree among the three subsystems, and represents the comprehensive development index. The term refers to the standardized subsystems indices f(x), g(x), and h(x), where represents the number of subsystems (n = 3 in this study). The coefficient denotes the weight assigned to each subsystem, reflecting its contribution to the overall system performance. Assuming equal importance of the digital economy, industrial structure transformation, and carbon emissions, all subsystems are assigned equal weights ().
Compared with the traditional model, this revision offers three major improvements:
- (1)
- It addresses the boundary problem that arises when one subsystem takes a value of zero. In the conventional formulation, when one subsystem takes a value of zero, the overall coupling degree also collapses to zero (e.g., C(1,1,1,0) = 0), even if the remaining subsystems exhibit strong interdependence. This distortion misrepresents the actual level of system coordination. To correct this, the improved model introduces a two-step normalization and boundary-adjustment mechanism. First, all subsystem indices are standardized within the range (0, 1] to eliminate dimensional bias. Second, a distance-based boundary adjustment is applied to differentiate the relative contributions of each subsystem and to maintain valid coupling results even when one subsystem approaches zero. This procedure ensures both the mathematical continuity and the comparability of the coupling coefficient across multi-dimensional systems, thereby providing a more realistic reflection of inter-system coordination.
- (2)
- It removes the conceptual overlap between coupling and coordination by defining the coupling degree purely as a measure of relative deviation, while the coordination index reflects the integrated level of overall development. Through this separation, the model captures the dispersion of subsystem development independently from the magnitude of their joint progress.
- (3)
- It enhances the discriminative power and stability of the coupling results, particularly in multi-dimensional systems, ensuring that variations in subsystem performance are more precisely identified. This refinement improves the sensitivity of the model to small differences in subsystem development levels, resulting in more robust and interpretable coupling outcomes.
This refinement enhances the scientific validity and interpretability of the coupling coordination analysis and allows a more nuanced understanding of the interactive dynamics between the digital economy, industrial transformation, and carbon emissions.
2.4. ESDA Model
The Exploratory Spatial Data Analysis (ESDA) model is a foundational tool for identifying spatial associations and clustering patterns in geographical data [,]. Its core methodologies include global spatial auto correlation and local spatial auto correlation analyses.
Global spatial autocorrelation is employed to evaluate whether a spatial phenomenon demonstrates statistically significant clustering or dispersion across the entire study area. It reflects the average degree of spatial association for a given variable. In this study, we apply global spatial autocorrelation analysis to assess the overall spatial correlation of the D-I-C coupling coordination degree across Chinese provinces. Specifically, Moran’s Index (I) is used to measure the degree of spatial dependence in the coupling coordination values. The formula is defined as follows (Equation (14)):
In the above formula, n denotes the total number of provinces, while xᵢ and represent the D-I-C coupling coordination degree of province i and its neighboring province j, respectively. is the average coupling coordination degree across all provinces, and wᵢⱼ is the spatial weight matrix that defines the spatial adjacency or interaction intensity between provinces.
Moran’s Index(I) ranges from −1 to 1. A value of I > 0 indicates significant positive spatial autocorrelation, implying that adjacent provinces tend to exhibit similar levels of coordination. Conversely, I < 0 suggests negative spatial auto correlation, where neighboring provinces display divergent levels of coordination.
To further investigate localized spatial patterns, local spatial autocorrelation analysis is conducted. This method identifies spatial clusters and outliers, capturing spatial heterogeneity at a finer scale. In this study, local Moran’s I is applied to evaluate the local spatial association patterns of the D-I-C coupling coordination degree across Chinese provinces.
The spatial clustering results are visualized using local Moran scatter plots, which highlight the direction and strength of spatial associations within each province. The calculation of the local Moran’s Index is given by the following formula (Equation (15)):
2.5. PVAR Model
Building on the preceding theoretical analysis, the digital economy, industrial structure transformation, and carbon emissions exhibit complex bidirectional interactions. To investigate these dynamic interrelationships, this study constructs a Panel Vector Autoregression (PVAR) model incorporating the three dimensions: digital economy, industrial structure transformation, and carbon emissions.
The PVAR framework is particularly well-suited for this analysis as it addresses potential endogeneity issues, treats all variables as endogenous, and allows for the examination of impulse response functions and variance decomposition, thereby capturing the temporal dynamics and mutual influence among the variables. Moreover, this approach is methodologically innovative in the context of existing literature, as few studies have examined the co-evolution and interactive feedback mechanisms among all three systems simultaneously. By integrating these techniques, the PVAR model not only provides a more comprehensive and dynamic understanding of system interactions but also ensures the robustness and validity of the findings, offering meaningful insights for both theory and policy design.
The model is specified as follows:
where r denotes the province, and p represents the selected lag order. The vector Yᵣ,ₜ includes the three core variables: digital economy index, industrial structure sophistication, and logarithmic total carbon emissions. The matrix represents the coefficient matrices corresponding to each lag order j.
Additionally, μᵣ captures province-specific fixed effects, λₜ represents time fixed effects, and εᵣ,ₜ is the residual term. The inclusion of both individual and time effects accounts for unobserved heterogeneity across provinces and time periods, enhancing the robustness of the dynamic analysis.
2.6. Data Sources
This study employs balanced panel data from 30 Chinese provinces (excluding Tibet, Hong Kong, Macao, and Taiwan) covering the period from 2013 to 2022. The datasets are compiled from multiple authoritative and publicly accessible sources, including the China Statistical Yearbook, Provincial Statistical Yearbooks, National Bureau of Statistics (NBS) databases, CSMAR database, CNRDS database, EDGAR database, Qichacha database, the Peking University Digital Inclusive Finance Index Database, and several official government bulletins.
To enhance data reliability and transparency, all variables were obtained from credible, officially released, or peer-recognized databases. The detailed data sources, along with access links and descriptions, are summarized in Table 2. This structured presentation ensures data verifiability and improves the reproducibility and scientific robustness of the analysis.
Table 2.
Data Sources and Descriptions.
3. Results and Discussion
3.1. Spatiotemporal Evolution Characteristics of DEI, IND, and lnCEI
3.1.1. Temporal Evolution Characteristics of DEI, IND, and lnCEI
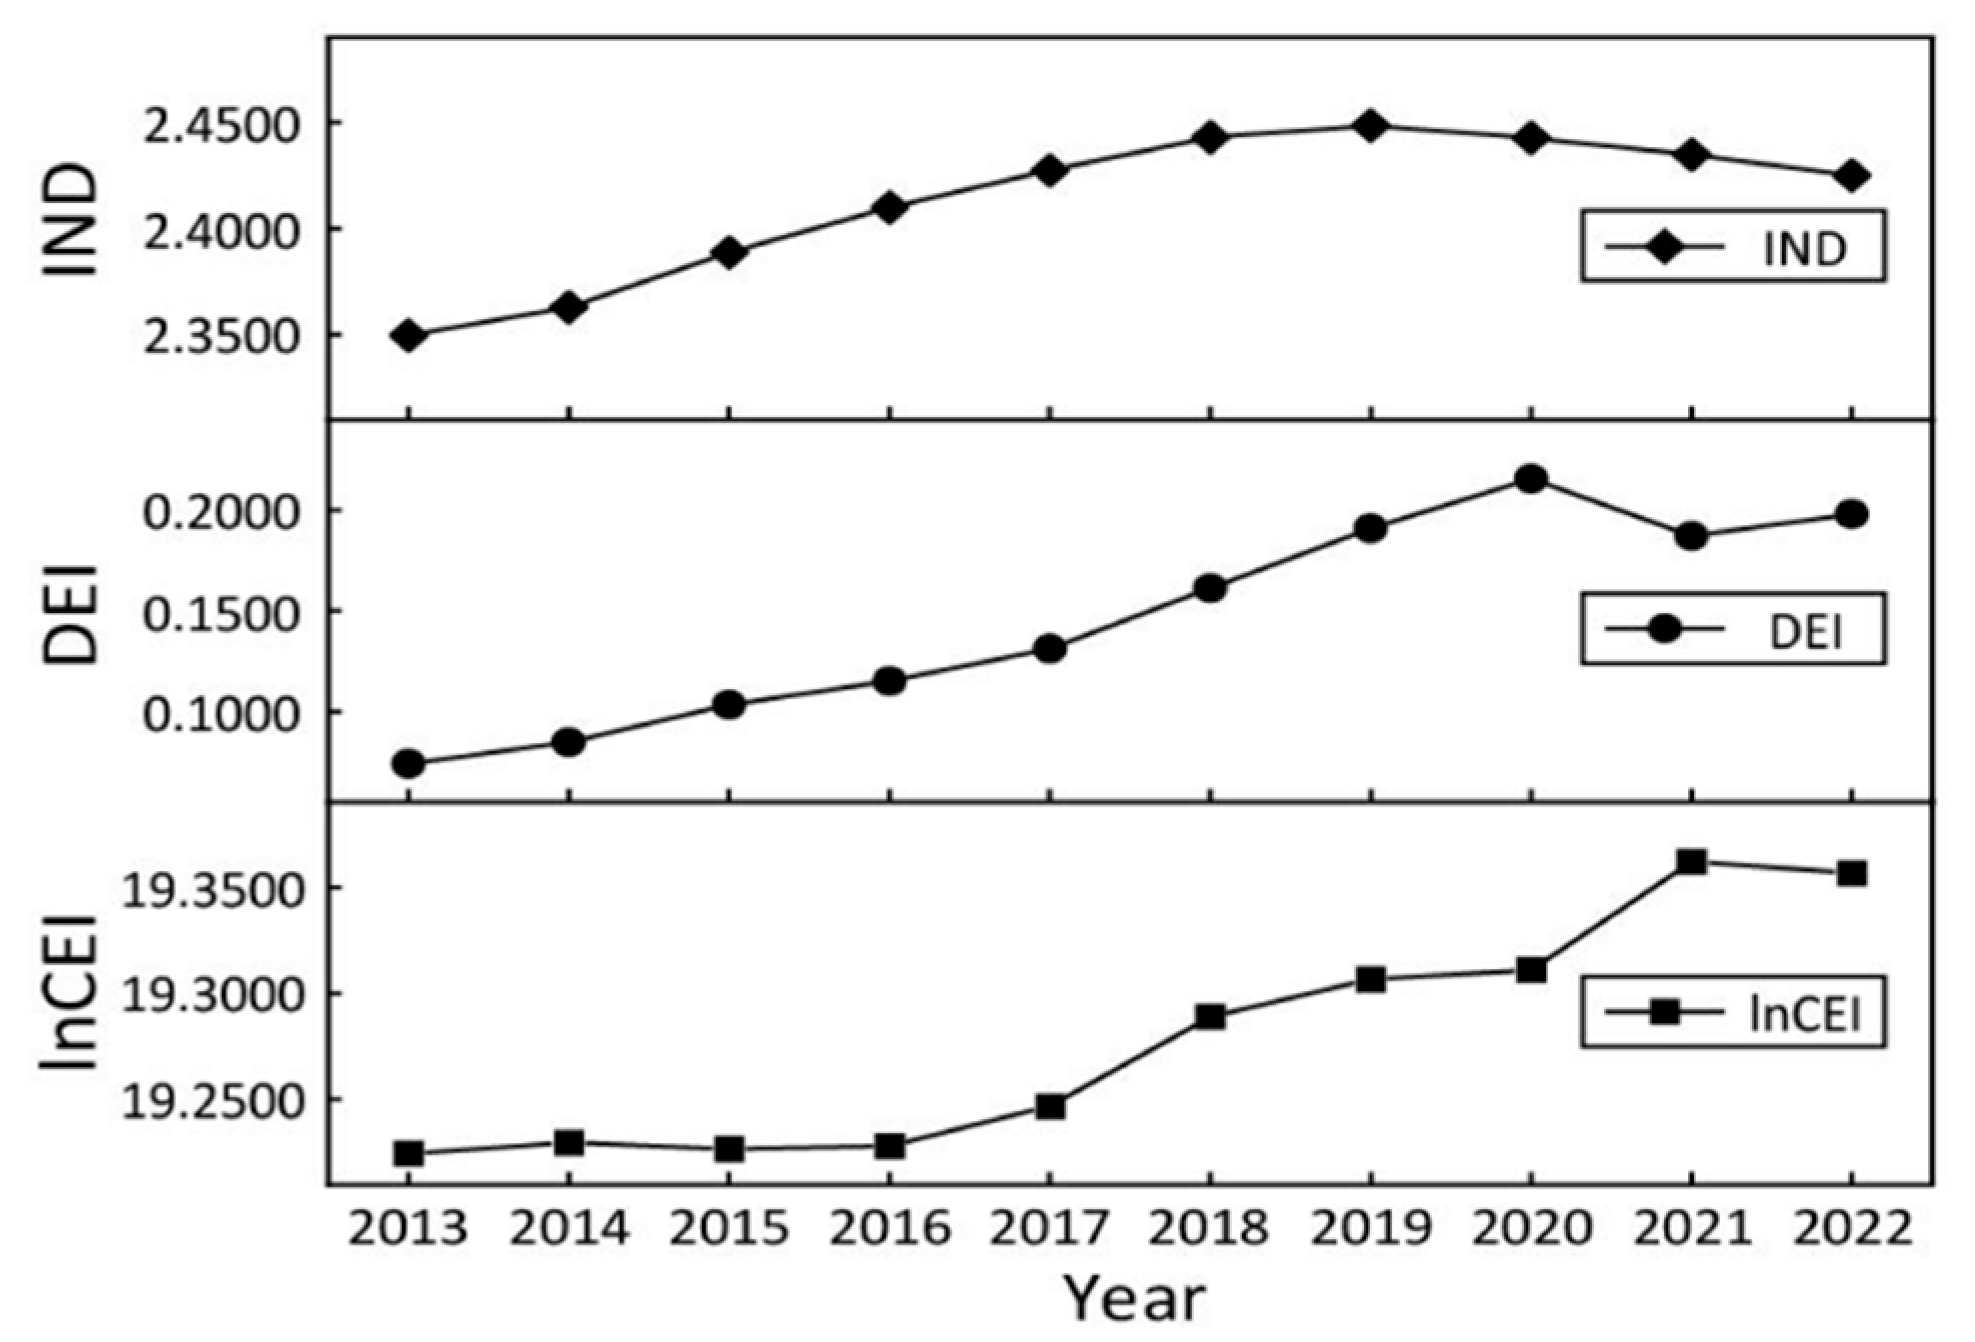
Figure 2 illustrates the temporal evolution of the DEI, IND, and lnCEI in China from 2013 to 2022. As shown in the figure, these three systems underwent a closely intertwined process of expansion and adjustment. Rather than evolving independently, they gradually transitioned from parallel growth toward dynamic coordination, reflecting China’s continuous efforts to reconcile economic development with decarbonization.
Figure 2.
Temporal evolution of DEI, IND and lnCEI.
In the early stage, all three indicators increased simultaneously, highlighting the tension between rapid economic expansion and high energy dependence. The fluctuations observed after 2019 and 2021 mark a turning point in this trajectory. The moderate slowdown of IND and the temporary decline in the DEI represent short-term cyclical adjustments rather than structural stagnation, largely driven by post-pandemic recovery pressures and policy realignment. Meanwhile, the sustained rise in carbon emissions—followed by a slight decrease in 2022—suggests that the mitigation effects of digital and industrial transitions have begun to emerge, though with a certain time lag.
Overall, Figure 2 reveals that the three subsystems are entering a phase of adaptive coordination. Digitalization is no longer functioning as an isolated driver of growth; instead, it increasingly interacts with industrial restructuring to influence carbon emission trajectories. This pattern encapsulates China’s gradual transition from growth-driven emissions to coordinated low-carbon development.
3.1.2. Spatial Evolution Characteristics of DEI, IND, and lnCEI
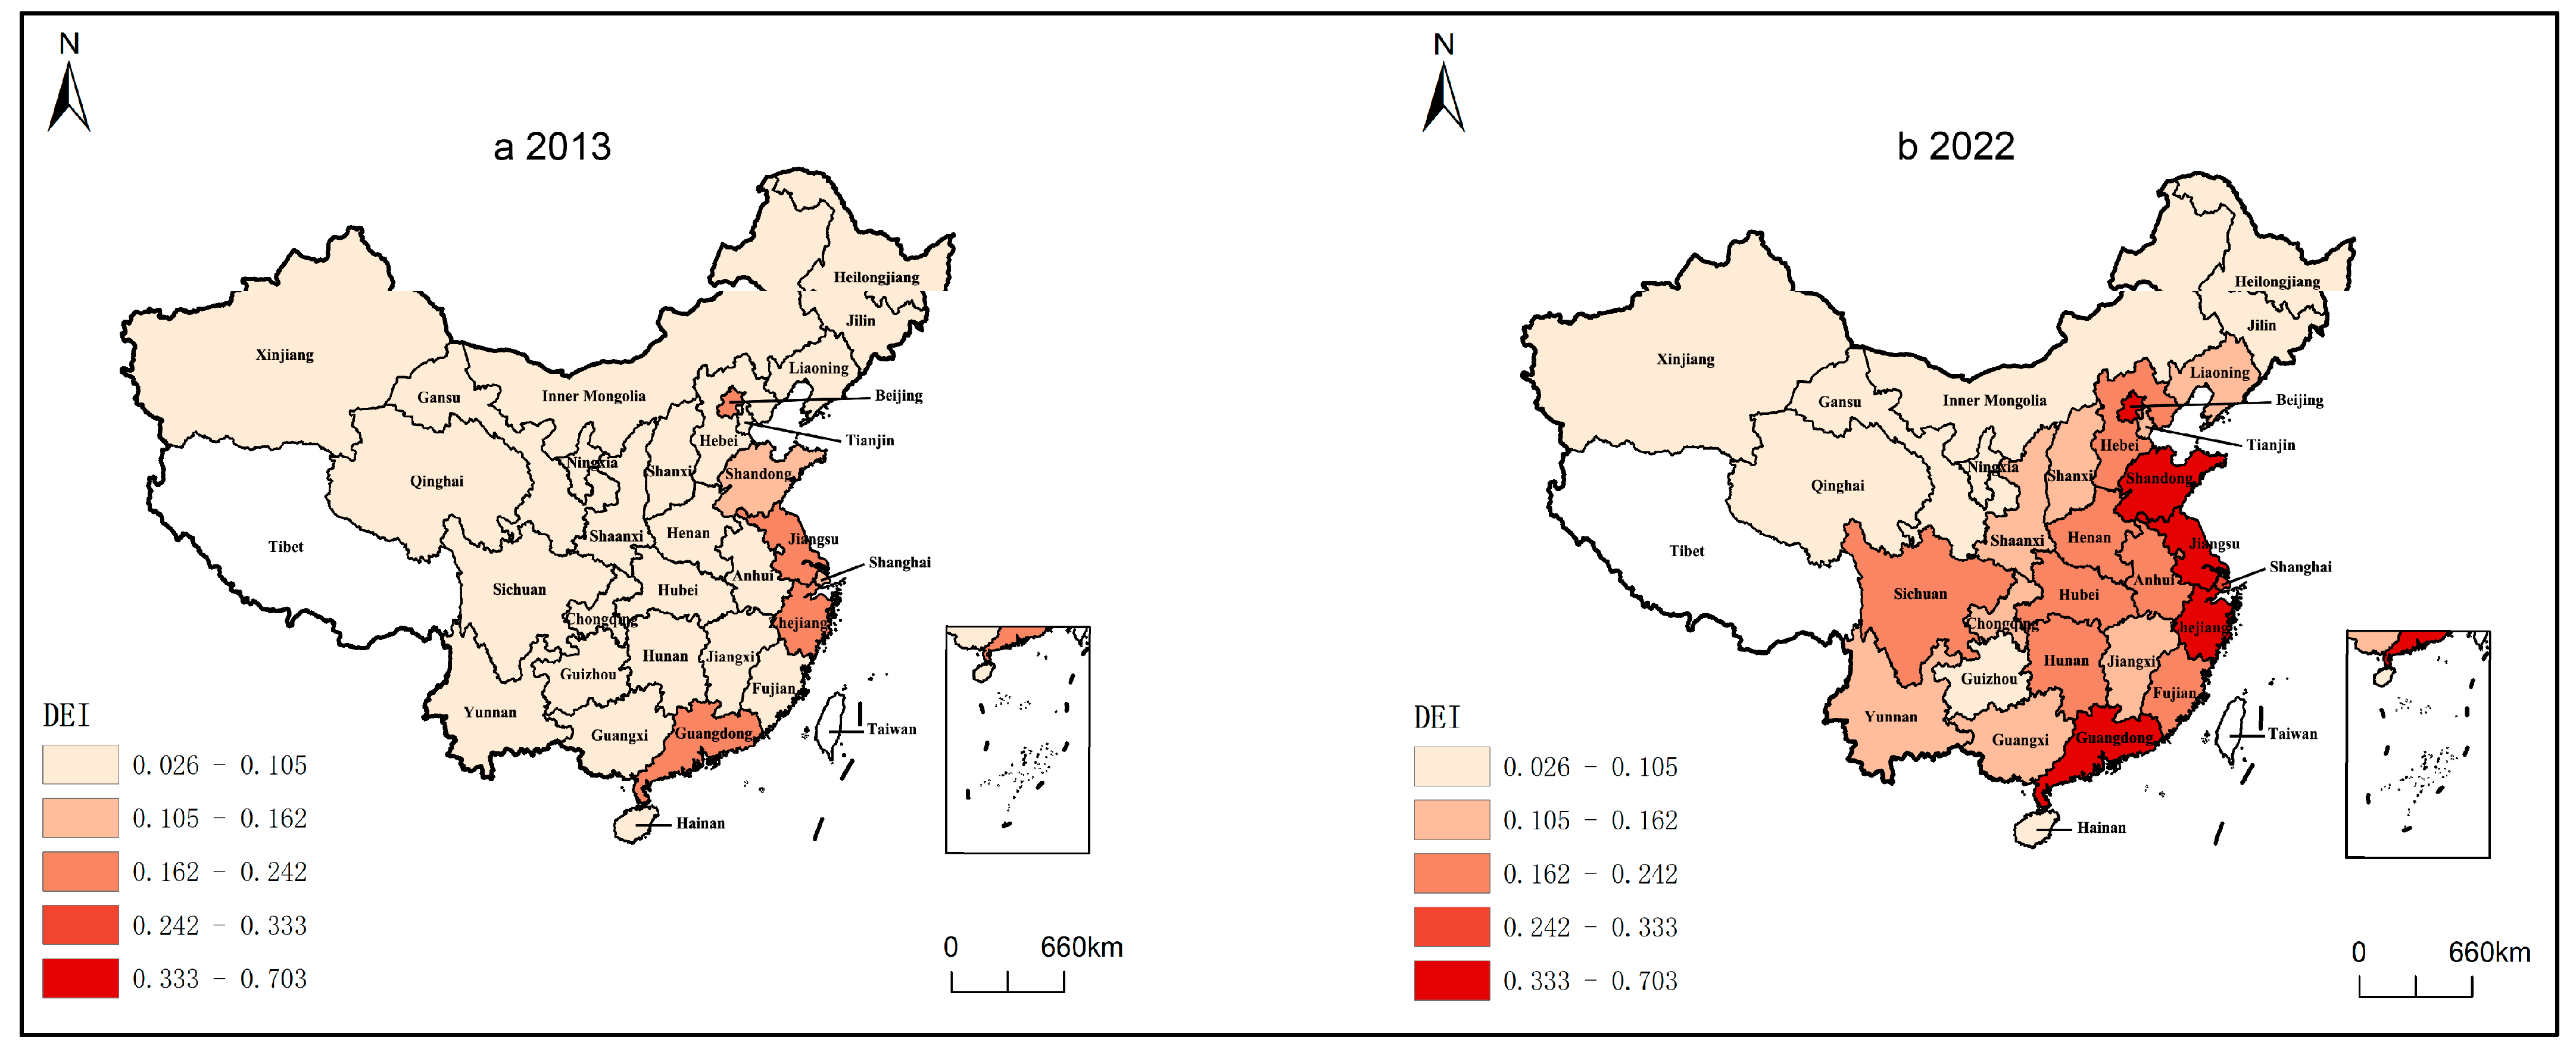
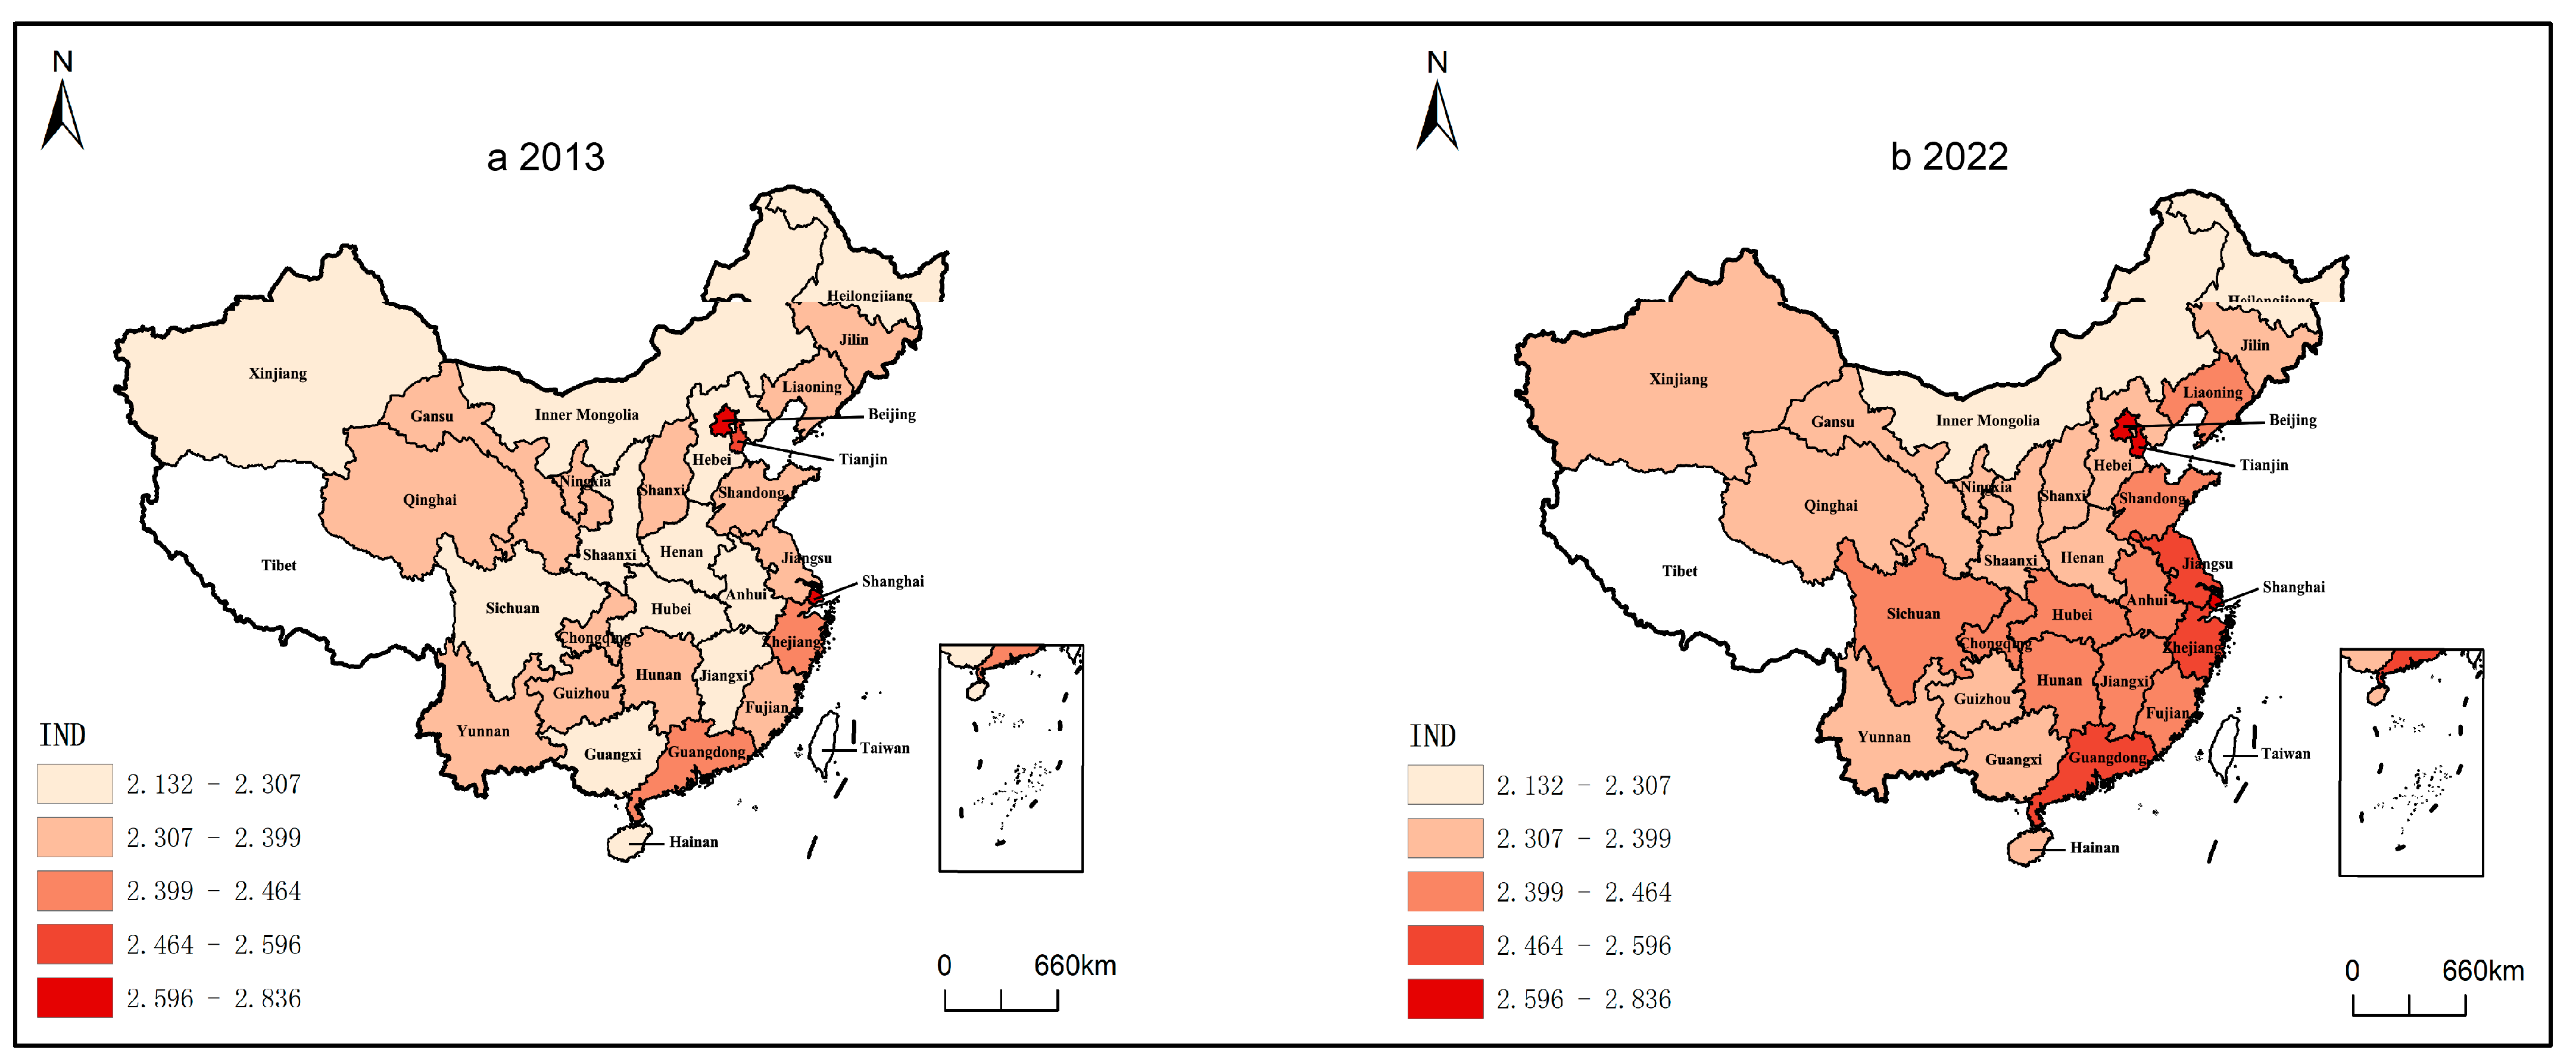
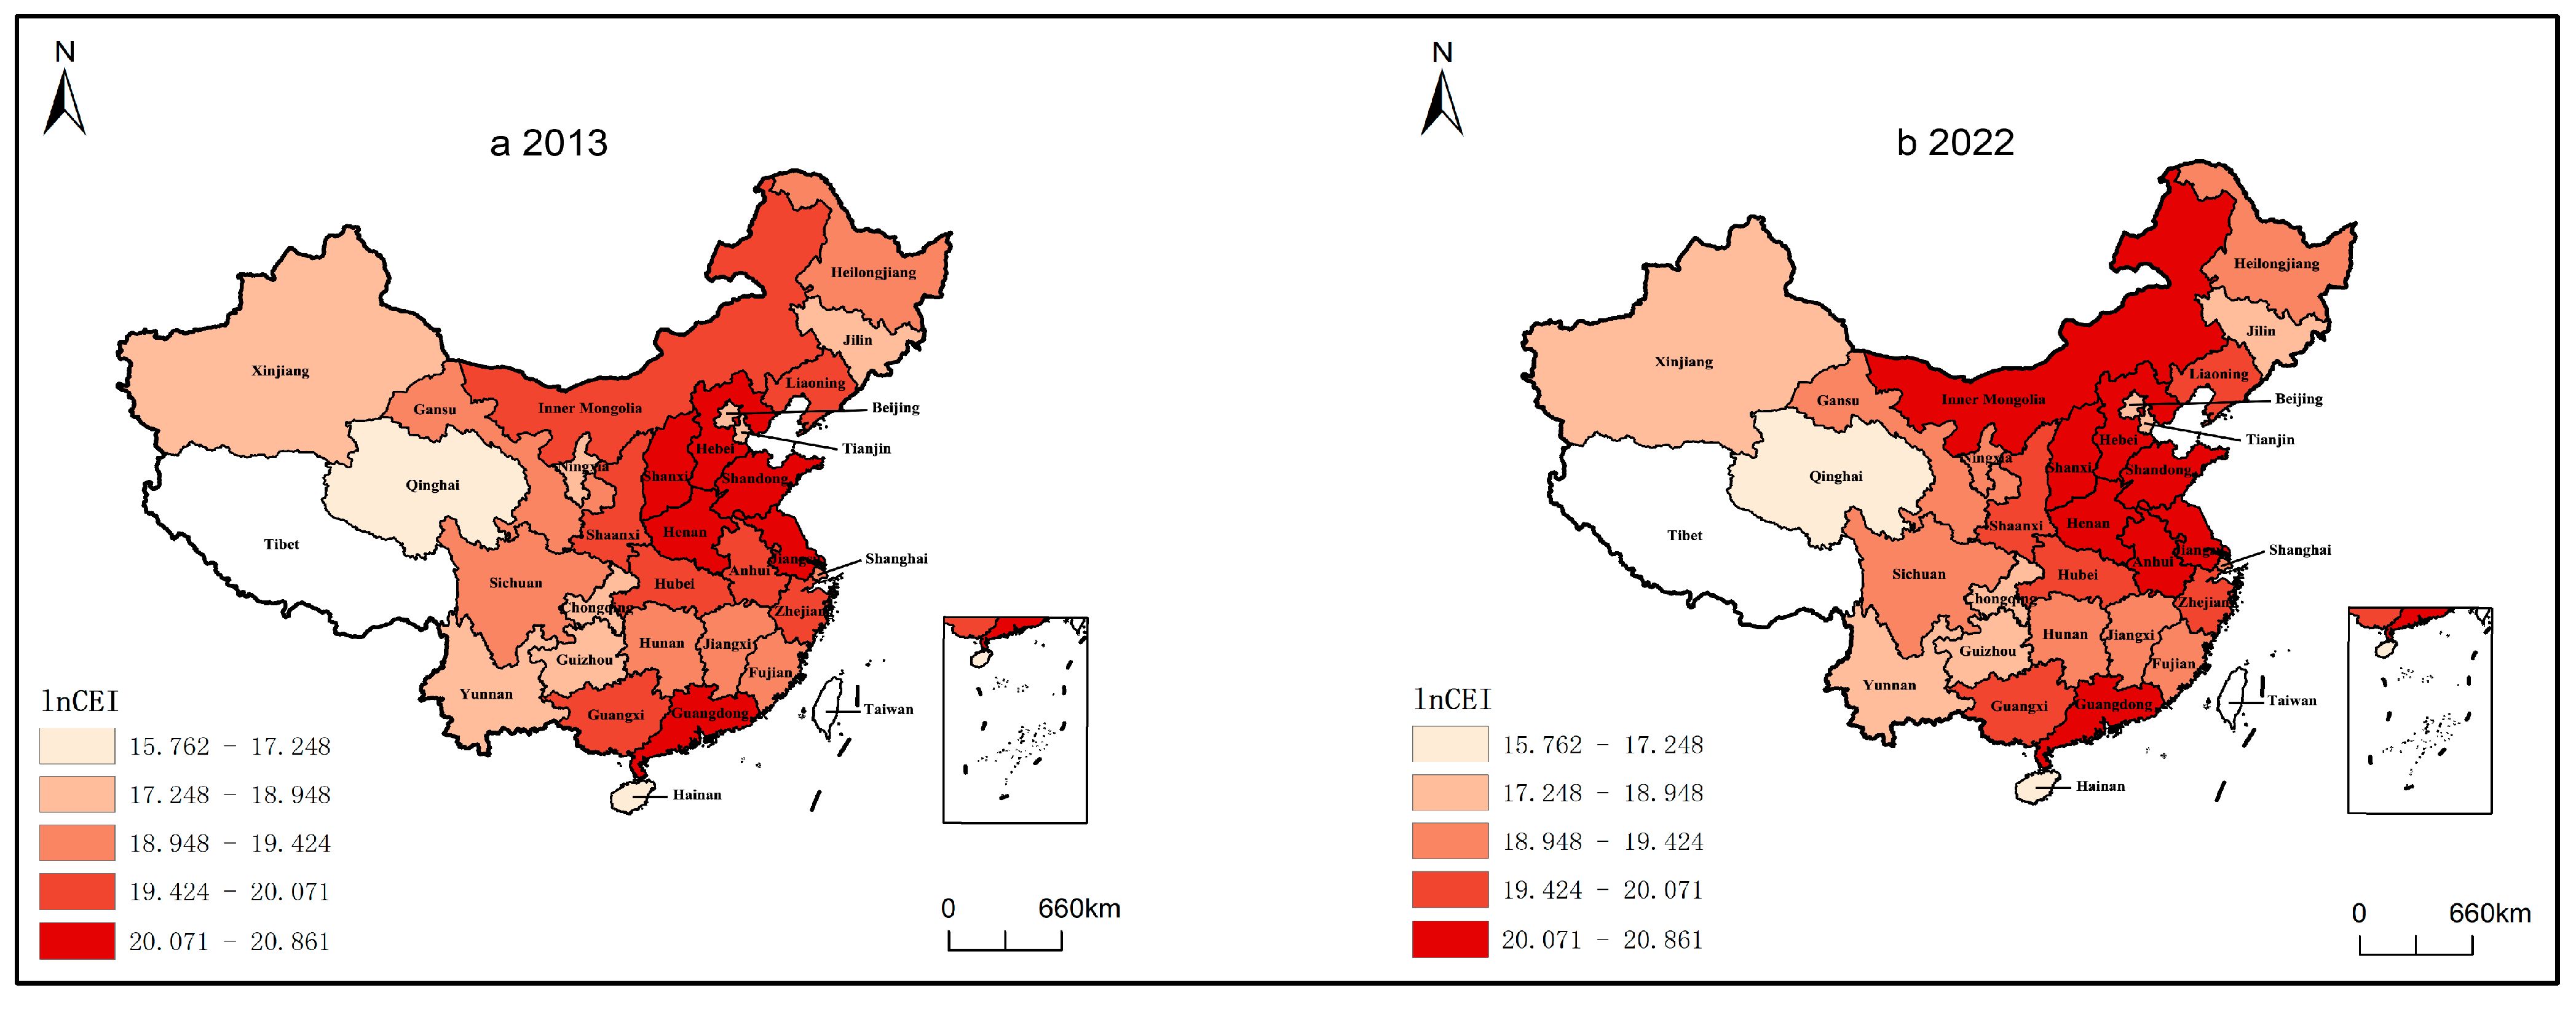
The study analyzes data from 2013 to 2022 to examine the spatial evolution patterns of the three core variables, as illustrated in Figure 3, Figure 4, and Figure 5. All maps classify the indices into five categories using the natural breaks (Jenks) method and are visualized through ArcGIS software (ArcMap 10.8.1, Esri, Redlands, CA, USA).
Figure 3.
Spatial evolution characteristics of provincial DEI in China. Note: Areas in white represent Tibet, Hong Kong, Macao, and Taiwan in China, where data are not available. All maps are produced in accordance with the official Chinese cartographic specifications and have passed the map review under approval number GS(2023)2627.
Figure 4.
Spatial evolution characteristics of provincial IND in China. Note: Areas in white represent Tibet, Hong Kong, Macao, and Taiwan in China, where data are not available. All maps are produced in accordance with the official Chinese cartographic specifications and have passed the map review under approval number GS(2023)2627.
Figure 5.
Spatial evolution characteristics of provincial lnCEI in China. Note: Areas in white represent Tibet, Hong Kong, Macao, and Taiwan in China, where data are not available. All maps are produced in accordance with the official Chinese cartographic specifications and have passed the map review under approval number GS(2023)2627.
The spatial distribution of the digital economy in China reveals a clear stepwise expansion pattern. In 2013, only Beijing and select eastern coastal provinces recorded DEI values above 0.162. By 2022, the digital economy had expanded inland, forming a gradient-driven diffusion from the eastern coastal areas to central and western regions. This expansion was largely driven by increased investment in new digital infrastructure and the advancement of digital industrialization in central and western provinces [].
Despite the catch-up effect observed in central regions, the digital economy still exhibits a spatial hierarchy characterized by “eastern leadership–central follow-up–western lag.” This reflects persistent regional disparities in digital infrastructure, technological innovation capacity, and institutional readiness.
China’s industrial structure transformation demonstrates a spatiotemporal pattern of “polarization–diffusion” synergistic evolution. Industrial upgrading has expanded outward from the core regions of the Yangtze River Delta and Pearl River Delta to encompass the Shandong Peninsula and the Western Taiwan Strait Area, forming a north–south industrial upgrading corridor characterized by significant agglomeration in service and high-tech sectors [,].
At the same time, the level of industrial structure transformation in central and western provinces has shown marked improvement compared to 2013. Over the past decade, China has preserved the “polarization advantage” of high-end industries in the eastern regions, while also unlocking the transformation potential of the central and western regions through gradient-based industrial transfer.
From 2013 to 2022, the evolution of China’s provincial carbon emission patterns exhibited two notable characteristics.
Temporally, provincial carbon emissions followed a trend of overall stability with localized fluctuations, with no significant nationwide surges in emission volumes over the period.
Spatially, carbon emission intensity displayed clear regional differentiation, forming a distinct “north-high, south-low” gradient. Provinces with the highest total carbon emissions—such as Inner Mongolia, Shanxi, and Hebei—are predominantly resource-dependent regions in northern China. These provinces are characterized by heavy industry-dominated economic structures and carbon-intensive energy mixes, which have resulted in a persistent high-carbon lock-in []. Consequently, northern regions face greater challenges and pressures in achieving effective carbon emission control.
3.2. Analysis of Coupling Coordination Relationships
3.2.1. Temporal Evolution Characteristics of Coupling Coordination Degree
The evolution trajectory of China’s provincial D-I-C coupling coordination degree from 2013 to 2022, as illustrated in Figure 6, reveals several key patterns.
Figure 6.
Temporal evolution of D-I-C coupling coordination degree.
From 2013 to 2020, the coupling coordination level steadily improved, largely driven by the synergy between deepening supply side structural reforms and regional coordinated development strategies. In 2021, however, the coupling coordination degree experienced a temporary decline, likely due to the socioeconomic disruptions and constrained factor mobility caused by the normalization of pandemic prevention and control measures. By 2022, the indicator rebounded and exhibited signs of stabilization, reflecting the strong resilience and adaptive capacity of the D-I-C system under external shocks.
3.2.2. Spatial Evolution Characteristics of D-I-C Coupling Coordination Degree
To examine the spatial dynamics of the D-I-C coupling coordination degree, this study utilizes data from 2013 to 2021 to generate the spatial distribution figure below. Based on the coupling coordination classification framework proposed by previous scholars [,,], the coupling coordination degree is divided into four levels, as shown in Table 3.
Table 3.
Coupling Coordination Degree Ranking Table.
Figure 7 illustrates that in 2013, all Chinese provinces exhibited moderate D-I-C coupling coordination, reflecting the initial stage of interaction among the digital economy, industrial structure transformation, and carbon emissions systems.
Figure 7.
Spatial evolution characteristics of provincial MCCD in China. Note: Areas in white represent Tibet, Hong Kong, Macao, and Taiwan in China, where data are not available. All maps are produced in accordance with the official Chinese cartographic specifications and have passed the map review under approval number GS(2023)2627.
By 2022, leading provinces and municipalities such as Beijing, Shanghai, and Zhejiang had advanced to the high coupling coordination level. Notably, these provinces formed a spatially continuous belt along the Yangtze River Economic Belt and the Beijing–Guangzhou Axis, demonstrating the practical relevance of the “point-axis development” theory in facilitating cross-regional coordination [].
3.3. Spatial Correlation Analysis of Coupling Coordination Degree
3.3.1. Global Spatial Autocorrelation
This study utilizes the global spatial autocorrelation method to investigate the spatial correlation characteristics of the variables. Based on Moran’s Index, we assess the spatial autocorrelation of the D-I-C coupling coordination degree from 2013 to 2022, with the detailed results presented in the table below.
Table 4 indicate that all Moran’s I values during the study period are positive, suggesting a persistent positive spatial correlation in the D-I-C coupling coordination degree across Chinese provinces. However, the index shows a fluctuating downward trend, implying that spatial interdependence among provinces has gradually weakened over time.
Table 4.
Global Spatial Autocorrelation Analysis of D-I-C Coupling Coordination Degree.
3.3.2. Local Spatial Autocorrelation
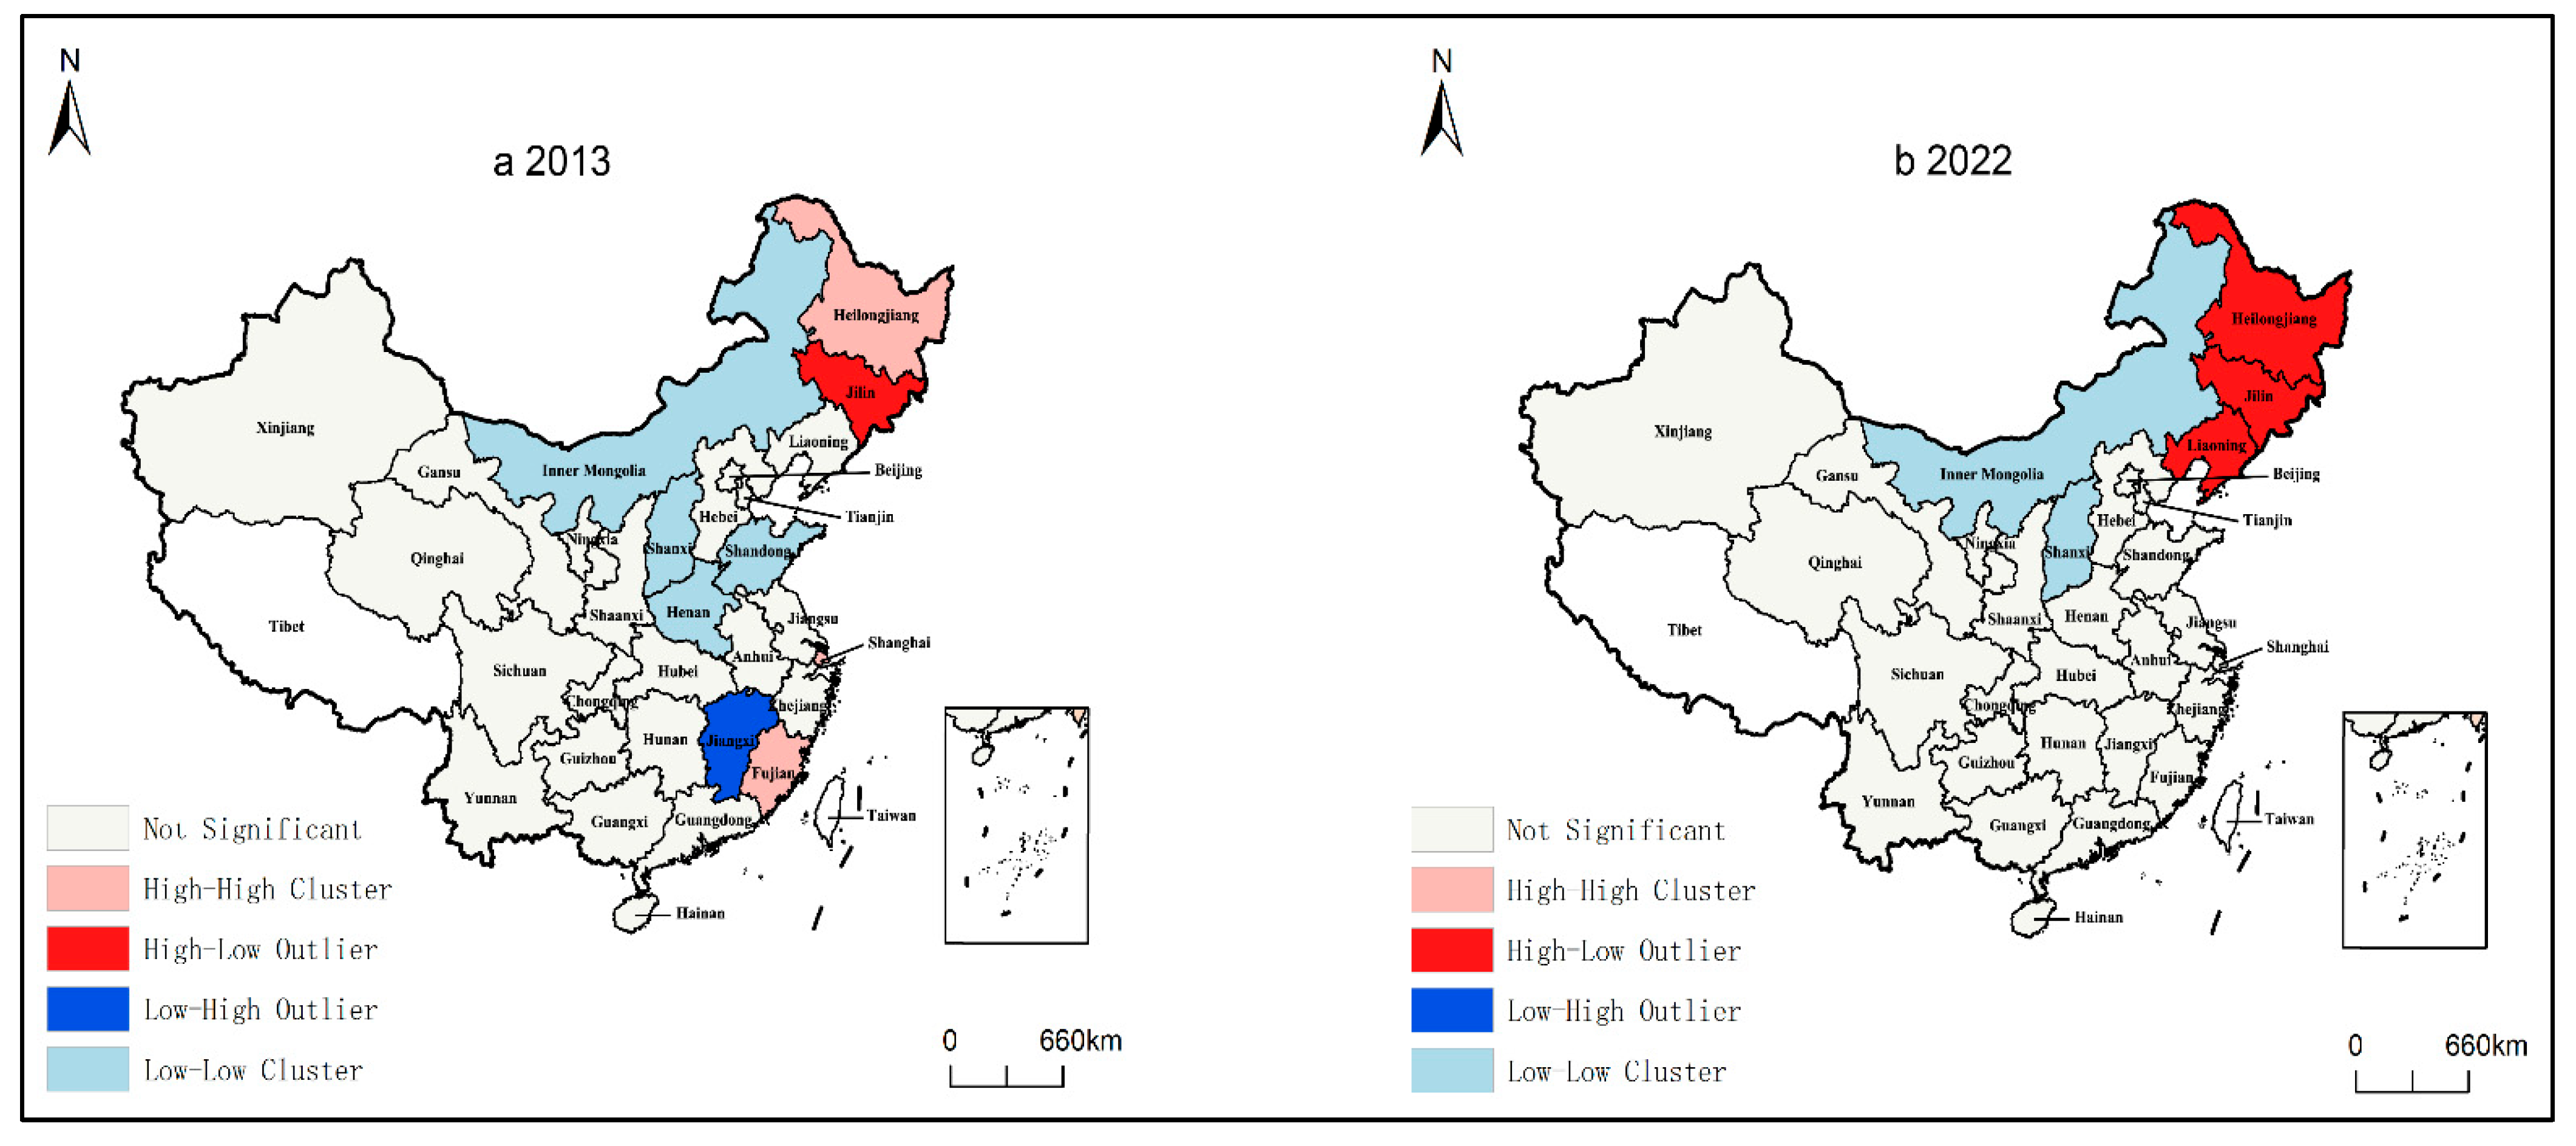
This study further examines the spatial clustering characteristics of the D-I-C coupling coordination degree by constructing LISA maps for China’s provincial data in 2013 and 2022.
Figure 8 shows the LISA maps of the D-I-C coupling coordination degree for each province in 2013 and 2022. The results reveal significant spatial clustering and clear evolutionary trends. In 2013, a large L-L cluster appeared in the north-central region, covering Shanxi, Inner Mongolia, and surrounding provinces, while H-H clusters were observed in Heilongjiang and Fujian. Additionally, Jilin and Jiangxi were identified as H-L and L-H outliers, respectively. By 2022, the northeastern region exhibited an H-L outlier pattern, whereas Shanxi and Inner Mongolia continued to maintain L-L clustering. These spatial patterns suggest that regions with low coupling coordination in the central and northern areas may be constrained by structural or resource limitations, hindering balanced regional development. H-H clusters, in contrast, reflect high coupling and coordination levels and can serve as benchmarks for best practices. H-L and L-H outliers highlight differences in coordination between neighboring regions, potentially reflecting spillover effects or inefficiencies in policy implementation.
Figure 8.
LISA cluster maps of provincial D-I-C coupling coordination degree. Note: Areas in white represent Tibet, Hong Kong, Macao, and Taiwan in China, where data are not available. All maps are produced in accordance with the official Chinese cartographic specifications and have passed the map review under approval number GS(2023)2627.
3.4. Interaction Effects Analysis of DEI, IND, and lnCEI
3.4.1. Unit Root Test
To prevent spurious regression caused by non-stationary time series data and to ensure the stability of impulse response functions and variance decomposition results, this study first conducts panel unit root tests to assess the stationarity of the variables. Specifically, we employ four commonly used test methods: LLC, IPS, ADF–Fisher, and PP–Fisher. The test results are presented in Table 5 below.
Table 5.
Unit Root Test Results.
The unit root tests reveal that the original variable series are non-stationary and contain unit roots. Consequently, this study applies first-order differencing to all three variables. After differencing, the variables pass all unit root tests at the 1% significance level, confirming their stationarity and enabling subsequent regression analyses to be conducted reliably.
3.4.2. Optimal Lag Order Selection
To determine the optimal lag order, this study compares the results of three information criteria: MBIC, MAIC, and MQIC, as detailed in Table 6 below. The results indicate that both MBIC and MQIC recommend a lag order of 1, while MAIC suggests 3 lags. Adhering to the majority rule, this study selects 1 lag for the subsequent GMM estimation.
Table 6.
Optimal Lag Order Selection Results.
3.4.3. GMM Model Estimation
The study investigates the interaction effects among the digital economy, industrial structure transformation, and carbon emissions through GMM estimation. The GMM estimation results are presented in Table 7.
Table 7.
GMM Estimation Results of PVAR Model.
The digital economy, industrial structure transformation, and carbon emissions demonstrate pronounced self-reinforcing dynamics. Among them, industrial structure transformation serves as a critical intermediary. It facilitates the development of the digital economy through mechanisms such as production factor reallocation [], while concurrently mitigating carbon emissions by expanding the proportion of technology-intensive service sectors. The efficiency of this transformation partially determines the degree of coordination between digital and environmental systems.
A bidirectional balancing relationship is also evident between carbon emissions and the digital economy. On one hand, rising carbon emissions spur digital innovation through intensified environmental regulations and increased demand for clean technologies. On the other hand, the rapid expansion of the digital economy can exacerbate environmental stress due to rebound effects and the substantial carbon footprint of digital infrastructure [,]. This reflects a time-lagged, asymmetric feedback loop between technological advancement and environmental outcomes.
Such complexity highlights the transitional dilemma: when the enabling effects of digital technology surpass its intrinsic carbon costs, the system advances toward a low-carbon trajectory. Conversely, if these costs dominate, the system may enter a “digital lock-in and pollution escalation” spiral. These findings underscore the importance of designing coordinated strategies that align digital development with decarbonization goals.
3.4.4. Granger Causality Test
To further investigate the dynamic causal relationships among the three variables, this study conducted a Granger causality test. As shown in Table 8, a bidirectional Granger causality exists between the digital economy and carbon emissions. Moreover, industrial structure transformation is a Granger cause of both the digital economy and carbon emissions.
Table 8.
Granger Causality Test.
3.4.5. Robustness Test
The application of the PVAR model requires adherence to specific conditions, including the assumption that the PVAR model has an infinite-order vector moving average representation and is invertible [,]. To validate the stability of the PVAR model, this study checks whether the modulus of each eigenvalue of the estimated model is less than 1. As shown in Figure 9, all eigenvalues lie within the unit circle (radius = 1), confirming that the modulus of each eigenvalue is less than 1. Thus, the PVAR model satisfies the stability condition.
Figure 9.
Unit circle test.
3.4.6. Impulse Response Analysis
To explain the ongoing dynamic interrelationships among the digital economy, industrial structure transformation, and carbon emissions over future periods, impulse response analysis is conducted for these variables. This study performs 200 Monte Carlo simulations with a time horizon of 0–10 periods, and the results are shown in Figure 10.
Figure 10.
Impulse response graph. Note: The horizontal axis (s) represents the lag period, while the dashed horizontal line indicates the zero baseline. The central curve is the impulse response function curve, and the two outer curves denote the confidence intervals of two standard deviations. Errors are 5% on each side generated by Monte-Carlo with 200 reps.
The analysis reveals that all three systems—digital economy, industrial structure transformation, and carbon emissions—exhibit notable positive self-reinforcing effects, with industrial structure transformation demonstrating the strongest persistence. The impulse response to its own shocks follows a stable decay trajectory over the 10-period horizon, suggesting that system inertia exerts a sustained influence on industrial upgrading.
A significant bidirectional interaction is identified between the digital economy and industrial structure transformation. Specifically, the positive impact of a digital economy shock on industrial transformation peaks in the first period and gradually attenuates thereafter. Conversely, industrial structure transformation exhibits a similarly immediate yet declining influence on the advancement of the digital economy.
The carbon emission system exhibits a distinct transmission mechanism. A one-standard-deviation shock to carbon emissions elicits a positive response in digital economy development, with the peak effect materializing in the first period. Interestingly, the influence of digital economy shocks on carbon emissions follows a “suppression-then-promotion” pattern within the same period. In contrast, industrial structure transformation exerts a consistently negative impact on carbon emissions, with the strongest emission-reduction effect observed in the initial phase.
These results provide empirical support for the dynamic interplay among the three systems, underscoring the importance of integrating digital transformation and low-carbon development strategies in a coordinated policy framework.
3.4.7. Variance Decomposition
To deeply investigate the relative contribution of different variable shocks in the evolution of each variable, this study employs variance decomposition to conduct a quantitative analysis of the PVAR model. Specifically, by selecting the 10th period (short-term), 20th period (medium-term), and 30th period (long-term) as analytical nodes, we systematically evaluate the interaction contributions among the three core variables—the digital economy, industrial structure transformation, and carbon emissions—thereby revealing the explanatory power of different shock factors on system variations and their dynamic evolution characteristics across temporal dimensions. The results are shown in Table 9 below.
Table 9.
Variance Decomposition Results of PVAR Model.
The three systems of the digital economy, industrial structure transformation, and carbon emissions exhibit significant endogeneity characteristics. Specifically:
Digital Economy System: 73.0–73.1% of its variance is explained by its own historical shocks, 21.2–21.3% originates from industrial structure transformation, and only 5.7% stems from carbon emissions. These contribution ratios remain stable over the 10–30 period forecasts, indicating that digital economy development has strong self-reinforcing properties, with industrial upgrading serving as a critical exogenous driver.
Industrial Structure Transformation: Displays extreme endogenous dominance, with 95.3% of its variance governed by its own shocks. Contributions from the digital economy and carbon emissions total less than 5%, reflecting the high reliance of industrial upgrading on internal factor accumulation.
Carbon Emission System: Demonstrates the highest closedness, with 90.4% of its variance arising from its own fluctuations. Combined contributions from the digital economy and industrial transformation amount to only 9.6%, revealing an inertial growth mechanism in carbon emissions under technological lock-in effects.
4. Policy Implications and Conclusions
4.1. Conclusions
This study explores the spatiotemporal dynamics and systemic coordination among the digital economy, industrial structure transformation, and carbon emissions in China from 2013 to 2022. By integrating a modified coupling coordination degree model, Exploratory Spatial Data Analysis, and Panel Vector Autoregression techniques, several meaningful conclusions can be drawn.
First, the three subsystems—digital economy, industrial structure, and carbon emissions—display significant spatial heterogeneity and regional divergence. Provinces with more advanced digital infrastructure and higher industrial sophistication generally achieve better coordination and lower carbon intensity, revealing a regional pattern of differentiated green development.
Second, the overall coupling coordination among the three systems has improved steadily over time, indicating gradual convergence and interaction among digitalization, industrial upgrading, and carbon reduction. However, disparities remain: eastern provinces exhibit stronger synergistic dynamics, while central and western provinces show relatively lagging coordination levels.
Third, the PVAR results confirm bidirectional dynamic interactions among the three subsystems. Digital economy development contributes to industrial upgrading, and improved industrial structure helps to stabilize long-term carbon reduction. Meanwhile, short-term fluctuations in carbon emissions can negatively influence the pace of digital and industrial advancement. These findings reveal a process of co-evolution and mutual adjustment, rather than a unidirectional causal mechanism.
Overall, this study highlights the coordinated development of the three systems. The findings offer empirical evidence of the complex interactions among technological advancement, economic growth, and environmental sustainability, emphasizing the co-evolutionary and mutually adaptive relationships among the digital economy, industrial transformation, and carbon emissions.
4.2. Policy Implications
Based on the above findings, several policy implications can be drawn.
- (1)
- Foster integrated digital–industrial development. The government should promote digital infrastructure deployment in traditional industries, facilitating data-driven production and efficiency improvement to support low-carbon transformation.
- (2)
- Adopt region-specific coordination strategies. The eastern region should continue to drive digital and technological innovation, while the central and western regions require targeted support to enhance cross-system coordination and reduce development gaps.
- (3)
- Strengthen data-driven carbon governance. Building unified digital carbon platforms and improving carbon information disclosure can enhance emission monitoring and transparency, helping to link digital progress with environmental governance.
- (4)
- Encourage innovation–emission reduction linkage. Policymakers should promote the integration of digital technologies with clean production and green innovation, fostering a positive feedback cycle that supports sustainable and inclusive growth.
Together, these measures can enhance the synergistic interaction among the digital economy, industrial transformation, and carbon reduction, contributing to China’s long-term pathway toward carbon neutrality and high-quality development.
Author Contributions
Conceptualization, H.D. and Y.T.; Data curation, H.D. and Y.T.; Funding acquisition, Y.T.; Investigation, Y.T.; Methodology, H.D. and Y.T.; Software, H.D. and Y.T.; Visualization, H.D.; Writing—original draft, H.D.; Writing—review & editing, H.D. and Y.T. All authors have read and agreed to the published version of the manuscript.
Funding
This research was funded by the National Natural Science Foundation of China (No. 72473009) and the Ministry of Education of China (No. 21YJC630127).
Data Availability Statement
Data are available from the corresponding author on reasonable request.
Acknowledgments
The authors would like to express their sincere gratitude to colleagues and peers for their insightful comments and constructive feedback throughout the development of this work. We also extend our thanks to the editor and anonymous reviewers for their valuable suggestions, which have significantly helped improve the quality and clarity of the manuscript.
Conflicts of Interest
The authors declare no conflicts of interest.
References
- Ma, Q.; Mentel, G.; Zhao, X.; Salahodjaev, R.; Kuldasheva, Z. Natural resources tax volatility and economic performance: Evaluating the role of digital economy. Resour. Policy 2022, 75, 102510. [Google Scholar] [CrossRef]
- Bai, T.; Qi, Y.; Li, Z.; Xu, D. Digital economy, industrial transformation and upgrading, and spatial transfer of carbon emissions: The paths for low-carbon transformation of Chinese cities. J. Environ. Manag. 2023, 344, 118528. [Google Scholar] [CrossRef] [PubMed]
- Li, D.; Liu, Y.; Zhang, L.; Zheng, Z. Digital economy development and trade credit supply: Evidence from Chinese A-Share listed firms. Res. Int. Bus. Financ. 2025, 77, 102900. [Google Scholar] [CrossRef]
- Huang, C.; Lin, B. Digital economy solutions towards carbon neutrality: The critical role of energy efficiency and energy structure transformation. Energy 2024, 306, 132524. [Google Scholar] [CrossRef]
- Zeng, G.; Wu, M.; Yuan, X. Digital economy and industrial agglomeration. Econ. Anal. Policy 2024, 84, 475–498. [Google Scholar] [CrossRef]
- Mehmood, S.; Zaman, K.; Khan, S.; Ali, Z.; Khan, H.U.R. The role of green industrial transformation in mitigating carbon emissions: Exploring the channels of technological innovation and environmental regulation. Energy Built Environ. 2024, 5, 464–479. [Google Scholar] [CrossRef]
- Huo, D.; Yang, H.; Zhou, X.; Kang, W. Key industrial sectors and their evolutionary trends in China’s embodied carbon emission network. Alex. Eng. J. 2025, 123, 249–260. [Google Scholar] [CrossRef]
- Feng, Z.; Sun, Y.; Ning, J.; Tang, S.; Liu, G.; Liu, F.; Li, Y.; Shi, L. Implementing a provincial-level universal daily industrial carbon emissions prediction by fine-tuning the large language model. Appl. Energy 2025, 383, 125372. [Google Scholar] [CrossRef]
- Zhu, Q.; Geng, Y.; Lai, K.-H. Circular economy practices among Chinese manufacturers varying in environmental-oriented supply chain cooperation and the performance implications. J. Environ. Manag. 2010, 91, 1324–1331. [Google Scholar] [CrossRef]
- Han, Y.; Wei, T. Supply chain digitization and corporate carbon emissions: A chain mediation examination based on digital transformation and green innovation. J. Environ. Manag. 2025, 379, 124825. [Google Scholar] [CrossRef]
- Wang, M.; Qin, K.; Li, J.; Yang, S. Explaining the transmission mechanism of social-ecological systems adaptive cycling on path dependency in resource-based cities: Evidence from Shanxi Province, China. Sustain. Futures 2025, 9, 100449. [Google Scholar] [CrossRef]
- Li, Y.; Chen, Y.; Wang, Y. Grey forecasting the impact of population and GDP on the carbon emission in a Chinese region. J. Clean. Prod. 2023, 425, 139025. [Google Scholar] [CrossRef]
- Zhang, Y.; Khan, S.U.; Wang, Y. The future is digital: Can the digital economy drive marine sustainability? Exploring regional impacts on fisheries’ carbon emissions in coastal China. J. Clean. Prod. 2025, 506, 145518. [Google Scholar] [CrossRef]
- Zhu, Q.; Xu, C.; Wu, L.; Fang, X.; Pan, Y.; Zhou, D. Enhancing sustainability: Assessing the low-carbon impact of China’s digital economy on residential carbon emissions. Environ. Dev. 2025, 54, 101161. [Google Scholar] [CrossRef]
- Zhou, D.; Chu, J. The carbon emission reduction effect of the digital economy from the perspective of biased technological progress. J. Environ. Manag. 2025, 373, 123857. [Google Scholar] [CrossRef] [PubMed]
- Ma, Y.; Li, R. The impact of digital economy on carbon emissions: Insights from the G-20 energy transition and environmental governance. Energy Strategy Rev. 2025, 57, 101612. [Google Scholar] [CrossRef]
- Wang, H.; Yang, G.; Yue, Z. Breaking through ingrained beliefs: Revisiting the impact of the digital economy on carbon emissions. Humanit. Soc. Sci. Commun. 2023, 10, 609. [Google Scholar] [CrossRef]
- Hong, C.; Ding, Q.; Zhao, W.; Hou, N.; Liu, W. The digital economy, industrial structure upgrading, and carbon emission intensity—Empirical evidence from China’s provinces. Energy Strategy Rev. 2023, 50, 101218. [Google Scholar] [CrossRef]
- Dong, B.; Ma, X.; Zhang, Z.; Zhang, H.; Chen, R.; Song, Y.; Shen, M.; Xiang, R. Carbon emissions, the industrial structure and economic growth: Evidence from heterogeneous industries in China. Environ. Pollut. 2020, 262, 114322. [Google Scholar] [CrossRef]
- Li, X.; Yue, S. Does the government digital attention improve China’s digital economy output efficiency: Accelerator or inhibitor. Econ. Anal. Policy 2025, 85, 607–625. [Google Scholar] [CrossRef]
- Cheng, D.; Guo, X.; Guo, Y. Research on the mechanism of digital economy enabling the conversion of new and old kinetic energy. Energy Policy 2025, 202, 114590. [Google Scholar] [CrossRef]
- Di, K.; Chen, W.; Zhang, X.; Shi, Q.; Cai, Q.; Li, D.; Liu, C.; Di, Z. Regional unevenness and synergy of carbon emission reduction in China’s green low-carbon circular economy. J. Clean. Prod. 2023, 420, 138436. [Google Scholar] [CrossRef]
- Yuan, H.; Zhu, C.L. Has the national high-tech zone promoted the transformation and upgrading of China’s industrial structure? China Ind. Econ. 2018, 8, 60–77. [Google Scholar] [CrossRef]
- Zhang, X.Y.; Xie, L.H.; Xiao, J.H. Government procurement, digital economy development, and industrial structure upgrading. Contemp. Financ. Econ. 2024, 3, 43–55. [Google Scholar] [CrossRef]
- Liu, X.; Ji, K.; Sun, Y.; Lu, J. Unveiling the nonlinear impact: Green finance, carbon emission intensity, and digital economy integration. Sustain. Futures 2025, 9, 100610. [Google Scholar] [CrossRef]
- Cai, A.; Guo, R.; Zhang, Y.; Wang, L.; Lin, R.; Wu, H.; Huang, R.; Zhang, J.; Wu, J. Assessing urban carbon health in China’s three largest urban agglomerations: Carbon emissions, energy-carbon emission efficiency and carbon sinks. Appl. Energy 2025, 383, 125326. [Google Scholar] [CrossRef]
- Lu, F.; Ma, F.; Feng, L. Carbon dioxide emissions and economic growth: New evidence from GDP forecasting. Technol. Forecast. Soc. Chang. 2024, 205, 123464. [Google Scholar] [CrossRef]
- Sun, X.; Shao, H.; Liang, S.; Zhou, Y.; Dai, X.; Liu, M.; Tao, R.; Guo, Z.; Xin, Q. Tracking sustainable development in mining towns: A novel framework integrating socioeconomic and eco-environmental perspectives through coupling coordination degree. Environ. Impact Assess. Rev. 2024, 109, 107641. [Google Scholar] [CrossRef]
- Wang, Y.; Guo, L.; Wang, Y.; Zhang, Y.; Zhang, S.; Liu, Z.; Xing, J.; Liu, X. Bi-level programming optimization method of rural integrated energy system based on coupling coordination degree of energy equipment. Energy 2024, 298, 131289. [Google Scholar] [CrossRef]
- Wang, S.J.; Kong, W.; Ren, L.; Zhi, D.D.; Dai, B.T. Misconceptions and revisions of the coupling coordination degree model in China. J. Nat. Resour. 2021, 36, 793–810. [Google Scholar] [CrossRef]
- Fan, D.J.; Ke, H.; Cao, R.M. Revision and improvement of the coupling coordination degree model. Stat. Decis. 2024, 40, 41–46. [Google Scholar] [CrossRef]
- Yu, T.; Zhang, Y.; Jia, S.; Cui, X. Spatio-temporal evolution and drivers of coupling coordination between digital infrastructure and inclusive green growth: Evidence from the Yangtze River economic belt. J. Environ. Manag. 2025, 376, 124416. [Google Scholar] [CrossRef] [PubMed]
- Zhao, G.; Liang, R.; Li, K.; Wang, Y.; Pu, X. Study on the coupling model of urbanization and water environment with basin as a unit: A study on the Hanjiang Basin in China. Ecol. Indic. 2021, 131, 108130. [Google Scholar] [CrossRef]
- Li, W.; Cui, W.; Yi, P. Digital economy evaluation, regional differences and spatio-temporal evolution: Case study of Yangtze River economic belt in China. Sustain. Cities Soc. 2024, 113, 105685. [Google Scholar] [CrossRef]
- Li, J.; Liu, W.; Du, L.; Xiao, J. High-tech industry agglomeration and regional green development: An analysis of spatial Durbin model. Technol. Forecast. Soc. Chang. 2024, 205, 123372. [Google Scholar] [CrossRef]
- Huang, D.; Xu, G.; Li, C.; Yang, S. Effects of high-tech industrial agglomeration and innovation on regional economic development in China: Evidence from spatial-temporal analysis and Spatial Durbin Model. Econ. Anal. Policy 2025, 86, 692–712. [Google Scholar] [CrossRef]
- Wang, Y.; Su, Z.; Cai, X.; Yu, J. The dual carbon emission effects of digital economy: Evidence from China. Heliyon 2025, 11, e42554. [Google Scholar] [CrossRef]
- Han, X.; Wang, Y.; Yu, W.; Xia, X. Coupling and coordination between green finance and agricultural green development: Evidence from China. Financ. Res. Lett. 2023, 58, 104221. [Google Scholar] [CrossRef]
- Hu, Z.; Kumar, J.; Qin, Q.; Kannan, S. Assessing the coupling coordination degree between all-for-one tourism and ecological civilization; case of Guizhou, China. Environ. Sustain. Indic. 2023, 19, 100272. [Google Scholar] [CrossRef]
- Li, Y.; Zhou, B. Coupling coordination degree measurement and spatial characteristics analysis of green finance and technological innovation: Empirical analysis based on China. Heliyon 2024, 10, e33486. [Google Scholar] [CrossRef]
- He, C.; Sheng, H.; Dai, X. The “Point-Axis System” theory continues to empower China’s major regional strategies. Acta Geogr. Sin. 2024, 79, 2972–2990. [Google Scholar] [CrossRef]
- Jiang, W.; Li, J. Digital transformation and its effect on resource allocation efficiency and productivity in Chinese corporations. Technol. Soc. 2024, 78, 102638. [Google Scholar] [CrossRef]
- Huang, C.; Lin, B. The impact of digital economy on energy rebound effect in China: A stochastic energy demand frontier approach. Energy Policy 2025, 196, 114418. [Google Scholar] [CrossRef]
- Liu, Y.; Liu, N.; Huo, Y. Impact of digital technology innovation on carbon emission reduction and energy rebound: Evidence from the Chinese firm level. Energy 2025, 320, 135187. [Google Scholar] [CrossRef]
- Abrigo, M.R.M.; Love, I. Estimation of panel vector autoregression in Stata. Stata J. 2016, 16, 778–804. [Google Scholar] [CrossRef]
- Zouaoui, H.; Zoghlami, F. On the income diversification and bank market power nexus in the MENA countries: Evidence from a GMM panel-VAR approach. Res. Int. Bus. Financ. 2020, 52, 101186. [Google Scholar] [CrossRef]
Disclaimer/Publisher’s Note: The statements, opinions and data contained in all publications are solely those of the individual author(s) and contributor(s) and not of MDPI and/or the editor(s). MDPI and/or the editor(s) disclaim responsibility for any injury to people or property resulting from any ideas, methods, instructions or products referred to in the content. |
© 2025 by the authors. Licensee MDPI, Basel, Switzerland. This article is an open access article distributed under the terms and conditions of the Creative Commons Attribution (CC BY) license (https://creativecommons.org/licenses/by/4.0/).