Abstract
Driven by carbon neutrality goals, electric–hydrogen coupled virtual power plants (EHCVPPs) integrate renewable hydrogen production with power system flexibility resources, emerging as a critical technology for large-scale renewable integration. As distributed energy resources (DERs) within EHCVPPs diversify, heterogeneous resources generate diversified market values. However, inadequate benefit allocation mechanisms risk reducing participation incentives, destabilizing cooperation, and impairing operational efficiency. To address this, benefit allocation must balance fairness and efficiency by incorporating DERs’ regulatory capabilities, risk tolerance, and revenue contributions. This study proposes a multi-stage benefit allocation framework incorporating risk–reward tradeoffs and an enhanced optimization model to ensure sustainable EHCVPP operations and scalability. The framework elucidates bidirectional risk–reward relationships between DERs and EHCVPPs. An individualized risk-adjusted allocation method and correction mechanism are introduced to address economic-centric inequities, while a hierarchical scheme reduces computational complexity from diverse DERs. The results demonstrate that the optimized scheme moderately reduces high-risk participants’ shares, increasing operator revenue by 0.69%, demand-side gains by 3.56%, and reducing generation-side losses by 1.32%. Environmental factors show measurable yet statistically insignificant impacts. The framework meets stakeholders’ satisfaction and minimizes deviation from reference allocations.
1. Introduction
With the intelligent development of massive distributed energy resources (DERs), the aggregation and operational management of heterogeneous resources have emerged as critical challenges for virtual power plants (VPPs) [1]. VPP operators (VPPOs) must comprehensively evaluate the risk–return profiles of all participating entities within the alliance to maximize the synergistic utilization of internal resources. Following the formulation of external market trading strategies, VPPOs are required to establish equitable benefit allocation mechanisms that reflect the contribution levels of heterogeneous resources, thereby ensuring sustainable development across both internal operations and external market engagements.
Conventional VPPs primarily rely on electrical energy storage or demand-side response for power balance management, which proves inadequate for long-term energy management in high-proportion renewable energy scenarios. Hydrogen energy, as a clean, efficient, and large-scale long-duration energy storage medium, offers novel solutions for RE integration and grid regulation through its unidirectional “power-to-hydrogen” (P2H) and bidirectional “power-to-hydrogen-to-power” (P2H2P) conversion characteristics [2]. Electricity–hydrogen coupled VPPs (EHCVPPs) leverage power-to-hydrogen (P2H) devices such as electrolyzers and hydrogen storage systems to convert surplus electricity into hydrogen for inter-temporal storage. During peak electricity demand periods or RE output deficiencies, the stored hydrogen is converted back to electricity via fuel cells or gas turbines, enabling optimized spatio-temporal energy allocation. This approach not only enhances RE utilization rates but also strengthens grid peak-shaving, frequency-regulation, and reserve capabilities.
Compared to conventional VPPs, EHCVPPs exhibit distinct characteristics in benefit allocation mechanisms. Firstly, while traditional VPPs primarily involve distributed generators (DGs), energy storage systems (ESSs), and controllable loads with benefit distributions centered on electricity trading and ancillary service compensation, EHCVPPs integrate additional stakeholders across the hydrogen value chain—including hydrogen production, storage, transportation, and end-use sectors—each with differentiated economic interests. This multidimensional participation complicates the benefit distribution landscape. Secondly, conventional VPPs allocate benefits based solely on electricity trading volumes and ancillary service contributions, whereas EHCVPPs must simultaneously evaluate the dual values of electricity and hydrogen. This necessitates comprehensive assessments of electricity market revenues, hydrogen economic valuations, and temporal variations in hydrogen value, leading to more complex benefit metrics. Thirdly, EHCVPPs can achieve carbon emission spatial–temporal shifting through P2H processes and reduce carbon intensity via hydrogen utilization, thereby generating additional carbon market revenues or cost reductions. Consequently, benefit allocation in EHCVPPs demands more sophisticated consideration of allocation elements and methodological approaches compared to conventional VPPs.
Regarding benefit allocation methodologies, existing research on cooperative game theory-based approaches primarily employs core methods, nucleolus methods, Shapley value approaches, Markov decision processes (MDPs), and Nash bargaining. Core-based methods often face non-empty core sets or multiple optimal solutions, limiting their applicability to broad cooperative scenarios [3]. To address these limitations, Schmeidler introduced the nucleolus concept [4]. Reference [5] improved nucleolus calculation efficiency for benefit distribution in prosumer-based smart energy communities. Although nucleolus methods yield unique solutions based on satisfaction criteria, their computational complexity increases substantially due to multifactorial considerations [6], and their inherent egalitarian tendencies may undermine member participation incentives and alliance sustainability. Nash bargaining theory, which integrates cooperative and non-cooperative game paradigms with alliance-wide profit maximization objectives, is better suited for bilateral negotiations [7]. Recent studies have extended Nash bargaining to VPP internal resource allocations: reference [6] quantified member contributions using marginal contributions, output prediction accuracy, additional contributions, and profit growth rates within a Nash–Harsanyi bargaining framework; reference [8] incorporated risk, benefit, and carbon reduction factors to determine allocation weights for rural VPPs; reference [9] modeled profit distributions considering uncertainty risks and marginal benefits; and reference [10] established an operational framework where independent operations serve as the breakdown point for Nash bargaining-based revenue transfers. The Shapley value method, which allocates benefits based on members’ marginal contributions with unique and fair outcomes, effectively enhances participation motivation [11]. However, it suffers from combinatorial explosion challenges in large-scale alliances, significantly increasing computational complexity.
In terms of allocation elements, prior studies predominantly focused on single economic dimensions. For instance, the authors of [11] optimized hydrogen storage configurations in microgrid clusters with economic benefit considerations; reference [3] developed fairness indices for RE communities; ref. [5] proposed equal-split and consumption-based allocation schemes; and [12] applied Shapley values to resolve energy conflicts in multi-campus integrated energy systems. These approaches remain confined to economic factors. The authors of [13,14] employed conventional Shapley methods for VPP benefit allocations under varying alliance structures.
For allocation optimization, researchers have explored improvements through element refinement, computational acceleration, and methodological hybridization. Recognizing the limitations of conventional Shapley methods focusing solely on marginal contributions, numerous studies have introduced modifications: reference [7] incorporated risk levels, profit contributions, and growth rates; reference [14,15] added cooperation intensity, investment levels, risk-bearing capacities, effort metrics, service quality, and market positions; reference [16] integrated output deviation considerations and utility functions; reference [17] developed risk-sharing–reward-sharing models with adjusted Shapley factors; and reference [18] implemented hierarchical allocation frameworks to mitigate dimensionality challenges. Hybrid approaches combining multiple methods have also been proposed: reference [19,20] weighted Shapley and nucleolus methods; and the authors of [21] introduced stepwise Shapley allocations for day-ahead market capacity revenues.
In conclusion, there are various methods for benefit allocation, each with its own applicable conditions, advantages, and disadvantages. Moreover, different benefit allocation methods also have their own limitations, and there is a need to improve them from the methodological level to adapt to more complex benefit allocation scenarios. Given the advantages and disadvantages of various methods, this study takes the Shapley value method as the foundation. To address the limitation of the Shapley value method considering only a single factor, this study constructs a multidimensional influencing factor model for benefit allocation, which comprehensively considers risk factors, economic factors, and environmental factors to improve the Shapley model. In terms of weight design, it comprehensively considers subjective factors based on the analytic hierarchy process (AHP) and objective factors based on the entropy weight method to evaluate the influence of economic benefit factors, environmental benefit factors, and risk loss factors. On this basis, the improved benefit allocation is calculated using the cloud gravity-center-modified benefit allocation model. The cloud gravity-center method dynamically adjusts allocation ratios by incorporating multidimensional correction factors such as risk coefficients and environmental benefits, while leveraging cloud models to handle fuzziness and randomness—making it more aligned with real-world cooperative scenarios. By calculating the weighted deviation between each partner’s multidimensional composite cloud and the “ideal cloud,” it derives positive or negative allocation correction coefficients that directly redistribute the initial Shapley value. Furthermore, the cloud gravity-center method maps qualitative concepts into computable normal clouds using the expected value–entropy–superentropy triad. This transforms qualitative indicators into quantitative values, reducing subjective interference and enhancing evaluation objectivity. Considering that the computational complexity of benefit allocation based on the Shapley value method increases with the growing number of participants in the alliance, this study constructs a hierarchical and step-by-step benefit allocation framework, which reduces the computational difficulty and clarifies the interests and relationships of each aggregated entity.
This study presents the following innovations:
- (1)
- It proposes a benefit correction scheme integrating economic, environmental, and risk loss factors to overcome the limitation of single-margin revenue focus.
- (2)
- It develops a cascaded framework to address computational challenges in large-scale alliances while balancing equity and efficiency.
- (3)
- It quantifies the multifaceted benefits of hydrogen storage in EHCVPPs and evaluates corresponding allocation effects.
2. Architecture and System Modeling of Electro–Hydrogen Coupled Virtual Power Plants
2.1. Architecture of the Electro–Hydrogen Coupled Virtual Power Plant
The architecture of the EHCVPP designed in this study is illustrated in Figure 1. From the perspective of VPPOs, the system integrates distributed renewable energy sources (e.g., wind, solar, and hydro) and controllable loads (e.g., industrial, commercial, residential loads, and electric vehicles (EVs)). By strategically deploying lithium-battery energy storage systems and hydrogen storage systems, the overall efficiency of the aggregated entities is significantly enhanced. The EHCVPP participates in both electricity and hydrogen markets to generate energy-related revenues. Additionally, it obtains environmental benefits from the carbon market through the allocation of green certificates, based on its resource utilization in the electricity and hydrogen markets.
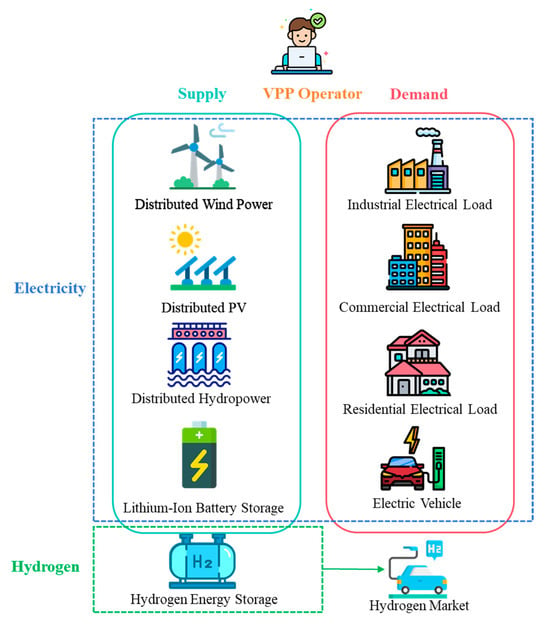
Figure 1.
Architecture of the EHCVPP.
2.2. Modeling of the EHCVPP
2.2.1. Distributed Renewable Energy Generation
- (1)
- Distributed Wind Power Generation
Wind power generation is significantly influenced by natural environmental conditions and equipment parameters, resulting in strong output uncertainty [22]. Wind-energy conversion is highly sensitive to environmental conditions that are intrinsically uncertain and difficult to control. Moreover, a turbine generates power only within a narrow operational envelope; whenever the actual wind speed falls below the cut-in wind speed or exceeds the cut-out wind speed, the unit ceases operation. These characteristics endow wind generation with pronounced stochasticity, volatility and intermittency. To accurately reproduce wind-power output and mitigate forecasting errors, numerous studies have derived the probability density function (PDF) of wind-power generation. Because the variation in air density within a given site is negligible, it is commonly omitted. The Weibull distribution provides an accurate model for the stochastic behavior of wind speed [23].
- (2)
- Distributed Photovoltaic
Analogous to wind generation, photovoltaic (PV) power production is strongly influenced by natural environmental conditions and equipment parameters, and therefore exhibits pronounced uncertainty. Paralleling the stochastic behavior of wind power, PV generation is intrinsically random, intermittent, and volatile owing to environmental disturbances. As is evident from the formulation, its power output characteristics are dictated predominantly by the irradiance level. To rigorously capture this variability, numerous researchers have employed the Beta distribution to model the probabilistic behavior of solar irradiance [24].
2.2.2. Controllable Loads
- (1)
- Industrial Flexible Loads
Industrial flexible loads exhibit adjustability that is tightly coupled to their production characteristics. Heavy industrial loads are typically large-scale, energy-intensive, and highly concentrated, placing stringent demands on security and reliability [25]. Among them, the iron-and-steel sector displays pronounced load fluctuations, whereas other continuous-process industries exhibit comparatively smooth profiles. Light industrial loads, by contrast, are more uniform and require high power quality and reliability, resulting in minimal variability.
In this study, we extract representative seasonal load-curve patterns from one year of high-resolution data supplied by a typical heavy industrial manufacturing customer. On a daily energy basis, aggregate consumption peaks in summer and autumn and bottoms out in spring, underscoring a clear seasonal signature. During spring and summer, the customer’s daily demand displays a bimodal structure: two pronounced peaks occur between 09:00 and 17:00 and 21:00 and 24:00, with sustained duration and large peak-to-valley differentials. In autumn, the same dual-peak pattern persists but with markedly smaller peak-to-valley spreads, yielding a more stable overall profile. In winter, only one dominant peak is observed, again accompanied by a significant peak-to-valley differential.
- (2)
- Commercial Flexible Loads
Commercial loads are dominated by large shopping malls, office buildings, hotels, and various retail premises. Their consumption exhibits pronounced temporal and seasonal patterns dictated by operating schedules. Across all seasons, the daily profile is bimodal, with sustained and contiguous high-demand periods and exceptionally large peak-to-valley differentials [26]. The dominant consumption window spans 11:00–22:00, interrupted only by a slight dip around 16:00, aligning closely with business hours. Seasonally, aggregate demand in summer is markedly higher—approximately two to three times that of other seasons—whereas spring and winter loads are nearly identical and marginally lower than those in autumn.
- (3)
- Residential Flexible Loads
Residential loads encompass lighting, air conditioning, refrigerators, and other household appliances. Unlike the continuous demand of certain industrial processes or the prolonged peaks of commercial users, residential demand is characterized by superior transferability and curtailment flexibility [27]. A bimodal daily profile is observed year-round, with peaks at 10:00–14:00 and 18:00–22:00. Summer records the highest energy use and the largest peak-to-valley differential, driven primarily by surging air conditioning demand. Winter consumption is the lowest, while spring and autumn loads are comparable.
- (4)
- Electric Vehicles
EVs function as storage-type flexible loads, with their flexibility heavily influenced by user travel behavior and weather conditions. As EV adoption accelerates, their aggregate flexibility becomes increasingly valuable. Coordinated trip planning and dispatching of large EV fleets can substantially reshape load profiles and provide significant services to the power grid [28]. Diurnal analysis reveals pronounced hourly variations, whereas seasonal variations remain modest.
2.2.3. Energy Storage System
Distinct energy-storage technologies possess unique characteristics, advantages, and application scopes. The heterogeneity of storage-use cases has spurred a diversified evolution of storage technologies. Table 1 summarizes the various storage types employed in VPPs and their corresponding application scenarios.

Table 1.
Energy-storage technologies and their application scenarios.
Hybrid energy storage systems can leverage the advantages of various energy storage technologies, capitalizing on their strengths and mitigating their weaknesses, thereby forming a safer, more reliable, and stable energy supply structure [29]. Based on the characteristics of different storage technologies, this study selects the mature power-type lithium battery energy storage system and the long-duration capacity and energy-type hydrogen energy storage system as the storage architecture for the EHCVPP.
3. Benefit Allocation Optimization Strategy for the EHCVPP
3.1. Benefit Allocation Influence Factor
3.1.1. Risk Loss
The internal aggregated entities of the EHCVPP may cause loss risks to the entire alliance due to misjudgments in assessing their own resources and power generation capabilities. Therefore, this study characterizes the risk loss factor by evaluating the accuracy of each aggregated entity’s self-assessment of its own output, and uses the prediction accuracy scores of the internal entities regarding output and load as the criteria for measuring risk and allocating benefits.
This study employs the Theil inequality coefficient as the evaluation mechanism for assessing the prediction accuracy of power output and load of distributed renewable energy within the EHCVPP. In the quantitative analysis of renewable energy and load uncertainty, the Theil inequality coefficient provides an innovative tool for assessing risk contributions across different entities by decomposing forecast errors into three dimensions: mean deviation, variance fluctuation, and covariance mismatch [30]. This method converts the systematic errors arising from renewable energy output deviations, load fluctuations, and their interactions into quantifiable Theil indices, where higher index values indicate greater risk exposure for the entity.
By quantifying variations in renewable generation and load demand across different timeframes or regions, it effectively evaluates renewable volatility and forecasting errors while analyzing load uncertainty. This enables multi-party entities within EHCVPPs to assess their risk levels with greater precision. Within the EHCVPP, comparing the Thei index differences between actual generation curves and day-ahead forecast curves identifies excess risks for renewable entities due to output volatility. Meanwhile, the load side exhibits distinct covariance risk characteristics stemming from variations in demand response capabilities. Based on these quantitative analyses, EHCVPP operators can formulate more rational benefit distribution schemes, achieving an optimal balance between risk and reward.
The Theil inequality coefficient can be expressed as shown below [30]:
denotes the actual output of agent at time , and represents its forecasted output at the same instant; is the total number of forecast periods.
The Theil inequality coefficient can be further decomposed into three constituent components:
denotes the proportional discrepancy, which quantifies the proportional relationship between the forecasted and actual values; represents the bias, measuring the systematic deviation between the forecasts and observations; and is the covariance discrepancy, indicating the correlation between the forecasted and actual values.
is the mean of the forecasted values and is the mean of the actual values; reflects the similarity in volatility magnitude between forecasts and actuals, quantifies their deviation in mean levels, and indicates the consistency of their fluctuation directions.
Accurate forecasting of distributed renewable generation and diverse loads within the EHCVPP is one of the decisive factors influencing the coalition’s overall revenue. To incentivize truthful reporting of forecast capabilities and actual proficiency by individual resources, and to facilitate consistent discrimination among EHCVPP participants, the prediction-accuracy score of every agent must be confined to the interval [0, 1]. To ensure dimensional consistency with other benefit factors and to favor larger values, the risk-loss factor is defined as follows:
3.1.2. Economic Benefit
By leveraging the complementary advantages of its internal resources and their coordinated energy exchange, the EHCVPP can significantly enhance its overall market-participation capability; the magnitude of this enhancement can be quantified through marginal economic benefit, expressed as the following incremental economic gain:
denotes the marginal economic benefit contributed by the inclusion of member in the VPP coalition, represents the total economic benefit when all members participate, and is the economic benefit realized by the coalition after excluding member . Consequently, the economic benefit allocated to coalition member can be expressed as shown below:
To ensure dimensional consistency across all influence factors, this study defines the marginal economic benefit factor of the VPP as the ratio of the economic benefit allocated to participant to the total aggregate benefit, expressed as follows:
3.1.3. Environmental Benefit
Beyond securing sustainable economic returns, the EHCVPP is subject to stringent environmental-accountability pressures; hence, green value-based environmental benefits constitute a pivotal criterion in both the aggregation of heterogeneous entities and the subsequent benefit allocation. Connotationally, the EH-VPP’s environmental benefits encompass the low-carbon dividend and the reductions in SOx and NOx emissions achieved by distributed renewable generation; the indirect environmental gains arising when flexible services provided by storage systems displace ancillary services from conventional thermal plants; the additional carbon-abatement value of “green hydrogen” produced via renewable-powered electrolysis, as opposed to conventional “gray” or “blue” hydrogen; and the indirect low-carbon benefit realized when demand-side resources, by shifting or shaving loads through demand response, better align electricity demand with renewable supply.
Because the incremental green value of each stakeholder is heterogeneous, multifaceted, and partly contingent on external system operation, this study adopts carbon-emission reduction as the sole metric for the marginal environmental benefit factor. The factor is quantified by the incremental green benefit accruing upon a stakeholder’s integration into the coalition, i.e.,
denotes the incremental green-environmental benefit facilitated by the inclusion of member in the coalition, represents the total green-environmental value when all members participate, and is the green-environmental value realized by the coalition after excluding member . Consequently, the environmental benefit allocated to coalition member can be expressed as follows:
To ensure dimensional consistency across all influence factors, this study defines the marginal environmental benefit factor for the VPP as the ratio of the environmental benefit allocated to a participant in the total green-environmental increment, expressed as follows:
3.2. Benefit Allocation Method
3.2.1. Conventional Shapley Value-Based Benefit Allocation Method
Shapley allocation is a method for determining the fair share of each coalition member based on their average marginal contribution. Consider a cooperative game in characteristic-function form , where indexes the players and is the characteristic function assigning to every subset its total payoff . When distributing the total value , the outcome assigned to each player can be interpreted as a payoff vector .
The Shapley value stipulates that each member should receive the expected marginal contribution averaged over all possible coalitions it may join. Formally, the Shapley value-based allocation is given by [31]:
denotes the collection of all subsets (coalitions) that contain player ; is the total number of players in the grand coalition ; is the profit achieved by the sub-coalition when player is excluded; and represents the corresponding weighting factor.
3.2.2. Modified Shapley Value-Based Benefit Allocation Method
The conventional Shapley value method focuses exclusively on participants’ marginal contributions and implicitly assumes that all players possess equal standing—an assumption that rarely holds in practice. To render the benefit allocation process more realistic, additional key factors must be incorporated and the original Shapley values adjusted accordingly.
In the classical Shapley approach, the value function quantifies the coalition’s economic payoff; this can be extended to a multidimensional value framework:
denotes the contribution of coalition in the dimension, and let be the corresponding weight for that dimension.
In this study, an integrated AHP-entropy weighting model is designed to balance expert judgment with data-driven characteristics.
- (1)
- AHP-based subjective weighting
Domain experts are invited to perform pairwise comparisons among the first-level indicators, using the 1–9 scale to assess their relative importance [32]. A judgment matrix is then constructed. From this matrix, the eigenvector and the maximum eigenvalue are computed. Consistency is verified via the consistency ratio , where denotes the consistency index and the random consistency index. After normalization, the subjective weight vector is obtained.
- (2)
- Entropy-weight-based objective weighting
Collect the historical operational dataset , where is the number of samples and is the number of indicators. After standardizing the data to eliminate dimensional effects, the information entropy for each indicator is computed as shown below [33]:
Consequently, the objective weight vector is obtained as follows:
- (3)
- Combined weighting
To simultaneously account for expert judgment and data-driven insights, a linear combination strategy is adopted, expressed mathematically as follows:
is the weighting coefficient.
- (4)
- Determining the deviation degree via the cloud gravity-center method
As a complex energy system involving multi-agent and multi-resource coordination, the key to benefit distribution in an EHCVPP lies in accurately quantifying the contributions of each participating unit across the entire value chain. However, multiple uncertainties exist during its operation, including the randomness of renewable energy output and load variability, making it difficult for traditional deterministic models to effectively characterize the actual contributions of each unit.
Cloud models, as effective tools for addressing uncertainty, establish a mapping relationship between qualitative concepts and quantitative data regarding the contributions of each unit within the EHCVPP through the three-dimensional feature parameters “Expectation (Ex)—Entropy (En)—Hyperentropy (He)”. The expectation parameter represents the theoretical baseline level of each unit’s contribution, the entropy parameter reflects the fuzziness and degree of dispersion of the contribution value, and the hyperentropy parameter characterizes the randomness of contribution fluctuations. Through this mapping relationship, the cloud model converts the contribution characteristics of each unit during energy conversion and scheduling into a continuous “cloud droplet” distribution. This provides a quantitative basis for benefit allocation that balances uncertainty and objectivity, addressing the insufficient quantification accuracy of traditional models in complex scenarios.
Under ideal conditions for benefit distribution in an EHCVPP, the actual contributions of each participating unit should align with the preset contribution benchmarks. At this point, the “contribution clouds” depicted by the cloud model exhibit concentrated and symmetrical distribution characteristics, with entropy and superentropy parameters at relatively low levels, indicating minimal deviation. Under this scenario, the distribution ratio determined based on the preset contribution benchmark satisfies fairness and efficiency requirements without requiring adjustment. When actual operation deviates from the ideal state, multiple uncertainties cause discrepancies between each unit’s actual contribution and the preset benchmark. This manifests as increased dispersion of the “contribution cloud” in the cloud model (rising entropy values) and a shift in the distribution center away from the expected parameter deviation, indicating a significant increase in deviation. This deviation fundamentally reflects a mismatch between the actual and ideal values of each unit. Maintaining the original allocation ratio would result in units with contributions exceeding the benchmark failing to receive commensurate benefits, while units with contributions below the benchmark would capture excess profits. This not only violates the allocation principle of “equivalence between contribution and reward” but also undermines the willingness of high-contribution units to cooperate, thereby disrupting the long-term stable operation mechanism of the EHCVPP.
The cloud gravity-center evaluation approach excels at handling the uncertainty between qualitative and quantitative data, enabling effective information processing and knowledge discovery in fuzzy datasets [34]. Specifically, a normal cloud model is characterized by three numerical features: expectation , entropy , and hyper-entropy —that, respectively, correspond to the cloud’s gravity center, the width of expectation, and the cloud thickness. Entropy reflects the degree of dispersion and the fluctuation range, while hyper-entropy quantifies the level of fuzziness.
For the benefit allocation problem of an EHCVPP, the cloud gravity-center method can be employed to determine the weights of each influencing factor.
First, cloud models are constructed for the relevant influence factors. Since the benefit allocation must simultaneously account for the risk-loss factor, the economic benefit factor, and the environmental benefit factor, three distinct cloud models are established. Expert-elicited scores are collected to evaluate each factor, yielding evaluation results from domain experts. The numerical characteristics of each indicator’s cloud model are then derived as follows:
denotes the mean score assigned to the influencing factor, and represents the rating given by the expert for this factor.
The entropy of the evaluation for the influencing factor, denoted , is expressed as follows:
A three-dimensional integrated cloud is constructed to characterize the influencing factors for benefit allocation in EHCVPP, as detailed below:
The normalized integrated cloud-gravity vector is a dimensionless quantity endowed with both magnitude and direction. By multiplying each normalized index vector value by its corresponding weight and summing the products, the weighted deviation degree for each influencing factor can be computed as follows:
For each influencing factor, a higher deviation weight signifies a greater impact on the final benefit allocation.
- (5)
- Benefit allocation adjustment
The contribution of the risk-loss factor to the EHCVPP is denoted by , that of the economic benefit factor by , and that of the environmental benefit factor by , where is the number of aggregated agents within the VPP. Let the weighting coefficients for the three factors be , and , respectively, satisfying . The comprehensive contribution of each agent can then be expressed as follows:
Consequently, the improvement factor (the proportional adjustment in benefit allocation) can be expressed as follows:
3.2.3. Quantitative Model of Benefit Allocation Performance
- (1)
- Allocation Satisfaction Index
Allocation satisfaction quantifies the degree to which cooperative participants are content with the outcome of the benefit allocation scheme; the higher the overall satisfaction, the more effective the allocation. The comprehensive allocation satisfaction indices for the supply side, demand side, and VPPO within the EHCVPP are formulated as follows:
, , and denote the changes in allocated benefits relative to the initial allocation for the generation side, demand side, and VPPO side, respectively.
- (2)
- Allocation Discrepancy Index
The allocation discrepancy index quantifies the degree of disparity among the allocated benefits. Excessive disparity may undermine the cooperation willingness of participants receiving smaller shares, whereas an overly narrow gap leads to an egalitarian outcome that fails to incentivize individual entities to leverage their respective advantages. The allocation discrepancy indices for the diverse resource categories within the EHCVPP are expressed as follows:
3.3. Benefit Allocation Computational Framework
With the exponential growth of distributed resource penetration, the scale of aggregation entities in EHCVPPs has achieved a significant leap. However, traditional cooperative game methods like the global Shapley value face exponential computational complexity of O (2n) as the number of entities (n) increases, rendering them infeasible for large-scale systems. To address this challenge, this study proposes a “coupling–decoupling–re-culstering” dimensionality reduction framework with the following core steps as shown in Figure 2:
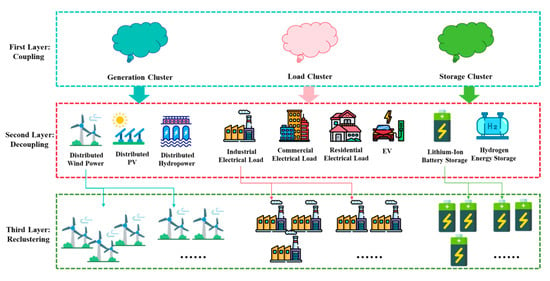
Figure 2.
Schematic of the stepwise hierarchical benefit allocation.
- Coupling: Group highly homogeneous distributed resources into functional clusters, reducing the n-dimensional entity space to three dimensions: power source clusters, load clusters, and energy storage clusters.
- Decoupling: Further subdivide each functional cluster into “sub-clusters” based on technical attributes. For example, power source clusters are divided into distributed wind, solar, and hydro sub-clusters, expanding the dimensionality to a controllable k (k ≪ n).
- Re-clustering: Within each sub-cluster, use random sampling and clustering to aggregate similar units into meta-entities, compressing the dimensionality of each sub-cluster to m ≈ log2n.
4. Case Study
4.1. Basic Design
The EHCVPP examined in this paper is configured as a hybrid VPP with a daily energy-market capability of 30 MW, a downward regulation reserve of 18 MW, and an upward regulation reserve of 5 MW. Time-of-use prices are derived from the medium- and long-term, time-segment trading data of a province in China. Historical average clearing prices in both the medium- to long-term market and the spot market are used to set the upper and lower bounds of electricity prices for different scenarios. The time-of-day segmentation and the corresponding reference prices are listed in Table 2, while green certificate prices are provided in Table 3.

Table 2.
Division of electricity price and time segment.

Table 3.
GC price (Unit: CNY/Sheet).
CCER (China Certified Emission Reduction) prices are anchored to the Fudan Carbon Price Index, which references the bid, ask, and mid-prices of CCERs used for compliance in China’s national carbon market. Hydrogen prices are benchmarked against the average transaction prices in key provinces nationwide and are set at 25–35 CNY/kg. The research logic framework of this paper is shown in Figure 3. The programming for this paper was implemented in MATLAB R2024b.
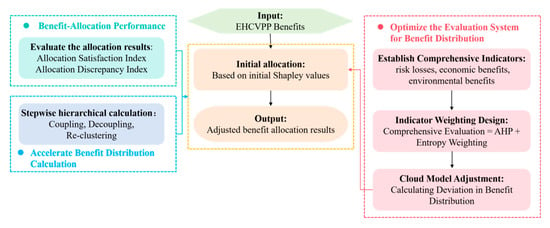
Figure 3.
Logic framework diagram.
4.2. Computation of Benefit Allocation Deviation
4.2.1. First-Level Deviation
The influence factors weights, evaluation results for the initial values and the evaluation results at the first level are shown in Figure 4, Figure 5 and Figure 6. The computed risk-loss, economic benefit, and environmental benefit factors for the generation side, demand side and VPPO side of EHCVPP are T = {0.03, 0.36, 0.01}, T0 = {0, 0.43, 0}, Tg = {1, −0.15, 1}; T = {0.03, 0.38, 0.01}, T0 = {0, 0.43, 0}, Tg = {1, −0.12, 1}; T = {0.01, 0.38, 0.02}, T0 = {0, 0.43, 0}, and Tg = {1, −0.12, 1}. Based on these values, the weighted deviations for the generation-side, load-side, and operator-side participants are 0.33, 0.34, and 0.34, respectively.
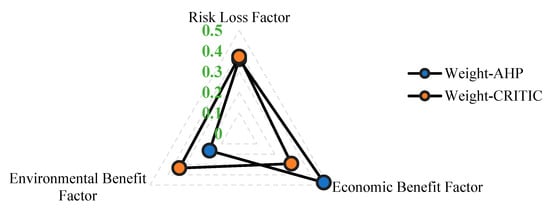
Figure 4.
Influence factors’ weights.
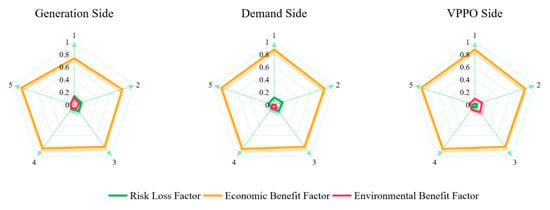
Figure 5.
Evaluation results for the initial values.
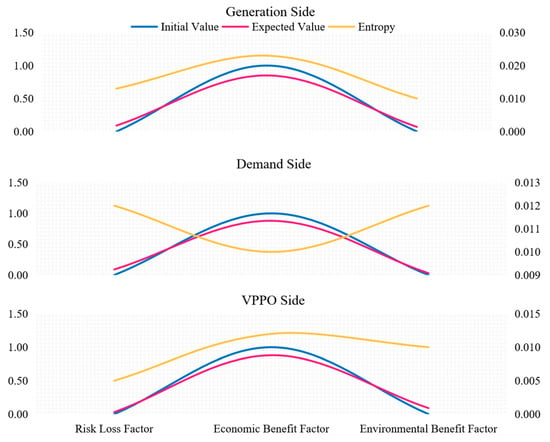
Figure 6.
Evaluation results at the first level.
4.2.2. Second-Level Deviation
Initial value evaluation results for the influencing factors and computed cloud gravity-center deviation on the generation side are shown in Figure 7 and Figure 8. The computed risk-loss, economic benefit, and environmental benefit factors for the distributed wind power, distributed PV, distributed hydropower of generation side are T = {0.03, 0.42, 0.01}, T0 = {0, 0.50, 0}, Tg = {1, −0.15, 1}; T = {0.03, 0.43, 0.01}, T0 = {0, 0.50, 0}, Tg = {1, −0.13, 1}; T = {0.01, 0.44, 0.01}, T0 = {0, 0.50, 0}, Tg = {1, −0.11, 1}. Consequently, the weighted deviations for distributed wind, PV, and hydropower are calculated as 0.33, 0.33, and 0.34, respectively.
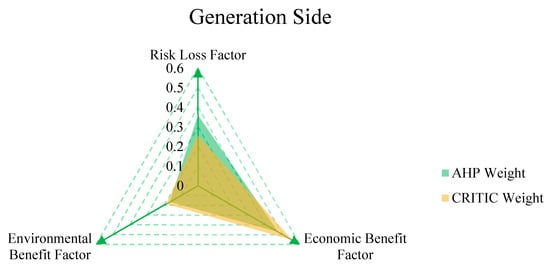
Figure 7.
Initial value evaluation results for the influencing factors on the generation side.
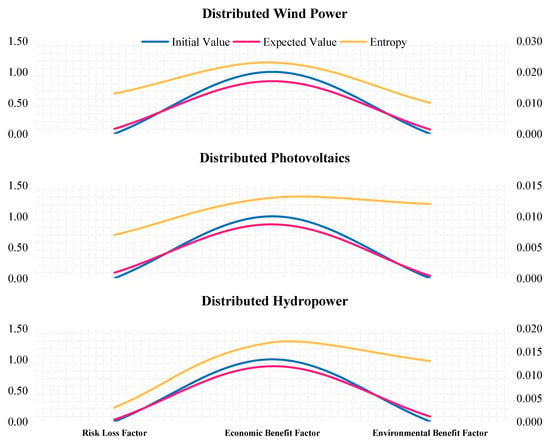
Figure 8.
Computed cloud gravity-center deviation on the generation side.
Initial value evaluation results for the influencing factors and Computed cloud gravity-center deviation on the demand side are shown in Figure 9 and Figure 10. The cloud gravity-center indices for risk-loss, economic benefit, and environmental benefit factors, computed for industrial, commercial, and residential loads as well as for EVs, are as follows: T = {0.01, 0.46, 0.01}, T0 = {0, 0.50, 0}, Tg = {1, −0.09, 1}; T = {0.01, 0.46, 0.01}, T0 = {0, 0.50, 0}, Tg = {1, −0.08, 1}; T = {0.01, 0.47, 0.01}, T0 = {0, 0.50, 0}, Tg = {1, −0.08, 1}; T = {0.02, 0.35, 0.02}, T0 = {0, 0.40, 0}, Tg = {1, −0.14, 1}. Consequently, the weighted deviations for industrial loads, commercial loads, residential loads, and EVs are calculated as 0.24, 0.24, 0.24, and 0.28, respectively.
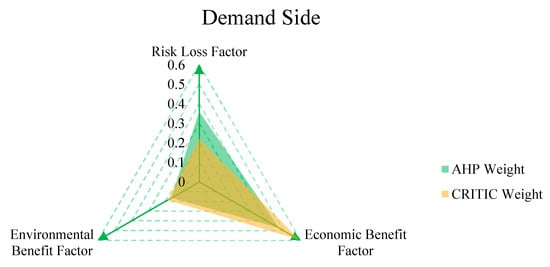
Figure 9.
Initial value evaluation results for the influencing factors on the demand side.
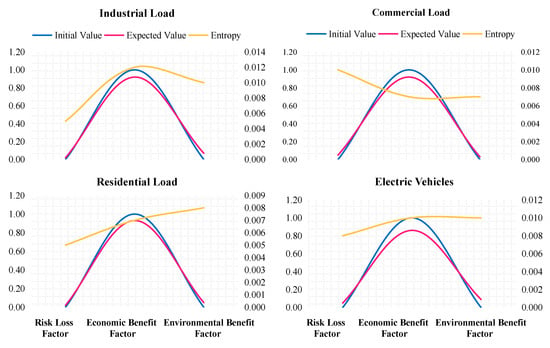
Figure 10.
Computed cloud gravity-center deviation on the demand side.
4.3. Benefit Allocation Results
This section characterizes the transfer of benefits by comparing the original Shapley values (initial allocation) with the modified Shapley values (adjusted allocation) proposed in this paper. Among these, the EHCVPP operator’s revenue from configuring energy storage systems and aggregating both supply side and demand-side resources amounts to CNY 865,000. The operator’s revenue from configuring energy storage systems and aggregating solely the supply side reaches CNY 579,000, while revenue from aggregating solely the demand side stands at CNY 191,000. Without resource aggregation by the EHCVPP operator, the revenue from the generation side alone is CNY 156,000, while the revenue from the load side alone is −CNY 107,000. When the EHCVPP operator does not aggregate distributed renewable energy and loads but only deploys its own energy storage system, the revenue is CNY 57,000. If the EHCVPP operator only aggregates the generation and load sides without deploying energy storage, the revenue is CNY 71,000, representing a mere 0.5% improvement over non-aggregated resources. Thus, resource aggregation and energy storage deployment collectively boost the alliance’s overall benefits by sevenfold.
4.3.1. First-Level Benefit Allocation Results
As shown in Figure 11, after the first-level correction, the benefits within the EHCVPP are reallocated from the generation side toward the demand side and the VPPO. This indicates that, once comprehensive factors are taken into account, the generation side has captured excess profits, whereas the demand side and the VPPO have received less-than-equitable shares of the joint surplus. Moreover, relative to the total profits allocated to each stakeholder, the amount earmarked for transfer is modest.
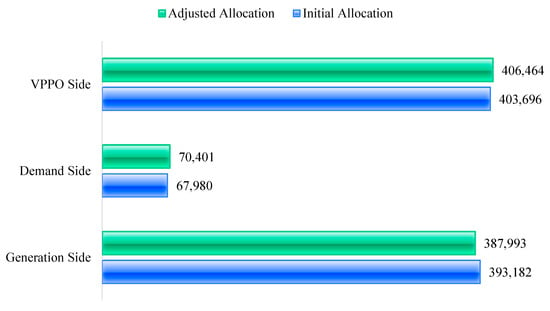
Figure 11.
First-level benefit allocation results.
4.3.2. Second-Level Benefit Allocation Results
Figure 12 depicts the second-level benefit reallocation results within the generation-side coalition of the EHCVPP. As shown, both wind and PV resources must transfer a portion of their profits to hydropower due to their higher uncertainty-related risks. It is noteworthy that the initial aggregate profit of the generation side exceeds its post-correction aggregate profit; the profit reductions experienced by wind and PV after adjustment are larger than the incremental profit gained by hydropower. This asymmetry stems from the first-level correction, in which a portion of the generation side’s profit was redistributed to the VPP operator and the demand-side participants.
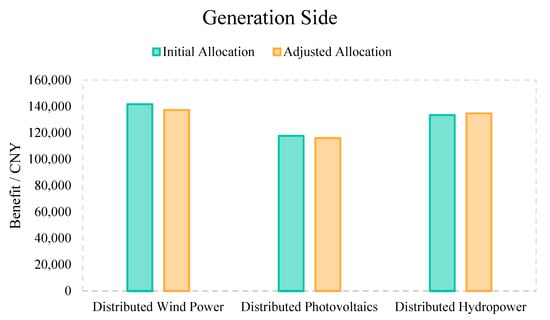
Figure 12.
Second-level benefit reallocation outcomes on the generation side.
Figure 13 illustrates the second-level profit reallocation within the demand-side coalition of the EHCVPP. It is evident that the adjusted benefits of all demand categories increase markedly after correction, with electric vehicle loads receiving the largest increment, followed by commercial loads and then industrial loads. This aggregate uplift for the demand side originates from the first-level adjustment, in which a portion of the generation-side profits was transferred to the demand-side participants.
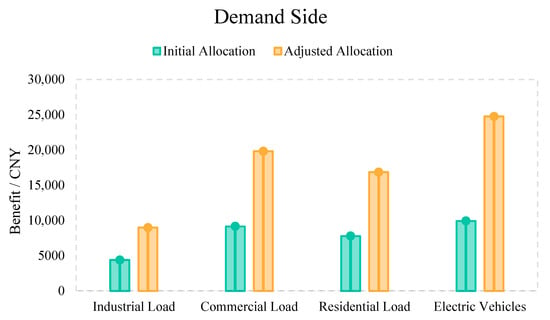
Figure 13.
Second-level benefit reallocation outcomes on the demand side.
4.4. Benefit Allocation Performance Evaluation
As shown in Figure 14, both the generation and demand sides exhibit high overall satisfaction at the first and second tiers. Specifically, the allocation satisfaction indices for the generation side remain close to 100% across both tiers, indicating minimal deviation from the initial satisfaction levels. In contrast, the demand side’s satisfaction at the second tier markedly exceeds 100%. Regarding allocation deviation, the indices for both tiers fall within the 30–70% range relative to the initial 100% reference. This interval preserves a reasonable degree of differentiation to incentivize individual participants while preventing excessive disparity that could undermine the sustainability of cooperation.
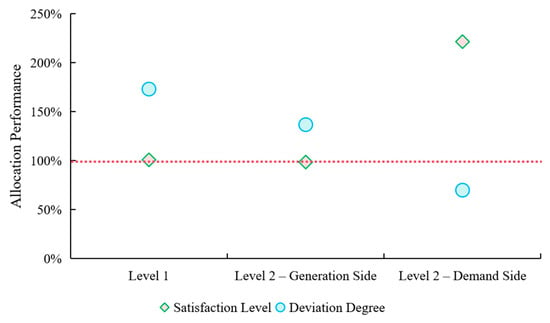
Figure 14.
Benefit allocation performance.
5. Conclusions
This paper establishes an optimized benefit allocation model for EHCVPPs based on a risk–reward hierarchical framework. It provides a scientific methodology for achieving equitable benefit distribution among multiple internal stakeholders, thereby ensuring sustainable operations. Addressing the limitations of benefit allocation methods focused solely on economic gains, the study analyzes the mechanisms of benefit and risk transmission within EHCVPPs, revealing underlying inequities in benefit distribution. Considering the diverse types of aggregated entities within EHCVPPs and the complexity of benefit allocation calculations, a hierarchical benefit distribution framework is constructed to clarify each entity’s contribution within the alliance. A benefit allocation model is developed based on multidimensional factors—economic, risk, and environmental. Introducing a subjective–objective evaluation method, a modified model based on cloud centers is established. The conclusions are as follows:
- (1)
- After applying comprehensive factor adjustments, benefits shift from the generation side to the load side and EHCVPP operators. This stems from the generation side’s higher uncertainty relative to the load side, coupled with the lower weighting of green benefit gains compared to risk losses.
- (2)
- After adjusting for comprehensive factors, benefit allocation tilts toward EHCVPP operators relative to power generation entities. This stems from EHCVPP operators’ lower probability of risk losses while matching power-focused entities in green environmental gains. For the second-tier power generation side, since all power sources are renewable, the environmental benefits in terms of green value are relatively similar. However, due to the significantly higher output uncertainty of wind and solar power compared to hydropower, a portion of the benefits from wind and solar power is transferred to hydropower.
- (3)
- Compared to the load side, EHCVPP operators possess higher green environmental value and lower risk loss probability. Therefore, benefits from the load side should be transferred to EHCVPP operators. For load-side entities in the second tier of load-based EHCVPPs, benefit distribution—considering risk and green benefit value-added—should be tilted toward electric vehicle loads from industrial, commercial, and residential loads.
The results demonstrate that the proposed method partially addresses limitations of single-benefit-based allocation. The outcomes align with risk–reward profiles across participant types. The hierarchical allocation scheme not only clarifies benefit distribution logic but also accelerates computational processes.
Author Contributions
Q.L.: Conceptualization, Writing—Original Draft; Y.Z.: Investigation, Resources, Visualization; W.W.: Formal analysis, Supervision; Z.Z.: Data Curation, Funding acquisition; M.S.: Methodology, Writing—Original Draft, Writing—Review and Editing; Y.C.: Writing—Review and Editing, Project administration. All authors have read and agreed to the published version of the manuscript.
Funding
This work is funded in the Science and Technology Program of China Southern Power Grid Co., Ltd. [Grant No. 000005KC24010038].
Institutional Review Board Statement
Not applicable.
Informed Consent Statement
Not applicable.
Data Availability Statement
The data presented in this study are available on request from the corresponding author due to (strict confidentiality agreements).
Conflicts of Interest
Authors Qixing Liu, Yuzhu Zhao, Wenzu Wu, and Zhe Zhai were employed by the Power Dispatch and Control Center of China Southern Power Grid. The remaining authors declare that the research was conducted in the absence of any commercial or financial relationships that could be construed as a potential conflict of interest. The authors declare that this study received funding from China Southern Power Grid Co., Ltd. The funder was not involved in the study design, collection, analysis, or interpretation of data, the writing of this article, or the decision to submit it for publication.
References
- Lv, X.; Li, X.; Tan, Q.; Jia, D. Does coordination with renewable energy through virtual power plants enhance the transition willingness of coal-fired power plants? An evidence from city in China. Energy Econ. 2025, 148, 108675. [Google Scholar] [CrossRef]
- Mengshu, S.; Yuansheng, H. Research on investment planning of power-hydrogen system considering the multi-stakeholder benefit. Renew. Energy 2022, 199, 1408–1423. [Google Scholar] [CrossRef]
- Rego, N.; Castro, R.; Lagarto, J. Sustainable energy trading and fair benefit allocation in renewable energy communities: A simulation model for Portugal. Util. Policy 2025, 96, 101986. [Google Scholar] [CrossRef]
- Schmeidler, D. The Nucleolus of a Characteristic Function Game. Soc. Ind. Appl. Math. (SIAM) 1969, 17, 1163–1170. [Google Scholar] [CrossRef]
- Basilico, P.; Biancardi, A.; D’ADamo, I.; Gastaldi, M.; Yigitcanlar, T. Renewable energy communities for sustainable cities: Economic insights into subsidies, market dynamics and benefits distribution. Appl. Energy 2025, 389, 125752. [Google Scholar] [CrossRef]
- Ju, L.; Lv, S.; Zhang, Z.; Li, G.; Gan, W.; Fang, J. Data-driven two-stage robust optimization dispatching model and benefit allocation strategy for a novel virtual power plant considering carbon-green certificate equivalence conversion mechanism. Appl. Energy 2024, 362, 122974. [Google Scholar] [CrossRef]
- Bao, P.; Xu, Q.; Yang, Y.; Zhao, X. Cooperative game-based solution for power system dynamic economic dispatch considering uncertainties: A case study of large-scale 5G base stations as virtual power plant. Appl. Energy 2024, 368, 123463. [Google Scholar] [CrossRef]
- Li, N.; Lu, X.L.; Yang, S.B.; Li, F.; Xu, D.C. An optimized equilibrium-allocation model for the operational benefits of rural virtual power plants considering carbon recycling. Smart Power 2023, 51, 78–85, 107. [Google Scholar]
- He, Z.; Li, K.; Sun, Z.; Yan, Y.; Zhang, C. Optimal scheduling of multi-energy hubs considering carbon trading and its benefit allocation. Int. J. Green Energy 2024, 21, 904–918. [Google Scholar] [CrossRef]
- Li, J.; Chen, H.; Qi, Y.; Wang, Y.; Lei, J. Collaborative optimization for cross-regional integrated energy systems producing electricity-heat-hydrogen based on generalized Nash bargaining. Energy 2025, 333, 137444. [Google Scholar] [CrossRef]
- Mengshu, S.; Yuansheng, H.; Hongyu, L. Research on power to hydrogen optimization and profit distribution of microgrid cluster considering shared hydrogen storage. Energy 2023, 264, 126113. [Google Scholar] [CrossRef]
- Liang, W.; Wang, S.; Li, X.; Li, X.; Xu, K. Optimization method of low carbon park integrated energy system based on multi-agent game. Electr. Power Syst. Res. 2025, 243, 111484. [Google Scholar] [CrossRef]
- Machado, A.A.; Fiorotti, R.; Villaça, R.d.S.; Rocha, H.R. Profit distribution through blockchain solution from battery energy storage system in a virtual power plant using intelligence techniques. J. Energy Storage 2024, 98, 113150. [Google Scholar] [CrossRef]
- Tan, Z.-F.; Li, H.-H.; Ju, L.-W.; Tan, Q.-K. Joint Scheduling Optimization of Virtual Power Plants and Equitable Profit Distribution Using Shapely Value Theory. Math. Probl. Eng. 2018, 2018, 3810492. [Google Scholar] [CrossRef]
- Lao, J.; Qin, Z. A Modified Shapley Value Model for Equitable Benefit Distribution in Design-Led EPC Consortia. Buildings 2025, 15, 2024. [Google Scholar] [CrossRef]
- Matrenin, P.V.; Gamaley, V.V.; Khalyasmaa, A.I.; Stepanova, A.I. Solar Irradiance Forecasting with Natural Language Processing of Cloud Observations and Interpretation of Results with Modified Shapley Additive Explanations. Algorithms 2024, 17, 150. [Google Scholar] [CrossRef]
- Jia, H.P.; Guo, Y.C.; Yu, T.; Yang, J.; Huang, Y.P.; Liu, D.N. Revenue-allocation strategy for virtual power plants considering output deviation and risk control. Electr. Power Constr. 2024, 45, 27–36. [Google Scholar]
- Cheng, Y.Y.; Gao, H.J.; Wang, R.J.; Gao, Y.; Liu, J. Two-stage quasi-linear demand response optimization and benefit-sharing/risk-bearing decision-making for virtual power plants. Power Syst. Technol. 2024, 48, 799–809. [Google Scholar] [CrossRef]
- Fan, W.; Fan, Y.; Tan, Z.F.; Ju, L.; Yao, X. Distributionally robust optimization model for virtual power plants participating in electricity–carbon markets based on multi-layer benefit sharing. Syst. Eng. Theory Pract. 2024, 44, 661–683. [Google Scholar]
- Wu, D.F.; Xu, T.T.; Zhang, N.; Gao, Y.; Han, Y.; Zheng, C.; Wang, C. A multi-agent bi-level optimal dispatch method for park-level integrated energy systems based on carbon trading and Stackelberg game. Power Big Data 2024, 27, 9–18. [Google Scholar] [CrossRef]
- Shang, Y.; Li, X.; Xu, T.; Cui, L. Uncertainty-output virtual power plant participates in multi-electricity market considering the improved Shapley value distribution method. Int. J. Electr. Power Energy Syst. 2025, 165, 110462. [Google Scholar] [CrossRef]
- Fan, H.; Li, M.; Zhang, Z.; Cheng, L.; Ye, Y.; Liu, W.; Liu, D. M2WLLM: Multi-modal multi-task ultra-short-term wind power prediction algorithm based on large language model. Inf. Fusion 2025, 126, 103541. [Google Scholar] [CrossRef]
- Kihel, E.B.; Elyamani, K.E.E.N.; Chillali, A. Evaluation of Weibull parameters for wind energy analysis in the eastern region of the Kingdom of Morocco. Wind Eng. 2024, 48, 687–707. [Google Scholar] [CrossRef]
- Li, X.; Wen, H.; Hu, Y.; Jiang, L.; Xiao, W. Modified Beta Algorithm for GMPPT and Partial Shading Detection in Photovoltaic Systems. IEEE Trans. Power Electron. 2018, 33, 2172–2186. [Google Scholar] [CrossRef]
- Fatima, S.; Bashir, A.A.; Jokinen, I.; Lehtonen, M.; Pourakbari-Kasmaei, M. Synchronizing flexible loads with wind energy via Stackelberg game for renewable integration and economic efficiency. Appl. Energy 2025, 397, 126398. [Google Scholar] [CrossRef]
- Ma, Z.; Cui, S.; Chen, J. Demand response through ventilation and latent load adjustment for commercial buildings in humid climate zones. Appl. Energy 2024, 373, 123940. [Google Scholar] [CrossRef]
- Cao, W.; Liu, H.; Zhang, X.; Zeng, Y.; Ling, X. Short-Term Residential Load Forecasting Based on the Fusion of Customer Load Uncertainty Feature Extraction and Meteorological Factors. Sustainability 2025, 17, 1033. [Google Scholar] [CrossRef]
- Ramalingeswar, J.T.; Subramanian, K. A novel energy management strategy to reduce gird dependency usingelectric vehicles storage in coordination with solar power. J. Intell. Fuzzy Syst. 2021, 41, 2207–2223. [Google Scholar]
- Shi, M.; Vasquez, J.C.; Guerrero, J.M.; Huang, Y. Smart communities—Design of integrated energy packages considering incentive integrated demand response and optimization of coupled electricity-gas-cooling-heat and hydrogen systems. Int. J. Hydrogen Energy 2023, 48, 31063–31077. [Google Scholar] [CrossRef]
- Vega, L.D.L.C.; Urrutia, A.; Volij, O. An axiomatic characterization of the Theil inequality ordering. Econ. Theory 2013, 54, 757–776. [Google Scholar] [CrossRef]
- Qin, S.W. Application of Shapley Value Method in Profits Allocation of Cooperation of Enterprises, Colleges and Institutes. Appl. Mech. Mater. 2010, 40, 425–429. [Google Scholar] [CrossRef]
- Malinić, V.; Durlević, U.; Brašanac-Bosanac, L.; Novković, I.; Joksimović, M.; Golić, R.; Krstić, F. A Hybrid Fuzzy AHP–MULTIMOORA Approach for Solar Energy Development on Rural Brownfield Sites in Serbia. Sustainability 2025, 17, 7988. [Google Scholar] [CrossRef]
- Ma, Y.; Huang, D.; Wang, Y. A risk classification method for contract performance based on G1-improved entropy weight two-dimensional cloud model. Int. J. Model. Simul. Sci. Comput. 2025, 2550056. [Google Scholar] [CrossRef]
- Xu, X.; Gu, X.; Huang, W.; Liu, S.; Zhang, X.; Zhang, J.; Xu, B. A cloud-based intelligent reconstruction method for low-sampling-rate signals in remote condition monitoring of hydraulic pumps. Expert Syst. Appl. 2025, 294, 128758. [Google Scholar] [CrossRef]
Disclaimer/Publisher’s Note: The statements, opinions and data contained in all publications are solely those of the individual author(s) and contributor(s) and not of MDPI and/or the editor(s). MDPI and/or the editor(s) disclaim responsibility for any injury to people or property resulting from any ideas, methods, instructions or products referred to in the content. |
© 2025 by the authors. Licensee MDPI, Basel, Switzerland. This article is an open access article distributed under the terms and conditions of the Creative Commons Attribution (CC BY) license (https://creativecommons.org/licenses/by/4.0/).