Article

COVID-19 and the Merit-Order Effect of Wind Energy: The Case of Nord Pool Electricity Markets †

by
Seifeddine Guerdalli
1,2 and
Emna Trabelsi
1,3,*
1
Department of Quantitative Methods, Faculty of Economic and Management Sciences of Sousse, University of Sousse, Sousse 4023, Tunisia
2
Modeling, Financing, and Economic Development Research Unit (MOFID), Sousse 4023, Tunisia
3
Social and Economic Policy Analysis Laboratory, Higher Institute of Management of Tunis, University of Tunis, Tunis 2000, Tunisia
*
Author to whom correspondence should be addressed.
This article is a revised and expanded version of a paper entitled “Impact of Wind Energy Production on Nord Pool Electricity Market Prices Pre and During COVID-19”, which was presented at the Conférence Internationale sur les Sciences Appliquées et l’Innovation (CISAI-2023), Sousse, Tunisia, 10–11 July 2023.
Sustainability 2025, 17(21), 9859; https://doi.org/10.3390/su17219859
Submission received: 14 February 2025 / Revised: 15 March 2025 / Accepted: 18 March 2025 / Published: 5 November 2025

Abstract

The COVID-19 pandemic has profoundly affected global economies, including the electricity sector. Governments implemented strict containment measures to mitigate the health crisis, including lockdowns, social distancing, and event cancelations. These interventions, while essential for public health, also disrupted energy demand and supply patterns. This study supports regulators by quantifying the short- and long-term impacts of the pandemic on local electricity prices (LEPs) in the Nord Pool market (Norway, Sweden, Denmark, Finland, Estonia, Latvia, and Lithuania) during 2020. The findings highlight a crucial link between crisis response strategies and the transition to sustainable energy systems. In times of uncertainty, governments tend to prioritize renewable energy investments, particularly wind power, which offers a clean and resilient alternative to fossil-fuel-based electricity generation. Using the PMG-ARDL estimator, our analysis reveals a significant long-term negative association between government interventions and LEP, as well as between wind energy production (WEP) and LEP. Specifically, an additional gigawatt of wind energy generation reduces local electricity prices by up to EUR 0.09, confirming the merit-order effect. These findings emphasize the environmental and economic benefits of expanding wind energy capacity as a stabilizing force in electricity markets. Moreover, while health-related news influenced LEP fluctuations in the long run, government restrictions had a limited short-term impact, likely due to the inelastic nature of electricity demand and supply. This study reinforces the argument that integrating more renewable energy sources can enhance market resilience, reduce price volatility, and contribute to long-term sustainable development, making the energy transition an essential pillar of post-pandemic recovery strategies.

1. Introduction

It is widely believed that COVID-19 has engendered devastating consequences on worldwide economies [1,2,3]. The Nord Pool region has its part of the pie. As a consequence of the pandemic, changes in social behavior have been detected. This includes a considerable reduction in electricity consumption and demand [4,5]. With the arrival of the epidemic, electricity supply has also been affected, with a greater emphasis on energy policy. The development of renewable energy has shown the importance of wind energy specifically in the Nord Pool region [6,7,8]. Apart from being less expensive compared to other energy sources, such as nuclear power, it is widely acknowledged that wind energy is environment-friendly [9,10,11,12,13,14,15].

1.1. Government Measures to Handle the Pandemic Situation

Governments implemented various emergency programs, including isolation, social distancing, event postponements, and bans on gatherings. These measures were designed to limit the spread of the virus while indirectly affecting economic activities, including the electricity market. Pandemic-related variables such as confirmed cases, mortalities, and government policies influenced electricity demand and supply dynamics. This study explores how containment measures, economic support, and health policies shaped electricity markets in the Nord Pool region. A pronounced impact is expected when governments intervene to contain the virus, leading to significant shifts in electricity consumption patterns [4,5,16].
Beyond public health concerns, governments played a critical role in managing energy demand and fostering sustainable energy use. Policy interventions were crucial in stabilizing market conditions and guiding long-term energy strategies. Trust in media, scientific guidance, and economic sentiment influenced compliance with restrictions, further affecting energy markets [17,18,19,20,21,22]. The effectiveness of lockdowns and economic aid varied across countries, affecting electricity demand and price volatility [23]. The time lag between government announcements and actual policy implementation further complicated the assessment of these measures.

1.2. Effect on Local Electricity Price Due to Predicaments

With the slowdown of economic activity, unusual movements in electricity operations and prices have been noticed [24,25]. The author of [26] argued that variations in wholesale electricity prices hinged on a lower market concentration and a cleaner environment policy. Similarly, ref. [27] cheered the role of competitiveness in hard times such as the COVID-19 pandemic. In the European region, Deloitte’s report [28] recognized a decline in demand in the electricity markets, especially driven by the lockdown restrictions [29,30,31,32]. Similarly, ref. [33] noticed a fallout in demand in the electricity markets of Canadian provinces. Shifts in behavior and sentiments are also depicted under exogenous shocks [34]. Ref. [35] found that the announcement of confirmed death causes fear and insecurity for investors, explaining the adverse effects of such news on energy prices in Spain. Similarly, US electricity consumption fell because of human infection, social distancing restrictions, and business project records [36].
Both increased wind penetration and the merit of scientific advice from the government stabilized electricity prices in Germany [37]. Investing in renewable energy sources from African landscapes is also recommended [38]. While fiscal and financial measures undertaken by the governments are provisory in those countries, the pandemic allows for the premise of a clean energy transition with a long-lasting positive effect on the sector. Bidding on renewable energy, which is a combination of regulatory structure and climate state, should reinforce electricity supply security [27]. The Brazilian government has intervened financially with a loan-based policy to alleviate the effects of COVID-19 on the electricity market, without achieving a perfect system [39]. In Ibero-America, the government assisted citizens with delays and reductions in bill prices. This economic aid does not, however, reach all social categories [40].

1.3. Effect of Wind Energy Production (WEP) on Local Electricity Price (LEP) and Government Measures

The WEP-LEP nexus has been thoroughly investigated in the literature. According to [41], rising wind power in the US Pacific Northwest caused a brief but notable decline in wholesale market pricing. Likewise, ref. [42] showed that WEP can affect power market pricing using a genetic algorithm and a single auction market model. Ref. [43] demonstrated, using a price maker optimization model, that wind power providers can reduce LEPs by taking part in the day-ahead market without obtaining any premiums or assistance. Interestingly, ref. [44] found that while wind power lowers prices, it also raises volatility in the short term but will likely decrease the wholesale electricity prices in Germany by 2023.
A Monte Carlo study by [45] supported reduced production costs and less price volatility due to greater wind capacity. Ref. [46] demonstrated that, in the short term, higher wind output lowers wholesale market prices by a marginal but economically significant amount. This observation was shared by [47] and complemented by a rise in price volatility. The authors of [48] demonstrated that increasing wind power contributes to lower levels of electricity spot prices but higher volatility. The WEP-LEP relationship is also sensitive to seasonal effects [49]. Refs. [50,51] asserted that higher WEPs have a significant, especially short-term, impact on LEP volatility. Reference [52] showed that daily and monthly impacts are substantial, while short-term price swings in gasoline markets have minimal effect on LEPs in Germany. Refs. [53,54,55,56] contended that wind power causes downward pricing.
Improvements in wind turbine efficiency have been offset by higher grid integration costs. Despite this, WEP remains a key driver of LEPs [57,58]. Nonetheless, ref. [59] discovered that inadequacies in wind power generation systems, particularly in times of elevated electricity demand, resulted in increased US spot prices in both low- and high-price scenarios. During the dry season, greater wind generation increases price variation and decreases nodal prices [60]. While tracking changes in price levels and volatility, refs. [61,62] advocated for offshore over onshore wind energy.
Wind energy has both short- and long-term impacts on electricity prices and sustainability. In the short term, it reduces wholesale prices by displacing costlier generators, a phenomenon known as the merit-order effect [63,64,65]. This effect, observed in Spain [66,67,68], Australia [69], and Sweden [70], promotes cleaner energy adoption. Its determinants include high renewable penetration and demand [71], with evidence from multiple countries [72,73,74,75].
Policy implications require considering distributional effects [67,76,77]. However, the long-term impact remains uncertain [78]. While the authors of [79] confirm the short-term effect in Germany, they find it emerges in the long term only under a “monopolistic base load” scenario. Similarly, refs. [80,81] show that the effect diminishes with diversified electricity portfolios (for a comprehensive survey of the merit-order effect from different sources of renewable energy, we recommend [82]).
Except for [70] on Sweden, studies on the merit-order effect in the Nord Pool region are scarce, and none examine its interaction with COVID-19, distinguishing our work. Furthermore, wind energy enhances economic efficiency, reduces price volatility and fossil fuel reliance, and supports climate goals.
This paper has the following layout. Section 2 covers materials and methods. The empirical findings are shown and discussed in Section 3. We discuss the results in Section 4. Section 5 concludes.

2. Materials and Methods

2.1. Data

We collected data on LEPs in Euros and WEP in megawatt-hours (MWh) from the Nord Pool database, while COVID-19-related metrics were sourced from Our World in Data. A detailed summary of the dataset can be found in Table A1 in Appendix A.1. The sample period extends from 1 January 2020 to 31 December 2020, covering seven Nordic and Baltic countries—Norway, Sweden, Denmark, Finland, Estonia, Latvia, and Lithuania—across fifteen distinct regions.
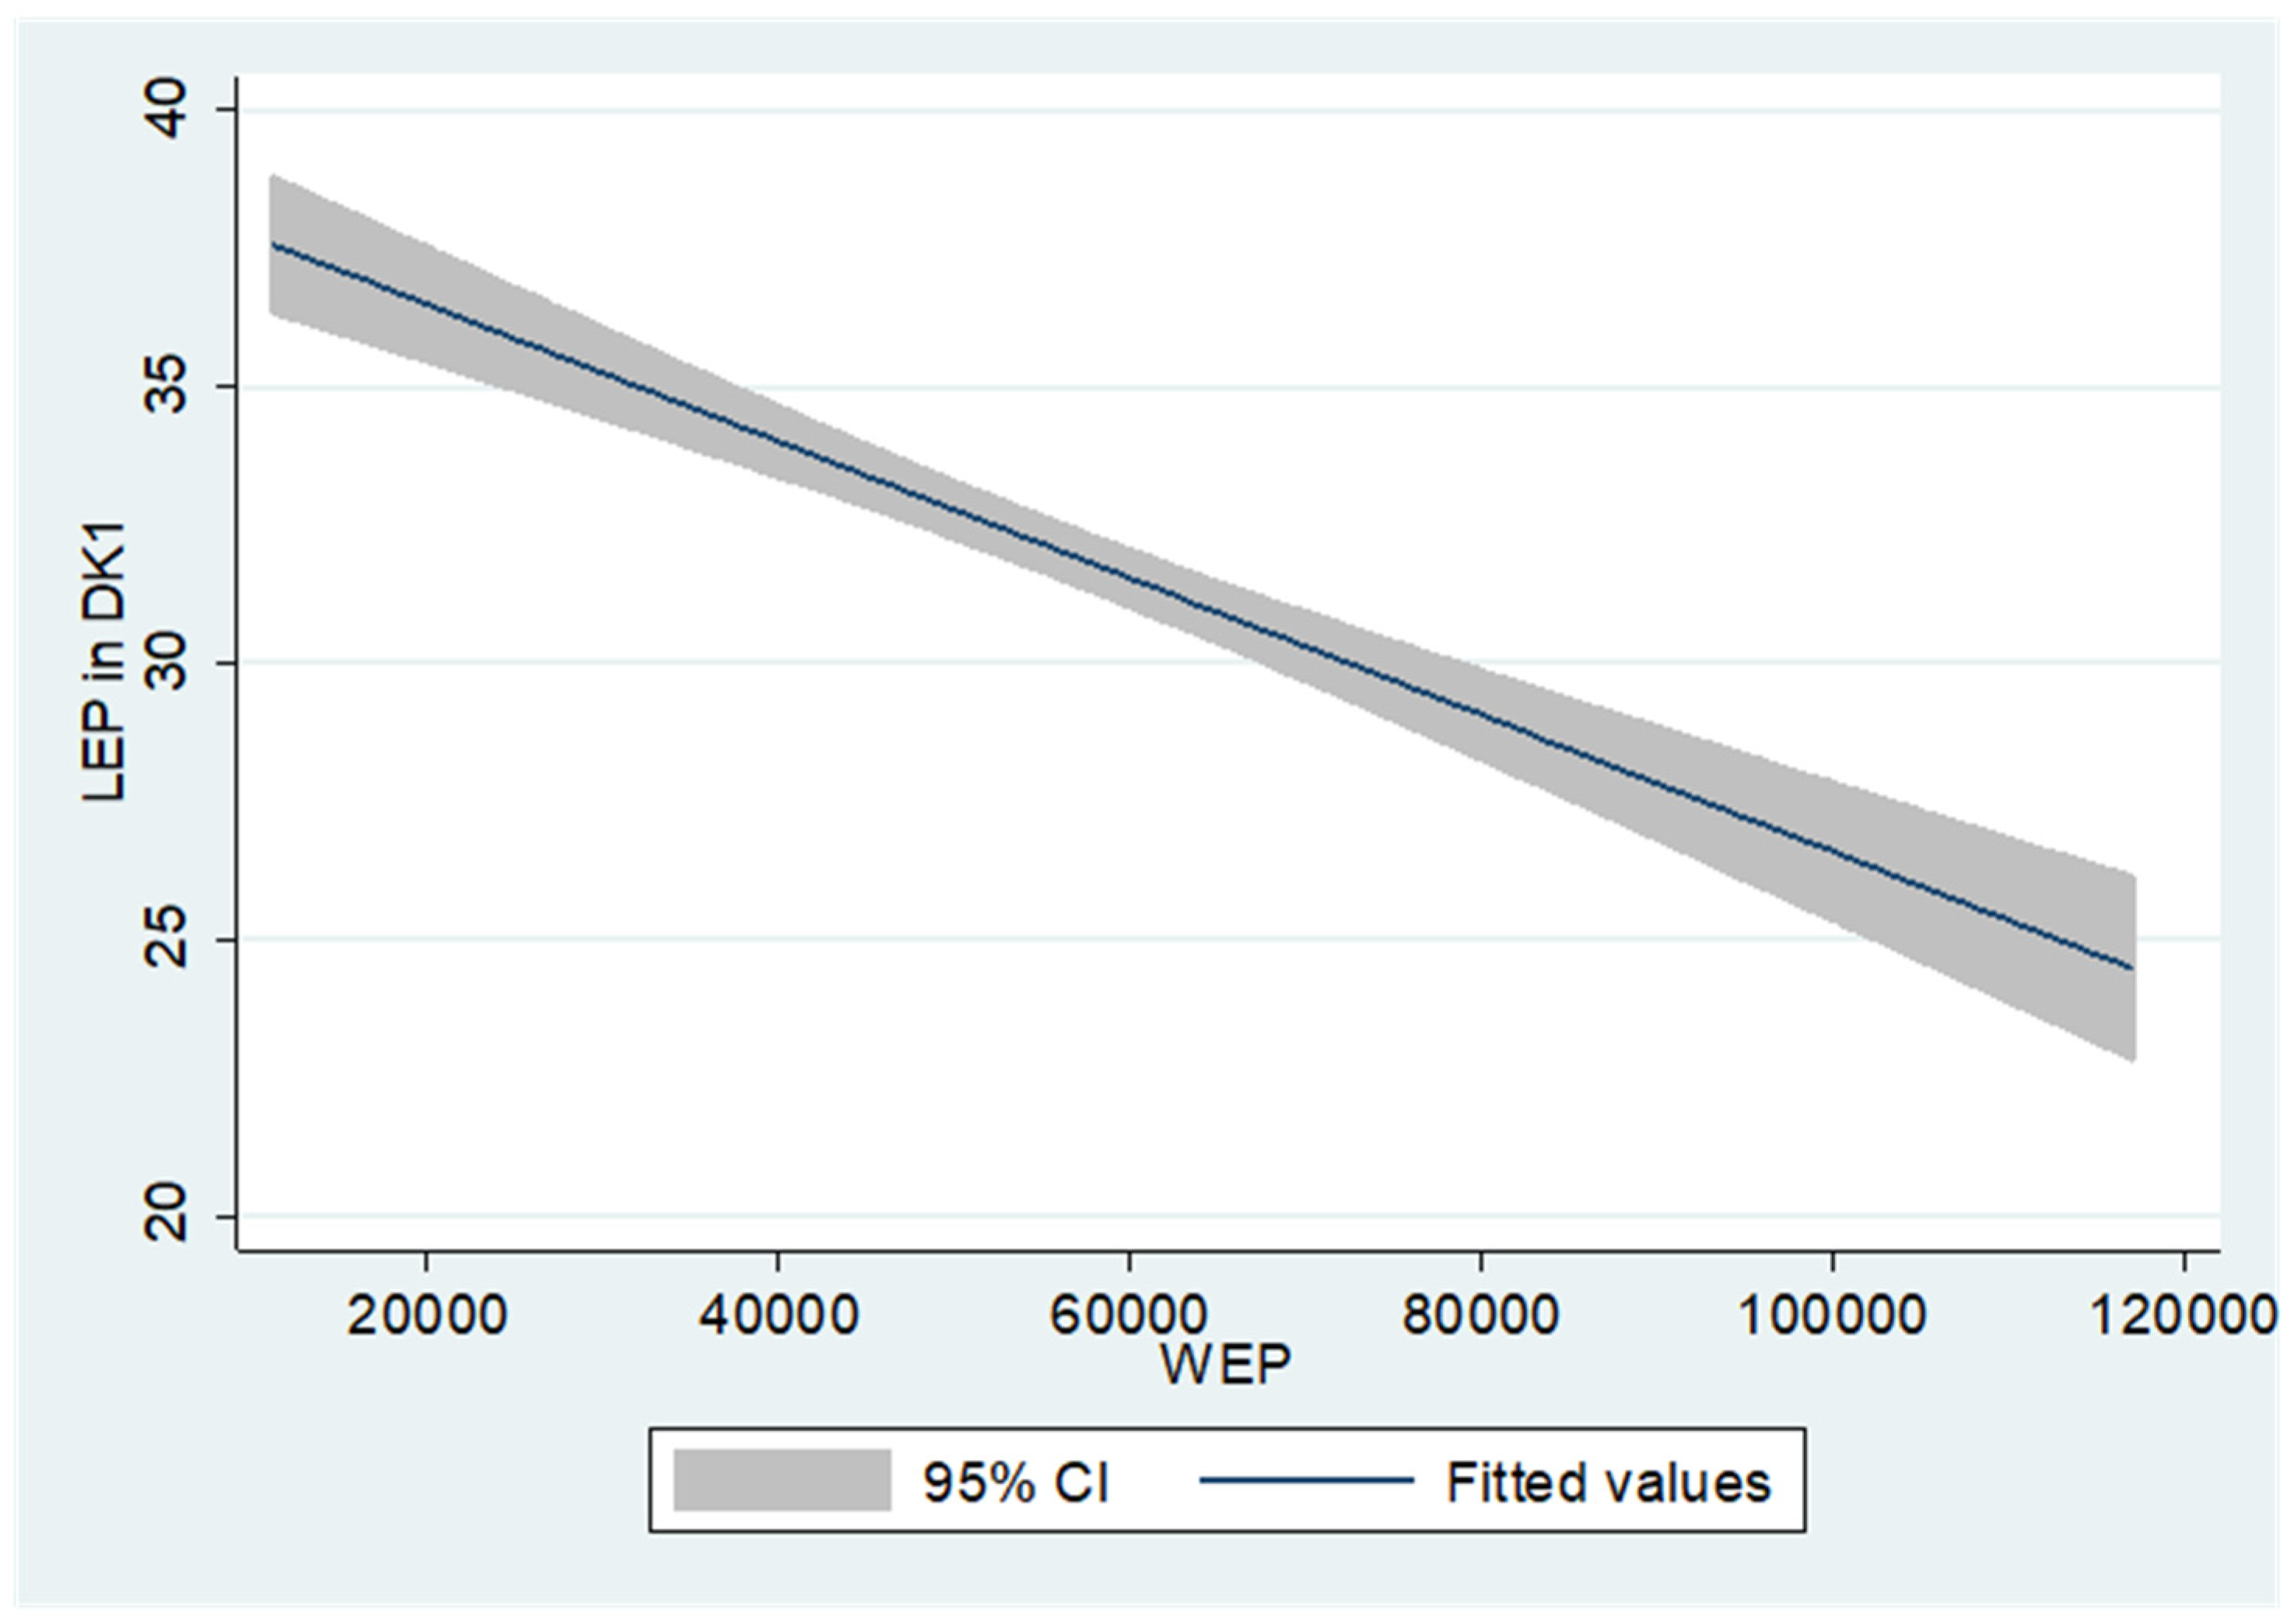
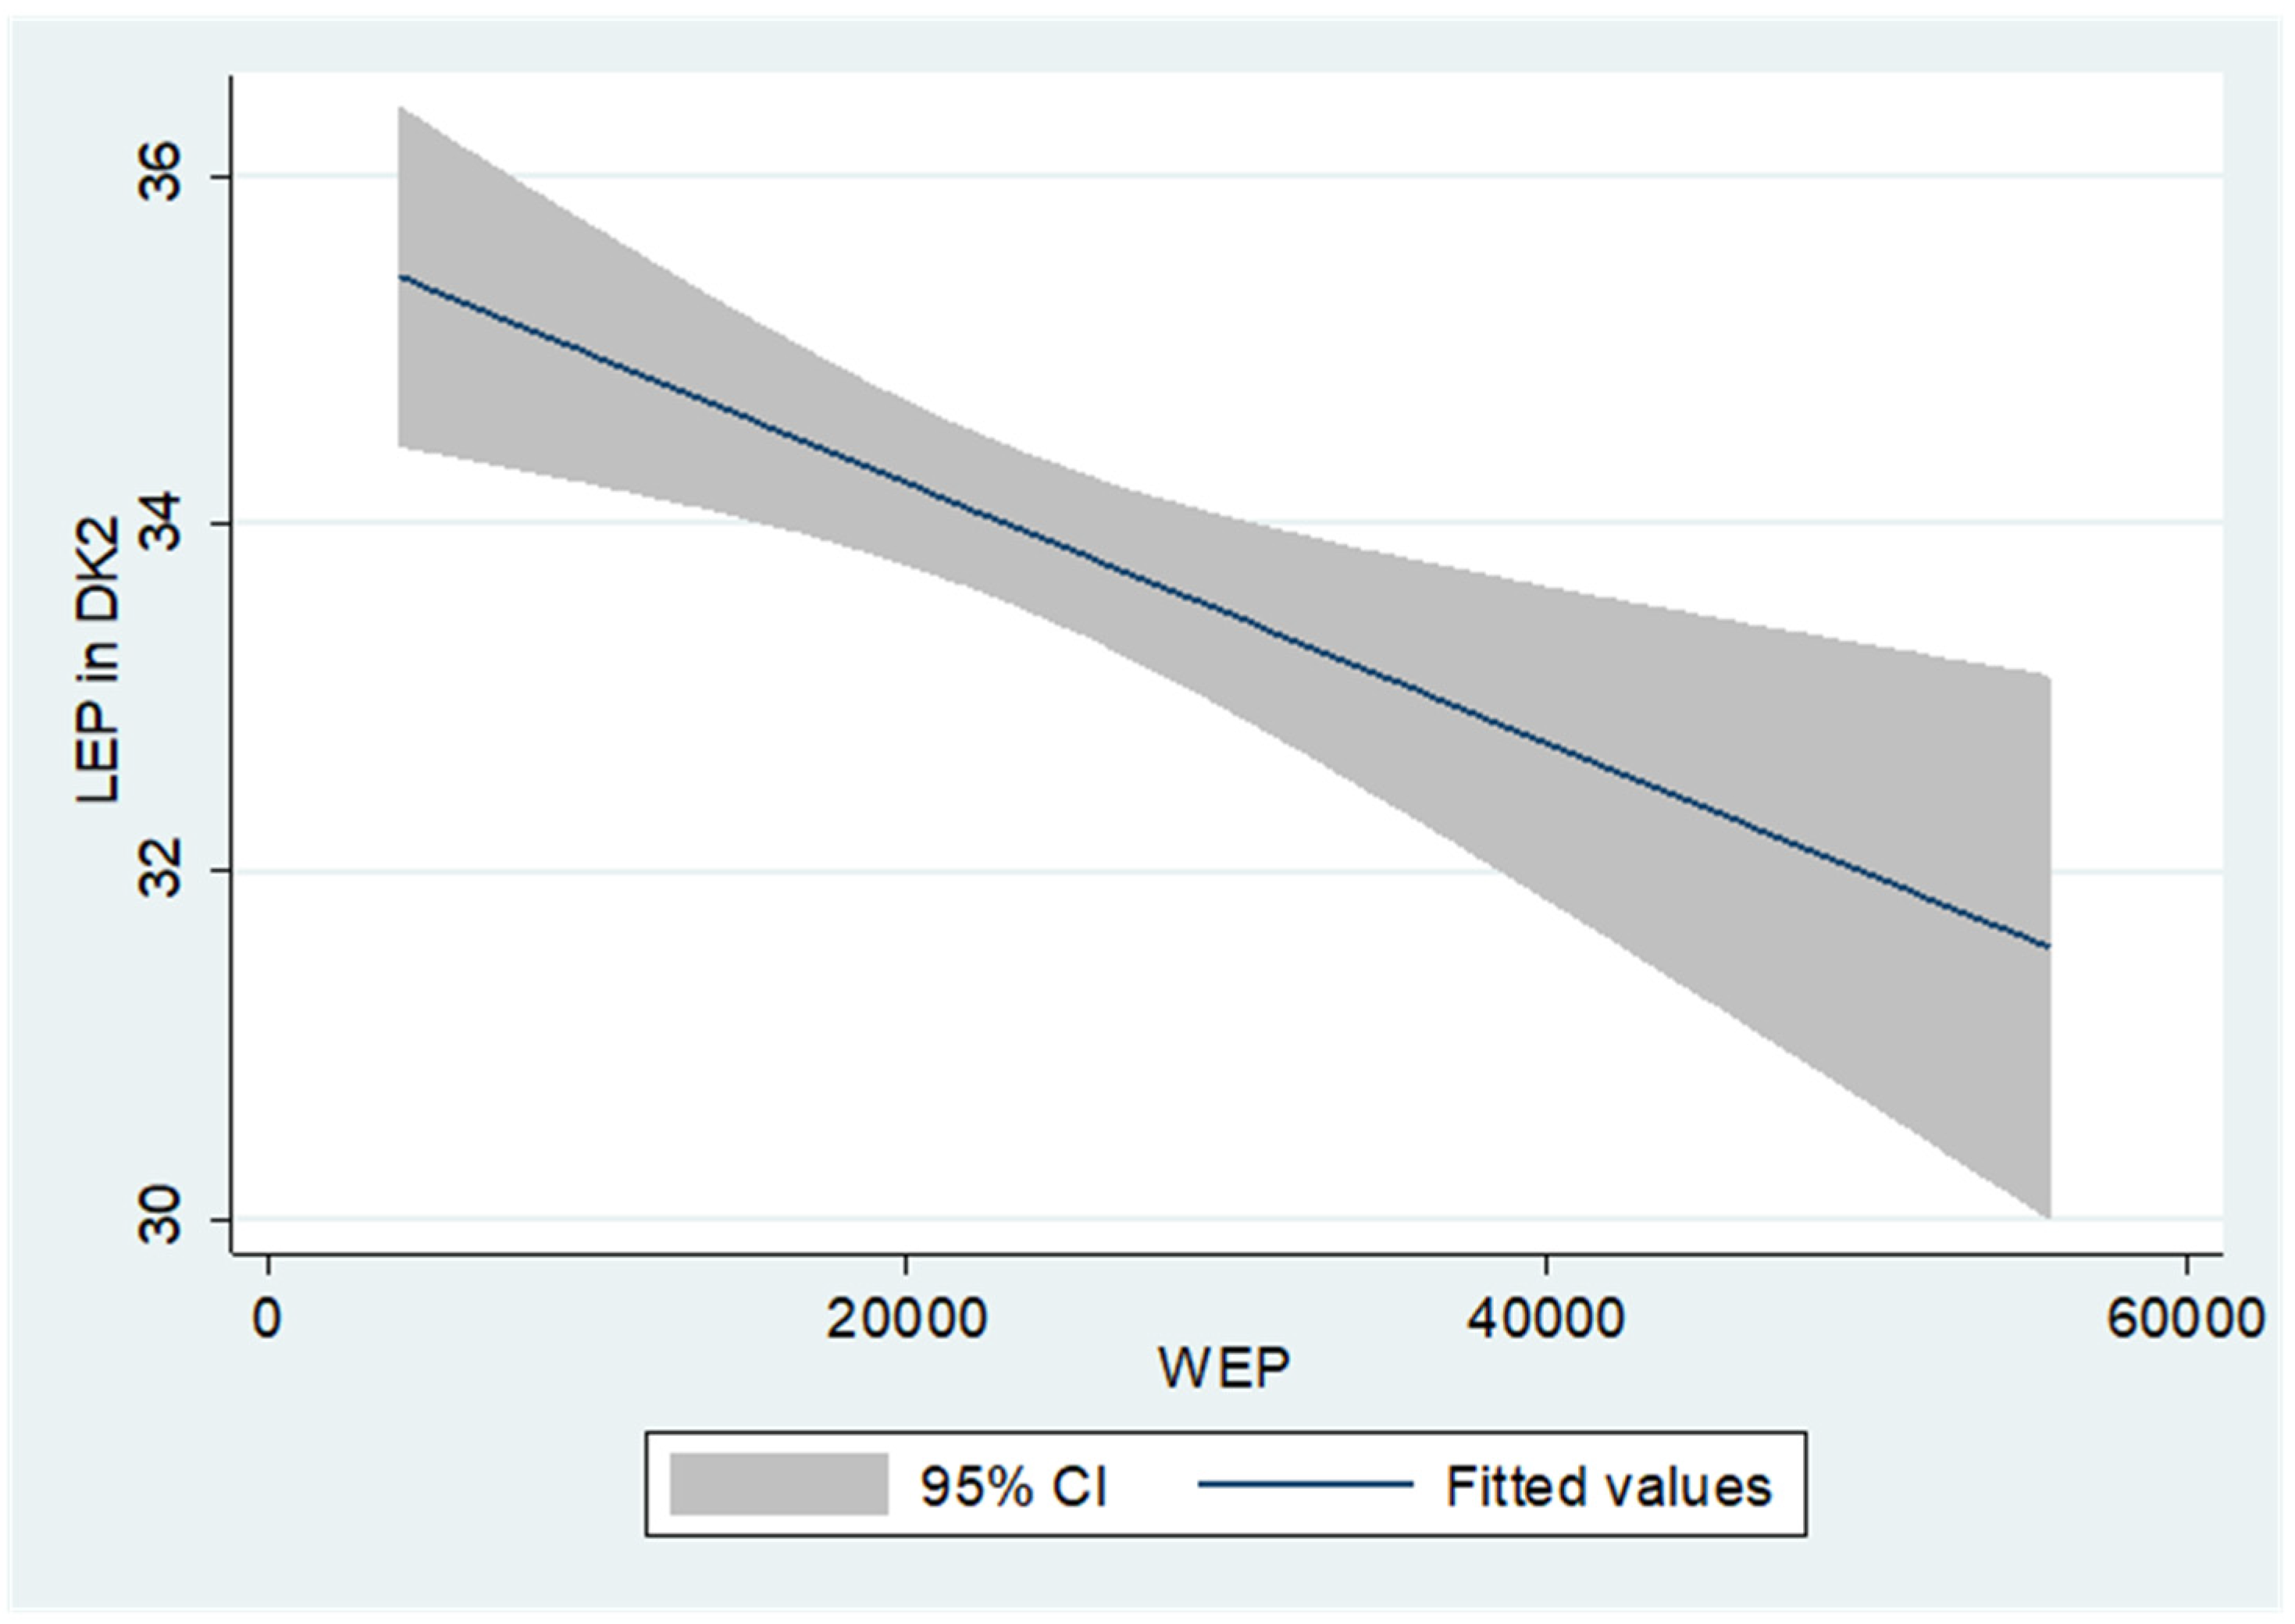
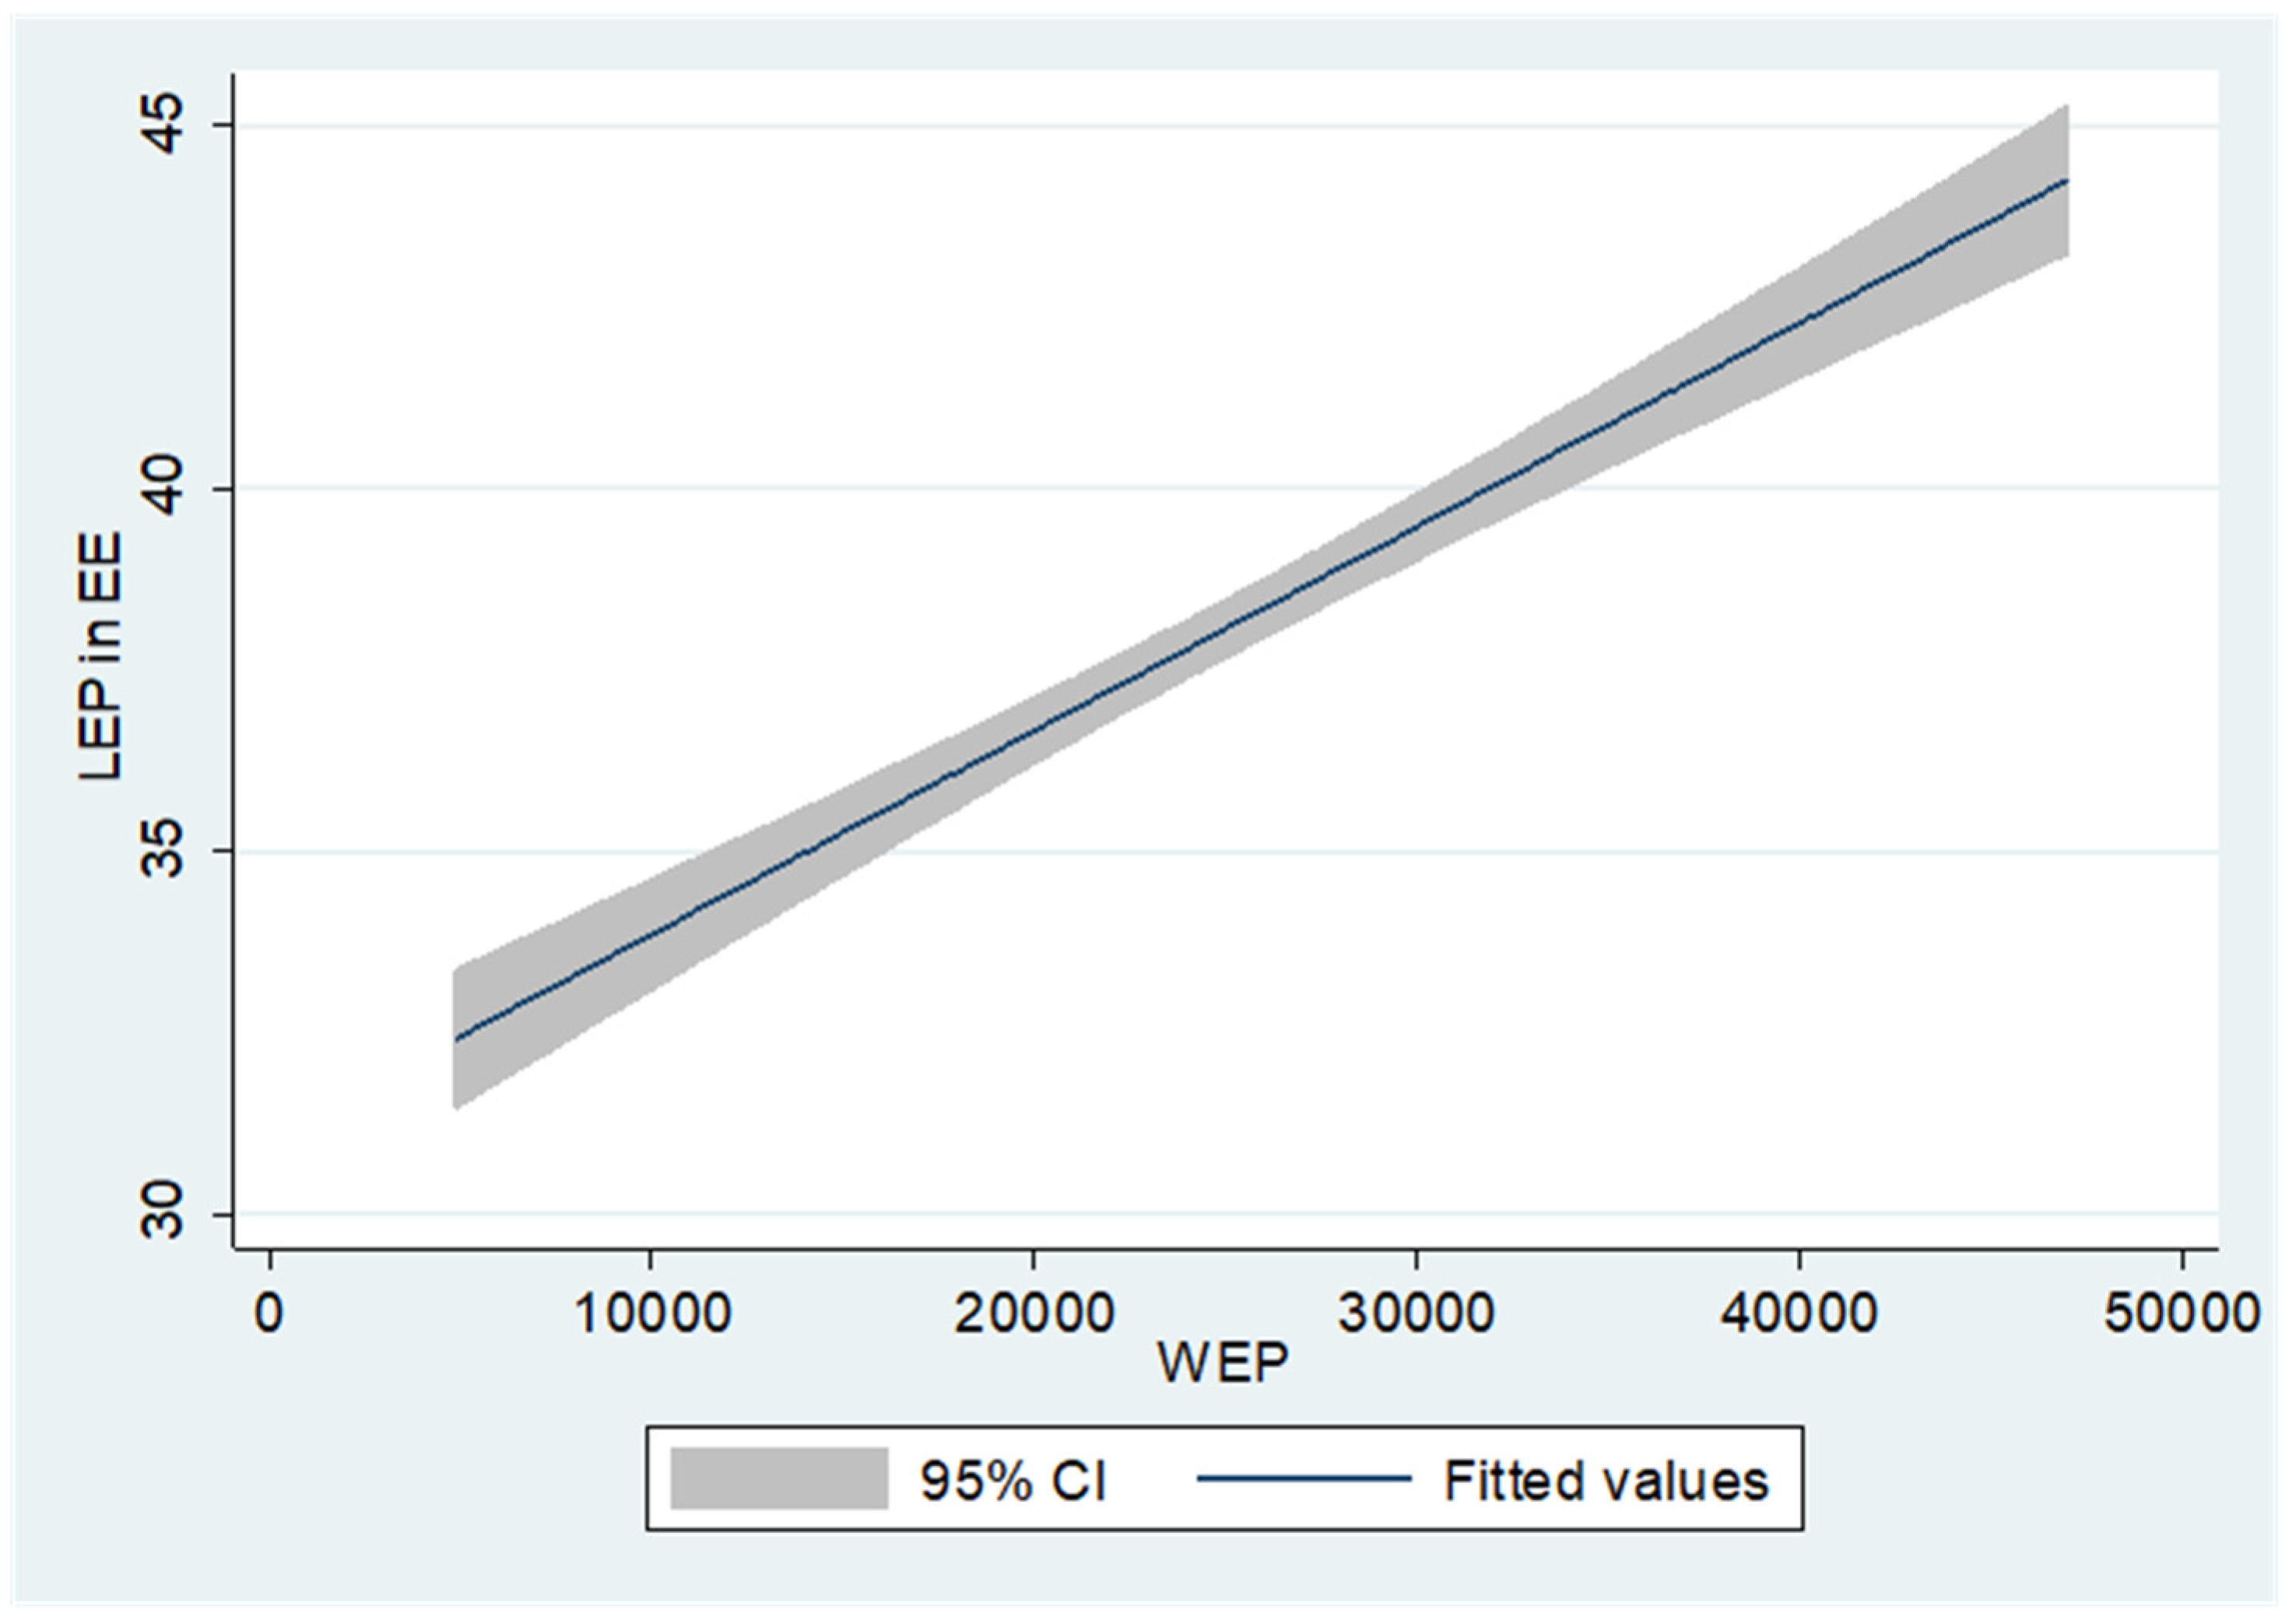
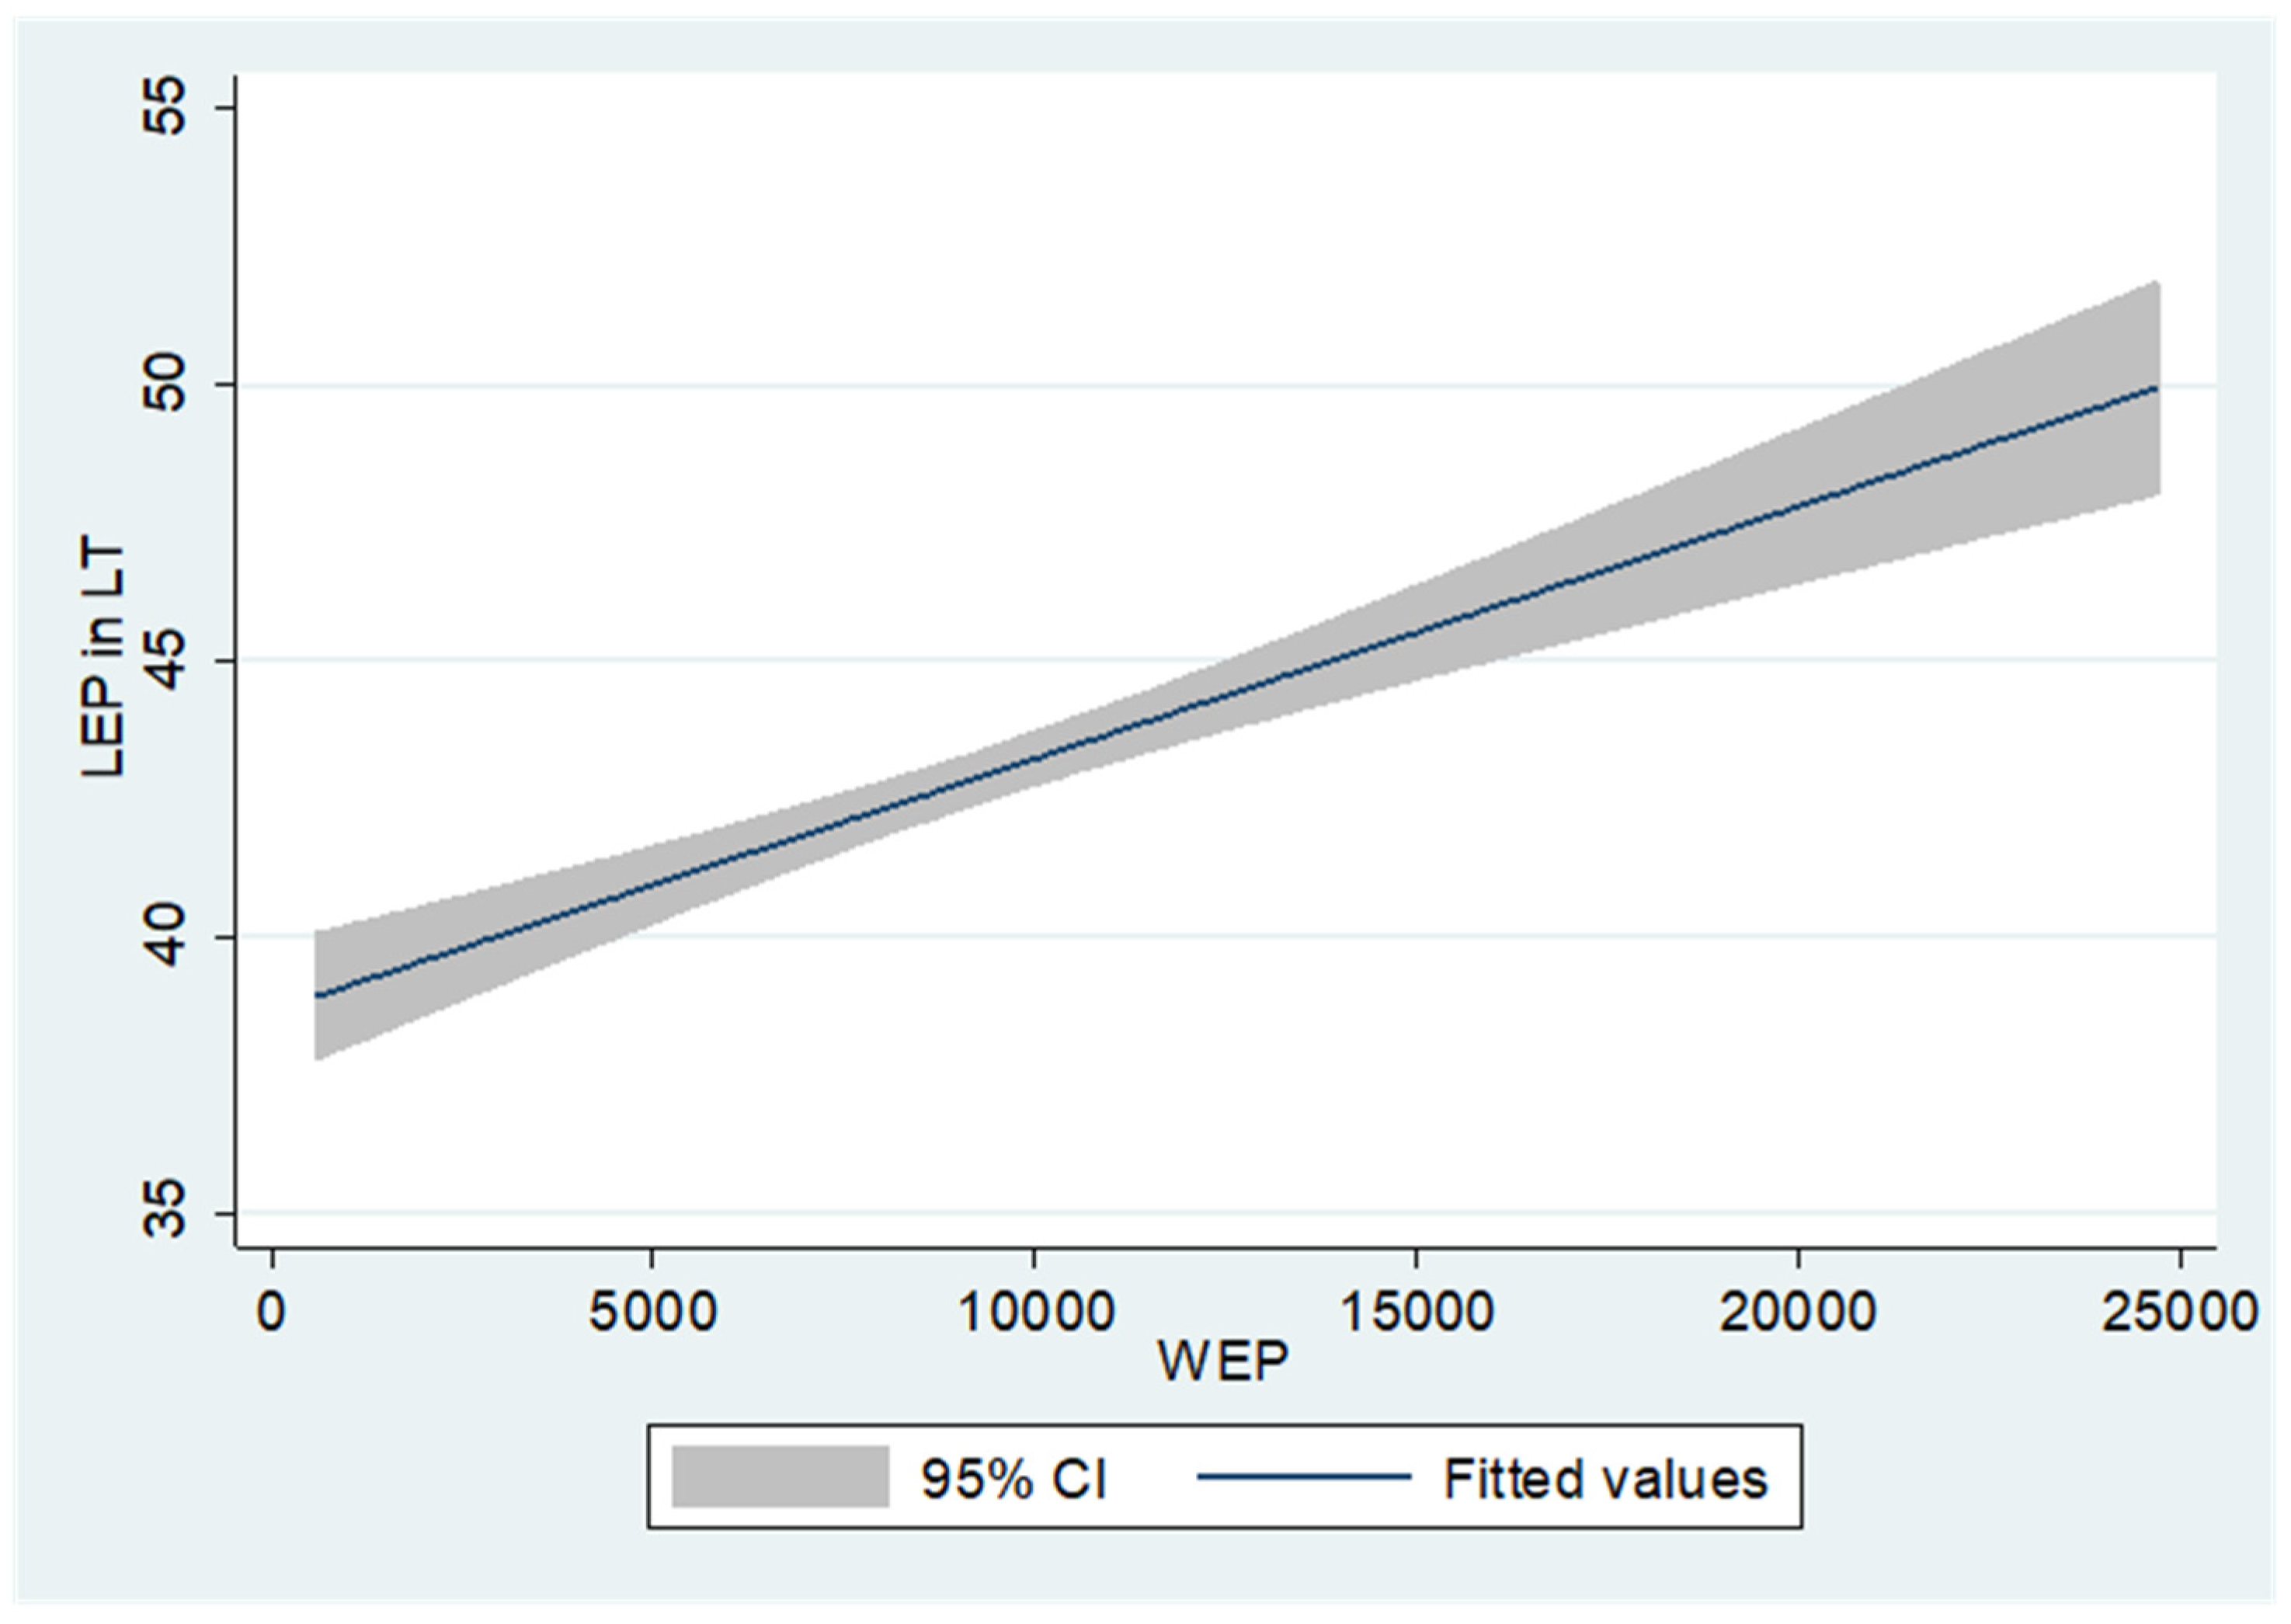
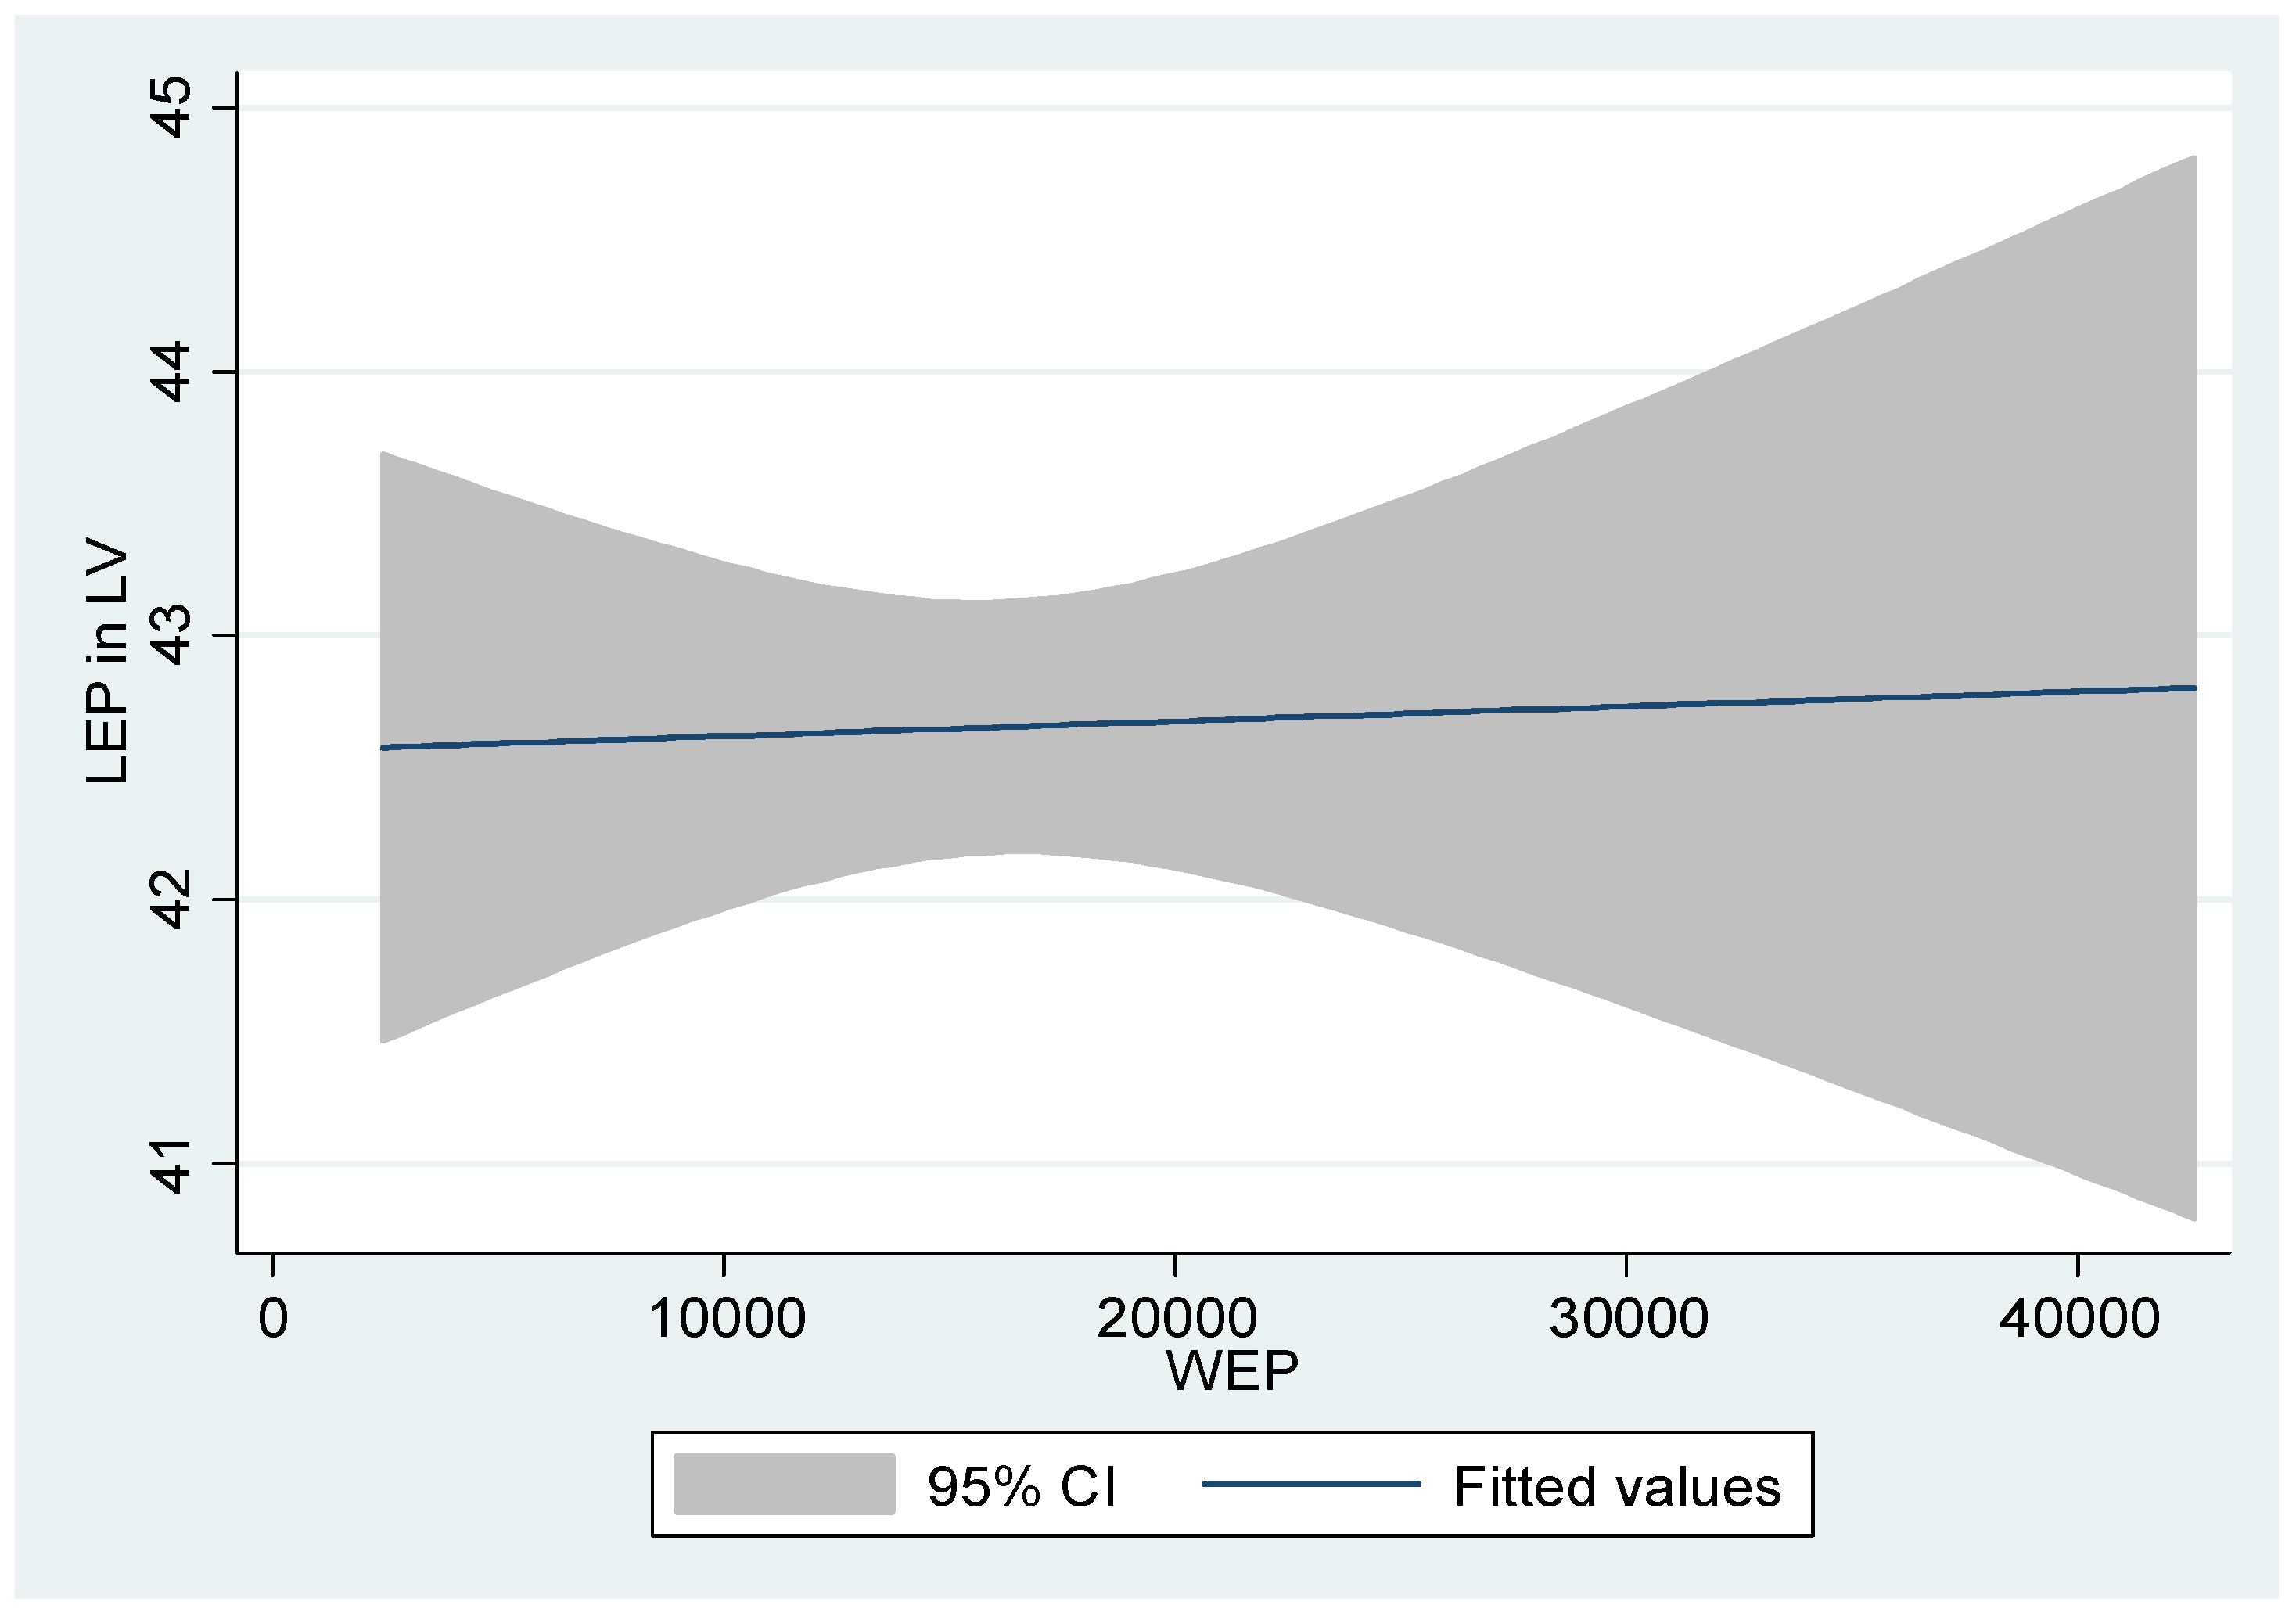
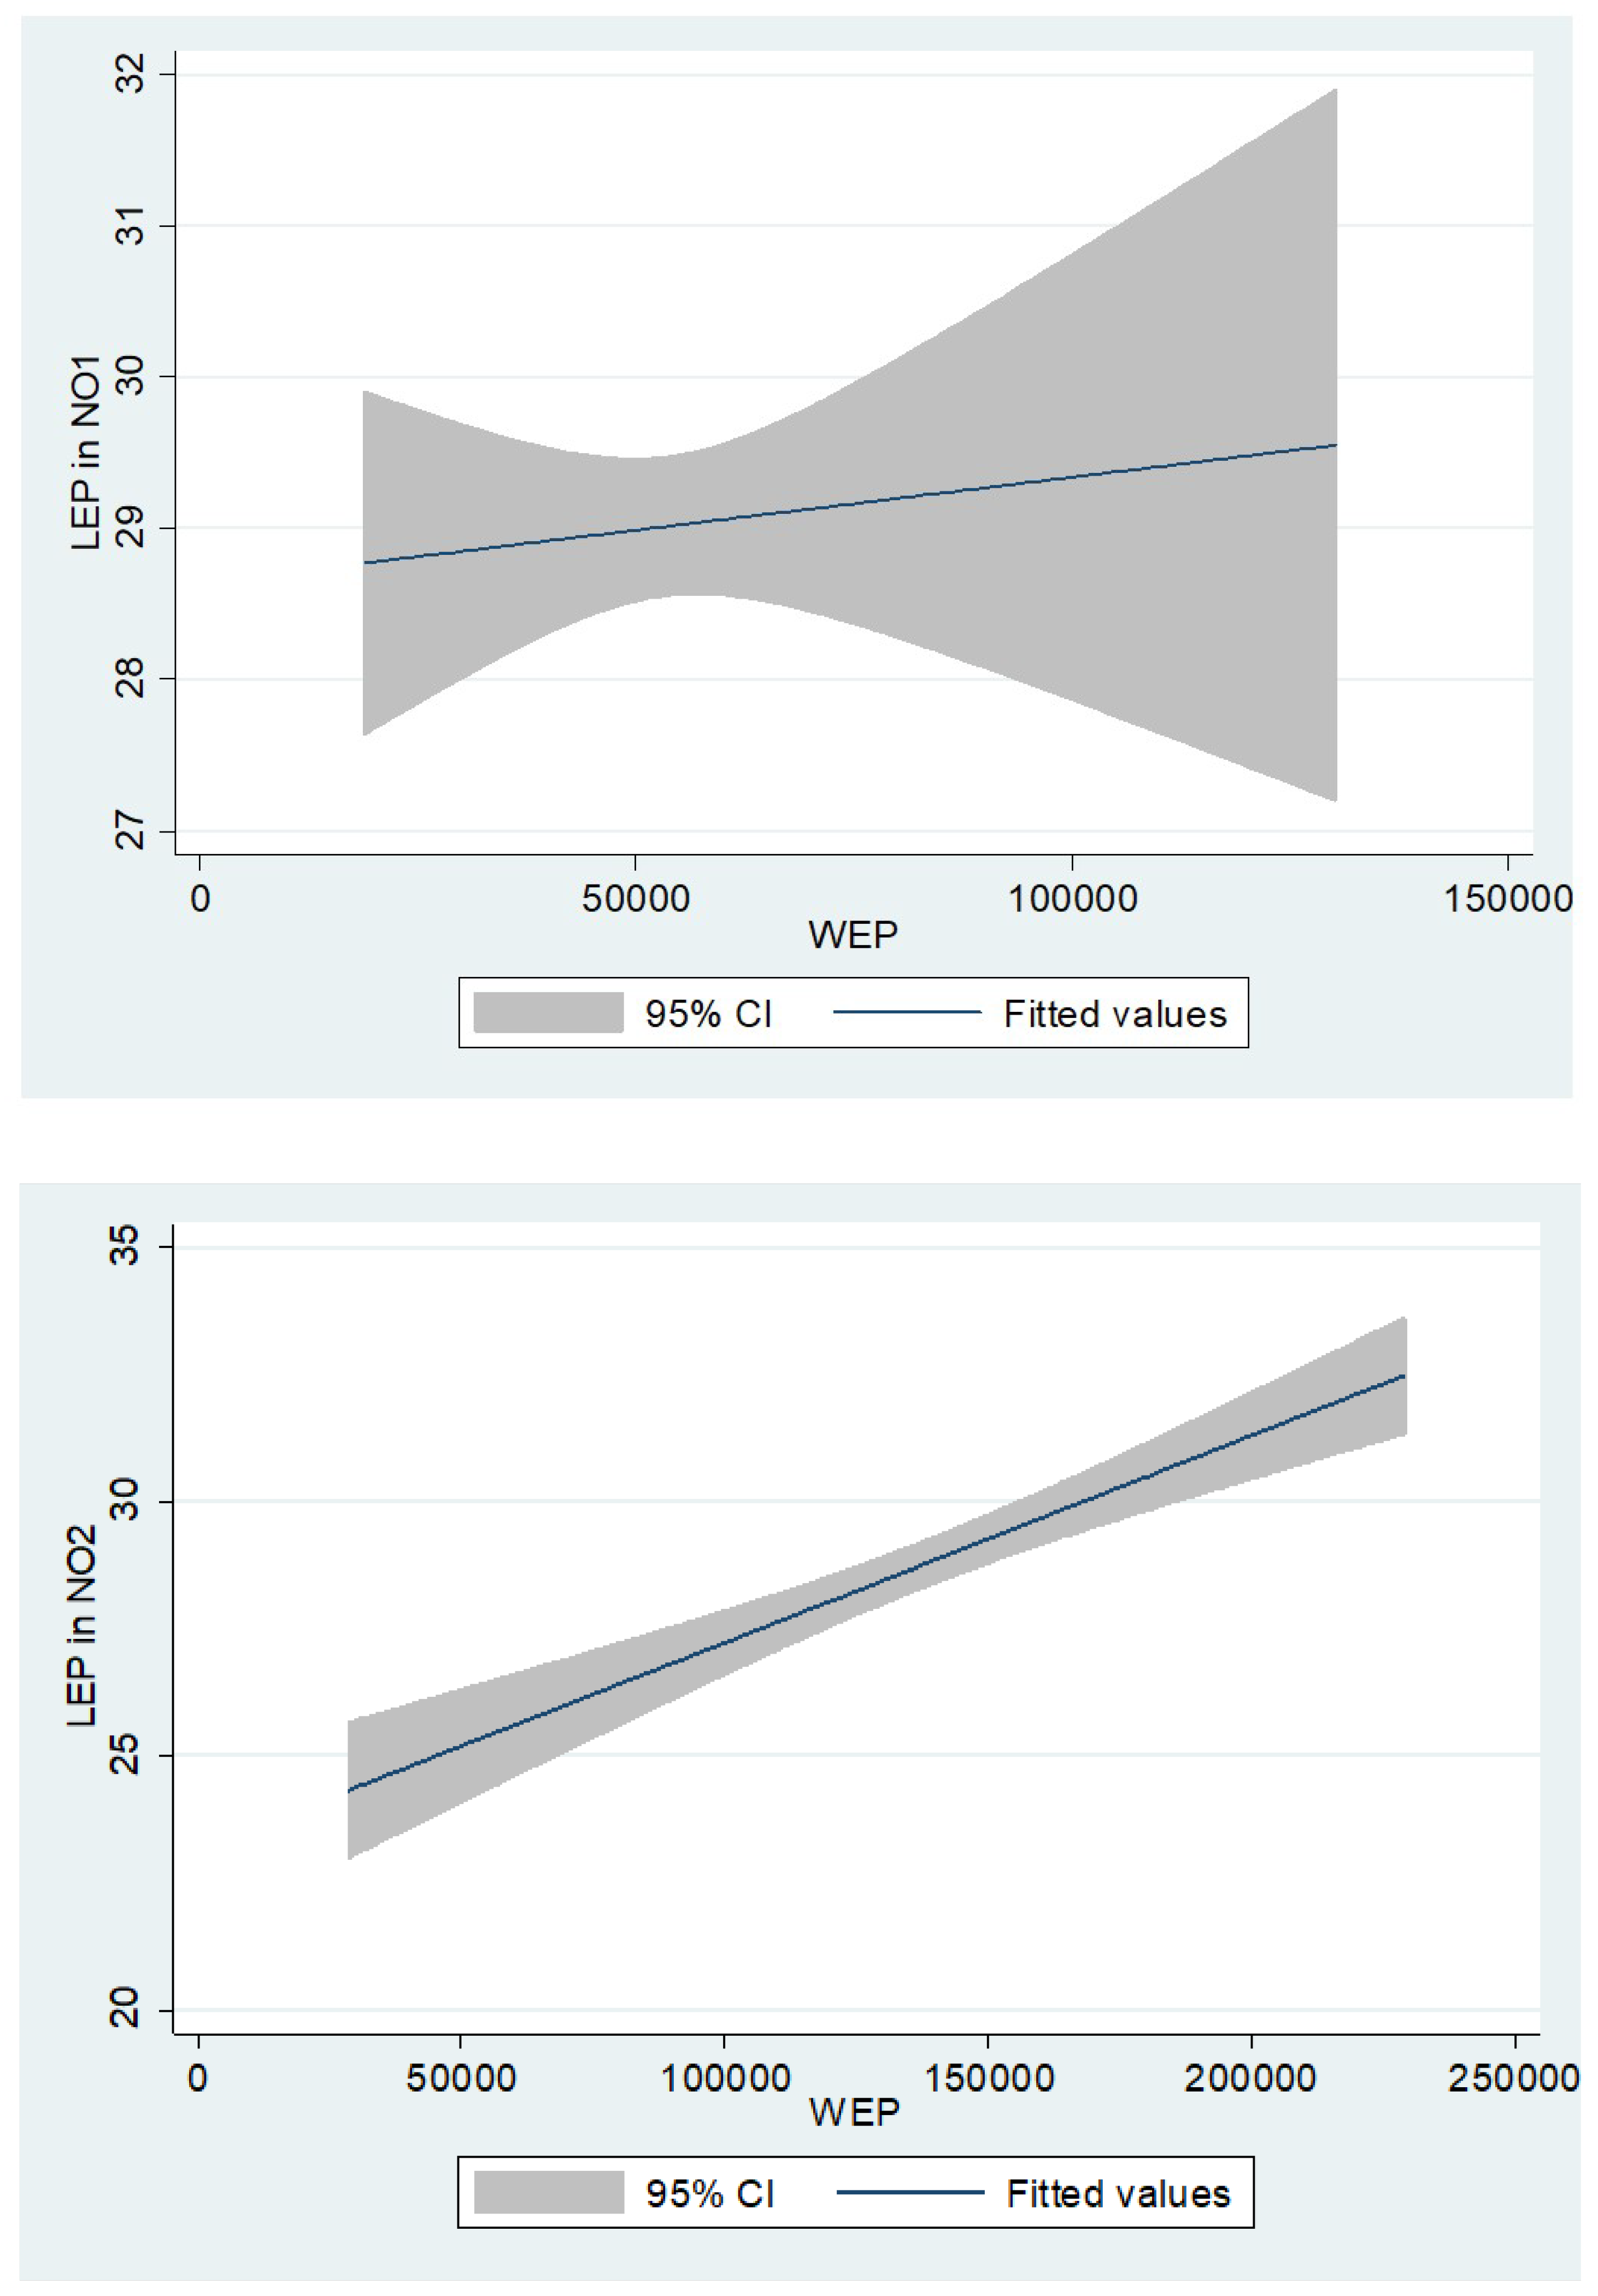
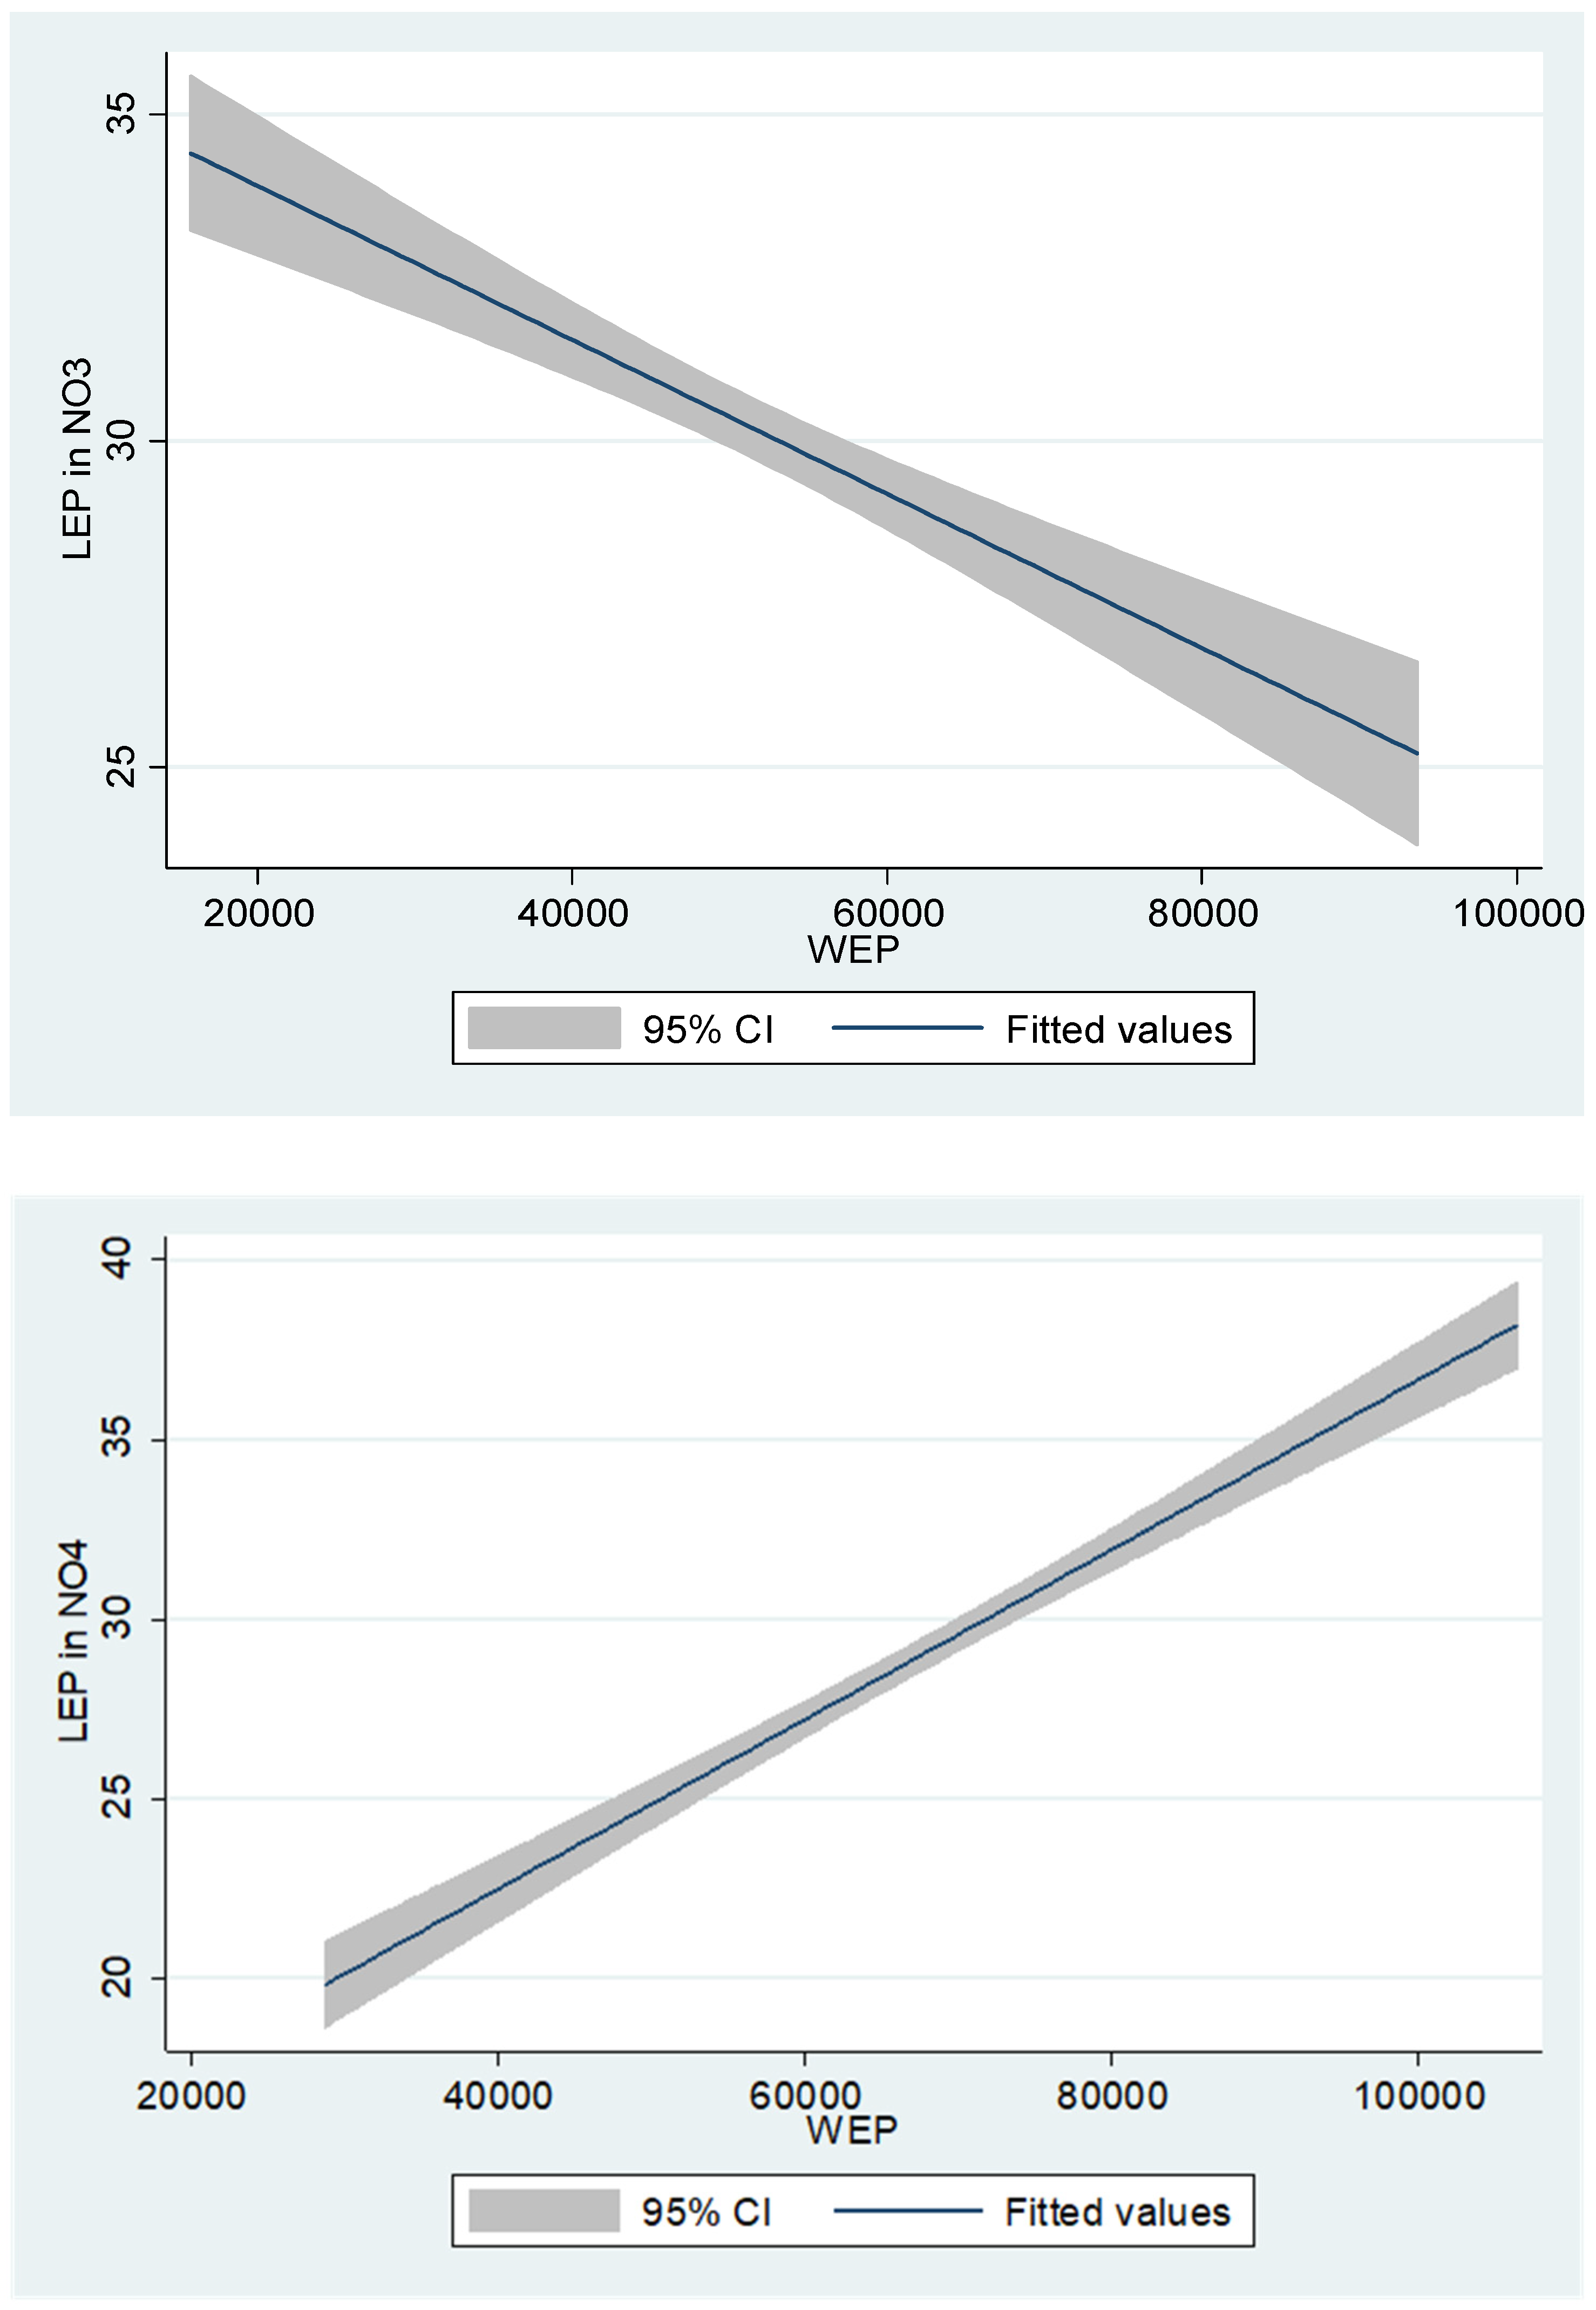
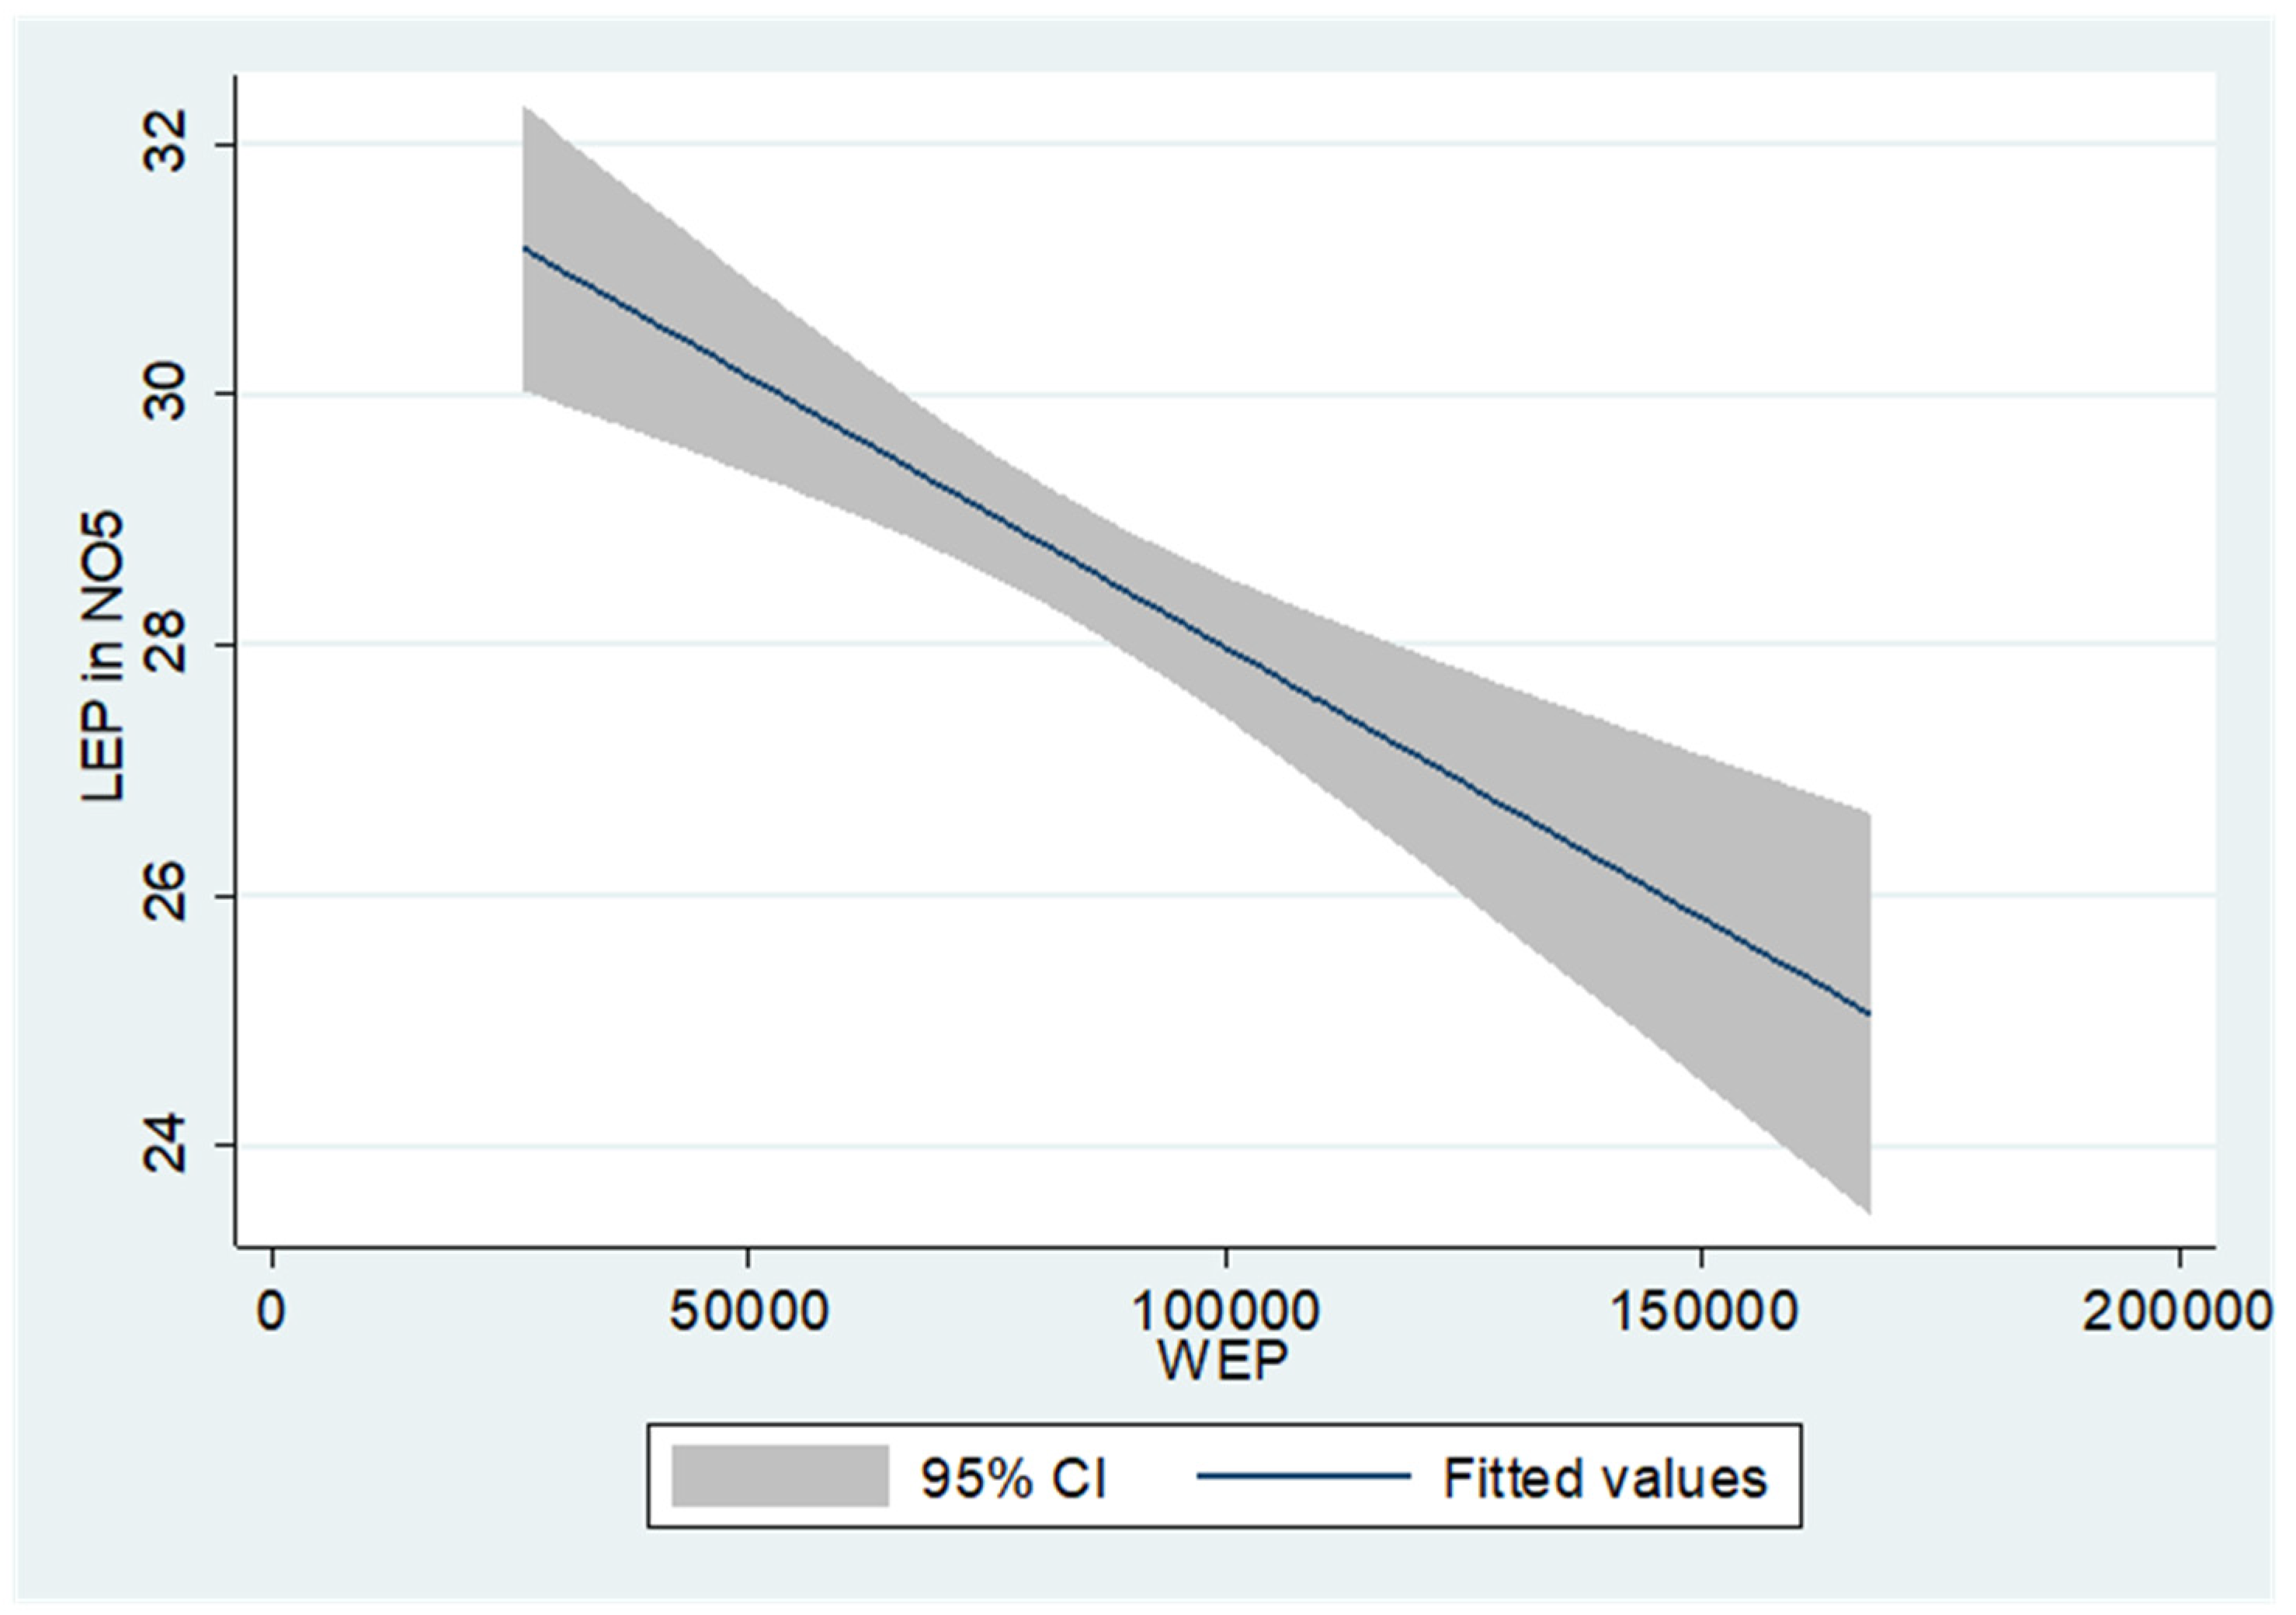
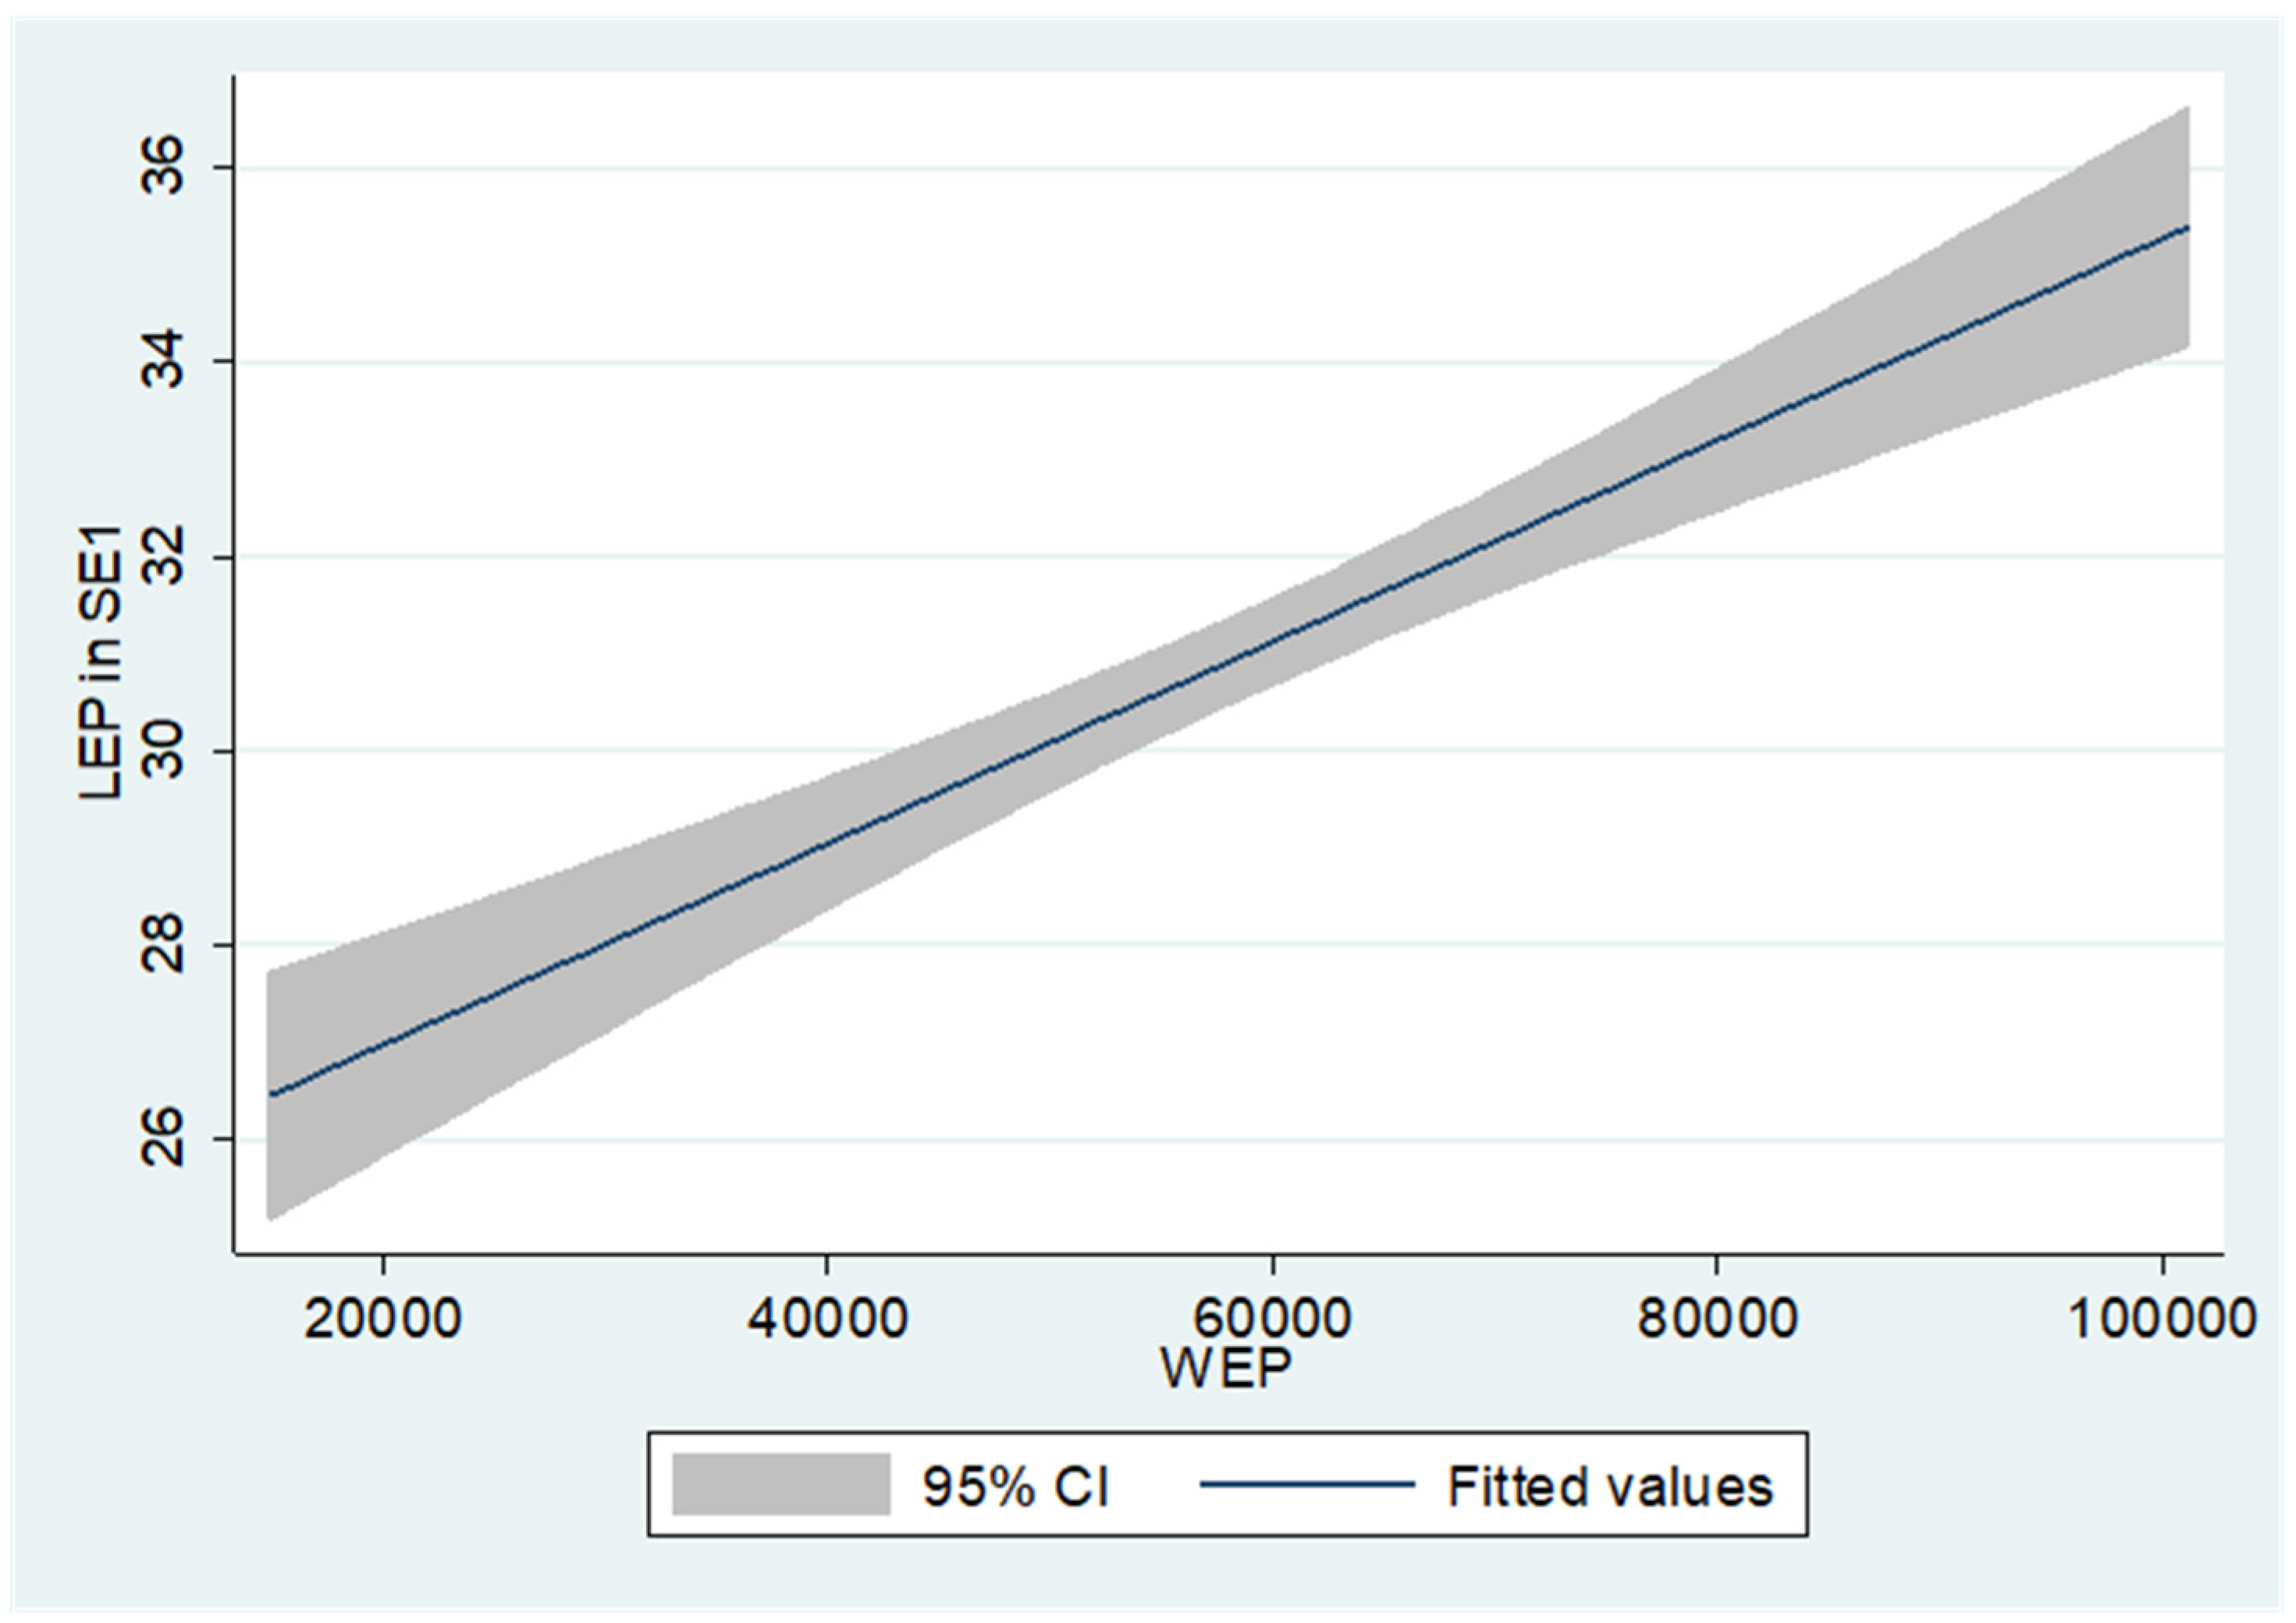
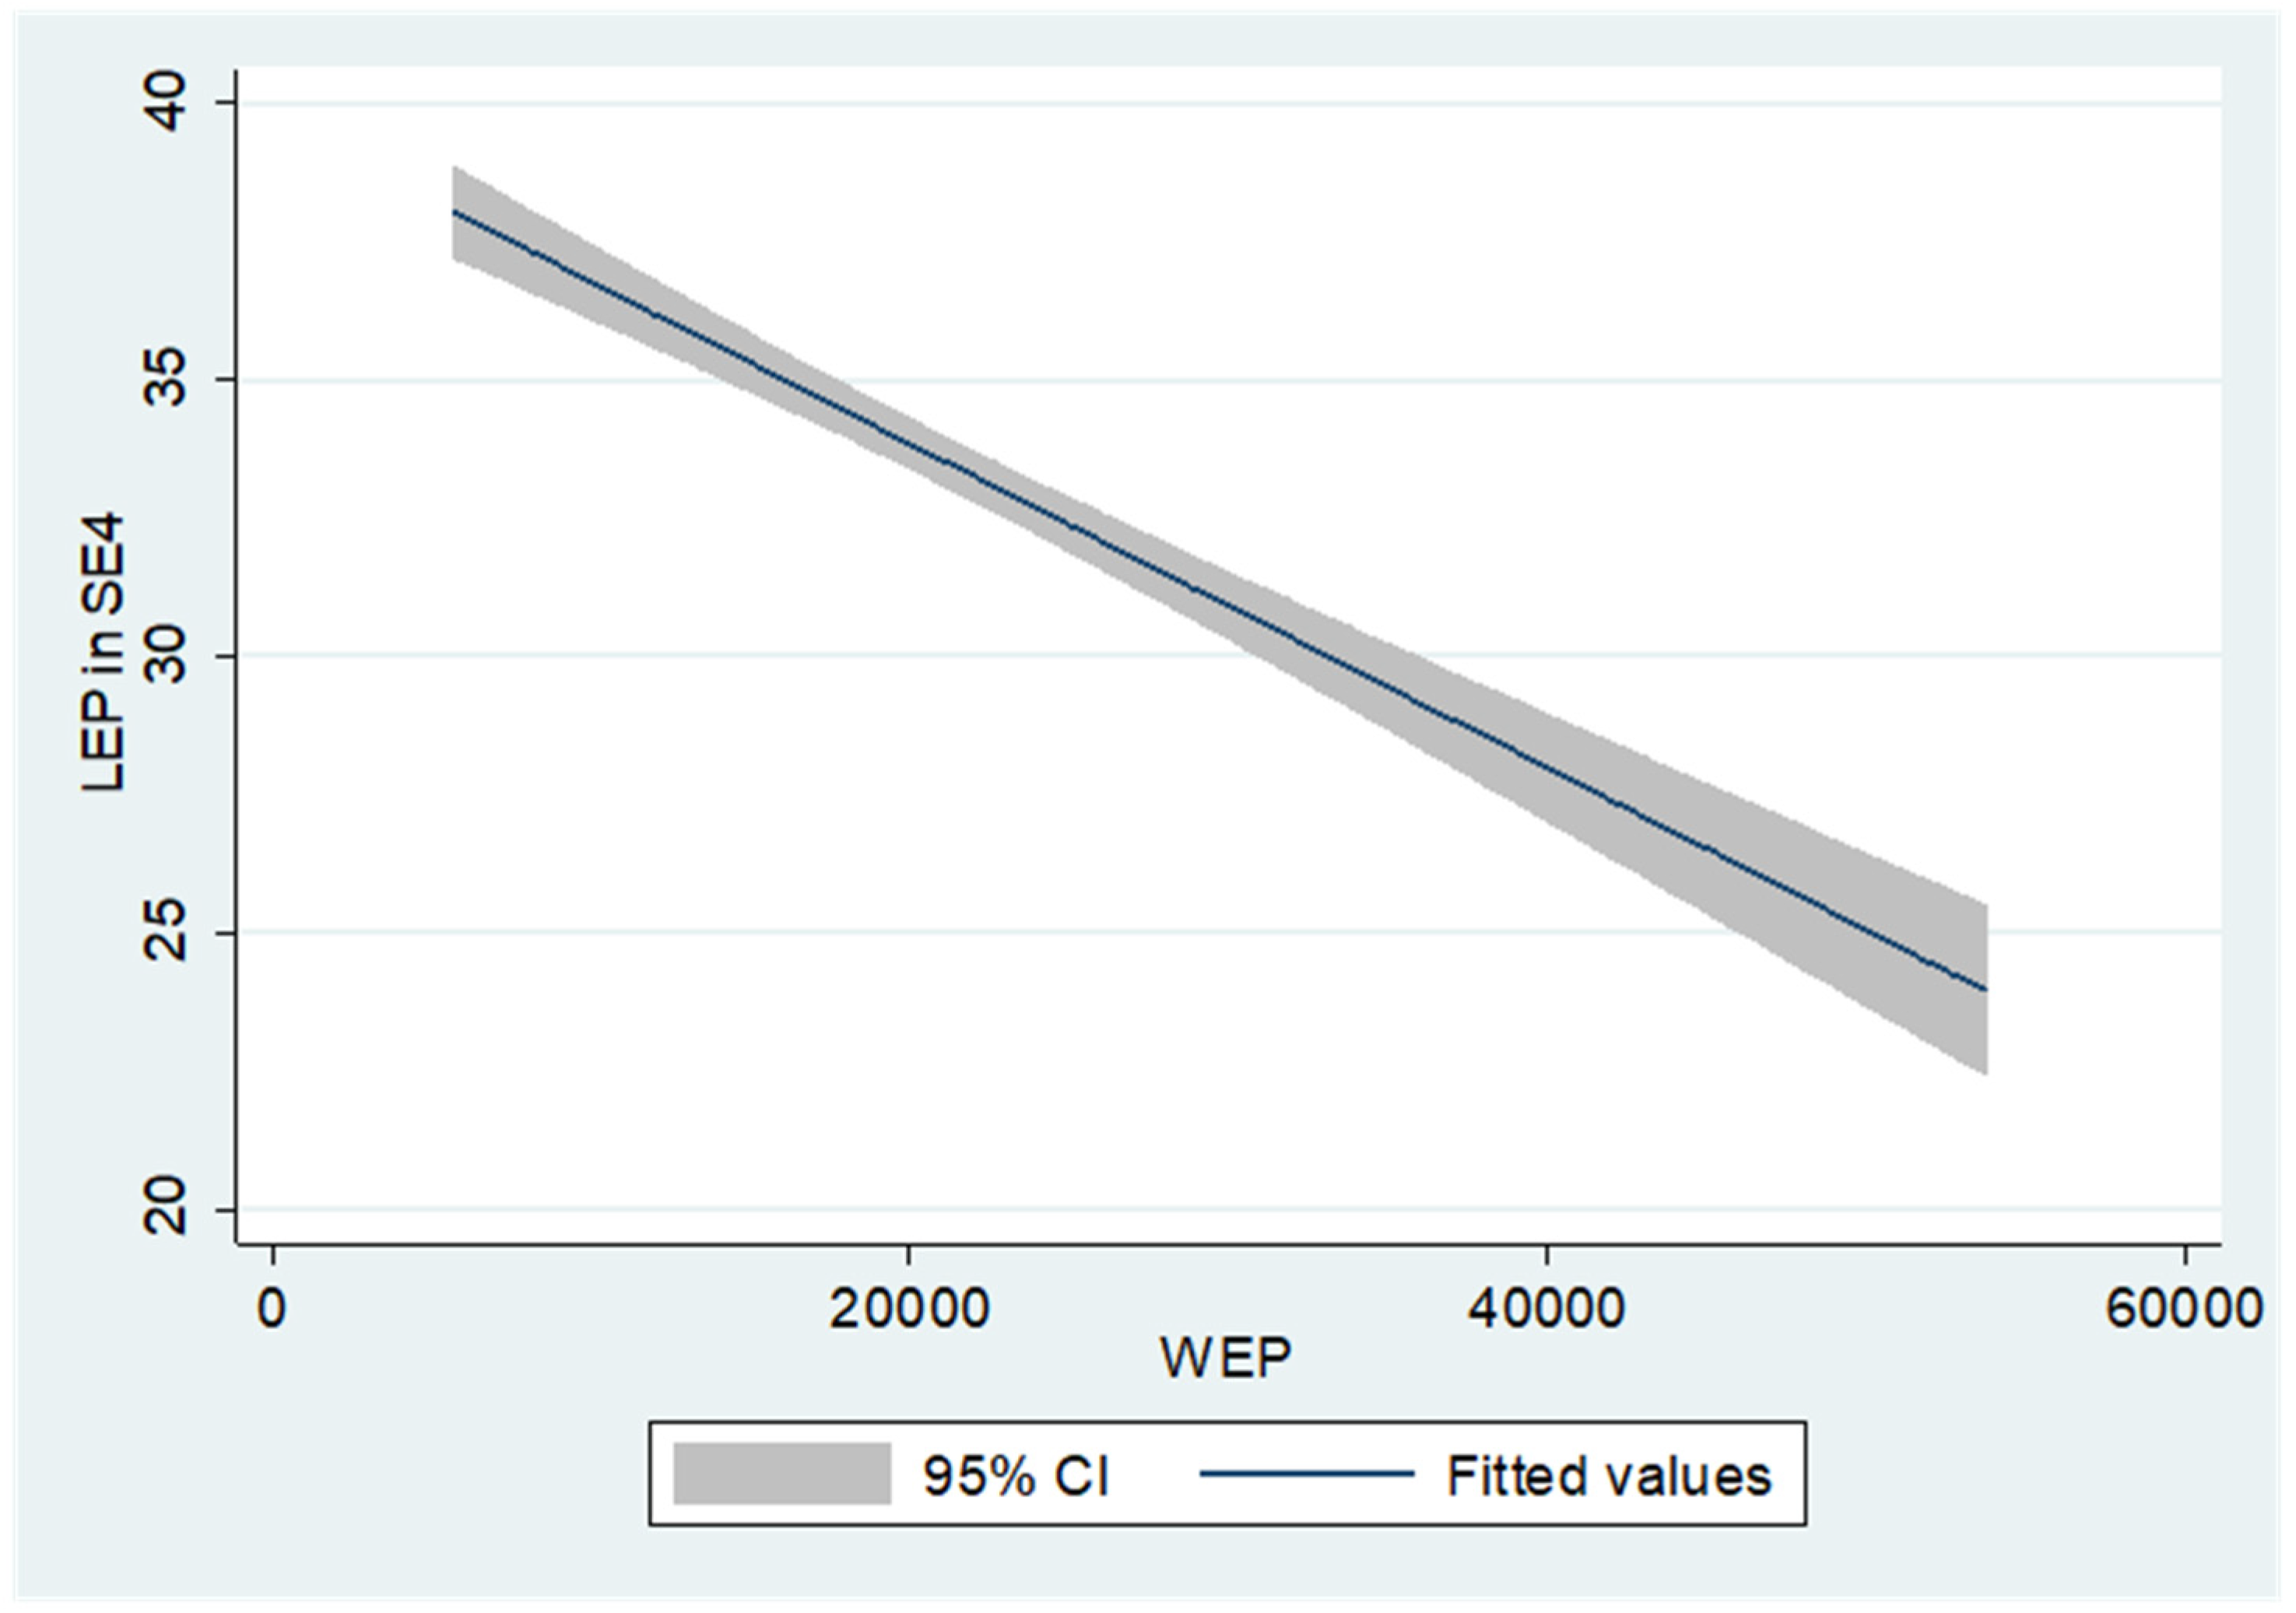
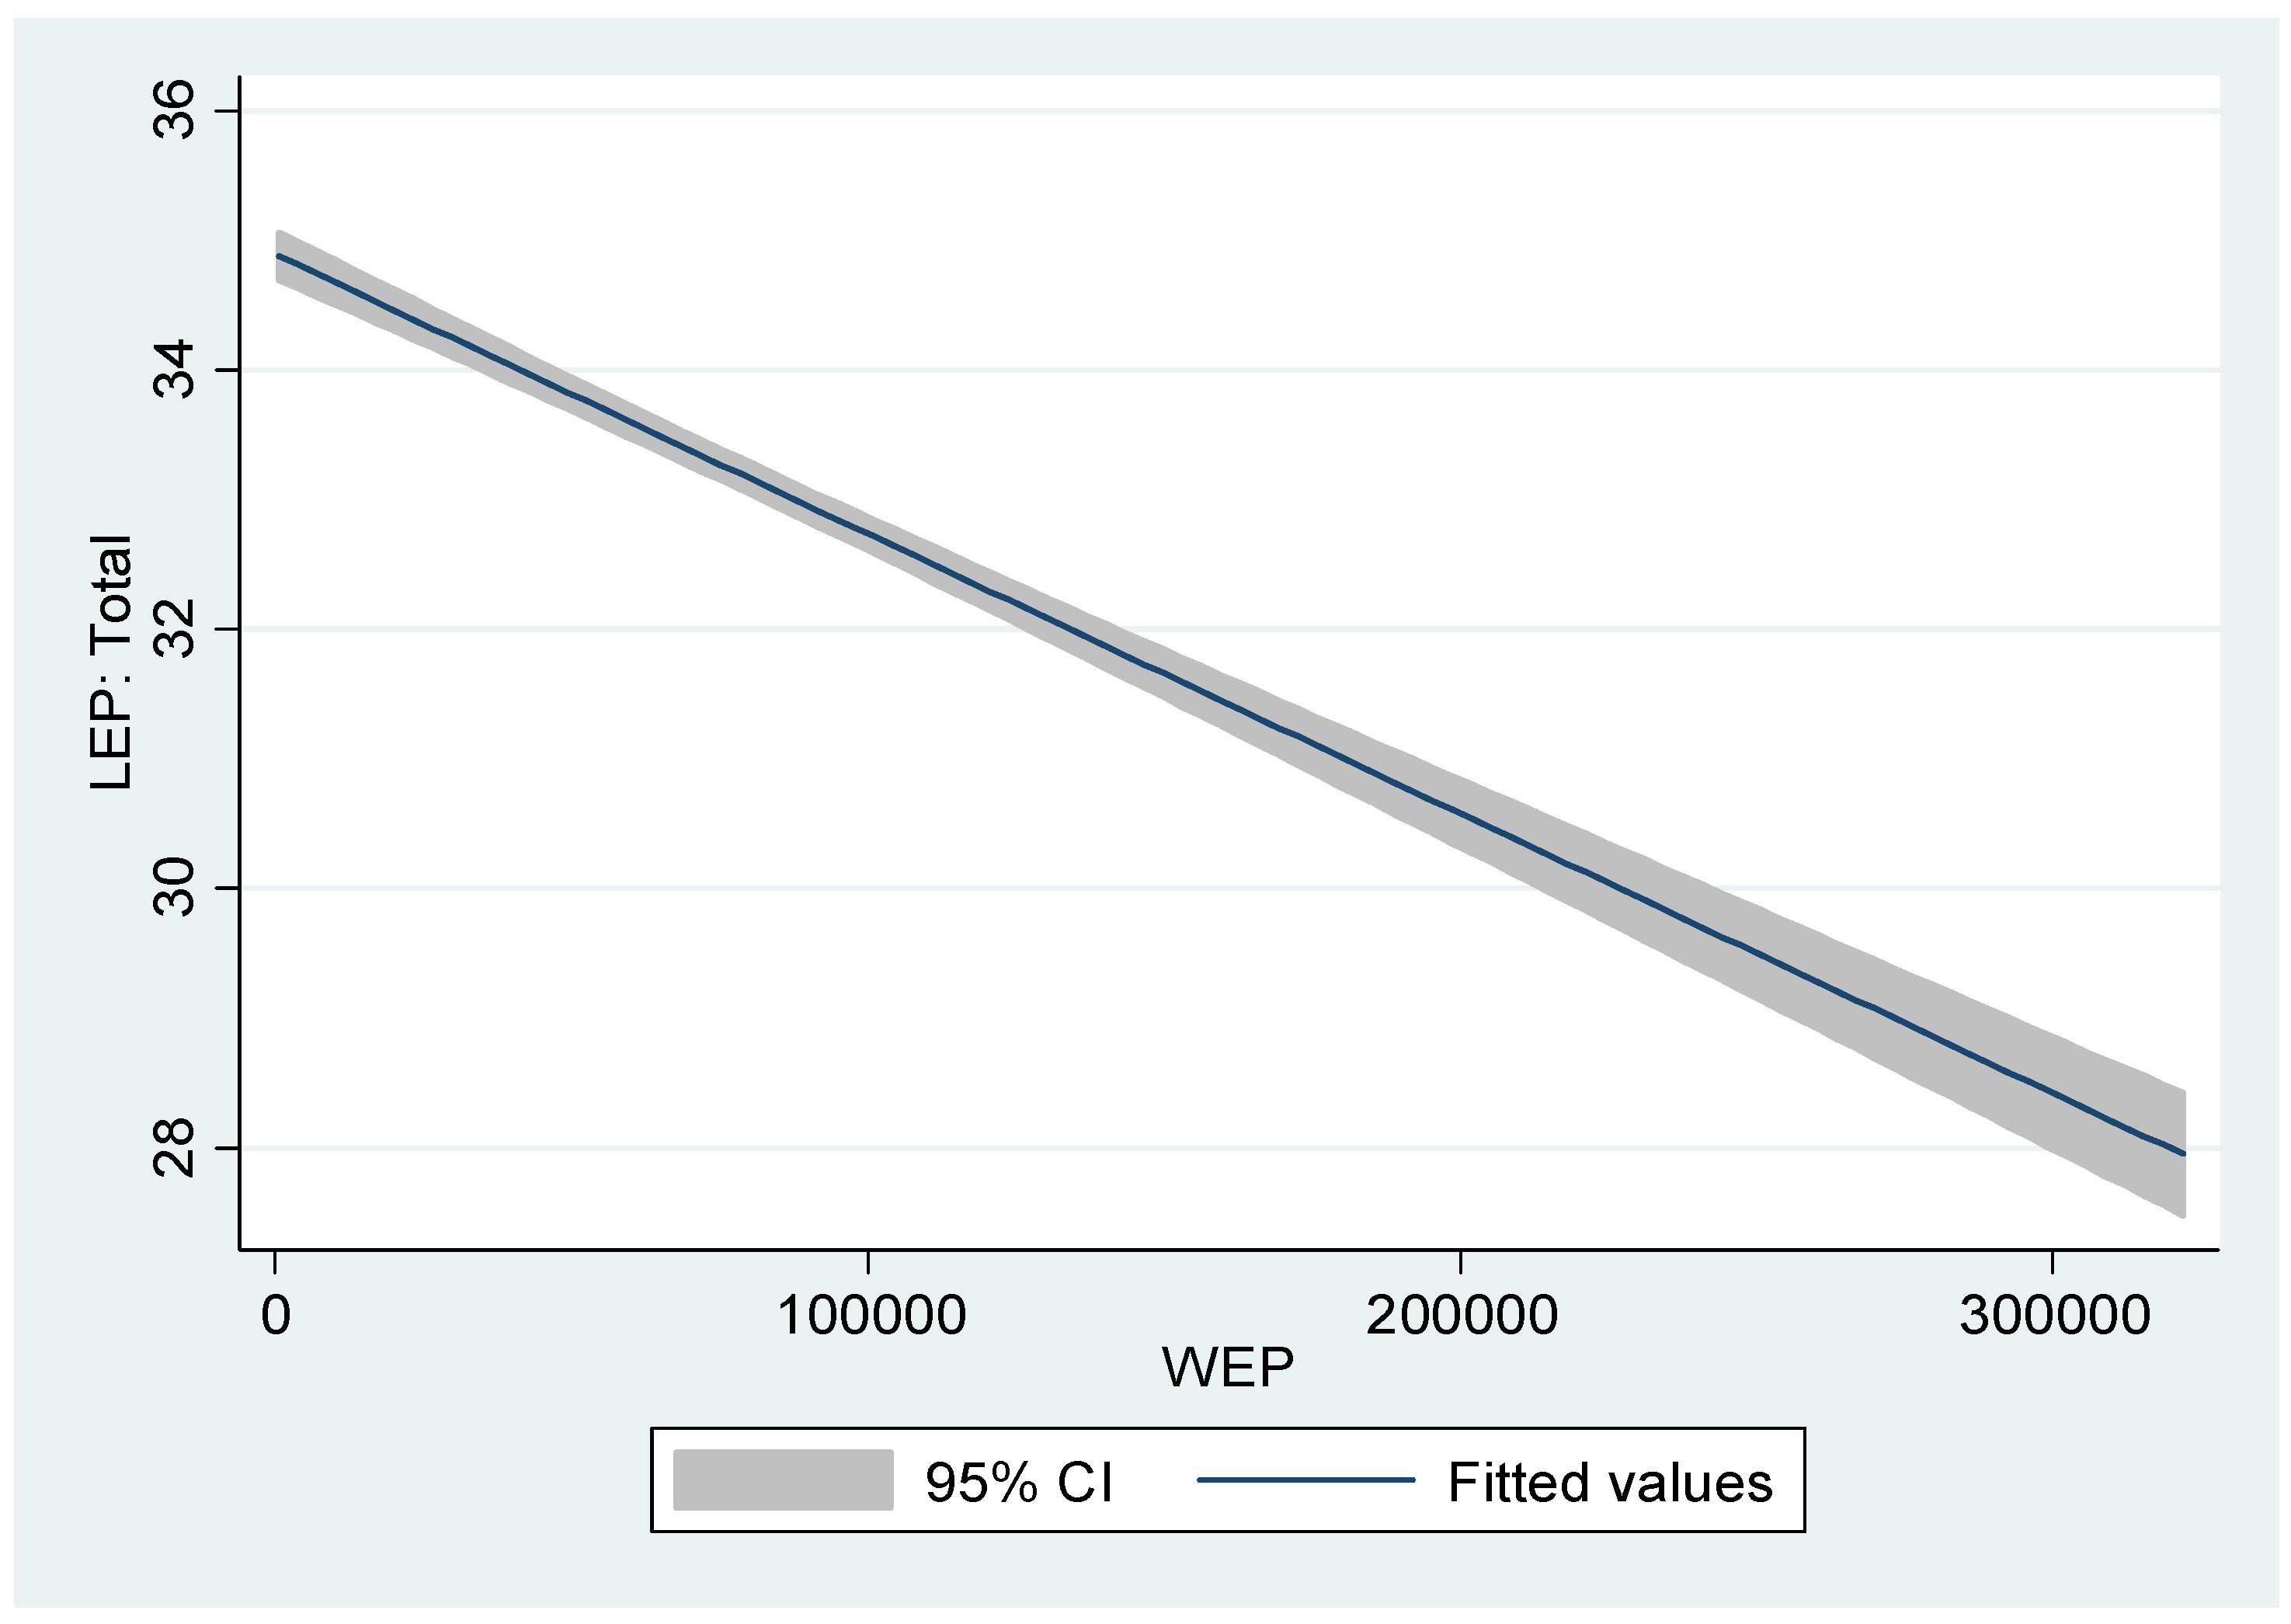
To examine the relationship between wind electricity production and local electricity prices, we present Figure A1, Figure A2, Figure A3, Figure A4, Figure A5, Figure A6, Figure A7 and Figure A8, which illustrate the average effect of WEP on LEP at both the country and regional levels. A preliminary visual inspection of these figures reveals that in five out of the 15 regions, the observed data patterns support the merit-order effect, wherein higher levels of wind electricity production correspond to a decline in electricity prices. More broadly, when aggregating all regions, we identify a general downward trend in LEP following periods of increased wind energy penetration. This suggests that, despite regional variations, an increase in wind electricity supply exerts an overall price-reducing effect on local electricity markets.

2.2. Descriptive Statistics

In 2020, the mean LEP was EUR 20.34, with a standard deviation of EUR 15.20 and a median of EUR 17.74 (Table A2 in Appendix A.1). We also note a positively skewed distribution of prices. There are considerable price swings, as the range of extreme boundaries is −14.37 to 107.42 euros. Data for WEP indicate a skewed distribution, with a mean and standard deviation of 75,944.61 MWh and 63,686.25 MWh, respectively. The production range of 2431 MWh to 307,951 MWh indicates a significant disparity in the pandemic’s impact on government policy metrics. The government intervention metrics (CHI, GSI, and EPI) have nearly identical distribution. The health situation is dominated by more people being infected than people dying (Mean of 8912.5 versus 255). Overall, WEP’s stability can be attributed to its renewable nature, as well as stimulus initiatives designed to avert a financial disaster. Although government control measures shift energy demand, contracted markets and incentive programs guarantee WEP’s resilience [2].
Table A3 in Appendix A1 presents the correlation coefficients among the different variables and illustrates their relationships. The Government Stringency Index (GSI), Containment Health Index (CHI), and Economic Policy Index (EPI) are significantly and mutually correlated. Hence, we include these variables separately to avoid biased results.
There is a slight negative correlation between WEP and LEP (r = −0.231703), which indicates that when one measure changes, the other one falls. On the other hand, CCC-19 and WEP have a weakly positive correlation (r = 0.146751). According to a slight negative correlation (r = −0.102315) between GSI and LEP, LEP somewhat declined in response to a stricter GSI during the COVID-19 pandemic. There is a slight negative link between viral containment techniques and CHI and WEP (r = −0.008198), but no correlation with LEP. Lastly, a moderate increase in LEP is the consequence of a more accommodating economic policy, as indicated by the positive correlation of r = 0.284449 between EPI and LEP.
It is noteworthy that the number of confirmed cases declines within a seven-day lag window [83]. Simple panel regressions are not adequate for such analyses, and distinguishing short/long-term impacts becomes appealing (using pooled OLS in our case may lead to biased estimations [84,85]).

2.3. Preliminary Tests

2.3.1. Cross-Sectional Dependence Test for Panels

The presence of common shocks and unobserved components that eventually become part of the error term, spatial dependence, and idiosyncratic pairwise dependence in the disturbances with no specific pattern of common components or spatial dependence may cause panel data models to show significant cross-sectional dependence in the errors. Table A4 in Appendix A.2 displays the results of four different tests. For all of these tests, the null hypothesis assumes that there is no cross-sectional dependence between regions. All test statistics are presented, along with their accompanying p-values. In each case, the p-values are less than 0.05, rejecting the null hypothesis.

2.3.2. Panel Unit Root Tests

When data show interindividual dependence, the second generation of panel unit root tests is applied [86,87,88]. Table A5 of Appendix A.2 shows that certain variables have a unit root. Nonetheless, all variables reject the unit root at the first difference (refer to Table A6 in Appendix A.2). The cross-sectional augmented IPS (CIPS) test adds additional regressors to the IPS test, which was created by Im, Pesaran, and Shin [89] and is based on the Augmented Dickey–Fuller (ADF) test. The truncated CIPS (TCIPS) copes with panels with large cross-sectional units. Based on the CIPS and TCIPS tests, LEP, WEP, GSI, CHI, and EPI reach stationarity in their first differences, minimizing the likelihood of erroneous regressions. The CCC-19 variable is I(1), and CCD-19 alternates between I(0) and I(1) using TCIPS with a constant and trend. The first condition to estimate a panel ARDL is therefore checked.

2.3.3. Panel ARDL Cointegration Test

When cross-sectional dependence is present, second-generation panel cointegration tests perform better than the conventional first-generation tests of [90,91,92]. By using the Residual Augmented Least Squares (RALS) estimator, Westerlund’s [93] test is more resilient to common components and spatial correlation, among other forms of cross-sectional dependence. The Durbin–Hausman group mean cointegration test was introduced by [94]. This test has special features. It does not rely extensively on prior knowledge of the order of integration and can account for cross-sectional dependencies. Moreover, the test of [94] allows for distinguishing stability ranking between explanatory variables. We therefore use the panel tests (Pt and Pa) and group-mean tests (Gt and Ga) of [95].
The p-values (<0.01) of the cointegration test underline an equilibrium relationship between the variables (Table A7 in Appendix A.2). It is noteworthy that the robustness of the test depends on the model and the included variables. Among all variants, the one that displays the GSI and WEP, for instance, has substantial statistical values, suggesting a very strong cointegration relationship. On the other hand, the WEP and EPI model exhibits somewhat weaker cointegration interactions. Overall, we establish that the variables throughout the COVID-19 period have long-term associations, thus justifying the use of Panel ARDL.

2.4. Econometric Methodology

Ref. [96] uses the Autoregressive Distributed Lag (ARDL) model and the Pooled Mean Group (PMG) estimator to investigate the speed of adjustment to equilibrium [97,98,99]. In the long run, the homogeneity restriction makes it reasonable for the study to focus on average elasticities across nations. We can express Equation (1) as
L E P i t = u i + φ i L E P i t 1 + θ i X i t + j = 1 p 1 λ i j L E P i t j + j = 0 q 1 δ i j X i t j + ϵ i t
where i = 1, 2,…, N stands for the cross-sectional unit (regions), t = 1, 2, 3,…, T represents time (daily), and j is the number of time lag. X i t is the vector of the explanatory variables, u i is the individual effect, and ϵ i t is the error term.
θ i is a vector of the long-run coefficients. The parameters λ i j and δ i j are the short-run terms that relate LEP to its historical values and X i t . Δ is the lag operator. Finally, the group-specific error correction term ( φ i < 0 ) quantifies how quicky L E P i t adjusts to its long-run equilibrium once X i t changes. In total, we have estimated five variants of Equation (1).
The choice of PMG is motivated by its advantages over alternative estimators, namely the Mean Group (MG) estimator and the Dynamic Fixed Effects (DFE) estimator (see Table 1).
The panel PMG ARDL allows for a better understanding of how electricity prices respond to fluctuations in WEP, particularly in a country like Denmark, where renewables play a dominant role in the energy mix.
To address the issue of high volatility from low wind speeds, our model captures the following:
  • Short-run price fluctuations: Since the PMG estimator permits heterogeneous short-run adjustments across panel units, it accounts for country-specific variations in price dynamics due to wind intermittency. This is particularly relevant for Denmark, where sudden drops in wind energy generation may lead to increased reliance on backup power sources, thereby increasing price volatility.
  • Long-run equilibrium effects: The model constrains the long-run relationship to be homogenous across countries, ensuring that the general trend of price reduction due to wind energy penetration is accurately captured while allowing for short-term deviations.
  • Asymmetry in price responses: If price effects from wind fluctuations are asymmetric (e.g., low wind speeds leading to sharper price spikes than the price reductions seen during high wind speeds), the inclusion of error correction dynamics in ARDL estimation helps capture these asymmetric adjustments. (To further reinforce the robustness of our findings, additional analyses could involve nonlinear specifications (e.g., NARDL) to explicitly model the asymmetric effects of wind variability on price volatility. This would provide deeper insights into how Denmark’s electricity prices react differently to increases and decreases in wind generation [59]. This should be left to another independent study.)
Based on the above, we draw the following hypotheses:
Hypothesis H1.
Wind energy led in electricity generation during the COVID-19 pandemic (merit-order).
Hypothesis H2.
Government intervention during the pandemic was efficient.
Hypothesis H3.
Wind renewable energy policy matters for sustainable development and price stability in future energy planning.

3. Results

We rely on conventional information criteria such as Akaike to select the optimal lags for p and q in Equation (1).

3.1. Long-Term Results

Based on Table A8 in Appendix A.3, the Nord Pool countries have established healthcare emergency programs wherein vaccination campaigns, mask-wearing, and hand hygiene are reinforced, causing a decline in greenhouse gas emissions and a better quality of water. This means that containment health measures (CHI) are a vehicle for enhancing the quality of the environment, resulting in lower electricity prices (Model 1). Interestingly, we have evidence that the governmental responses to the pandemic, indexed through GSI, exert downward pressure on LEPs (Model 2)—these stringencies, including movement restrictions and public space closures, lower economic activity and energy demand. The reduced demand, coupled with a rise in renewable energy contributions, tends to exert a downward pressure on electricity prices. Model 3 depicts a significant downward pattern in electricity prices following an increase in economic support by governments (ESI). With the economic downturn and the shutdown of commercial activity causing high energy costs, measures include a reduction in the cost of fuel for individuals and businesses, a flat-rate increase in social benefits for the most disadvantaged households, and particularly compensation for household electricity bills.
The findings in Table A8 consistently indicate a substantial inverse relationship between WEP and LEP in the long run. Models 1–5 show that when WEP rises, LEP decreases from 0.0051% to 0.0091% (H1 accepted). Our result is consistent with the theoretical prediction that the merit-order effect does not disappear in an oligopoly electricity market. The production coefficient turns out to be statistically insignificant in Model 5, while mortality rates from COVID-19 are significant and positively associated with LEP, suggesting that COVID-19 fatalities have a dominant impact on LEP. Announcements of human infection and death indicate the severity of the epidemic in different countries. Fear and panic among individuals in addition to the stringency measures, including telecommuting, will influence them to stay at home more, increasing home electricity consumption. Meanwhile, people who become infected need treatment and the use of equipment in hospitals, resulting in increased electricity use and demand.
The analysis highlights how important it is for government actions and the ongoing epidemic to shape long-term variations in LEP. According to this study, stringent government controls have a net deflationary effect on electricity prices, which range from EUR 151 to 208, as determined by several indices. However, the cost of electricity increases and can range from EUR 0.07 to 2.44 as the pandemic worsens, as evidenced by infection and mortality rates. It is also important to note that, although strict government measures cause an instantaneous interruption in energy supply, which lowers LEP, the long-term impacts could be different depending on how quickly the economy recovers and how well it adapts to renewable energy sources. Increased industrial activity might drive up demand for electricity as the economy recovers, possibly offsetting some price declines due to WEP and governmental stringencies (H2 accepted).
To guarantee energy affordability and sustainability, policymakers should strike a balance between economic policies and containment measures connected to health. As death rates and verified COVID-19 cases drive up LEP, governments must manage public health imperatives while limiting negative economic effects. The results may be used to create multifaceted plans that stabilize or even lower electricity costs while also limiting the virus’s ability to spread.

3.2. Short-Term Results

The results in Table A9 in Appendix A.3 show that there were no significant short-term impacts on LEP related to government action portrayed by GSI, CHI, and EPI, as well as cases of death (CCD-19). However, we observe a fairly significant effect of confirmed cases (CCC-19) on electricity prices. These findings raise issues of trust and confidence in citizens regarding disclosed information at the beginning of the pandemic. The accuracy of information is especially questioned when COVID-19-related news is covered by the media.
Table A9 also documents that the one-lag period WEP has a favorable impact on the current LEP, although this influence decreases over the next several days. Of note, immediate WEP levels have no significant short-term effects on LEP since WEP cannot be planned in the day-ahead market. Instead, WEP manufacturers are expected to participate in market bidding. Furthermore, WEP levels from previous times may have an impact on the current power supply, which could either positively or negatively affect LEP. The higher WEP from the time prior undoubtedly increased the supply of electricity, which lowered the LEP but raised current electricity demand. Conversely, lower WEP in the past would have led to less electricity being accessible, which would have increased LEP lagging and perhaps lowered the present LEP. We thus identify a day-ahead merit-order effect in the short term (H1 accepted).
The mean reversion propensity of LEP is clarified by Models 4 and 5. Both models suggest that LEP adjusts toward its long-term equilibrium to account for short-term distortions. Current LEP is heavily impacted by WEP from previous eras, even with minimal model differences. The impact of immediate WEP on LEP is less obvious because of climate-dependent WEP variability and the merit-order structure in the electricity markets.
To find further correlations, we performed the Panel Granger Causality test using the Dumiterscu–Hurlin method. We found a statistically significant binary association between pairs in most cases. However, LEP is not much impacted by the CHI. WEP is likewise unaffected by the CCC-19. Similarly, EPI is unaffected by CCD-19 (see Table A10 in Appendix A.3). At the 10% significance level, there is a fair unidirectional association between GSI and LEP.
We conclude that in the day-ahead electricity market during the COVID-19 era, a causal relationship exists between WEP and LEP, meaning that changes in WEP affect price variations (H1 accepted) and vice versa.

3.3. Comparison with Previous Studies

Our findings align with previous studies, despite different methodologies [41,53,54,55,100,101,102] showing that increased wind energy penetration lowers electricity prices in the long run by reducing reliance on costly fossil fuels. Furthermore, our findings support Mauritzen’s [103] contention that short-term LEPs may not be greatly impacted by immediate WEPs. However, some studies [41,54] note that wind power introduces short-term price volatility due to its intermittent nature. In contrast, other research [52,57] finds that wind energy is associated with higher prices, citing integration costs and grid infrastructure challenges, while ref. [60] highlights seasonal variations in its price impact (see Table 2). These discrepancies emphasize the influence of market structures, policy frameworks, and grid adaptability, suggesting that future research should consider storage solutions and regulatory mechanisms to stabilize price fluctuations.

4. Discussion

We supplement the literature with novel findings. First, our findings establish the merit-order effect over short- and long-term periods, reinforcing that wind energy production contributes to electricity market stability. This aligns with theoretical insights from [79] and highlights the role of wind energy in fostering a sustainable environment [104]. Wind power generation reduces electricity prices by displacing more expensive energy sources, promoting market efficiency while advancing decarbonization efforts within our sample period. This corroborates previous studies, highlighting renewable energy as a key driver of environmental sustainability [105].
Second, by incorporating COVID-19 indicators (confirmed cases and deaths) into our panel ARDL model, we reveal that pandemic severity triggered positive spikes in electricity prices. This phenomenon stems from heightened uncertainty, which influences investor behavior, inducing panic and overreactions to negative public news [106,107]. Nevertheless, crises can serve as catalysts for market adaptation. The literature on game theory suggests that uncertain environments foster skill development and strategic portfolio management, enhancing resilience in energy markets [108]. The ability to react and adapt to an evolving economic landscape is crucial for market maturity [109]. Ensuring an active and coordinated response among stakeholders is necessary for a flexible energy transition aligned with the Sustainable Development Goals [110]. However, investor responses to productive technology investments vary according to risk aversion levels; risk-averse investors exhibit more conservative behavior compared to risk-seeking ones [111]. This heterogeneity should be accounted for in designing policies that encourage renewable energy investments during crises.
Third, our results emphasize that government intervention metrics generally led to a decline in local electricity prices. Nordic countries, except Sweden, adopted stringent policies to combat the pandemic. However, Sweden’s less restrictive approach should not be viewed as an outlier, as variations in policy stringency reflect differences in governance structures and public adherence to regulations [112].
The effectiveness of government measures is strongly influenced by how information is communicated and received. Public compliance depends on trust in information sources and the credibility of disseminated messages [19,23,113]. Corruption levels further affect the efficacy of policy implementation [114,115,116]. Policy measures—such as quarantine enforcement, mask mandates, vaccination campaigns, and social distancing—should be evidence-based and guided by expert recommendations. In Sweden, for example, 93% of citizens followed COVID-19 updates from health professionals, as reported by the non-profit organization Vetenskap och Allmänhet.
Moreover, economic stimulus measures, such as emergency financial support programs, influence electricity prices. Ensuring transparency in fiscal and monetary policies is vital to maintaining investor confidence. Announcements related to tax rate adjustments and credit payment relief should be communicated clearly by central banks and regulators to sustain public trust [18].
Fourth, government interventions should incorporate incentives for flexibility investments as part of economic recovery measures, similar to those implemented during the COVID-19 crisis. Aligning these incentives with broader national and global energy objectives is complex but necessary [117]. Policymakers must avoid discriminatory practices that favor specific flexibility technologies over others while ensuring a fair and competitive renewable energy market.
Fifth, the pandemic and associated health campaigns have shifted human and institutional behavior, leading to reduced CO2 emissions. However, climate risks pose challenges to wind energy supply stability. Green investments offer a viable solution to mitigate climate change, stabilize energy prices, and ensure energy security [118]. Achieving both climate and energy objectives simultaneously is possible through renewable energy mutual funds, which also promote improved social and corporate governance [50]. Policymakers should facilitate financial instruments that encourage long-term green investment strategies.

5. Conclusions

Our study provides robust evidence of the merit-order effect and the role of government intervention in mitigating the economic and energy-related consequences of the COVID-19 pandemic. These findings emphasize the need for policy strategies that integrate both energy market stability and public health responses, aligning with the Sustainable Development Goals. The ability of wind energy to stabilize electricity markets highlights its role in fostering a decarbonized economy, reinforcing the theoretical perspectives of [79]. Additionally, the market disruptions induced by the pandemic reveal the necessity for adaptive policies that enhance resilience while ensuring energy security.
By employing a rigorous methodology, our analysis captures the response of seven Nordic countries across fifteen regions, offering a cross-country perspective on the crisis. While this approach provides valuable insights into regional heterogeneity, it also presents limitations. Our findings indicate that although policy responses demonstrated resilience, the flexibility required for a sustainable energy transition remains a key challenge for political agendas. Future research should complement our analysis by examining the long-term effectiveness of government interventions at a country-specific level, incorporating high-frequency data (e.g., hourly electricity prices), and applying innovative econometric techniques [119,120].
Moreover, political rhetoric during crisis periods plays a crucial role in shaping public and investor behavior [66,121,122]. Governments and regulators must ensure clear and consistent communication to prevent misinformation and market distortions, especially in environments where social media and word-of-mouth communication can fuel uncertainty. Although this issue was not prominent in our sample, it remains a critical area for future exploration in other contexts. For instance, the merit-order effect, where wind power lowers electricity prices by displacing costlier energy sources, should be most evident in Denmark and Finland but less pronounced in countries with lower wind energy penetration, such as Norway. The COVID-19 pandemic introduced market volatility, with price spikes in countries like Latvia and Lithuania, while nations with resilient energy infrastructure, like Sweden, experienced quicker stabilization. Government interventions also played a crucial role, with stricter policies in Finland and Denmark leading to price declines, whereas Sweden’s less restrictive approach resulted in different outcomes. The findings suggest that future research should explore energy markets with varying renewable energy adoption levels, including the US, China, other European countries [123], as well as emerging economies, to assess broader implications of wind energy integration and market shocks [124]. Our analytical framework raises further issues. Removing WEP subsidies could significantly impact electricity prices in the Nord Pool market, where wind power plays a major role. Subsidies have historically reduced investment risks and supported WEP’s competitiveness by lowering costs [125,126,127,128]. Without them, higher production costs could lead to increased electricity prices, especially during low-wind periods, while also weakening the merit-order effect that currently suppresses wholesale prices. Investment in new wind capacity might slow, affecting long-term renewable energy growth. During COVID-19, high renewable penetration and low demand led to negative prices, highlighting WEP’s advantage over inflexible nuclear power. In a post-subsidy scenario, WEP’s competitiveness would depend on regulatory frameworks, market mechanisms like power purchase agreements (PPAs), and technological advancements in storage and grid integration. The EU Emissions Trading System (EU ETS) and private-sector financing could further support WEP, ensuring its continued role in shaping Nord Pool electricity prices despite short-term financial challenges. Future research could enhance the PMG-ARDL model by incorporating wind speed variability, reserve activation costs, and interconnection effects to capture short-term price volatility in Denmark better, while also exploring regime-switching or GARCH models to account for shifts in market dynamics driven by renewable intermittency [129,130,131].
We also plan to examine how regulatory frameworks, such as carbon pricing and renewable energy incentives, can enhance wind energy deployment and grid integration [132,133]. Examining international cooperation and public–private partnerships can provide insights into scaling wind energy while addressing transboundary environmental challenges [134]. Research on education-driven behavioral shifts in energy consumption is needed to strengthen public acceptance and long-term sustainability of wind energy [135,136,137].

Author Contributions

Conceptualization, S.G. and E.T.; methodology, E.T.; software, E.T.; validation, E.T.; formal analysis, E.T.; investigation, S.G. and E.T.; resources, S.G.; data curation, S.G.; writing—original draft preparation, S.G. and E.T.; writing—review and editing, E.T.; visualization, E.T.; supervision, E.T.; project administration, S.G. and E.T. All authors have read and agreed to the published version of the manuscript.

Funding

This research received no external funding.

Institutional Review Board Statement

Not applicable.

Informed Consent Statement

Not applicable.

Data Availability Statement

The data are available upon request from the authors.

Conflicts of Interest

The authors declare no conflicts of interest.

Abbreviations

The following abbreviations are used in this manuscript:
ADFAugmented Dickey–Fuller
ARDLAutoregressive Distributed Lag
CCC-19COVID-19 Confirmed Cases
CCV-19COVID-19 Death Cases
CHIContainment Health Index
CIConfidence Interval
CIPSCross-sectional augmented of Im, Pesaran, and Shin
COVID-19Coronavirus Infectious Disease
DFEDynamic Fixed Effects
DKDenmark
EEEstonia
EEAEuropean Economic Area Agreement
EPIEconomic Policy Index
EUEuropean Union
EU ETSEuropean Union Emissions Trading System
FIFinland
GSIGovernment Stringency Index
GWhGigawatt-hour
IPSIm, Pesaran, and Shin
LEPLocal Electricity Price
LMLagrange Multiplier
LTLatvia
LVLatvia
MGMean Group
MWhMegawatt-hour
NWNorway
PMGPooled Mean Group
PPAPurchase Power Agreements
RALSResidual Augmented Least Squares
SESweden
TCIPSTruncated Cross-sectional augmented of Im, Pesaran, and Shin
USUnited States
WEPWind Energy Production

Appendix A

Appendix A.1

We describe the data used and their properties.
Table A1. Variables used in this study.
VariablesNotationDefinition
Local Electricity PriceLEPLocal Electricity Price in Euros.
Wind Energy ProductionWEPWind Energy Production in MWh.
Government Stringency IndexGSIHigher numbers on a scale of 0 to 100 denote more stringent COVID-19-related government regulations and limitations.
Containment Health IndexCHIBetter virus containment is indicated by higher values on the index, which normally spans from 0 to 100.
Economics Policy IndexEPIA more accommodating economic policy posture is indicated by higher values, while a more restrictive stance is indicated by lower values. The index normally goes from 0 to 100.
COVID-19 Confirmed DeathCCD-19Total number of COVID-19-related deaths.
COVID-19 Confirmed CasesCCC-19Total number of COVID-19-related cases.
Figure A1. The merit-order effect in Denmark by region. Notes: DK1: Denmark, region 1; DK2: Denmark, region 2; WEP: Wind Energy Production. The graph presents a fitted regression line with a 95% confidence interval (CI). X-axis (horizontal axis) represents WEP, which stands for Wind Energy Production. The values range from approximately 20,000 to 120,000. Y-axis (vertical axis) represents LEP in a region (DK1, DK2), possibly referring to Local Electricity Prices in the DK electricity market (Western Denmark). The values range from approximately 20 to 40. Fitted line (blue line) depicts the estimated relationship between WEP and LEP, showing a downward trend. Shaded area (gray): This represents the 95% CI, illustrating the range within which the true regression line is expected to fall with 95% certainty.
Sustainability 17 09859 g0a1aSustainability 17 09859 g0a1b
Figure A2. The merit-order effect in Estonia (EE). Note: WEP: Wind Energy Production. The graph presents a fitted regression line with a 95% confidence interval (CI). X-axis (horizontal axis) represents WEP, which stands for Wind Energy Production. The values range from approximately 20,000 to 120,000. Y-axis (vertical axis) represents LEP in EE, possibly referring to Local Electricity Prices in the EE electricity market (Estonia). The values range from approximately 20 to 40. Fitted line (blue line) depicts the estimated relationship between WEP and LEP, showing a downward trend. Shaded area (gray): This represents the 95% CI, illustrating the range within which the true regression line is expected to fall with 95% certainty.
Sustainability 17 09859 g0a2
Figure A3. The merit-order effect in Finland (FI). Note: WEP: Wind Energy Production. The graph presents a fitted regression line with a 95% confidence interval (CI). X-axis (horizontal axis) represents WEP, which stands for Wind Energy Production. The values range from approximately 20,000 to 120,000. Y-axis (vertical axis) represents LEP in FF, possibly referring to Local Electricity Prices in the FF electricity market (Finland). The values range from approximately 20 to 40. Fitted line (blue line) depicts the estimated relationship between WEP and LEP, showing a downward trend. Shaded area (gray): This represents the 95% CI, illustrating the range within which the true regression line is expected to fall with 95% certainty.
Sustainability 17 09859 g0a3
Figure A4. The merit-order effect in Lithuania (LT). Note: WEP: Wind Energy Production. The graph presents a fitted regression line with a 95% confidence interval (CI). X-axis (horizontal axis) represents WEP, which stands for Wind Energy Production. The values range from approximately 20,000 to 120,000. Y-axis (vertical axis) represents LEP in LT, possibly referring to Local Electricity Prices in the LT electricity market (Lithuania). The values range from approximately 20 to 40. Fitted line (blue line) depicts the estimated relationship between WEP and LEP, showing a downward trend. Shaded area (gray): This represents the 95% CI, illustrating the range within which the true regression line is expected to fall with 95% certainty.
Sustainability 17 09859 g0a4
Figure A5. The merit-order effect in Latvia (LT). Note: WEP: Wind Energy Production. The graph presents a fitted regression line with a 95% confidence interval (CI). X-axis (horizontal axis) represents WEP, which stands for Wind Energy Production. The values range from approximately 20,000 to 120,000. Y-axis (vertical axis) represents LEP in LV, possibly referring to Local Electricity Prices in the LV electricity market (Latvia). The values range from approximately 20 to 40. Fitted line (blue line) depicts the estimated relationship between WEP and LEP, showing a downward trend. Shaded area (gray): This represents the 95% CI, illustrating the range within which the true regression line is expected to fall with 95% certainty.
Sustainability 17 09859 g0a5
Figure A6. The merit-order effect in Norway by region. Notes: NO1: Norway, region 1; NO2: Norway, region 2; NO3: Norway, region 3; NO4: Norway, region 4, NO5: Norway, region 5; WEP: Wind Energy Production. The graph presents a fitted regression line with a 95% confidence interval (CI). X-axis (horizontal axis) represents WEP, which stands for Wind Energy Production. The values range from approximately 20,000 to 120,000. Y-axis (vertical axis) represents LEP in a region (NO1, NO2, NO3, NO4, NO5), possibly referring to Local Electricity Prices in the NO electricity market (Norway). The values range from approximately 20 to 40. Fitted line (blue line) depicts the estimated relationship between WEP and LEP, showing a downward trend. Shaded area (gray): This represents the 95% CI, illustrating the range within which the true regression line is expected to fall with 95% certainty.
Sustainability 17 09859 g0a6aSustainability 17 09859 g0a6bSustainability 17 09859 g0a6c
Figure A7. The merit-order effect in Sweden by region. Notes: SE1: Sweden, region 1; SE2: Sweden, region 2; SE3: Sweden, region 3; SE4: Sweden, region 4; SE5: Sweden, region 5; WEP: Wind Energy Production. The graph presents a fitted regression line with a 95% confidence interval (CI). X-axis (horizontal axis) represents WEP which stands for Wind Energy Production. The values range from approximately 20,000 to 120,000. Y-axis (vertical axis) represents LEP in a region (SE1, SE2, SE3, SE4), possibly referring to Local Electricity Prices in the SE electricity market (Sweden). The values range from approximately 20 to 40. Fitted line (blue line) depicts the estimated relationship between WEP and LEP, showing a downward trend. Shaded area (gray): This represents the 95% CI, illustrating the range within which the true regression line is expected to fall with 95% certainty.
Sustainability 17 09859 g0a7aSustainability 17 09859 g0a7bSustainability 17 09859 g0a7c
Figure A8. The merit-order effect over all countries. Note: WEP: Wind Energy Production. The graph presents a fitted regression line with a 95% confidence interval (CI). X-axis (horizontal axis) represents WEP, which stands for Wind Energy Production. The values range from approximately 20,000 to 120,000. Y-axis (vertical axis) represents LEP over all countries and regions, possibly referring to Local Electricity Prices in the Nordic electricity market. The values range from approximately 20 to 40. Fitted line (blue line) depicts the estimated relationship between WEP and LEP, showing a downward trend. Shaded area (gray): It represents the 95% CI, illustrating the range within which the true regression line is expected to fall with 95% certainty.
Sustainability 17 09859 g0a8
Table A2. Summary statistics.
StatisticsLEPWEPGSICHIEPICCC-19CCD-19
Mean20.3395575,944.6143.5006640.0094043.2627531,203.961213.866
Median17.7350061,512.0050.0000047.6200037.500008912.500255.0000
Maximum107.4200307,951.087.0400076.67000100.0000437,379.08727.000
Minimum−14.370002431.0000.0000000.0000000.0000000.0000000.000000
Std. Dev.15.2008763,686.2523.1926918.8646727.8310161426.052165.384
Skewness0.9520311.036769−0.684225−1.063694−0.0147623.7575711.801314
Kurtosis4.1553203.3991462.4433432.9107752.34825619.455884.638427
Jarque–Bera1134.6501019.967499.25161037.09497.3656374,863.763582.996
Probability0.0000000.0000000.0000000.0000000.0000000.0000000.000000
Observations5490549054905490549054905490
Note: LEP: Local Electricity Production, WEP: Wind Energy Production, GSI: Government Stringency Index, CHI: Containment Health Index, EPI: Economic Policy Index, CCC-19: COVID-19 Confirmed Cases, CCD-19: COVID-19 Death Cases. Data adapted from the authors’ own research.
Table A3. Pairwise correlation matrix.
LEPWEPCCC-19CCD-19GSICHIEPI
LEP1.000000
-----
WEP−0.2310251.000000
(0.0000)-----
CCC-190.0899230.1467511.000000
(0.0000)(0.0000)-----
CCD-190.0395800.1674490.8075151.000000
(0.0034)(0.0000)(0.0000)-----
GSI−0.089099−0.0474110.3375750.3766721.000000
(0.0000)(0.0004)(0.0000)(0.0000)-----
CHI0.003809−0.0850180.3602820.3885560.9587221.000000
(0.7778)(0.0000)(0.0000)(0.0000)(0.0000)-----
EPI0.288253−0.2137820.2125050.2158590.6345950.7290881.000000
(0.0000)(0.0000)(0.0000)(0.0000)(0.0000)(0.0000)-----
Note: LEP: Local Electricity Production, WEP: Wind Energy Production, GSI: Government Stringency Index, CHI: Containment Health Index, EPI: Economic Policy Index, CCC-19: COVID-19 Confirmed Cases, CCD-19: COVID-19 Death Cases. Probability is between parentheses.

Appendix A.2

We present tests before the estimation of panel PMG ARDL.
Table A4. Cross-sectional dependence test.
TestBreusch-Pagan LMPesaran Scaled LMBias-Corrected Scaled LMPesaran CD
VariablesStatisticProb.StatisticProb.StatisticProb.StatisticProb.
LEP14,005.790.0000959.24550.0000959.22490.0000102.78430.0000
WEP5312.9170.0000359.38040.0000359.35990.000053.565420.0000
GSI31,684.810.00002179.2140.00002179.1930.0000177.55440.0000
CCC-1936,387.380.00002503.7220.00002503.7010.0000190.69090.0000
CCD-1931,350.070.00002156.1150.00002156.0940.0000174.36540.0000
CHI34,072.500.00002343.9800.00002343.9590.0000184.46410.0000
EPI28,041.830.00001927.8240.00001927.8040.0000165.95560.0000
Note: LEP: Local Electricity Production, WEP: Wind Energy Production, GSI: Government Stringency Index, CHI: Containment Health Index, EPI: Economic Policy Index, CCC-19: COVID-19 Confirmed Cases, CCD-19: COVID-19 Death Cases.
Table A5. Unit root test in level.
VariablesNone
CIPSp-ValueTruncated CIPSp-Value
T-StatT-Stat
LEP−3.88014<0.01−3.88014<0.01
WEP−3.51233<0.01−3.51233<0.01
GSI−2.21927<0.01−2.21927<0.01
CCC-19−1.07349≥0.1−1.78589<0.05
CCD-19−0.35708≥0.1−0.67443≥0.1
CHI−1.86017<0.01−1.86017<0.01
EPI−3.27169<0.01−3.27169<0.01
VariablesWith constant
CIPSp-valueTruncated CIPSp-value
T-statT-stat
LEP−4.10308<0.01−4.10308<0.01
WEP−4.08823<0.01−4.07992<0.01
GSI−2.55766<0.01−2.55766<0.01
CCC-19−1.35202≥0.1−2.04964≥0.1
CCD-19−0.47934≥0.1−0.89795≥0.1
CHI−2.12315<0.01−2.121315<0.01
EPI−3.29349<0.01−3.29349<0.01
VariablesWith constant and trend
CIPSp-valueTruncated CIPSp-value
T-statT-stat
LEP−4.24799<0.01−4.29799<0.01
WEP−4.38077<0.01−4.31591<0.01
GSI−2.40792≥0.1−2.40792≥0.1
CCC-19−2.32947≥0.1−2.32947≥0.1
CCD-190.03405≥0.1−3.41875<0.01
CHI−2.04407<0.01−2.04407<0.01
EPI−3.72087<0.01−3.72087<0.01
Note: LEP: Local Electricity Production, WEP: Wind Energy Production, GSI: Government Stringency Index, CHI: Containment Health Index, EPI: Economic Policy Index, CCC-19: COVID-19 Confirmed Cases, CCD-19: COVID-19 Death Cases. Data adapted from the authors’ own research.
Table A6. Unit root test in first difference.
VariablesNone
CIPSp-ValueTruncated CIPSp-Value
T-StatT-Stat
LEP−10.97256<0.1−5.99797<0.1
WEP−12.44047<0.1−6.12<0.1
GSI−9.34911<0.1−6.12<0.1
CCC-19−1.7889<0.1−0.13482<0.1
CCD-190.65766≥0.1−0.13482≥0.1
CHI−11.48152<0.1−6.12<0.1
EPI−10.63739<0.1−6.12<0.1
VariablesWith constant
CIPSp-valueTruncated CIPSp-value
T-statT-stat
LEP−10.96015<0.1−6.0566<0.1
WEP−12.42641<0.1−6.19<0.1
GSI−9.38225<0.1−6.19<0.1
CCC-19−2.06773≥0.1−2.06773≥0.1
CCD-190.74254≥0.1−0.71244≥0.1
CHI−11.49814<0.1−6.19<0.1
EPI−10.63144<0.1−6.19<0.1
VariablesWith a constant and trend
CIPSp-valueTruncated CIPSp-value
T-statT-stat
LEP−11.10454<0.1−6.2913<0.1
WEP−12.42848<0.1−6.42<0.1
GSI−9.44568<0.1−6.42<0.1
CCC-19−2.23269≥0.1−2.23269≥0.1
CCD-190.28484≥0.1−3.20967<0.1
CHI−11.58176<0.1−6.42<0.1
EPI−10.63195<0.1−6.42<0.1
Note: LEP: Local Electricity Production, WEP: Wind Energy Production, GSI: Government Stringency Index, CHI: Containment Health Index, EPI: Economic Policy Index, CCC-19: COVID-19 Confirmed Cases, CCD-19: COVID-19 Death Cases.
Table A7. Westerlund Panel Cointegration Test.
Model NoneWith ConstantWith a Constant and Trend
Statisticp-ValueStatisticp-ValueStatisticp-Value
WEP,
GSI
Gt−4.5800.000−5.3020.000−6.1670.000
Ga−48.2930.000−61.5110.000−83.8720.000
Pt−19.1230.000−22.1130.000−25.7730.000
Pa−54.7190.000−71.8420.000−96.1570.000
WEP, CHIGt−4.6430.000−5.1650.000−6.3040.000
Ga−50.8560.000−60.8050.000−85.1420.000
Pt−19.6740.000−21.9940.000−31.9480.000
Pa−57.9330.000−71.5020.000−111.2780.000
WEP, EPIGt−4.6430.000−5.1350.000−5.9120.000
Ga−50.8560.000−60.1070.000−76.7650.000
Pt−19.6740.000−22.0410.000−30.4930.000
Pa−57.9330.000−70.9710.000−102.3070.000
WEP,
CCC-19
Gt−4.7780.000−5.6740.000−5.8050.000
Ga−41.3730.000−59.2420.000−65.4880.000
Pt−19.0230.000−22.8020.000−23.6870.000
Pa−43.9270.000−67.1490.000−74.4750.000
WEP,
CCD-19
Gt−5.0640.000−5.3380.000−5.6450.000
Ga−59.0640.000−65.8030.000−71.4140.000
Pt−20.9050.000−21.9330.000−22.5900.000
Pa−63.4510.000−71.7840.000−76.3790.000
Note: LEP: Local Electricity Production, WEP: Wind Energy Production, GSI: Government Stringency Index, CHI: Containment Health Index, EPI: Economic Policy Index, CCC-19: COVID-19 Confirmed Cases, CCD-19: COVID-19 Death Cases.

Appendix A.3

We expose the findings from long-run and short-run results as well the causality test.
Table A8. Long-run results of Panel PMG ARDL.
Dependent Variable: LEPIndependent VariablesCoefficientProb *Impact of a 1% IncreaseWEP Impact of Extra 1 GW
Model 1—ARDL(2, 2, 2)WEP−5.94E−050.0114 **−0.006%−0.06€
GSI−1.51E−010 ***−15.124%
Model 2—ARDL(2, 2, 2)WEP−6.72E−050.0041 ***−0.007%−0.07€
CHI−2.08E−010 ***−20.814%
Model 3—ARDL(2, 2, 2)WEP−5.01E−050.0443 **−0.005%−0.05€
EPI−1.06E−010 ***−10.560%
Model 4—ARDL (7, 2, 2)WEP−9.11E−050.0201 **−0.009%−0.09€
CCC-197.09E−050.0006 ***0.007%
Model 5—ARDL(7, 3, 3)WEP−6.33E−089.99E-010.000%0.00€
CCD-192.44E−030.0001 ***0.244%
Notes: ***; ** and * indicate statistical significance at 1%, 5%, and 10%, respectively. LEP: Local Electricity Production, WEP: Wind Energy Production, GSI: Government Stringency Index, CHI: Containment Health Index, EPI: Economic Policy Index, CCC-19: COVID-19 Confirmed Cases, CCD-19: COVID-19 Death Cases.
Table A9. Short-run results of panel PMG ARDL.
ModelsM.1—ARDL(2, 2, 2)M.2—ARDL(2, 2, 2)M.3—ARDL(2, 2, 2)M.4—ARDL (7, 2, 2)M.5—ARDL(7, 3, 3)
VariableCoefficientProbCoefficientProbCoefficientProbCoefficientProbCoefficientProb
COINTEQ01−0.2532830−0.2524240−0.238230−0.1245240−0.1142090
D(LEP(-1))−0.018650.3688−0.0192120.3653−0.0257920.2187−0.1484170−0.1583450
D(LEP(-2)) −0.1500520−0.1905690
D(LEP(-3)) −0.1000860.0011−0.10080.002
D(LEP(-4)) −0.1008680−0.0999880
D(LEP(-5)) −0.104590.0178−0.1079920.0161
D(LEP(-6)) −0.067360−0.0699740
D(WEP)0.0001760.28560.0001780.2830.0001780.28690.0001430.37220.0001350.4218
D(WEP(-1))0.0001760.02670.0001770.02610.0001760.02780.0001530.04120.0001450.0725
D(WEP(-2)) 2.32E−060.9609
D(GSI)0.0381170.307
D(GSI(-1))−0.0513980.3524
D(CHI) 0.003150.8702
D(CHI(-1)) −0.0358150.5638
D(EPI) 0.0166620.4817
D(EPI(-1)) −0.0513280.1118
D(CCC-19) 0.0020290.0685
D(CCC-19(-1)) −0.0010710.262
D(CCD-19) 0.064540.1995
D(CCD-19(-1)) −0.0691170.219
D(CCD-19(-2)) 0.0817610.1751
C−34.086250−38.050590−35.3680103.70577802.5433530.0001
@TREND0.01592400.01758400.0160330
Significant
Not significant
Note: LEP: Local Electricity Production, WEP: Wind Energy Production, GSI: Government Stringency Index, CHI: Containment Health Index, EPI: Economic Policy Index, CCC-19: COVID-19 Confirmed Cases, CCD-19: COVID-19 Death Cases.
Table A10. Panel Granger Causality results.
Ho: Does Not Homogeneously Cause
Variables/Prob.LEPWEPGSIEPICHICCC-19CCD-19
LEP 00.83790.83450.509600
WEP0 0.00070.53460.002100
GSI0.06480 00.00240.07540
EPI0.01200 00.00880
CHI0.4089000 0.07270
CCC-1900.748000.00010 0
CCD-190000.17850.00380
Significant at 1% or 5%
Significant at 10%
Not significant
Note: LEP: Local Electricity Production, WEP: Wind Energy Production, GSI: Government Stringency Index, CHI: Containment Health Index, EPI: Economic Policy Index, CCC-19: COVID-19 Confirmed Cases, CCD-19: COVID-19 Death Cases.

References

  1. Ahmad, T.; Baig, M.; Hui, J. Coronavirus Disease 2019 (COVID-19) Pandemic and Economic Impact. Pak. J. Med. Sci. 2020, 36, S73. [Google Scholar] [CrossRef] [PubMed]
  2. Juergensen, J.; Guimón, J.; Narula, R. European SMEs Amidst the COVID-19 Crisis: Assessing Impact and Policy Responses. J. Ind. Bus. Econ. 2020, 47, 499–510. [Google Scholar] [CrossRef]
  3. Maital, S.; Barzani, E. The Global Economic Impact of COVID-19: A Summary of Research; Samuel Neaman Institute for National Policy Research: Haifa, Israel, 2020; pp. 1–12. Available online: https://www.neaman.org.il/wp-content/uploads/2024/02/Global-Economic-Impact-of-COVID19_20200422171634.350.pdf (accessed on 6 March 2025).
  4. Mastropietro, P.; Rodilla, P.; Batlle, C. Emergency Measures to Protect Energy Consumers During the COVID-19 Pandemic: A Global Review and Critical Analysis. Energy Res. Soc. Sci. 2020, 68, 101678. [Google Scholar] [CrossRef] [PubMed]
  5. Wen, L.; Suomalainen, K.; Sharp, B.; Yi, M.; Sheng, M.S. Impact of wind-hydro dynamics on electricity price: A seasonal spatial econometric analysis. Energy 2022, 238, 122076. [Google Scholar] [CrossRef]
  6. Pointel, J.B. La Réglementation Economique dans les Pays Scandinaves de L’union Européenne. Available online: https://shs.hal.science/halshs-01794518/document (accessed on 6 March 2025).
  7. Sovacool, B.K. The avian benefits of wind energy: A 2009 update. Renew. Energy 2013, 49, 19–24. [Google Scholar] [CrossRef]
  8. Unger, E.A.; Ulfarsson, G.F.; Gardarsson, S.M.; Matthiasson, T. The effect of wind energy production on cross-border electricity pricing: The case of western Denmark in the Nord Pool market. Econ. Anal. Policy 2018, 58, 121–130. [Google Scholar] [CrossRef]
  9. Krohn, S.; Morthorst, P.E.; Awerbuch, S. The Economics of Wind Energy; European Wind Energy Association: Brussels, Belgium, 2009; Volume 3, Available online: https://www.unioviedo.es/ate/manuel/seasturlab/EWEA.pdf (accessed on 6 March 2025).
  10. Mertens, S. Wind Energy in the Built Environment; Multi Science Publishing Company: Brentwood, UK, 2005. [Google Scholar]
  11. Nelson, V. Wind Energy: Renewable Energy and the Environment; CRC Press: Boca Raton, FL, USA, 2009. [Google Scholar]
  12. Ortega-Izquierdo, M.; del Río, P. An analysis of the socioeconomic and environmental benefits of wind energy deployment in Europe. Renew. Energy 2020, 160, 1067–1080. [Google Scholar] [CrossRef]
  13. Saidur, R.; Rahim, N.A.; Islam, M.R.; Solangi, K.H. Environmental impact of wind energy. Renew. Sustain. Energy Rev. 2011, 15, 2423–2430. [Google Scholar] [CrossRef]
  14. Solarin, S.A.; Bello, M.O. Wind energy and sustainable electricity generation: Evidence from Germany. Environ. Dev. Sustain. 2022, 24, 9185–9198. [Google Scholar] [CrossRef]
  15. Wang, S.; Wang, S. Impacts of wind energy on the environment: A review. Renew. Sustain. Energy Rev. 2015, 49, 437–443. [Google Scholar] [CrossRef]
  16. Kumar, A.; Priya, B.; Srivastava, S.K. Response to the COVID-19: Understanding Implications of Government Lockdown Policies. J. Policy Model. 2021, 43, 76–94. [Google Scholar] [CrossRef] [PubMed]
  17. Allcott, H.; Braghieri, L.; Eichmeyer, S.; Gentzkow, M. The Welfare Effects of Social Media. Am. Econ. Rev. 2020, 110, 629–676. [Google Scholar] [CrossRef]
  18. Angeletos, G.M.; Pavan, A. Efficient Use of Information and Social Value of Information. Econometrica 2007, 75, 1103–1142. [Google Scholar] [CrossRef]
  19. Bargain, O.; Aminjonov, U. Trust and Compliance to Public Health Policies in Times of COVID-19. J. Public Econ. 2020, 192, 104316. [Google Scholar] [CrossRef]
  20. Malmendier, U.; Nagel, S. Depression Babies: Do Macroeconomic Experiences Affect Risk Taking? Q. J. Econ. 2011, 126, 373–416. [Google Scholar] [CrossRef]
  21. Simonov, A.; Sacher, S.; Dubé, J.P.; Biswas, S. Frontiers: The persuasive effect of Fox News: Noncompliance with social distancing during the COVID-19 pandemic. Mark. Sci. 2022, 41, 230–242. [Google Scholar] [CrossRef]
  22. Webster, R.K.; Brooks, S.K.; Smith, L.E.; Woodland, L.; Wessely, S.; Rubin, G.J. How to improve adherence with quarantine: Rapid review of the evidence. Public Health 2020, 182, 163–169. [Google Scholar] [CrossRef]
  23. Funke, M.; Ho, T.K.; Tsang, A. Containment Measures during the COVID Pandemic: The Role of Non-Pharmaceutical Health Policies. J. Policy Model. 2023, 45, 90–102. [Google Scholar] [CrossRef]
  24. Bento, P.M.R.; Mariano, S.J.P.S.; Calado, M.R.A.; Pombo, J.A.N. Impacts of the COVID-19 Pandemic on Electric Energy Load and Pricing in the Iberian Electricity Market. Energy Rep. 2021, 7, 4833–4849. [Google Scholar] [CrossRef]
  25. Lindberg, K. The COVID-19 Pandemic’s Effect on Electricity Consumption in Sweden. Available online: https://www.diva-portal.org/smash/record.jsf?pid=diva2:1809315 (accessed on 6 March 2025).
  26. Pradhan, A.K.; Rout, S.; Khan, I.A. Does market concentration affect wholesale electricity prices? An analysis of the Indian electricity sector in the COVID-19 pandemic context. Util. Policy 2021, 73, 101305. [Google Scholar] [CrossRef]
  27. Bigerna, S.; Bollino, C.A.; D’Errico, M.C.; Polinori, P. COVID-19 Lockdown and Market Power in the Italian Electricity Market. Energy Policy 2022, 161, 112700. [Google Scholar] [CrossRef]
  28. Deloitte. Facing the Electricity Crisis in Europe. 2020. Available online: https://www.deloitte.com/lu/en/Industries/energy/research/facing-the-electricity-crisis-in-europe.html (accessed on 19 March 2025).
  29. González-López, R.; Ortiz-Guerrero, N. Integrated Analysis of the Mexican Electricity Sector: Changes during the COVID-19 Pandemic. Electr. J. 2022, 35, 107142. [Google Scholar] [CrossRef]
  30. Sanchez-Lopez, M.; Moreno, R.; Alvarado, D.; Suazo-Martínez, C.; Negrete-Pincetic, M.; Olivares, D.; Basso, L.J. The diverse impacts of COVID-19 on electricity demand: The case of Chile. Int. J. Electr. Power Energy Syst. 2022, 138, 107883. [Google Scholar] [CrossRef]
  31. Santiago, I.; Moreno-Munoz, A.; Quintero-Jiménez, P.; Garcia-Torres, F.; Gonzalez-Redondo, M.J. Electricity demand during pandemic times: The case of the COVID-19 in Spain. Energy Policy 2021, 148, 111964. [Google Scholar] [CrossRef]
  32. Zhong, H.; Tan, Z.; He, Y.; Xie, L.; Kang, C. Implications of COVID-19 for the electricity industry: A comprehensive review. CSEE J. Power Energy Syst. 2020, 6, 489–495. Available online: https://ieeexplore.ieee.org/abstract/document/9160443/ (accessed on 6 March 2025).
  33. Leach, A.; Rivers, N.; Shaffer, B. Canadian Electricity Markets during the COVID-19 Pandemic: An Initial Assessment. Can. Public Policy 2020, 46, S145–S159. [Google Scholar] [CrossRef]
  34. Szczygielski, J.J.; Brzeszczyński, J.; Charteris, A.; Bwanya, P.R. The COVID-19 storm and the energy sector: The impact and role of uncertainty. Energy Econ. 2022, 109, 105258. [Google Scholar] [CrossRef]
  35. Norouzi, N.; Zarazua de Rubens, G.Z.; Enevoldsen, P.; Behzadi Forough, A. The Impact of COVID-19 on the Electricity Sector in Spain: An Econometric Approach Based on Prices. Int. J. Energy Res. 2021, 45, 6320–6332. [Google Scholar] [CrossRef]
  36. Ruan, G.; Wu, J.; Zhong, H.; Xia, Q.; Xie, L. Quantitative assessment of US bulk power systems and market operations during the COVID-19 pandemic. Appl. Energy 2021, 286, 116354. [Google Scholar] [CrossRef]
  37. Halbrügge, S.; Schott, P.; Weibelzahl, M.; Buhl, H.U.; Fridgen, G.; Schöpf, M. How Did the German and Other European Electricity Systems React to the COVID-19 Pandemic? Appl. Energy 2021, 285, 116370. [Google Scholar] [CrossRef]
  38. Akrofi, M.M.; Antwi, S.H. COVID-19 Energy Sector Responses in Africa: A Review of Preliminary Government Interventions. Energy Res. Soc. Sci. 2020, 68, 101681. [Google Scholar] [CrossRef] [PubMed]
  39. Costa, V.B.; Bonatto, B.D.; Pereira, L.C.; Silva, P.F. Analysis of the Impact of COVID-19 Pandemic on the Brazilian Distribution Electricity Market Based on a Socioeconomic Regulatory Model. Int. J. Electr. Power Energy Syst. 2021, 132, 107172. [Google Scholar] [CrossRef]
  40. Lazo, J.; Aguirre, G.; Watts, D. An Impact Study of COVID-19 on the Electricity Sector: A Comprehensive Literature Review and Ibero-American Survey. Renew. Sustain. Energy Rev. 2022, 158, 112135. [Google Scholar] [CrossRef] [PubMed]
  41. Woo, C.K.; Zarnikau, J.; Kadish, J.; Horowitz, I.; Wang, J.; Olson, A. The impact of wind generation on wholesale electricity prices in the hydro-rich Pacific Northwest. IEEE Trans. Power Syst. 2013, 28, 4245–4253. [Google Scholar] [CrossRef]
  42. Rana, V.; Ansari, M.A. Wind farm integration effect on electricity market price. In Proceedings of the 2013 International Conference on Energy Efficient Technologies for Sustainability (ICEETS), Nagercoil, India, 10–12 April 2013; pp. 349–354. [Google Scholar] [CrossRef]
  43. De La Nieta, A.A.S.; Contreras, J.; Munoz, J.I.; O’Malley, M. Modeling the Impact of a Wind Power Producer as a Price-Maker. IEEE Trans. Power Syst. 2014, 29, 2723–2732. [Google Scholar] [CrossRef]
  44. Ketterer, J.C. The Impact of Wind Power Generation on the Electricity Price in Germany. Energy Econ. 2014, 44, 270–280. [Google Scholar] [CrossRef]
  45. Lynch, M.; Curtis, J. The Effects of Wind Generation Capacity on Electricity Prices and Generation Costs: A Monte Carlo Analysis. Appl. Econ. 2016, 48, 133–151. [Google Scholar] [CrossRef]
  46. Zamani-Dehkordi, P.; Rakai, L.; Zareipour, H.; Rosehart, W. Big data analytics for modeling the impact of wind power generation on competitive electricity market prices. In Proceedings of the 2016 49th Hawaii International Conference on System Sciences (HICSS), Koloa, HI, USA, 5–8 January 2016; pp. 2528–2535. [Google Scholar] [CrossRef]
  47. Brancucci Martinez-Anido, C.; Brinkman, G.; Hodge, B.M. The Impact of Wind Power on Electricity Prices. Renew. Energy 2016, 94, 474–487. [Google Scholar] [CrossRef]
  48. Benhmad, F.; Percebois, J. Wind Power Feed-In Impact on Electricity Prices in Germany 2009–2013. Eur. J. Comp. Econ. 2016, 13, 81. [Google Scholar]
  49. Badyda, K.; Dylik, M. Analysis of the Impact of Wind on Electricity Prices Based on Selected European Countries. Energy Procedia 2017, 105, 55–61. [Google Scholar] [CrossRef]
  50. Makalska, T.; Varfolomejeva, R.; Oleksijs, R. The Impact of Wind Generation on the Spot Market Electricity Pricing. In Proceedings of the 2018 IEEE International Conference on Environment and Electrical Engineering and 2018 IEEE Industrial and Commercial Power Systems Europe, EEEIC/I and CPS Europe 2018, Palermo, Italy, 12–15 June 2018. [Google Scholar] [CrossRef]
  51. Wirdemo, A. The Impact of Wind Power Production on Electricity Price Volatility. Master’s Thesis, Luleå Tekniska Universitet, Luleå, Sweden, 2017. [Google Scholar]
  52. Csereklyei, Z.; Qu, S.; Ancev, T. The Effect of Wind and Solar Power Generation on Wholesale Electricity Prices in Australia. Energy Policy 2019, 131, 358–369. [Google Scholar] [CrossRef]
  53. Meng, S.; Sun, R.; Guo, F. Impact of Renewable Energy Power Generation Share on Germany’s Electricity Prices. Resour. Sci. 2021, 43, 1562–1573. [Google Scholar] [CrossRef]
  54. Pereira, J.P.; Rodrigues, P.M.M. The impact of wind generation on the mean and volatility of electricity prices in Portugal. In Proceedings of the 2015 12th International Conference on the European Energy Market (EEM), Lisbon, Portugal, 19–22 May 2015. [Google Scholar] [CrossRef]
  55. Pineau, P.-O.; Nasseri, Y.; Rafizadeh, N. The Effects of Wind Power Generation on the Electricity Price: High Frequency Evidence from New York. SSRN Electron. J. 2020. [CrossRef]
  56. Veraart, A. Modelling the impact of wind power production on electricity prices by regime-switching Levy semistationary processes. SSRN Electron. J. 2015. [CrossRef]
  57. Dorrell, J.; Lee, K. The Price of Wind: An Empirical Analysis of the Relationship Between Wind Energy and Electricity Price Across the Residential, Commercial, and Industrial Sectors. Energies 2021, 14, 3363. [Google Scholar] [CrossRef]
  58. Ulm, L.; Koduvere, H.; Palu, I. ‘Discount’-the renewable energy production impact on electricity price. In Proceedings of the 2020 IEEE 61st Annual International Scientific Conference on Power and Electrical Engineering of Riga Technical University, RTUCON 2020—Proceedings, Riga, Latvia, 5–7 November 2020. [Google Scholar] [CrossRef]
  59. Doering, K.; Sendelbach, L.; Steinschneider, S.; Anderson, C.L. The Effects of Wind Generation and Other Market Determinants on Price Spikes. Appl. Energy 2021, 300, 117316. [Google Scholar] [CrossRef]
  60. Wen, L.; Sharp, B.; Suomalainen, K.; Sheng, M.S.; Guang, F. The impact of COVID-19 containment measures on changes in electricity demand. Sustain. Energy Grids Netw. 2022, 29, 100571. [Google Scholar] [CrossRef]
  61. Ederer, N. The Market Value and Impact of Offshore Wind on the Electricity Spot Market: Evidence from Germany. Appl. Energy 2015, 154, 805–814. [Google Scholar] [CrossRef]
  62. Hosius, E.; Seebaß, J.V.; Wacker, B.; Schlüter, J.C. The Impact of Offshore Wind Energy on Northern European Wholesale Electricity Prices. Appl. Energy 2023, 341, 120910. [Google Scholar] [CrossRef]
  63. Hirth, L. The Market Value of Variable Renewables: The Effect of Solar Wind Power Variability on Their Relative Price. Energy Econ. 2013, 38, 218–236. [Google Scholar] [CrossRef]
  64. Nicolosi, M.; Fürsch, M. The Impact of an Increasing Share of RES-E on the Conventional Power Market—The Example of Germany. Z. Energiewirtschaft 2009, 33, 246–254. [Google Scholar] [CrossRef]
  65. Shimomura, M.; Keeley, A.R.; Matsumoto, K.I.; Tanaka, K.; Managi, S. Beyond the merit order effect: Impact of the rapid expansion of renewable energy on electricity market price. Renew. Sustain. Energy Rev. 2024, 189, 114037. [Google Scholar] [CrossRef]
  66. Andreouli, E.; Brice, E. Citizenship under COVID-19: An Analysis of UK Political Rhetoric during the First Wave of the 2020 Pandemic. J. Community Appl. Soc. Psychol. 2022, 32, 555–572. [Google Scholar] [CrossRef] [PubMed]
  67. De Miera, G.S.; del Río González, P.; Vizcaíno, I. Analyzing the Impact of Renewable Electricity Support Schemes on Power Prices: The Case of Wind Electricity in Spain. Energy Policy 2008, 36, 3345–3359. [Google Scholar] [CrossRef]
  68. Escribano, Á.; Ortega, Á. A Structural Analysis of the Merit-Order Effect in the Spanish Day-Ahead Power Market; Working Paper; UC3M; Universidad Carlos III de Madrid: Getafe, Spain, 2021; Available online: http://hdl.handle.net/10016/33298 (accessed on 6 March 2025).
  69. Bell, W.P.; Wild, P.; Foster, J.; Hewson, M. Revitalising the Wind Power Induced Merit Order Effect to Reduce Wholesale and Retail Electricity Prices in Australia. Energy Econ. 2017, 67, 224–241. [Google Scholar] [CrossRef]
  70. Macedo, D.P.; Marques, A.C.; Damette, O. The Merit-Order Effect on the Swedish Bidding Zone with the Highest Electricity Flow in the Elspot Market. Energy Econ. 2021, 102, 105465. [Google Scholar] [CrossRef]
  71. Figueiredo, N.C.; da Silva, P.P. The “Merit-Order Effect” of Wind and Solar Power: Volatility and Determinants. Renew. Sustain. Energy Rev. 2019, 102, 54–62. [Google Scholar] [CrossRef]
  72. Acar, B.; Selcuk, O.; Dastan, S.A. The Merit Order Effect of Wind and River Type Hydroelectricity Generation on Turkish Electricity Prices. Energy Policy 2019, 132, 1298–1319. [Google Scholar] [CrossRef]
  73. Azofra, D.; Jiménez, E.; Martínez, E.; Blanco, J.; Saenz-Díez, J.C. Wind Power Merit-Order and Feed-in-Tariffs Effect: A Variability Analysis of the Spanish Electricity Market. Energy Convers. Manag. 2014, 83, 19–27. [Google Scholar] [CrossRef]
  74. Clò, S.; Cataldi, A.; Zoppoli, P. The Merit-Order Effect in the Italian Power Market: The Impact of Solar and Wind Generation on National Wholesale Electricity Prices. Energy Policy 2015, 77, 79–88. [Google Scholar] [CrossRef]
  75. Lopes, F.; Sá, J.; Santana, J. Renewable Generation, Support Policies and the Merit Order Effect: A Comprehensive Overview and the Case of Wind Power in Portugal. In Electricity Markets with Increasing Levels of Renewable Generation: Structure, Operation, Agent-Based Simulation, and Emerging Designs; Springer: Berlin/Heidelberg, Germany, 2018; pp. 227–263. [Google Scholar] [CrossRef]
  76. Cludius, J.; Hermann, H.; Matthes, F.C.; Graichen, V. The Merit Order Effect of Wind and Photovoltaic Electricity Generation in Germany 2008–2016: Estimation and Distributional Implications. Energy Econ. 2014, 44, 302–313. [Google Scholar] [CrossRef]
  77. Sensfuß, F.; Ragwitz, M.; Genoese, M. The merit-order effect: A detailed analysis of the price effect of renewable electricity generation on spot market prices in Germany. Energy Policy 2008, 36, 3086–3094. [Google Scholar] [CrossRef]
  78. Borenstein, S.; Bushnell, J.B. Are Residential Electricity Prices Too High or Too Low?: Or Both? Working Paper, No. 24756; National Bureau of Economic Research: Cambridge, MA, USA, 2018. [Google Scholar]
  79. Antweiler, W.; Muesgens, F. On the Long-Term Merit Order Effect of Renewable Energies. Energy Econ. 2021, 99, 105275. [Google Scholar] [CrossRef]
  80. Acemoglu, D.; Kakhbod, A.; Ozdaglar, A. Competition in Electricity Markets with Renewable Energy Sources. Energy J. 2017, 38 (Suppl. S1), 137–156. [Google Scholar] [CrossRef]
  81. Green, R.; Vasilakos, N.V. The Long-Term Impact of Wind Power on Electricity Prices and Generating Power. ESRC Centre for Competition Policy Working Paper Series. 2011. Available online: https://papers.ssrn.com/sol3/papers.cfm?abstract_id=1851311 (accessed on 6 March 2025).
  82. Bublitz, A.; Keles, D.; Fichtner, W. An Analysis of the Decline of Electricity Spot Prices in Europe: Who Is to Blame? Energy Policy 2017, 107, 323–336. [Google Scholar] [CrossRef]
  83. Askitas, N.; Tatsiramos, K.; Verheyden, B. Estimating Worldwide Effects of Non-Pharmaceutical Interventions on COVID-19 Incidence and Population Mobility Patterns Using a Multiple-Event Study. Sci. Rep. 2021, 11, 1972 Available online:. [Google Scholar] [CrossRef]
  84. Baltagi, B.H. A Companion to Econometric Analysis of Panel Data; Wiley: Hoboken, NJ, USA, 2009; Available online: https://www.wiley.com/en-us/A+Companion+to+Econometric+Analysis+of+Panel+Data-p-9780470744031 (accessed on 6 March 2025).
  85. Okui, R.; Wang, W. Heterogeneous Structural Breaks in Panel Data Models. J. Econom. 2021, 220, 447–473. [Google Scholar] [CrossRef]
  86. Bai, J. Panel Data Models with Interactive Fixed Effects. Econometrica 2009, 77, 1229–1279. [Google Scholar] [CrossRef]
  87. Moon, H.; Perron, B.; Moon, H.; Perron, B. Testing for a Unit Root in Panels with Dynamic Factors. J. Econom. 2004, 122, 81–126. [Google Scholar] [CrossRef]
  88. Pesaran, M.H. A simple panel unit root test in the presence of cross-section dependence. J. Appl. Econom. 2007, 22, 265–312. [Google Scholar] [CrossRef]
  89. Im, K.S.; Pesaran, M.H.; Shin, Y. Testing for Unit Roots in Heterogeneous Panels. J. Econom. 2003, 115, 53–74. Available online: https://ideas.repec.org/a/eee/econom/v115y2003i1p53-74.html (accessed on 6 March 2025).
  90. Kao, C. Spurious Regression and Residual-Based Tests for Cointegration in Panel Data. J. Econom. 1999, 90, 1–44. [Google Scholar] [CrossRef]
  91. Pedroni, P. Critical Values for Cointegration Tests in Heterogeneous Panels with Multiple Regressors. Oxf. Bull. Econ. Stat. 1999, 61, 653–670. [Google Scholar] [CrossRef]
  92. Pedroni, P.; Pedroni, P. Panel Cointegration: Asymptotic and Finite Sample Properties of Pooled Time Series Tests with an Application to the PPP Hypothesis. Econom. Theory 2004, 20, 597–625. [Google Scholar] [CrossRef]
  93. Westerlund, J. Testing for error correction in panel data. Oxf. Bull. Econ. Stat. 2007, 69, 709–748. [Google Scholar] [CrossRef]
  94. Westerlund, J.; Edgerton, D.L. A simple test for cointegration in dependent panels with structural breaks. Oxf. Bull. Econ. Stat. 2008, 70, 665–704. [Google Scholar] [CrossRef]
  95. Persyn, D.; Westerlund, J. Error-correction–based cointegration tests for panel data. Stata J. 2008, 8, 232–241. [Google Scholar] [CrossRef]
  96. Pesaran, M.H.; Shin, Y.; Smith, R.P. Pooled Mean Group Estimation of Dynamic Heterogeneous Panels. J. Am. Stat. Assoc. 1999, 94, 621. [Google Scholar] [CrossRef]
  97. Osman, M.; Gachino, G.; Hoque, A. Electricity Consumption and Economic Growth in the GCC Countries: Panel Data Analysis. Energy Policy 2016, 98, 318–327. [Google Scholar] [CrossRef]
  98. Sohag, K.; Begum, R.A.; Syed Abdullah, S.M.; Jaafar, M. Dynamics of energy use, technological innovation, economic growth and trade openness in Malaysia. Energy 2015, 90, 1497–1507. [Google Scholar] [CrossRef]
  99. Wolde-Rufael, Y.; Weldemeskel, E.M. Environmental policy stringency, renewable energy consumption, and CO2 emissions: Panel cointegration analysis for BRIICTS countries. Energy Policy 2020, 17, 568–582. [Google Scholar] [CrossRef]
  100. Hoogwijk, M.; Van Vuuren, D.; de Vries, B.; Turkenburg, W. Exploring the Impact on Cost and Electricity Production of High Penetration Levels of Intermittent Electricity in OECD Europe and the USA, Results for Wind Energy. Energy 2007, 32, 1381–1402. [Google Scholar] [CrossRef]
  101. Jaraite, J.; Kažukauskas, A.; Brännlund, R.; Chandra, K.; Kriström, B. Intermittency and Pricing Flexibility in Electricity Markets. SSRN Electron. J. 2019. [CrossRef]
  102. Nieuwenhout, F.; Brand, A. The Impact of Wind Power on Day-Ahead Electricity Prices in The Netherlands. In Proceedings of the 2011 8th International Conference on the European Energy Market (EEM), Zagreb, Croatia, 25–27 May 2011; pp. 226–230. [Google Scholar] [CrossRef]
  103. Mauritzen, J. What Happens When It’s Windy in Denmark? An Empirical Analysis of Wind Power on Price Variability in the Nordic Electricity Market. SSRN Electron. J. 2012, 889. [Google Scholar] [CrossRef]
  104. Martí-Ballester, C.P. Do Renewable Energy Mutual Funds Advance Towards Clean Energy-Related Sustainable Development Goals? Renew. Energy 2022, 195, 1155–1164. [Google Scholar] [CrossRef]
  105. Opoku, E.E.O.; Acheampong, A.O. Energy Justice and Economic Growth: Does Democracy Matter? J. Policy Model. 2023, 45, 160–186. [Google Scholar] [CrossRef]
  106. Amato, J.D.; Morris, S.; Shin, H.S. Communication and Monetary Policy. Oxf. Rev. Econ. Policy 2002, 18, 495–503. [Google Scholar] [CrossRef]
  107. Morris, S.; Shin, H.S. Social Value of Public Information. Am. Econ. Rev. 2002, 92, 1521–1534. [Google Scholar] [CrossRef]
  108. Karim, S.; Naeem, M.A. Clean Energy, Australian Electricity Markets, and Information Transmission. Energy Res. Lett. 2022, 3. [Google Scholar] [CrossRef]
  109. Roques, F.A.; Newbery, D.M.; Nuttall, W.J. Investment incentives and electricity market design: The British experience. Rev. Netw. Econ. 2005, 4, 93–128. [Google Scholar] [CrossRef]
  110. Aidukienė, L.; Skaistė, G. Sustainable Development of Lithuanian Electricity Energy Sector. J. Econ. Dev. Stud. 2013, 1, 6–16. [Google Scholar]
  111. Yang, J.; Johansson, D.J. Adapting to uncertainty: Modeling adaptive investment decisions in the electricity system. Appl. Energy 2024, 358, 122603. [Google Scholar] [CrossRef]
  112. Alfano, V.; Ercolano, S.; Pinto, M. Fighting the COVID Pandemic: National Policy Choices in Non-Pharmaceutical Interventions. J. Policy Model. 2022, 44, 22–40. [Google Scholar] [CrossRef] [PubMed]
  113. Elgar, F.J.; Stefaniak, A.; Wohl, M.J. The Trouble with Trust: Time-Series Analysis of Social Capital, Income Inequality, and COVID-19 Deaths in 84 Countries. Soc. Sci. Med. 2020, 263, 113365. [Google Scholar] [CrossRef]
  114. Attila, J. Corruption, Globalization and the Outbreak of COVID-19. SSRN Working Paper. 2020. Available online: https://papers.ssrn.com/sol3/papers.cfm?abstract_id=3742347 (accessed on 6 March 2025).
  115. Ezeibe, C.C.; Ilo, C.; Ezeibe, E.N.; Oguonu, C.N.; Nwankwo, N.A.; Ajaero, C.K.; Osadebe, N. Political Distrust and the Spread of COVID-19 in Nigeria. Glob. Public Health 2020, 15, 1753–1766. [Google Scholar] [CrossRef]
  116. Gebka, B.; Kanungo, R.P.; Wildman, J. The Transition from COVID-19 Infections to Deaths: Do Governance Quality and Corruption Affect It? J. Policy Model. 2024, 46, 235–253. [Google Scholar] [CrossRef]
  117. Heffron, R.J.; Körner, M.F.; Schöpf, M.; Wagner, J.; Weibelzahl, M. The Role of Flexibility in the Light of the COVID-19 Pandemic and Beyond: Contributing to a Sustainable and Resilient Energy Future in Europe. Renew. Sustain. Energy Rev. 2021, 140, 110743. [Google Scholar] [CrossRef]
  118. Belaïd, F.; Al-Sarihi, A.; Al-Mestneer, R. Balancing Climate Mitigation and Energy Security Goals amid Converging Global Energy Crises: The Role of Green Investments. Renew. Energy 2023, 205, 534–542. [Google Scholar] [CrossRef]
  119. Marugán, A.P.; Márquez, F.P.G.; Perez, J.M.P.; Ruiz-Hernández, D. A Survey of Artificial Neural Network in Wind Energy Systems. Appl. Energy 2018, 228, 1822–1836. [Google Scholar] [CrossRef]
  120. Thiaw, L.; Sow, G.; Fall, S. Application of Neural Networks Technique in Renewable Energy Systems. Available online: https://ijssst.info/Vol-15/No-5/data/5198a006.pdf (accessed on 6 March 2025).
  121. Lilleker, D.; Coman, I.A.; Gregor, M.; Novelli, E. Political Communication and COVID-19: Governance and Rhetoric in Global Comparative Perspective. In Political Communication and COVID-19; Routledge: London, UK, 2021; pp. 333–350. Available online: https://library.oapen.org/bitstream/handle/20.500.12657/63306/9781003120254_webpdf.pdf?sequence=1#page=356 (accessed on 6 March 2025).
  122. Montiel, C.J.; Uyheng, J.; Dela Paz, E. The Language of Pandemic Leaderships: Mapping Political Rhetoric During the COVID-19 Outbreak. Polit. Psychol. 2021, 42, 747–766. [Google Scholar] [CrossRef]
  123. Fabra, N. Reforming European Electricity Markets: Lessons from the Energy Crisis. Energy Econ. 2023, 126, 106963. [Google Scholar] [CrossRef]
  124. Guerdalli, S.; Trabelsi, E. Impact of Wind Energy Production on Nord Pool Electricity Market Prices Pre and During COVID-19. In Proceedings of the Conférence Internationale sur les Sciences Appliquées et l’Innovation (CISAI-2023), Sousse, Tunisia, 10–11 July 2023; Proceedings of Engineering & Technology. Volume 77. [Google Scholar]
  125. Aldy, J.E.; Gerarden, T.D.; Sweeney, R.L. Investment versus Output Subsidies: Implications of Alternative Incentives for Wind Energy. J. Assoc. Environ. Resour. Econ. 2023, 10, 981–1018. [Google Scholar] [CrossRef]
  126. Alizamir, S.; Iravani, F.; Yücel, Ş. Investment in Wind Energy: The Role of Subsidies. Georgetown McDonough School of Business Research Paper 3868573. 2021. Available online: https://papers.ssrn.com/sol3/papers.cfm?abstract_id=3868573 (accessed on 6 March 2025).
  127. Idsø, J. Growth and Economic Performance of the Norwegian Wind Power Industry and Some Aspects of the Nordic Electricity Market. Energies 2021, 14, 2701. [Google Scholar] [CrossRef]
  128. Niesten, E.; Jolink, A.; Chappin, M. Investments in the Dutch Onshore Wind Energy Industry: A Review of Investor Profiles and the Impact of Renewable Energy Subsidies. Renew. Sustain. Energy Rev. 2018, 81, 2519–2525. [Google Scholar] [CrossRef]
  129. Bechmann, A.; Barlas, T.; Madsen, H.A. Incorporating Electricity Prices in Wind Turbine Design: Introducing the AEV Metric. J. Phys. Conf. Ser. 2024, 2745, 012018. [Google Scholar] [CrossRef]
  130. Duffy, A.; Hand, M.; Wiser, R.; Lantz, E.; Dalla Riva, A.; Berkhout, V.; Lacal-Arántegui, R. Land-Based Wind Energy Cost Trends in Germany, Denmark, Ireland, Norway, Sweden, and the United States. Appl. Energy 2020, 277, 114777. [Google Scholar] [CrossRef]
  131. Seljom, P.; Tomasgard, A. Short-term uncertainty in long-term energy system models—A case study of wind power in Denmark. Energy Econ. 2015, 49, 157–167. [Google Scholar] [CrossRef]
  132. Lindström, E.; Norén, V.; Madsen, H. Consumption Management in the Nord Pool Region: A Stability Analysis. Appl. Energy 2015, 146, 239–246. [Google Scholar] [CrossRef]
  133. Stanciu, C.V.; Mitu, N.E. Price behavior and market integration in European Union electricity markets: A VECM analysis. Energies 2025, 18, 770. [Google Scholar] [CrossRef]
  134. Cyndecka, M.A. EEA Law and the Climate Change. The Case of Norway. Pol. Rev. Int’l Eur. L 2020, 9, 107. [Google Scholar] [CrossRef]
  135. Dai, K.; Bergot, A.; Liang, C.; Xiang, W.N.; Huang, Z. Environmental Issues Associated with Wind Energy—A Review. Renew. Energy 2015, 75, 911–921. [Google Scholar] [CrossRef]
  136. Jin, X.; Ahmed, Z.; Pata, U.K.; Kartal, M.T.; Erdogan, S. Do Investments in Green Energy, Energy Efficiency, and Nuclear Energy R&D Improve the Load Capacity Factor? An Augmented ARDL Approach. Geosci. Front. 2024, 15, 101646. [Google Scholar] [CrossRef]
  137. Opoku, E.E.O.; Acheampong, A.O.; Aluko, O.A. Impact of Rural-Urban Energy Equality on Environmental Sustainability and the Role of Governance. J. Policy Model. 2024, 46, 304–335. [Google Scholar] [CrossRef]
Table 1. Motivation for the use of panel PMG ARDL.
FeatureMGPMGDFE
Long-run homogeneityFully heterogeneous (allows different long-run coefficients for each panel unit)Homogeneous (imposes a common long-run relationship)Homogeneous (imposes a common long-run relationship)
Short-run dynamicsFully heterogeneous (each unit has different short-run coefficients)Heterogeneous (each unit has different short-run coefficients)Homogeneous (same short-run dynamics across all units)
EfficiencyLow (due to high parameter variability)Higher than MG (due to imposed long-run homogeneity)High, but at the cost of restrictive homogeneity
SuitabilityBest when panel units are fundamentally different (e.g., cross-country studies with structural differences)Best when long-run relationships are expected to be similar, but short-run adjustments varyBest when both short- and long-run relationships are assumed to be identical across all units
Potential issueHigh variability may lead to inefficient estimatesRisk of bias if long-run homogeneity assumption is incorrectOverly restrictive, may produce biased estimates if true that short-run heterogeneity exists
Table 2. Synthesis of similarities/disparities of findings from previous studies.
Similar FindingsLong-Run ImpactShort-Run ImpactExplanation
[53]Reduction in electricity prices Greater availability of renewable energy sources, reducing the reliance on more expensive fossil fuel-based generation.
[55]Decline in average prices The greater generation from wind power contributes to a decline in average prices, as wind energy is typically cheaper and reduces the overall cost of electricity production.
[101] Decline in the day-ahead electricity pricesWhen the load is relatively low (and hard to increase) and renewable energy resources are abundant, the low marginal costs of renewable energy could lead to prolonged periods of near-zero or even negative marginal electricity prices.
[54]Reduction in average pricesIncrease in price volatilityWind generation lowers average prices by adding more supply to the market, but it also increases price volatility due to the intermittent nature of wind power
[43]Reduction in electricity prices This can be attributed to the presence of wind power producers who have the ability to influence market prices through their generation capacity. By offering electricity at lower prices, they can contribute to overall price reductions in the market.
[87] Decrease in intraday price volatilityThere is increased supply unpredictability when significant amounts of wind power are generated.
[41]Reduction in price levelIncrease in price varianceAs wind generation increases, it can contribute to lower average spot prices due to its cost-effectiveness, but the variability in wind availability can introduce uncertainty and increase price volatility.
[102]Depressed average day-ahead prices The functioning of energy market prices and policies is significantly impacted by the effects of uncertainty in forecasting renewable power.
[100]Depressed prices As the share of wind power increases, it displaces more expensive conventional generation sources, thereby reducing the overall cost of electricity production and leading to lower prices.
Different findingsLong-Run ImpactShort-Run ImpactExplanation
[57]Increase in electricity prices The positive relationship between wind energy and electricity prices is influenced by market dynamics, such as the costs associated with integrating intermittent renewable sources into the grid.
[60]Variation across seasons The variation in price reduction across seasons suggests that factors like seasonal electricity demand patterns and the availability of other energy sources may affect the price impact of wind penetration.
[52]Increase in electricity prices The positive relationship between wind and solar power generation and wholesale electricity prices could be attributed to increased investment costs and grid infrastructure required to integrate these intermittent sources.
Disclaimer/Publisher’s Note: The statements, opinions and data contained in all publications are solely those of the individual author(s) and contributor(s) and not of MDPI and/or the editor(s). MDPI and/or the editor(s) disclaim responsibility for any injury to people or property resulting from any ideas, methods, instructions or products referred to in the content.