Abstract
Rural dwellings are often self-designed and self-built by their owners, with construction decisions based on experience and imitation of nearby buildings. As existing advanced design methods are often too complex or resource-intensive for rural contexts, balancing cost-efficiency, energy performance, and functional needs remains a challenge. This paper proposes to use the matrix analysis method, which is a relatively simple and easy-to-learn procedure, to identify the optimal design of rural houses. Taking Hebi, located in the Central Plains of China, as an example, field research was carried out, and a baseline model was established. A number of variable models were analysed using the control variable method for building orientation and indoor headroom, and metrics such as energy consumption, uncomfortable hours and construction costs were calculated to screen out effective metrics. Furthermore, by combining matrix analysis with orthogonal tests, the approach enables the development of optimal design solutions more efficiently and with reduced complexity. The results show that the optimised design, generated using the proposed method, significantly improves the indoor thermal environment—reducing energy consumption by 65.26% and uncomfortable hours by 29.22%, with only a 1.3% increase in construction costs. This study contributes to sustainable rural development by proposing a practical framework that guides the design of low-cost and energy-efficient rural housing.
1. Introduction
Recently, the problem of energy consumption in the building sector is becoming increasingly prominent [1]. According to the International Energy Agency (IEA) Global Building Tracker, building operations consumed approximately 30% of the world’s final energy consumption and 27% of total carbon emissions in 2021 [2]. In China, building energy consumption accounts for 40% of the country’s total energy consumption, and building greenhouse gas emissions account for 30% of the country’s total emissions [3]. As people spend around 90% of their time indoors [4,5], most building energy is devoted to maintaining thermal comfort [6], making it critical to balance thermal comfort with reduced energy use.
In China, the rural residential building area accounts for 32% of the total building area in the country [7,8], and its buildings account for more than 90% of the total urban and rural housing construction [9]. In addition, building energy consumption is usually higher in rural areas than in urban areas. Moreover, with the improvement of economic development and living standards, the growth rate of building energy consumption of rural self-built houses is becoming increasingly significant [10]. Data show that the average annual growth rate of building energy used in developing countries is 2.2% [11]. High energy consumption in buildings is a problem in many underdeveloped countries and regions such as Iran [12], Turkey [13], Vietnam [14] and large parts of Latin America [15]. In China, rural residential building energy consumption accounts for 35.9% of the total residential building energy consumption [16].
One of the reasons why energy consumption in rural buildings is higher than in urban areas [17] is because of the differences in the design and construction of rural residential buildings and urban buildings. Urban residential buildings are often constructed by specialised design and construction teams, applying many cutting-edge technologies. While rural residential buildings are usually designed and constructed by the residents themselves, some high-technology energy-saving methods are not widely used in rural areas [18,19,20], and due to the condition limitations, some designers of agricultural houses cannot implement complex simulation calculations to select the optimal building orientation, indoor net height, body shape coefficients, shading forms, window openings, and external enclosure structures [21,22]. In recent years, many scholars have made a lot of explorations on multi-objective building performance optimisation. Wu et al. investigated the multi-objective optimal design method for zero-energy buildings as an example of small buildings in cold regions of China [23]; Wu et al. conducted a sensitivity analysis and multi-objective optimisation for rural housing renovation considering building and occupant behavioural uncertainty [24]; Yang et al. introduced a multi-objective optimisation approach using NSGAII to simultaneously address multiple objectives such as minimising building operational energy consumption and maximising life cycle economics and carbon reduction [25]; Guangchao Shi et al. used machine learning and parametric environmental simulation for multi-performance co-optimisation of existing residential retrofits in extremely arid and hot climate zones [26]. Despite the results of the above methods in building energy optimisation, they require a certain level of professional knowledge and skills to be applied, and there is still a distance between the application of these methods and rural builders. Therefore, finding an optimisation method that is easy to grasp, simple to operate, repeatable and less complex has become the key to promoting the optimisation of rural self-built house design and the application of energy saving and emission reduction. On the other hand, rural dwellings also face the challenge of reducing building construction costs during construction and use [27,28], and there are few existing studies linking the relationship between building energy efficiency, thermal comfort and construction costs from the perspective of rural builders.
This study focuses on rural residential buildings with the objective of exploring practical optimisation metrics to reduce building operational energy consumption and improve occupant thermal comfort without significantly increasing total construction costs. Taking a typical rural village in China’s cold climate zone 2 [29] as an example, DesignBuilder 6.1 [30] was used with the matrix analysis method [31] in a single orthogonal experiment to screen out effective metrics and perform multi-metric optimisation to derive the optimal combination metrics and reference values to improve the energy consumption problems and thermal comfort performance of rural residential buildings. The objective of this study is not to pursue highly precise and complex designs but rather to propose a straightforward and easily comprehensible approach that can be effectively applied for rural areas with limited technical resources and expertise.
2. Research Framework and Method
2.1. Research Framework
Figure 1 illustrates the workflow of this study. The base design is defined as a typical housing type that represents the design preferences of local residents for specific architectural elements. The study area, Hebi, comprises 805 existing villages, and a stratified random sampling method is employed in selecting the survey subjects [32,33]. A 2% sampling ratio was used to select 16 villages, resulting in a total of 32 self-built houses. Subsequently, based on the content of the relevant standards and architectural design data sets [34,35,36,37,38,39,40], seven typical quantifiable metrics were determined. The 32 surveyed buildings were classified and statistically analysed based on seven typical quantifiable metrics, allowing for both qualitative and quantitative descriptions of residents’ preferences. “More common” metrics, defined as those with higher proportions, were adopted as the criterion for determining the base design. Each selected metric has a proportion that exceeds the average proportion by one standard deviation. Accordingly, the base design is considered to effectively represent the metrics of the surveyed group.
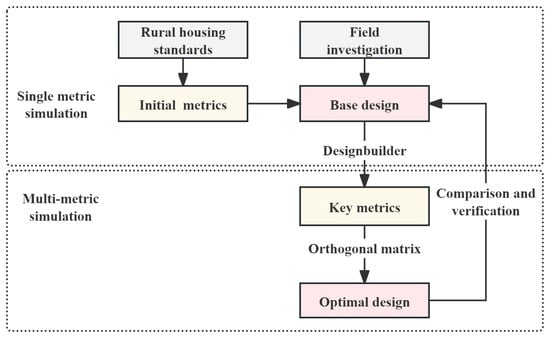
Figure 1.
Research framework.
In this study, typical rural residences in Hebi, located in China’s Central Plains, are used as case studies to investigate the current architectural status of rural residences in the field. The year-round climate in Hebi is shown in Figure 2. As can be seen from the graph, Hebi has the lowest temperature in January and the highest temperature in July and August every year. Therefore, two time periods, January and August 2022, were chosen based on the climatic characteristics to conduct the questionnaire survey.
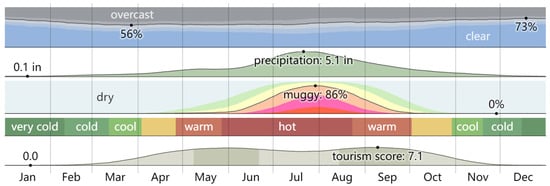
Figure 2.
Year-round climate map of Hebi [41].
2.2. Research Methods
2.2.1. Questionnaire Survey
Due to limited engagement with online questionnaires and residents’ reluctance to permit in-home visits, the survey team administered paper-based questionnaires on-site [42]. The questionnaire not only covered the seven quantifiable metrics but also included income ranges for the households, considering that the income capacity of rural households partially determines their attitude towards financial investment in self-built houses. During the survey period, a total of 189 questionnaires were distributed, and 163 valid responses were collected. The household characteristics of the respondents included the number of permanent residents and household income. As shown in Figure 3a, the majority of surveyed households had 2–4 permanent residents, accounting for 70.4% of the total sample. The total income of rural households in Hebi is predominantly between 30,000 and 60,000 yuan, and the overall income level of rural households in the Hebi region is comparatively lower than that of urban areas [43], as shown in Figure 3b.
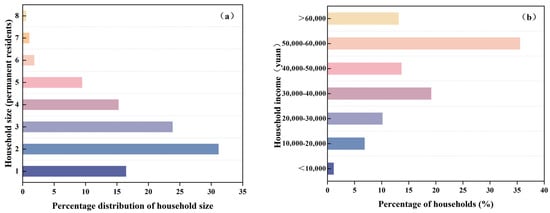
Figure 3.
Household characteristics of the respondents: (a) distribution of household size (permanent residents); (b) distribution of household income.
The sampling process was carried out based on the administrative divisions of Hebi City, with villages being selected equally from each region. Sample surveys have shown that rural dwellings in Hebi are mainly of the ‘one’ type with a centralised layout, with 87% of the building forms being townhouses, 94% being flat roofs, 92% being two-storey dwellings, and 97% being brick–concrete structures, which are the main choices for rural residents. In addition, up to 93% of modern residential houses adopt a north–south layout, which fully illustrates the importance of south orientation in residential house design [44]. The net height of the interior of rural residential houses in Hebi is shown in Figure 4, the net height of the ground floor is mainly distributed in 3.3–3.9 m, with an average height of 3.62 m, of which 3.6 m and 3.8 m account for 56%; the net height of the second floor mainly ranges from 3.2 m to 3.8 m, with an average height of 3.42 m, of which 3.3 m and 3.6 m account for 72%.
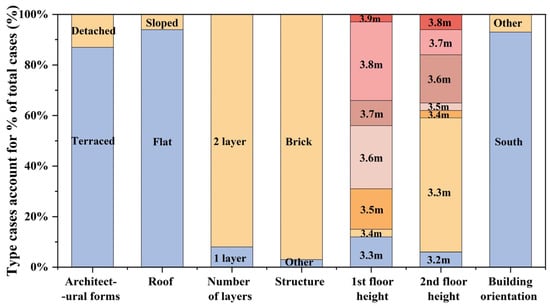
Figure 4.
Proportion of surveyed building metrics within the total cases. (Note: From left to right and from top to bottom, the bars correspond to detached houses, terraced houses, sloped roofs, flat roofs, two-story houses, one-story houses, brick structures, other structures, first-floor height, second-floor height, other orientations, and south-facing orientations. The values indicate the proportion of rural houses with these characteristics in the total surveyed sample).
2.2.2. Establishment of Base Design Model
Considering the results of the sampling survey, it is determined that the base design form, namely the most representative flat-roofed double-storey townhouse with five openings, an east–west length of the house base of 16 m, a north–south length of 15 m, and a brick structure, is adopted; the floor area is 288 m2, the indoor first floor has a net height of 3.6 m, the indoor second floor has a net height of 3.4 m, and the floor adopts the ‘one’ shape layout. This study uses this as a benchmark for comparison of various metrics of other dwellings and as a base design for optimal design. The specific datum model planes and parameters are shown in Figure 5 and Table 1 below.
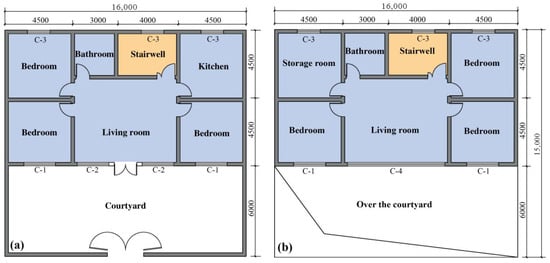
Figure 5.
Base design floor plans: (a) base design first floor plan; (b) base design second floor plan (the sloped line indicates “no floor”).

Table 1.
Base design element values.
2.2.3. Research Steps
In terms of parameter settings, parameter configurations were carried out in the DesignBuilder 6.1 software. The numerical values of the indoor and outdoor convective heat transfer coefficients and radiative heat transfer coefficients are provided in Appendix A. The indoor air change rate was set at 0.5 ac/h in both winter and summer. To account for uncertainties caused by variations in occupant behaviour and building airtightness, a sensitivity analysis was conducted. Following the studies of Hiroshi Yoshino et al. [45] and Arefeh Hesaraki et al. [46], cases with comparable floor areas and storey heights were selected, with maximum and minimum air change rates of 1 and 0.2, respectively, and compared with the baseline value of 0.5 ac/h. The results indicate that, although changes in the air change rate influence the absolute value of energy consumption, the overall patterns and conclusions remain consistent. The indoor calculation parameters were set in accordance with the relevant Chinese standards [37] and the research findings of Zhang Tao et al. [47], defining thermal comfortable indoor temperatures as not lower than 14 °C in winter and not higher than 27 °C in summer, with annual hours of thermal discomfort used as the metric of indoor thermal comfort in rural dwellings. The impact of material unit prices, quantities, and losses was taken into account. Unit prices of various materials were obtained from the latest data published on the “Henan Provincial Engineering Cost Information Network” [48], and these were multiplied by the specific material quantities for each part of the base design building to calculate the preliminary construction cost. Considering the potential material losses during construction, and after discussions with several local residents with extensive experience, the preliminary construction cost was multiplied by 1.2 to obtain a more reasonable estimate of the actual construction cost. Due to the difficulty in quantifying the cost of manual labour in the construction of rural self-built houses, this was not reflected in the overall construction cost estimation. The relevant calculation formula is as follows:
where Ctotal denotes the total construction cost, Qi represents the quantity of the component or system (such as area, volume, or number), Ui refers to the unit price, and n indicates the number of components involved.
In this study, based on the relevant specifications [34,35,36,37,38,39,40], the factors of metrics were quantitatively extracted and summarised. At the same time, combined with the characteristics of rural residential houses in Hebi in the sample survey, the building orientation (O) [49,50], indoor clear height (I), body shape coefficient [51], building shading (S) [52], window-to-wall ratio (W) [53], additional sunroom (R) [54], and external envelope (P) [55,56,57], 7 single metrics were studied and modelled with separate metrics (Table 2). In this study, the base design of a residential house is used as a reference and several design metrics are set to carry out the simulation analysis. The buildings are oriented at 0° due south and rotated sequentially in 15° steps to generate different models. The clear interior height (applied to the first and second floors) is set in the range of 2.6 m to 3.6 m in 0.1 m steps. The body shape coefficient is defined as the ratio of the total area of the south elevation, north elevation, and roof to the building volume. Consider the common layout forms of townhouses for modelling. Taking the benchmark model as an example, the length of the homestead in the north–south direction is 15 m. Combined with the functional layout of dwellings, the minimum depth is 7 m and the maximum depth is 15 m. In Table 2, the variation in the depth (T) is used to characterise the variation in the body shape coefficient. Shading is primarily achieved through the installation of appropriately designed shading panels, a strategy that not only helps to reduce energy consumption but also enhances thermal comfort within the living environment [58]. Shading is provided by means of horizontal building eaves, which vary in length from 0.6 m to 1.6 m in 0.2 m steps. Regarding the window-to-wall ratio setting, three scenarios were considered. In the first scenario (W1), both the north- and south-facing window-to-wall ratios were adjusted simultaneously. In the second scenario (W2), the north-facing ratio was fixed, while only the south-facing ratio was varied. In the third scenario (W3), the south-facing ratio was kept constant and only the north-facing ratio was adjusted. The north–south oriented window-to-wall ratio varies from 0.15 to 0.85 in steps of 0.1. An additional sunspace, also referred to as a sunroom or solar greenhouse, is typically an enclosed area added to the south façade of a building, or another suitable location, featuring large expanses of transparent envelope structures. The sunroom is located on the south side of the building and has a fixed window-to-wall ratio of 1. Its depth varies between 0.6 m and 1.6 m in 0.2 m steps. In the external envelope, the thickness of the external wall (P1) and roof insulation (P2) were used as metrics, ranging from 30 mm to 80 mm in steps of 10 mm. In the practical application of residential buildings, there are many types of energy-saving glass, among which insulating glass and low-e glass (also known as Low-E glass) are the more common choices. With the thickness of the air interlayer and the glass material as the metrics, a total of six types of external window types were set up (P3) to study the effects on each index.
Table 2.
Summary of model metrics.
In this paper, matrix analysis is used as an optimisation method, by which the weights of each level of each factor affecting the test results can be calculated, and then the optimal solution can be quickly determined according to the weight size, and the primary and secondary order of the influencing factors can be clearly identified. Its structural model is shown in Table 3 below.
Table 3.
Data structure model of orthogonal experiments.
Definition 1.
Examination index matrix of the test: if there is one factor in the orthogonal test and each factor has m levels, the average value of the test index at the jth level of the factor Xi is Kij; if the examination index of the test results indicates that the larger the better, let Kij = Kij; and if the examination index of the test results follows the “smaller-the-better” rule, then let Kij = 1/Kij, according to Equation (A1), to construct the matrix.
Definition 2.
Factor Layer Matrix:
; then construct the matrix according to Equation (A2).
Definition 3.
Horizontal layer matrix: the extreme deviation of the orthogonal test factor Ai is Si, , then construct the matrix according to Equation (A3).
Definition 4.
Weight matrix influencing the test index values, as given in Equation (A4).
In the multi-metric calculation, the weighting matrices for building operational energy consumption, indoor thermal discomfort hours, and construction cost were denoted as W-I, W-II, and W-III, respectively. The overall weighting matrix of the orthogonal test metrics was defined as the average of the weighting matrices of the three metrics, as expressed in Equation (A5). The specific forms of Matrix Formulae (A1)–(A5) are provided in Appendix B. In the above matrix, , is , which is the ratio of the metric value of the first level of Factor to the sum of the metric values of all levels of Factor ; S1 for is the ratio of the extreme variance of factor to the sum of the extreme variances of all the factors, and the value of the product of the two can not only reflect the degree of influence of the first level of factor on the value of the metric, but it can also reflect the size of the extreme variance of factor . The same is true for other factors and levels. Through the calculation, the weight of the influence of each level of each factor on the test results of the examination of the metrics can be derived, according to the weight, which can be derived from the optimal programme and the influence of the factors in the order of priority.
After using DesignBuilder 6.1 to obtain the optimisation efficiency of a single metric and then filtering out the effective metrics, multi-metric optimisation is carried out. The first step is to select single metrics with an optimisation efficiency greater than 5% to participate in the integrated optimisation, while metrics with an optimisation efficiency of less than 5% are considered inefficient optimisations and are not included in the integrated optimisation [59]. After screening, the conflicting options need to be removed and the final optimised strategy selected. The second step is to determine the number of levels of each factor—the level selection of orthogonal test factors—as shown in Table 4. In this study, a five-level orthogonal table was selected based on the number of levels of each factor. The five-level orthogonal table allows for direct screening of existing levels without the need to add levels on an ad hoc basis and ensures that each level occurs with equal frequency in the table. The third step is to select the appropriate standard orthogonal table. The orthogonal table was selected by the number of levels and factors, and orthogonal tests were generated using IBM SPSS Statistics 27, as shown in Appendix C. This approach can significantly reduce the simulation time and cost, thus improving the simulation efficiency [60].
Table 4.
Summary of the factors and their levels.
In the fourth step, the values of the three metrics corresponding to each test scenario were calculated according to the calculation method for each metric.
In the fifth step, according to the calculation results, the orthogonal test results are calculated and analysed for single and multiple metrics to determine the value of the combination strategy under multi-metric optimisation.
3. Results
3.1. Single Metrics Simulation
After evaluating seven individual metrics in terms of building energy consumption, indoor thermal comfort, and building costs, it was found that building shading optimisation was the least effective, failing to meet the expected targets in all three areas. Therefore, for farmhouses in other regions, other single metrics besides building shading can be prioritised for step 3.1.
3.1.1. Building Orientation
As can be seen in Figure 6, building orientation has a significant effect on the building energy consumption of rural dwellings. As the building orientation is deflected to the east or west, building energy consumption increases with the angle of deflection. The main factor in the process of orientation change is the amount of solar radiation received by the building. Due south orientation receives the most solar radiation, while due east and west orientations receive less solar radiation and therefore consume more energy. The total number of thermally uncomfortable hours on the first and second floors gradually increased as the orientation angle changed. The ground floor space was the most affected, with an increase of 498 h of thermal discomfort when changing from 0° to −90°, while the second floor space had a smaller change, with an increase of 195 h of thermal discomfort. Since most of Hebi is a plain with flat terrain, the building orientation has less impact on the construction conditions and the amount of materials used, so it can be assumed that the building orientation does not have a significant impact on the construction cost.
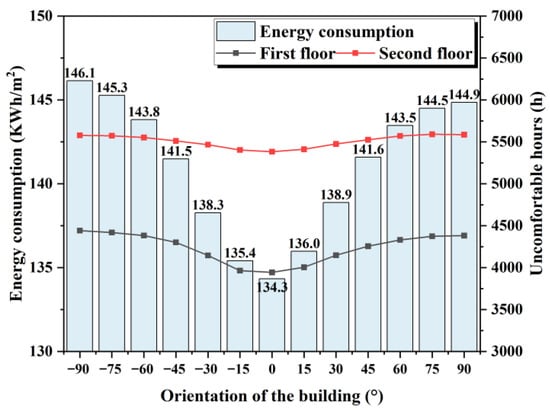
Figure 6.
Effect of building orientation on each metric.
3.1.2. Interior Clear Height
Figure 7a shows that building energy consumption increases gradually with the increase in the net height of the first and second floors. As the indoor clear height of the first and second floors increased from 2.6 m to 3.6 m, the number of thermally uncomfortable hours indoors showed an upward trend, with the total number of thermally uncomfortable hours on the first and second floors increasing by 190 h. One floor was most affected, with indoor thermal discomfort hours increasing by 172 h; the second floor was less affected, with indoor thermal discomfort hours increasing by a maximum of 18 h. For every 0.1 m increase in indoor clear height, the unit construction cost per square metre increases by approximately 5.5 yuan/m2. The minimum construction cost per unit area is 781.08 yuan/m2, the maximum is 835.81 yuan/m2, and the maximum difference is 54.73 yuan/m2.
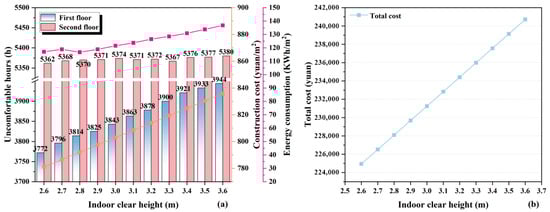
Figure 7.
Impact of indoor clear height on metrics: (a) building energy consumption, thermal comfort, and unit area cost; (b) total cost.
3.1.3. Body Shape Factor
As shown in Figure 8a, as the body shape coefficient decreases, the energy consumption per unit area of the building decreases, with a maximum difference of 24.8 KWh/m2. The number of thermally uncomfortable hours in the second-floor space is less affected by the body shape coefficient, while the first-floor space is more affected. Figure 8b shows that as the body coefficient decreases, the north–south length of the main body of the residential building increases, the floor area increases, and the construction cost rises rapidly. When the form factor is 0.429, the overall construction cost is the lowest, whereas at a form factor of 0.276, the overall construction cost is the highest, representing an increase of 83.54% compared with the former. However, the construction cost per unit area gradually decreases as the shape coefficient decreases, with a maximum difference of 123.65 yuan/m2.
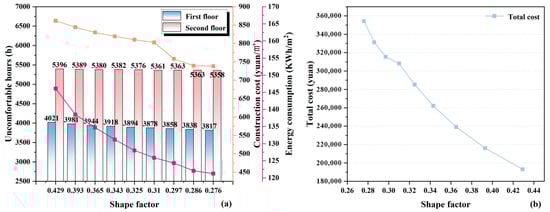
Figure 8.
Impact of body size coefficients on metrics: (a) building energy consumption, thermal comfort, and unit area cost; (b) total cost.
3.1.4. Building Shading
As shown in Figure 9a, with the increase in the length of the building’s sunshade, the total number of thermally uncomfortable hours indoors first decreases and then increases. The overall impact of the sunshade length on the building is relatively small. The first-floor and second-floor spaces are both minimally affected by the length of the sunshade. As the length of the sunshade increases, construction costs also show an upward trend. On the one hand, as shown in Figure 9b, when the shading length is 0.6 m, the overall construction cost is the lowest, whereas at a shading length of 2.0 m, the cost is the highest, representing an increase of 8.2% compared with the former. On the other hand, the construction cost per unit area increases with the length of the sunshade, with a maximum difference of 70.14 yuan/m2. It should be noted that the building eaves shading method involves extending the length of the building floor slab to provide shade so that as the length of the shade increases, the overall construction cost increases significantly.
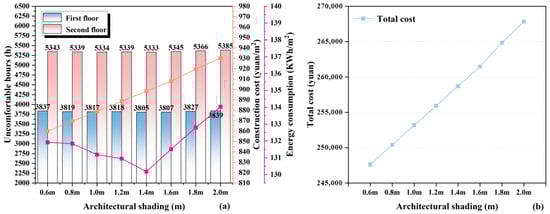
Figure 9.
Impact of building shading on: (a) building energy consumption, thermal comfort, and unit area cost; (b) total cost.
3.1.5. Window-to-Wall Ratio
Double-Sided Window-to-Wall Ratio
As shown in Figure 10a, as the bidirectional window-to-wall ratio increases, both building energy consumption and the total number of hours of indoor thermal discomfort increase accordingly. When the window-to-wall ratio increased from 0.15 to 0.85, the total number of thermally uncomfortable hours indoors increased by 506 h. One of the floors was most affected, with an increase of 503 h, while the second floor was relatively less affected, with only a 3 h increase in the number of thermally uncomfortable hours. At the same time, for every 0.1 increase in the window-to-wall ratio, the overall construction cost increases by approximately 1592 yuan. When the window-to-wall ratio is 0.15, the overall construction cost is the lowest, whereas at a ratio of 0.85, the cost is the highest, representing an increase of 4.7% compared with the former. The construction cost per unit area increases as the window-to-wall ratio increases, with a maximum difference of 38.63 yuan/m2. Compared to the baseline model, the window-to-wall ratio of 0.15 achieves the highest energy efficiency of 5.9%, the highest reduction in total thermally uncomfortable hours of 0.8%, and the highest reduction in overall construction costs and unit area construction costs of 0.8%.
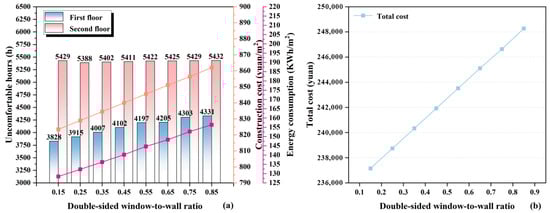
Figure 10.
Impact of two-way window-to-wall ratio on: (a) building energy consumption, thermal comfort, and unit area cost; (b) total cost.
Single-Direction Window-to-Wall Ratio
The effect of the one-way window-to-wall ratio on building energy consumption is shown in Figure 11a. When the north-facing window-to-wall ratio remains constant, an increase in the south-facing window-to-wall ratio leads to higher building energy consumption. At this point, the heat gained from the outside environment is less than the heat lost, resulting in a 16.1 KWh/m2 increase in building energy consumption for a 0.85 south-facing window-to-wall ratio compared to a 0.15 south-facing window-to-wall ratio. When the south-facing window-to-wall ratio is kept constant at 0.35 and only the north-facing ratio is varied, the building energy consumption increases rapidly with the growth of the north-facing ratio. At a ratio of 0.85, the building energy consumption is 16% higher than that at a ratio of 0.15.
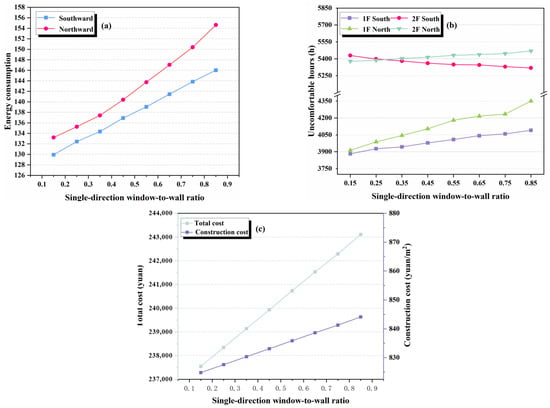
Figure 11.
Impact of unidirectional window-to-wall ratio on various metrics: (a) building energy consumption; (b) hours of thermal discomfort; (c) construction costs.
When the north-facing window-to-wall ratio remains constant, as shown in Figure 11b, as the south-facing window-to-wall ratio increases from 0.15 to 0.85, the total number of thermally uncomfortable hours indoors increases by 99 h. When the south-facing window-to-wall ratio remains unchanged, as the north-facing window-to-wall ratio increases from 0.15 to 0.85, the total number of thermally uncomfortable hours indoors increases by 528 h. The first-floor space was affected more than the second-floor space.
The effect of the one-way window-to-wall ratio on the two construction costs is shown in Figure 11c. As the window-to-wall ratio increases, construction costs gradually rise (south-facing and north-facing windows differ only in orientation; their overall construction costs and construction costs per unit area are the same). When the window-to-wall ratio is 0.15, the overall construction cost is the lowest, whereas at a ratio of 0.85, the cost is the highest, representing an increase of 2.3% compared with the former. At the same time, the construction cost per unit area increases as the window-to-wall ratio increases, with a maximum difference of 19.31 yuan/m2.
3.1.6. Additional Sunroom
As shown in Figure 12a, as the depth of sunlight penetration increases, the energy consumption of buildings gradually decreases. The building energy consumption of a 1.6 m sunspace is 6.9% lower than that of a 0.6 m sunspace. Additional sunrooms play a significant role in reducing heating energy consumption in modern residential buildings. This is because, during winter, additional sunrooms can serve as buffer spaces to resist cold air from outside, receive more solar radiation, increase indoor temperature, and slow down the rate of indoor temperature decline at night. As the depth of the additional sunspace increases from 0.6 m to 1.6 m, the thermal discomfort hours in both the first and second floors are reduced, with the improvement being more pronounced on the first floor than on the second. As the depth of the additional sunroom increases, the overall construction cost rises, while the construction cost per unit area decreases. When the sunspace depth is 0.6 m, the overall construction cost is the lowest, whereas at a depth of 1.6 m, the cost is the highest, with the former being 7.5% lower than the latter. A decreasing trend is observed in the unit construction area.
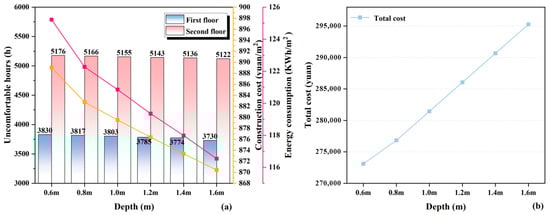
Figure 12.
Impact of additional inter-sunlight depth on: (a) building energy consumption, thermal comfort, and unit area cost; (b) total cost.
3.1.7. Exterior Envelope
As shown in Figure 13a, as the thickness of the external wall insulation material increases, the energy consumption of the building gradually decreases. It can be seen that within a certain range, increasing the thickness of insulation boards has a significant energy-saving effect. As the thickness of roof insulation materials increases, building energy consumption gradually decreases. Compared with the energy consumption of the benchmark model building, the energy consumption value has decreased significantly. This is because adding roof insulation materials and changing the thickness of roof insulation materials greatly reduces cooling energy consumption in summer, especially in two-storey buildings. As the type of exterior windows changes, the K-value of the exterior windows decreases, leading to a reduction in building energy consumption. The building energy consumption for window type ① is 124.0 KWh/m2, and for window type ⑥, it is 119.1 KWh/m2. The window K-value decreases from 3.6 W/(m2·K) to 2.4 W/(m2·K), resulting in a reduction of 4.8 KWh/m2 in building energy consumption.
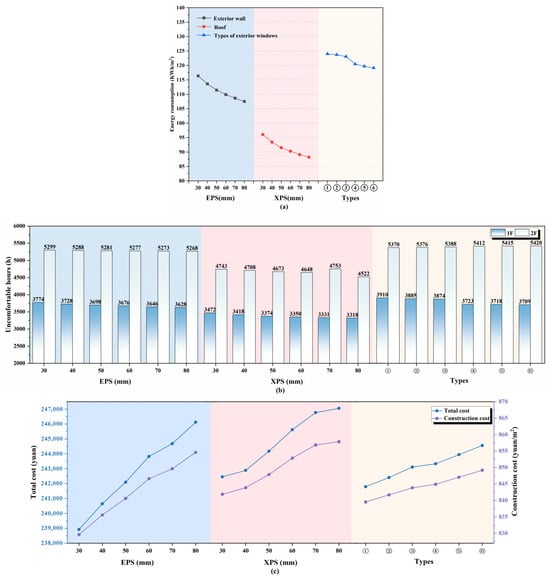
Figure 13.
Effect of external wall insulation EPS, roof insulation XPS, and external window insulation on: (a) building energy consumption; (b) thermally uncomfortable hours; (c) total cost.
The sum of interior thermal discomfort hours decreases when the thickness of the exterior EPS boards increases, as seen in Figure 13b. As the thickness of the XPS board insulation rose, the number of hours that people felt thermally uncomfortable indoors decreased significantly. With an increase in thickness from the additional insulation, the second floor space—the top floor of the house—saw a significant reduction in indoor thermally uncomfortable hours, with a maximum reduction of 221 h. The ground floor space saw a maximum reduction of 154 h in thermally uncomfortable hours. The number of indoor hours of thermal discomfort decreased with the change in the type of external window, and the total number of hours of thermal discomfort decreased by 151 h when the type of external window was changed from 6 transparent + 6 air + 6 transparent to 6 high transmittance Low-E + 12 air + 6 transparent. The change in the type of external windows had a significant effect on the ground floor space, with a maximum decrease of 201 h in the number of thermally uncomfortable hours, and a negative effect on the second floor space, with a maximum increase of 50 h in the number of thermally uncomfortable hours. The reason for this is that when the type of external windows is changed, the K-value of the windows decreases. This means that even though the second-floor space’s thermal insulation capacity increases, less solar radiation is emitted into it during the winter months. Additionally, the increase in solar radiation is less than the heat dissipated from the roof, so the number of thermally uncomfortable hours spent indoors increases as the K value decreases.
Figure 13c shows that with the increase in EPS board thickness, the overall construction cost exhibits an upward trend. The construction cost per unit area increases with thickness, with a maximum difference of 25.00 yuan/m2. As the thickness of the XPS board increases, so does the construction cost. On the one hand, at an XPS board thickness of 30 mm, the overall construction cost is 1.8% lower than that at 80 mm. On the other hand, the construction cost per unit area increases with thickness, with a maximum difference of 16.00 yuan/m2. As the type of exterior windows changes, construction costs rise accordingly. The overall construction cost of the 6 transparent + 6 air + 6 transparent window type is 1.1% lower than that of the 6 high-transparency Low-E + 12 air + 6 transparent type. The maximum difference in construction cost per unit area is 9.63 yuan/m2.
3.1.8. Level of Impact
In this study, a threshold of 5% was used to screen out the individual metrics that were more efficient than 5% in optimising the building’s operational energy consumption, indoor thermal comfort and construction cost per unit area, as shown in Figure 14. Among them, there are seven metrics for optimising the building’s operational energy consumption: roof insulation thickness, external wall insulation thickness, indoor headroom, external window type, form factor, additional sunroom and bi-directional window-to-wall ratio; two metrics for optimising indoor thermal comfort—roof insulation thickness and additional sunroom; and three metrics for optimising the construction cost per unit area—form factor, indoor headroom and bi-directional window-to-wall ratio. Combining the above metrics, a total of seven effective metrics were screened out after taking the concatenation set: roof insulation thickness, external wall insulation thickness, net interior height, external window type, body shape factor, additional sunroom, and two-way window-to-wall ratio. Among these factors, there is a contradiction between the bidirectional window-to-wall ratio and the depth of the additional sunroom. It was decided to remove the bi-directional window-to-wall ratio since the additional sunroom was optimised more efficiently than the bi-directional window-to-wall ratio. In the end, six metrics for integrated optimisation were selected.
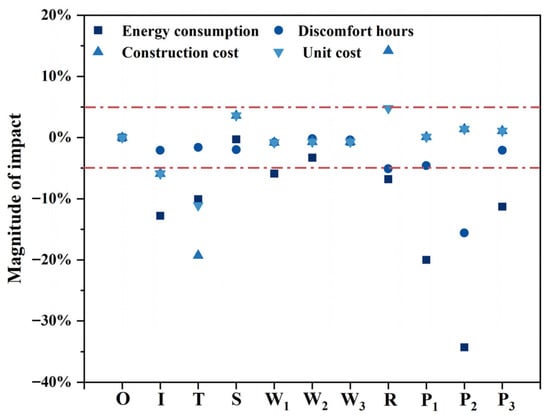
Figure 14.
Level of impact of a single strategy on each metric.
3.2. Multi-Metric Simulation
3.2.1. Data Analysis
After the six metrics were screened, the results of the orthogonal tests were analysed for the building’s operational energy consumption, the total number of indoor hours of thermal discomfort, and the construction costs, as detailed in Appendix D, Appendix E and Appendix F. The orthogonal test results of the building’s operational energy consumption of each factor in descending order of influence are roof insulation thickness, exterior wall insulation thickness, interior clear height, additional sunroom depth, ratio, and exterior window type. The results of the orthogonal test for the total number of indoor thermal discomfort hours were ranked in order of the magnitude of the extreme differences from largest to smallest: external window type, roof insulation thickness, ratio, net interior height, external wall insulation thickness, and additional sunroom depth. The results of the orthogonal test of construction costs were ranked in descending order as ratio, net interior height, exterior wall insulation thickness, additional sunroom depth, exterior window type, and roof insulation thickness. As can be seen from the results of the orthogonal tests of the three metrics with the ranking of the efficiency of optimisation of each metric, the ranking of the impact of the single strategy on each metric changes when all the single metrics are put into a single dwelling for calculation and analysis.
3.2.2. Multi-Metric Calculations and Analyses
In the results of single-metric calculations, the optimal solution to the building’s operational energy consumption (KWh/m2) is ; the optimal solution to the number of indoor thermal discomfort hours (h) is ; the optimal solution to the construction cost per unit area (yuan/m2) is . The optimal scheme of the three metrics was calculated using matrix analysis [61,62], and the weight matrices of the three investigated metrics affecting the test results (W-I, W-II, W-III) were calculated separately.
From the above calculations, the order of influence of each factor on the index value of the orthogonal test (primary → secondary) is EFBDAC; factors A1, B1, C1, D4, E5, and F3 have the highest weights, and the optimal solution for the orthogonal test is A1B1C1D4E5F3. The optimised design solution with multiple metrics is not included in the 25 orthogonal test scenarios, so it needs to be simulated separately, and Table 5 shows the comparison of various information between the optimised solution with multiple metrics and the baseline model. The operational energy consumption of the optimised scheme building is reduced from 134.34 KWh/m2 to 46.66 KWh/m2 compared to the baseline model building, a reduction of 65.26%. The total number of hours of indoor thermal discomfort was reduced from 9327 h to 6602 h, a decrease of 29.22%. Compared to the construction cost of the baseline model, after optimisation, the overall construction cost of the scheme is 242,253.53 yuan, up 1.3%.
Table 5.
Comparison of the optimisation scheme with the benchmark model.
4. Discussion
4.1. Characteristics of Rural Dwellings
In terms of building materials, rural residential buildings mostly use locally sourced materials, which reduces transportation costs and makes the buildings more harmonious with the local environment. However, this also means that the rural economy is mainly dependent on agriculture and natural resources, with traditional fuels (such as coal and firewood) still accounting for a large proportion of rural energy consumption, representing 32.3% of total energy consumption and 42.8% of production energy consumption in China. In rural areas, although some residents are conscious of conserving electricity and use natural ventilation to regulate indoor temperatures without over-relying on air conditioners and other electrical appliances, the overall effect on building energy efficiency and thermal comfort is not significant. It is necessary to provide practical technical support to guide residents in improving their energy use and housing construction methods.
Unlike previous studies [60,63], this paper incorporates rural economic conditions into the optimisation criteria from the outset, taking into account construction costs, building energy consumption, and living thermal comfort. The construction cost of the design is considered an important factor in the evaluation, with the aim of increasing the likelihood of the design being adopted by rural builders. The optimisation methods include three metrics (building energy consumption, indoor thermal comfort, and construction costs) and six building optimisation metrics, comprehensively considering factors such as the human environment, economic development, architectural design, and energy consumption.
4.2. Representativeness and Limitations of the Study
In this study, a design method specifically tailored to rural residential construction is proposed rather than a complete model. The primary aim of this method is to provide a simple and transparent approach that enables designers to achieve a balance among cost, energy consumption, and thermal comfort, thereby arriving at an optimised design solution. Compared to urban architectural design methods, the approach used in this study places greater emphasis on practicality and applicability. In rural areas, the feasibility of data-driven or machine learning methods is often constrained due to the lack of large-scale sample datasets and long-term monitoring records. Local participants typically have limited access to experts or the ability to utilise complex analytical models. Furthermore, other weighting methods, which rely on expert judgement and feedback, encounter resource limitations and technical barriers in practical applications. In contrast, the orthogonal matrix method does not depend on expert opinions or iterative processes, making it more suitable for rural application scenarios with limited sample sizes and lower metric complexity. The choice of the orthogonal weighting method reflects its computational simplicity and conceptual clarity, which make it particularly suitable for self-builders in rural areas with limited technical resources and expertise. This approach is not intended to compete with the high-precision optimisation metrics commonly employed in urban housing design; rather, it responds to the distinctive characteristics of rural construction practices and offers a more feasible solution for such contexts.
Orthogonal experimental design and matrix analysis are two commonly used analytical methods, but they have certain limitations when applied to the analysis of rural housing. The actual situation of rural housing is complex and variable, with many factors interacting in complex ways that are difficult to control fully. Furthermore, the use and maintenance of rural housing is a dynamic process, and some performance characteristics may change over time. When applying these two methods, further field verification is required, along with regular updates to data and models to reflect actual changes in rural housing. However, considering that energy efficiency and thermal comfort issues are generally more severe in rural residential buildings, the renovation objectives are not aimed at extreme optimisation. Compared to urban residential buildings, the optimisation of rural residential buildings must balance feasibility and technical barriers. Therefore, the orthogonal matrix method adopted in this study can meet the basic design analysis requirements.
The significance of this study extends beyond the Chinese context. In Vietnam [64], the typical “tube house” is characterised by a narrow frontage and deep floor plan, where ventilation and external shading play a decisive role in performance optimisation. By contrast, rural dwellings in Alaska [65] rely on base designs with highly insulated envelopes and heating-dominated operation. These cases illustrate that rural housing differs substantially across regions in terms of spatial patterns and baseline assumptions. Therefore, the method proposed here requires a localised base design when applied elsewhere. Nevertheless, by prioritising simplicity and practicality, the framework developed in this study remains adaptable and can provide valuable guidance for rural builders worldwide who lack access to professional design expertise. This study does not address maintenance practices and material degradation during long-term use, mainly because systematic monitoring data on rural dwellings are currently lacking and difficult to quantify. Future research may focus more on the whole life-cycle performance of buildings in terms of energy consumption and durability, in order to complement and refine the energy-saving design metrics proposed in this study. The benchmark model constructed in this study is based on field survey data from Hebi City, Henan Province. Its applicability is limited to a certain extent by specific geographical and climatic conditions, but the proposed method is scalable. By introducing parameters that adjust for regional construction practices and climatic characteristics, it is possible to develop further optimised metrics that are adapted to local conditions.
5. Conclusions
This study proposed a building performance optimisation method for self-built rural houses in cold regions, combining matrix analysis with DesignBuilder 6.1 simulations. The optimisation objectives covered three key metrics: building operational energy consumption, indoor thermal comfort, and construction cost, with multi-objective analysis used to identify the optimal configuration scheme. The results indicate that, at the level of individual metrics, roof insulation (P2) ranked first in reducing both operational energy consumption and annual thermal discomfort hours, while the form factor had the greatest influence on both overall and unit construction costs. This suggests that, when energy consumption and cost are the primary considerations, roof insulation and the form factor should be prioritised. Further screening and analysis revealed that when individual metrics were applied collectively within the same dwelling, the ranking of their influence on different metrics showed noticeable changes.
More importantly, with only a 1.3% increase in construction cost, the optimised scheme can reduce annual thermal discomfort hours by 29.22% and building energy consumption by 65.26%. This demonstrates that, by reasonably adjusting key parameters and applying the approach proposed in this study, it is possible to enhance thermal comfort and energy efficiency effectively without imposing a significant economic burden, in line with the construction needs of rural areas. Furthermore, the findings also carry practical value: for local governments, they can serve as a reference in formulating rural housing policies and technical standards; for rural builders and communities, they provide an applicable design method that helps improve housing quality while keeping costs under control.
Author Contributions
Conceptualisation, M.L. and Z.F.; methodology, Z.X.; software, Z.X.; validation, H.S., L.Y. and Y.L.; formal analysis, L.Y.; investigation, Z.X.; resources, M.L.; data curation, L.Y.; writing—original draft preparation, Z.F.; writing—review and editing, L.Y.; visualisation, K.Z.; supervision, M.L.; project administration, M.L.; funding acquisition, M.L. All authors have read and agreed to the published version of the manuscript.
Funding
This research was funded by the Henan Provincial Philosophy and Social Sciences Planning Annual Project, grant number 2024BZH00045.
Institutional Review Board Statement
This study was exempt from ethical review and approval by the Institutional Review Board of the North China University of Water Resources and Electric Power because it involved minimal risk to participants, and the research involved solely anonymous surveys where the data cannot be linked to the identity of the subjects.
Informed Consent Statement
Informed consent was obtained from all subjects involved in the study.
Data Availability Statement
Data are contained within the article.
Acknowledgments
We are glad to give our special thanks to the villagers and interviewees who helped us during the survey.
Conflicts of Interest
The authors declare no conflicts of interest.
Appendix A
Table A1.
Parameter values.
Table A1.
Parameter values.
| Convective Heat Transfer Coefficient [W/(m2·K)] | Radiant Heat Transfer Coefficient [W/(m2·K)] | |
|---|---|---|
| Indoor side | 2 | 5 |
| Outdoor side | 20 | 5 |
Appendix B. Matrix Formulae (A1)–(A5)
Appendix C
Table A2.
Orthogonal test design table.
Table A2.
Orthogonal test design table.
| Number | Factor | |||||
|---|---|---|---|---|---|---|
| 01 | ||||||
| 02 | ||||||
| 03 | ||||||
| 04 | ||||||
| 05 | ||||||
| 06 | ||||||
| 07 | ||||||
| 08 | ||||||
| 09 | ||||||
| 10 | ||||||
| 11 | ||||||
| 12 | ||||||
| 13 | ||||||
| 14 | ||||||
| 15 | ||||||
| 16 | ||||||
| 17 | ||||||
| 18 | ||||||
| 19 | ||||||
| 20 | ||||||
| 21 | ||||||
| 22 | ||||||
| 23 | ||||||
| 24 | ||||||
| 25 | ||||||
Appendix D
Table A3.
Results and analysis of orthogonal tests on energy consumption in building operations.
Table A3.
Results and analysis of orthogonal tests on energy consumption in building operations.
| Average Building Energy Consumption (KWh/m2) | Factor | |||||
|---|---|---|---|---|---|---|
| A | B | C | D | E | F | |
| 42.98 | 47.77 | 47.15 | 48.75 | 50.11 | 47.71 | |
| 43.84 | 46.04 | 46.75 | 45.99 | 46.85 | 45.58 | |
| 45.14 | 45.16 | 45.49 | 45.17 | 44.90 | 45.11 | |
| 46.90 | 44.06 | 44.35 | 43.76 | 42.84 | 43.37 | |
| 47.61 | 43.43 | 42.72 | 42.80 | 41.77 | 44.69 | |
| 4.63 | 4.34 | 4.43 | 5.95 | 8.34 | 3.02 | |
| Order of importance of factors | E > D > A > C > B > F | |||||
| Best option | ||||||
| Worst-case scenario | ||||||
Appendix E
Table A4.
Results and analysis of orthogonal tests on the total number of hours of indoor thermal discomfort.
Table A4.
Results and analysis of orthogonal tests on the total number of hours of indoor thermal discomfort.
| Total Hours of Thermal Discomfort (h) | Factor | |||||
|---|---|---|---|---|---|---|
| A | B | C | D | E | F | |
| 6195 | 6679 | 6455 | 6539 | 6824 | 6966 | |
| 6266 | 6584 | 6358 | 6397 | 6444 | 6611 | |
| 6324 | 6337 | 6363 | 6368 | 6319 | 6049 | |
| 6440 | 6167 | 6327 | 6241 | 6128 | 6206 | |
| 6591 | 6048 | 6313 | 6270 | 6100 | 5984 | |
| 396 | 631 | 142 | 298 | 724 | 982 | |
| Order of importance of factors | F > E > B > A > D > C | |||||
| Best option | ||||||
| Worst-case scenario | ||||||
Appendix F
Table A5.
Results and analysis of orthogonal tests on construction costs.
Table A5.
Results and analysis of orthogonal tests on construction costs.
| Construction Cost Per Unit Area (yuan/m2) | Factor | |||||
|---|---|---|---|---|---|---|
| A | B | C | D | E | F | |
| 915.25 | 967.18 | 933.57 | 914.47 | 919.86 | 918.88 | |
| 918.67 | 948.74 | 931.42 | 928.41 | 922.93 | 928.32 | |
| 925.06 | 923.17 | 932.73 | 926.76 | 927.53 | 926.05 | |
| 933.81 | 906.51 | 921.34 | 931.52 | 933.65 | 928.76 | |
| 943.24 | 890.45 | 916.98 | 934.88 | 932.07 | 934.03 | |
| 27.99 | 76.73 | 16.59 | 20.41 | 13.79 | 15.15 | |
| Order of importance of factors | B > A > D > C > F > E | |||||
| Best option | ||||||
| Worst-case scenario | ||||||
References
- Jia, C.; Zhang, Z.; Wang, M.; Han, S.; Cao, J.; Rong, Y.; Du, C. Investigation on indoor thermal environment of industrial heritage during the cooling season and its impacts on thermal comfort. Case Stud. Therm. Eng. 2023, 52, 103769. [Google Scholar] [CrossRef]
- Liu, Q.; Ma, S.; Guo, Y.; Yan, Y.; Xu, X. Research on the coupling relationship between energy consumption and architectural form design of university dormitory buildings under the target of low energy consumption. Energy Build. 2025, 337, 115664. [Google Scholar] [CrossRef]
- Costa, A.; Keane, M.M.; Torrens, J.I.; Corry, E. Building operation and energy performance: Monitoring, analysis and optimisation toolkit. Appl. Energy 2013, 101, 310–316. [Google Scholar] [CrossRef]
- Mannan, M.; Al-Ghamdi, S.G. Indoor air quality in buildings: A comprehensive review on the factors influencing air pollution in residential and commercial structure. Int. J. Environ. Res. Public Health 2021, 18, 3276. [Google Scholar] [CrossRef] [PubMed]
- Wang, C.; Hou, M.; Yao, W.; Gao, W.; Jia, F.; Wang, T. Research on indoor thermal environment evaluation and thermal adaptation in winter of Japanese wood-framed detached houses. Case Stud. Therm. Eng. 2024, 55, 104126. [Google Scholar] [CrossRef]
- Delgarm, N.; Sajadi, B.; Delgarm, S. Multi-objective optimization of building energy performance and indoor thermal comfort: A new method using artificial bee colony (ABC). Energy Build. 2016, 131, 42–53. [Google Scholar] [CrossRef]
- Hu, Z.; Li, Y.; Long, H.; Kang, C. The evolution of China’s rural depopulation pattern and its influencing factors from 2000 to 2020. Appl. Geogr. 2023, 159, 103089. [Google Scholar] [CrossRef]
- Zhu, Y.; He, Y.; Zhou, Q. Impact of multi-energy complementary system on carbon emissions: Insights from a rural building in Shangluo City, China. Energy Convers. Manag. 2025, 327, 119595. [Google Scholar] [CrossRef]
- He, B.-J.; Yang, L.; Ye, M.; Mou, B.; Zhou, Y. Overview of rural building energy efficiency in China. Energy Policy 2014, 69, 385–396. [Google Scholar] [CrossRef]
- Building Energy Research Center of Tsinghua University. Comparison of Energy Consumption and Carbon Emissions from Building Operation Between China and Other Countries. In Decarbonize Urban Heating System: China Building Energy and Emission Yearbook 2023; Springer: New York, NY, USA, 2023; pp. 27–40. [Google Scholar]
- Berardi, U. A cross-country comparison of the building energy consumptions and their trends. Resour. Conserv. Recycl. 2017, 123, 230–241. [Google Scholar] [CrossRef]
- Tahsildoost, M.; Zomorodian, Z. Energy, carbon, and cost analysis of rural housing retrofit in different climates. J. Build. Eng. 2020, 30, 101277. [Google Scholar] [CrossRef]
- Yetiskul, E.; Aydın, N.; Gökçe, B. Governing the rural: The case of Izmir (Turkey) in the Post-2000 era. J. Rural Stud. 2021, 88, 262–271. [Google Scholar] [CrossRef]
- Seo, D.; Kwon, Y. In-Migration and Housing Choice in Ho Chi Minh City: Toward Sustainable Housing Development in Vietnam. Sustainability 2017, 9, 1738. [Google Scholar] [CrossRef]
- Kowaltowski, D.C.C.K. Aesthetics and self-built houses: An analysis of a Brazilian setting. Habitat Int. 1998, 22, 299–312. [Google Scholar] [CrossRef]
- Efficiency, C. Research Report of China Building Energy Consumption and Carbon Emissions. Architecture 2022, 2023, 57–69. [Google Scholar]
- Evans, M.; Yu, S.; Song, B.; Deng, Q.; Liu, J.; Delgado, A. Building energy efficiency in rural China. Energy Policy 2014, 64, 243–251. [Google Scholar] [CrossRef]
- Gao, Y.; Chi, J.; Luo, S.; Ke, H.; Yuan, J.; Yue, X. Multi objective optimization technical framework for passive energy-saving design of rural residential buildings in Tianjin based on Octopus+ Honeybee. J. Xi’an Univ. Technol. 2021, 37, 488–497. [Google Scholar]
- Hu, X.; Xiang, Y.; Zhang, H.; Lin, Q.; Wang, W.; Wang, H. Active–passive combined energy-efficient retrofit of rural residence with non-benchmarked construction: A case study in Shandong province, China. Energy Rep. 2021, 7, 1360–1373. [Google Scholar] [CrossRef]
- Zhang, L.; Guo, S.; Wu, Z.; Alsaedi, A.; Hayat, T. SWOT analysis for the promotion of energy efficiency in rural buildings: A case study of China. Energies 2018, 11, 851. [Google Scholar] [CrossRef]
- Zhang, T.; Li, Z.; Zhang, Z.; Chen, Y.; Sun, X. Machine learning-based energy consumption models for rural housing envelope retrofits incorporating uncertainty: A case study in Jiaxian, China. Case Stud. Therm. Eng. 2025, 72, 106253. [Google Scholar] [CrossRef]
- Jiang, W.; Liu, B.; Li, Q.; Li, D.; Ma, L. Weight of energy consumption parameters of rural residences in severe cold area. Case Stud. Therm. Eng. 2021, 26, 101131. [Google Scholar] [CrossRef]
- Wu, W.; Guo, J.; Li, J.; Hou, H.; Meng, Q.; Wang, W. A multi-objective optimization design method in zero energy building study: A case study concerning small mass buildings in cold district of China. Energy Build. 2018, 158, 1613–1624. [Google Scholar] [CrossRef]
- Wu, D.; Zhang, T.; Zhang, J.; Lv, H.; Yue, C.; Fu, M. Sensitivity analysis and multiobjective optimization for rural house retrofitting considering construction and occupant behavior uncertainty: A case study of Jiaxian, China. Appl. Energy 2024, 360, 122835. [Google Scholar] [CrossRef]
- Yang, H.; Xu, Z.; Shi, Y.; Tang, W.; Liu, C.; Yunusa-Kaltungo, A.; Cui, H. Multi-objective optimization designs of phase change material-enhanced building using the integration of the Stacking model and NSGA-III algorithm. J. Energy Storage 2023, 68, 107807. [Google Scholar] [CrossRef]
- Shi, G.; Yao, S.; Song, J.; Bi, W.; Qin, G.; Ni, P. Multi-performance collaborative optimization of existing residential building retrofitting in extremely arid and hot climate zone: A case study in Turpan, China. J. Build. Eng. 2024, 89, 109304. [Google Scholar] [CrossRef]
- Yao, S.; Wu, Y.; Ni, X.; Zhao, S.; Wu, X.; Li, M. Optimization design of rural residences in severe cold zone of China weighing the dual-control objectives of life cycle carbon emission and economic cost. Energy Build. 2025, 328, 115156. [Google Scholar] [CrossRef]
- Liu, R.; Wang, G.; Deng, Q. Multi-objective optimization of rural residential envelopes in cold regions of China based on performance and economic efficiency. Case Stud. Therm. Eng. 2024, 61, 104937. [Google Scholar] [CrossRef]
- GB 50178-93; Building Climate Zoning Standards. China Architecture and Building Press: Beijing, China, 2025.
- Amani, N. Energy efficiency of residential buildings using thermal insulation of external walls and roof based on simulation analysis. Energy Storage Sav. 2024, 4, 48–55. [Google Scholar] [CrossRef]
- Xu, Y.; Wang, M.; Xu, Y.; Li, X.; Wu, Y.; Chi, F.A. Evaluation System Creation and Application of “Zero-Pollution Village” Based on Combined FAHP-TOPSIS Method: A Case Study of Zhejiang Province. Sustainability 2023, 15, 12367. [Google Scholar] [CrossRef]
- Chen, L. How to combine catalogue and stratified sampling in construction statistics. Shanghai Stat. 1996, 4, 14–17. Available online: https://www.cnki.com.cn/Article/CJFDTotal-SHTJ199604006.htm (accessed on 29 October 2024).
- Zhang, G. The application of stratified random sampling in audit. Audit Mon. 2013, 8, 1. Available online: https://www.cnki.com.cn/Article/CJFDTotal-SJYK201308017.htm (accessed on 18 October 2024).
- GB 5015-2021; General Code for Energy Efficiency and Renewable Energy Application in Buildings. China Architecture and Building Press: Beijing, China, 2021.
- GB55016-2021; Chinese National Standard, General Code for Building Environment. China Architecture and Building Press: Beijing, China, 2021.
- GB 50176-2016; Code for Thermal Design of Civil Buildings. China Architecture and Building Press: Beijing, China, 2016.
- GB/T 50824-2013; Design Standard for Energy Efficiency of Rural Residential Buildings. China Architecture Publishing & Media Co., Ltd.: Beijing, China, 2013.
- GB 50096-2011; Residential Design Code. Ministry of Housing and Urban-Rural Development: Beijing, China, 2011.
- JGJ26—95; Energy Efficiency Design Standards for Civil Buildings. Ministry of Housing and Urban-Rural Development of the People Republic of China: Beijing, China, 1995.
- GB 50495-2019; Technical Standard for Solar Heating System. Ministry of Housing and Urban-Rural Development of the People Republic of China: Beijing, China, 2019.
- Spark, W. Climate and Average Weather Year Round in Hebi. Available online: https://zh.weatherspark.com/ (accessed on 18 December 2024).
- Ebert, J.F.; Huibers, L.; Christensen, B.; Christensen, M.B. Paper- or Web-Based Questionnaire Invitations as a Method for Data Collection: Cross-Sectional Comparative Study of Differences in Response Rate, Completeness of Data, and Financial Cost. J. Med. Internet Res. 2018, 20, e24. [Google Scholar] [CrossRef]
- China, NBSO. Households’ Income and Consumption Expenditure in 2024 of the People’s Republic of China. Available online: https://www.stats.gov.cn/english/PressRelease/202501/t20250124_1958443.html (accessed on 12 October 2024).
- Hussainzad, E.A.; Gou, Z. Exploring the impact of demographic, architectural, and well-being factors on health outcomes in informal settlements: The role of daylight, window depth, and building orientation. Wellbeing Space Soc. 2025, 8, 100242. [Google Scholar] [CrossRef]
- Yoshino, H.; Murakami, S.; Akabayashi, S.; Kurabuchi, T.; Kato, S.; Tanabe, S.; Adachi, M. Survey on minimum ventilation rate of residential buildings in fifteen countries. In Proceedings of the 25th AIVC Conference-Ventilation and retrofitting, Prague, Czech Republic, 15–17 September 2004; pp. 227–238. [Google Scholar]
- Hesaraki, A.; Holmberg, S. Demand-controlled ventilation in new residential buildings: Consequences on indoor air quality and energy savings. Indoor Built Environ. 2015, 24, 162–173. [Google Scholar] [CrossRef]
- Zhang, T.; Duan, Y.; Jiao, Z.; Ye, X.; Hu, Q.; Fukuda, H.; Gao, W. Towards Improving Rural Living Environment for Chinese Cold Region Based on Investigation of Thermal Environment and Space Usage Status. Buildings 2022, 12, 2139. [Google Scholar] [CrossRef]
- Henan Provincial Engineering Cost Information Network. Henan Province Construction Engineering Material Price Information, January–February 2022 [EB/OL]. Available online: http://www.hncost.com/ (accessed on 14 November 2023).
- Chi, F.A.; Wang, Y.; Wang, R.; Li, G.; Peng, C. An investigation of optimal window-to-wall ratio based on changes in building orientations for traditional dwellings. Sol. Energy 2020, 195, 64–81. [Google Scholar] [CrossRef]
- Dai, J.; Wang, J.; Bart, D.; Gao, W. The impact of building enclosure type and building orientation on indoor thermal comfort—A case study of Kashgar in China. Case Stud. Therm. Eng. 2023, 49, 103291. [Google Scholar] [CrossRef]
- Li, G.; Sun, C.; Sang, M.; Chen, S.; Li, J.; Han, Y.; Xu, S. The synergistic effect of multiple design factors on building energy consumption of office blocks: A case study of Wuhan, China. J. Build. Eng. 2024, 95, 110200. [Google Scholar] [CrossRef]
- Ahmad, A.; Bande, L.; Ahmed, W.; Young, K.; Jha, M. AI application in architecture in UAE: Application of an advanced optimized shading structure as a retrofit strategy of a midrise residential building façade in downtown Abu Dhabi. Energy Build. 2024, 325, 114995. [Google Scholar] [CrossRef]
- Xie, X.; Xu, B.; Fei, Y.; Chen, X.-N.; Pei, G.; Ji, J. Passive energy-saving design strategy and realization on high window-wall ratio buildings in subtropical regions. Renew. Energy 2024, 229, 120709. [Google Scholar] [CrossRef]
- Tian, H.; Ma, L.; Li, Q.; Li, D.; Jiang, W.; Zhang, X.; Hu, H.; Han, Y. Energy saving retrofit of rural house based on the joint utilization of solar collector and attached sunspace. Energy Build. 2023, 299, 113591. [Google Scholar] [CrossRef]
- Fu, H.; Ding, Y.; Li, M.; Cao, Y.; Xie, W.; Wang, Z. Research and simulation analysis of thermal performance and hygrothermal behavior of timber-framed walls with different external thermal insulation layer: Cork board and anticorrosive pine plate. J. Build. Phys. 2021, 45, 180–208. [Google Scholar] [CrossRef]
- Moore, T.V.; Cruickshank, C.A.; Beausoleil-Morrison, I.; Lacasse, M. Thermal evaluation of a highly insulated steel stud wall with vacuum insulation panels using a guarded hot box apparatus. J. Build. Phys. 2021, 45, 303–322. [Google Scholar] [CrossRef]
- Cao, L.; Li, T.; Wang, F. Heat insulation and thermal insulation method of passive low energy consumption residential building exterior envelope structure based on BIM. Results Eng. 2024, 23, 102734. [Google Scholar] [CrossRef]
- Hu, S.; Ran, M.Y.; Yuan, J.J.; Li, J. Discussion on Shading Optimization Design for Residential Buildings. Build. Sci. 2010, 26, 88–91. [Google Scholar] [CrossRef]
- Liu, H.; Du, Z.; Xue, T.; Jiang, T. An integrated artificial intelligence-driven approach to multi-criteria optimization of building energy efficiency and occupants’ comfort: A case study. J. Build. Eng. 2025, 103, 111944. [Google Scholar] [CrossRef]
- Duan, Y.; Zhang, T.; Yang, Y.; Li, P.; Mo, W.; Jiao, Z.; Gao, W. A multi-objective approach to optimizing the geometry and envelope of rural dwellings for energy demand, thermal comfort, and daylight in cold regions of China: A case study of Shandong province. Energy Convers. Manag. 2024, 322, 119128. [Google Scholar] [CrossRef]
- Wang, K.; Kan, Y.; Zhu, Y.; Zhong, K.; Hu, J. Optimization of synthesis parameters for C-S-H/PCE nanocomposites: A comprehensive study using orthogonal experiments and multi-analysis approaches. Constr. Build. Mater. 2024, 417, 135332. [Google Scholar] [CrossRef]
- Leng, Y.; Hu, Y.; Xu, M.; Wu, T.; Liu, S.; Zhang, H.; Sun, N.; Liu, S. Effects of vacuum hot-pressed sintering parameters on the microstructures and mechanical properties and process optimization of TiB2p/Al7050 composites. J. Alloys Compd. 2023, 938, 168580. [Google Scholar] [CrossRef]
- Kurnitski, J.; Saari, A.; Kalamees, T.; Vuolle, M.; Niemelä, J.; Tark, T. Cost optimal and nearly zero energy performance requirements for buildings in Estonia. Est. J. Eng. 2013, 19, 183–202. [Google Scholar] [CrossRef]
- Le, V.T. Low Energy Housing for the Hot Humid Climate of Vietnam: The value of a Passive House Approach. Ph.D. Thesis, University of Huddersfield, Huddersfield, UK, 2021. [Google Scholar]
- Guillante, P.; Compton, A.; Gioppo, Z.; Raleigh, Q.; Kiesling, C.; Cooper, J.; Cetin, K.; Poleacovschi, C. Development of residential building archetype models for rural Alaskan communities. J. Build. Perform. Simul. 2025, 1–25. [Google Scholar] [CrossRef]


Disclaimer/Publisher’s Note: The statements, opinions and data contained in all publications are solely those of the individual author(s) and contributor(s) and not of MDPI and/or the editor(s). MDPI and/or the editor(s) disclaim responsibility for any injury to people or property resulting from any ideas, methods, instructions or products referred to in the content. |
© 2025 by the authors. Licensee MDPI, Basel, Switzerland. This article is an open access article distributed under the terms and conditions of the Creative Commons Attribution (CC BY) license (https://creativecommons.org/licenses/by/4.0/).