You are currently viewing a new version of our website. To view the old version click .
Sustainability
  • Article
  • Open Access

3 November 2025

PropNet-R: A Custom CNN Architecture for Quantitative Estimation of Propane Gas Concentration Based on Thermal Images for Sustainable Safety Monitoring

,
,
,
,
,
,
,
,
and
1
Departamento Académico de Ingeniería de Sistemas e Informática, Facultad de Ingeniería, Universidad Nacional Amazónica de Madre de Dios, Puerto Maldonado 17001, Peru
2
Departamento Académico de Ingeniería Estadística e Informática, Universidad Nacional del Altiplano-Puno, Puno 21001, Peru
3
Departamento de Mantenimiento Industrial, Universidad Tecnológica del Suroeste de Guanajuato, Valle de Santiago 38407, Mexico
*
Author to whom correspondence should be addressed.
This article belongs to the Special Issue Data-Driven Approaches and Decision Support Tools for Sustainable and Resilient Infrastructure Systems

Abstract

Liquefied petroleum gas (LPG), composed mainly of propane and butane, is widely used as an energy source in residential, commercial, and industrial sectors; however, its high flammability poses a critical risk in the event of accidental leaks. In Peru, where LPG constitutes the main domestic energy source, leakage emergencies affect thousands of households each year. This pattern is replicated in developing countries with limited energy infrastructure. Early quantitative detection of propane, the predominant component of Peruvian LPG (~60%), is essential to prevent explosions, poisoning, and greenhouse gas emissions that hinder climate change mitigation strategies. This study presents PropNet-R, a convolutional neural network (CNN) designed to estimate propane concentrations (ppm) from thermal images. A dataset of 3574 thermal images synchronized with concentration measurements was collected under controlled conditions. PropNet-R, composed of four progressive convolutional blocks, was compared with SqueezeNet, VGG19, and ResNet50, all fine-tuned for regression tasks. On the test set, PropNet-R achieved MSE = 0.240, R2 = 0.614, MAE = 0.333, and Pearson’s r = 0.786, outperforming SqueezeNet (MSE = 0.374, R2 = 0.397), VGG19 (MSE = 0.447, R2 = 0.280), and ResNet50 (MSE = 0.474, R2 = 0.236). These findings provide empirical evidence that task-specific CNN architectures outperform generic transfer learning models in thermal image-based regression. By enabling continuous and quantitative monitoring of gas leaks, PropNet-R enhances safety in industrial and urban environments, complementing conventional chemical sensors. The proposed model contributes to the development of sustainable infrastructure by reducing gas-related risks, promoting energy security, and strengthening resilient, safe, and environmentally responsible urban systems.

1. Introduction

Liquefied petroleum gas (LPG), composed primarily of propane and butane, is a byproduct of petroleum refining and natural gas processing, stored under pressure in liquid state to facilitate its transportation and use https://www.raspberrypi.com/products/raspberry-pi-4-model-b/ (accessed on 27 August 2025) []. Due to its efficiency and low cost, it is widely employed as a clean energy source in households, hotels, urban businesses, and as an alternative to conventional fossil fuels in transportation, contributing to the reduction of pollutant emissions [,,,,,,,,]. However, its highly flammable nature renders accidental leaks a threat to safety and sustainability, as they can lead to fires, explosions, and asphyxiation [,,,,,], while also intensifying atmospheric pollution and affecting air quality [,,].
These risks are exacerbated by technical factors, such as failures in regulators, cylinders, and hoses [,]; operational factors, such as insufficient maintenance and exposure to ignition sources [,,]; and environmental factors, such as high temperatures, poorly ventilated spaces, or the proximity of plants to residential areas [,]. The magnitude of the problem is reflected in the statistics: in 2022, 640,093 residential fires were recorded in 25 countries, resulting in 17,666 injuries and 12,815 deaths, while 4853 incidents were specifically linked to gas equipment in 10 countries [,]. These figures underscore the urgency of innovative solutions for early detection and continuous monitoring of LPG concentrations, the implementation of which not only strengthens the safety of communities and industries but also contributes to sustainability objectives by preventing human losses, reducing environmental impacts, and ensuring safer and more responsible energy use.
In the Peruvian context, LPG is the primary residential fuel, used by approximately 80% of households for food cooking, with an average monthly consumption of one 10 kg cylinder per family []. This dependence translates into high risk indices: in 2023 alone, 5916 emergencies due to gas leaks were recorded, and in 2024 the figure remained high with 5787 reported incidents, with Lima being the city with the highest concentration of fires and explosions in homes, restaurants, factories, and buildings []. The standard mixture used in Peru corresponds to 60% propane (C3H8) and 40% butane (C4H10), the official proportion adopted in parity price calculations []. Within this framework, the present research focuses on propane detection, as it is the predominant component with the greatest impact on domestic and industrial safety, thereby reinforcing the need for innovative monitoring systems that promote safer, more resilient energy management aligned with sustainability principles.
In response to this growing problem, various detection technologies have been developed, ranging from traditional systems to advanced approaches based on artificial intelligence. Conventional systems employ electrochemical or catalytic sensors integrated into IoT platforms with microcontrollers such as Arduino (Arduino LLC, Somerville, MA, USA) or NodeMCU (Espressif Systems, Shanghai, China), enabling basic real-time monitoring and automatic alert transmission.
Although direct gas sensors provide punctual and accurate measurements of propane concentration, thermal imaging offers complementary capabilities that enhance gas detection systems. Thermal sensing enables quantitative estimation of gas concentration through visual analysis, providing an alternative measurement approach that can operate when direct sensors are unavailable or compromised []. Furthermore, this visual modality allows continuous remote monitoring from safe locations, eliminating the need to expose personnel and equipment to potentially hazardous environments during inspection and maintenance operations []. Additionally, thermal images enable detection of concentration changes across wider fields of view compared to point sensors, allowing detection of gas releases that might occur beyond the immediate proximity of the sensor []. More importantly, it provides critical redundancy in industrial safety systems where chemical sensor failure could compromise early detection of gas leaks. The integration of automated thermal analysis through neural networks could offer continuous supervision without human intervention, improving operational efficiency and reducing maintenance costs in industrial facilities.
Various studies have demonstrated the potential of thermal and infrared imaging in safety and monitoring applications, proving their effectiveness in tasks such as detecting faults in electrical equipment through thermography [,], identifying gases in mid-infrared spectral images [], and early recognition of fires from infrared images [].
In the case of gas leaks, the use of thermal imaging enables remote detection of associated heat patterns, which enhances safety and reduces the need for physical sensors in the risk area [,,]. Meanwhile, deep learning techniques have demonstrated their efficacy in the detection, classification, and, in some cases, regression of gas leaks using thermal images. Models such as convolutional neural networks (CNNs) and hybrid architectures have achieved accuracies exceeding 95% in the identification and classification of gas leaks [,,]. These advances reflect the versatility of thermal vision assisted by artificial intelligence as a non-invasive, wide-reaching detection tool for application in more complex scenarios such as gas leaks.
Furthermore, multimodal approaches have been developed that combine data from sensors and thermal cameras to enhance the robustness and precision of systems [,,,]. These are employed in deep learning models not only for classifying the type of gas or leak size but also for precise localization and segmentation of affected areas, and even estimation of leak magnitude through regression in some cases [,,,]. Various applications have been experimentally validated, both in simulated environments and real-world settings, where they have shown high accuracy, real-time processing capability, and potential for implementation in industrial surveillance systems [,]. These results confirm that deep learning-based techniques overcome several limitations of conventional sensors.
Efforts in visual detection of leaks through thermal imaging and deep learning techniques have predominantly focused on gases such as hydrogen, natural gas, methane (CH4), carbon dioxide (CO2), and hydrocarbon combinations associated with natural gas, demonstrating the feasibility of estimating concentrations in gaseous flows [,]. Models combining sensors and thermal vision to identify different gases in complex mixtures have also been tested, achieving improvements in robustness and precision []. Nevertheless, despite these advances, focus on propane (C3H8), or on representative LPG mixtures, has received scarce attention; consequently, a thermal vision model based on deep learning specialized in quantitative estimation of propane concentrations in real operational contexts has not been consolidated thus far. This gap is significant, as propane is the major component in LPG widely used in residential and industrial applications; therefore, there exists an unmet demand for methodologies capable of detecting, quantifying, and monitoring propane leaks with the robustness, coverage, and automation offered by advanced thermal vision methods.
Given this methodological and contextual gap, we pose the following research questions: Is it possible to train deep learning models that not only detect the presence of LPG but also estimate its concentration from thermal patterns? Which architectures prove most efficient in scenarios with limited data and thermal noise? And finally, how can these models be optimized considering the specific composition of Peruvian LPG (60% propane, 40% butane)?
To address these research questions, this work presents PropNet-R, a specialized convolutional neural network architecture designed specifically for quantitative estimation of propane concentrations from thermal images. Unlike generic architectures such as SqueezeNet, VGG19, or ResNet50, originally conceived for classification tasks on natural images, PropNet-R incorporates architectural components optimized for regression of thermal patterns associated with different propane gas concentrations. The model was trained and validated using an experimental dataset obtained under controlled laboratory conditions, where thermal images were captured synchronized with precise concentration measurements expressed in ppm. The effectiveness of PropNet-R is evaluated comparatively against three reference architectures (SqueezeNet, VGG19, and ResNet50), all adapted through fine-tuning for the regression problem, demonstrating superior performance in key metrics such as R2, mean absolute error (MAE), and Pearson correlation.
The remainder of this document is organized as follows: Section 2 describes the materials and methods employed; Section 3 presents the results obtained; Section 4 provides analysis and discussion of the findings; and finally, Section 5 presents the study conclusions.

2. Materials and Methods

2.1. Hardware for Multi-Sensor Data Collection for Gas Leak Detection

We developed a monitoring system based on IoT technology [,,] to measure propane gas concentration. The system comprises an electronic board that integrates a gas sensor and a thermal camera, connected to a Raspberry Pi 4 Model B (Raspberry Pi Foundation, Cambridge, UK) running Raspberry Pi OS 13 (Trixie, 64-bit) development board that acts as a database server in an edge computing environment [,], as shown in Figure 1. Python 3.12.7 was employed as the programming language for data acquisition and structured storage.
Figure 1. High-level architecture of the data acquisition system using sensors and thermal camera.
Figure 2a illustrates the design of a custom shield-type printed circuit board (PCB), while Figure 2b depicts its integration with the Raspberry Pi module and the direct connection of its pins without requiring additional external components. This PCB enables the parallel acquisition of numerical data from the gas sensor and thermal images from the camera, which are subsequently transmitted to the Raspberry Pi module for processing and storage. Full hardware specifications are listed in Appendix A, Table A1.
Figure 2. Electronic module design and integration: (a) custom shield-type PCB and (b) coupling onto the Raspberry Pi module.
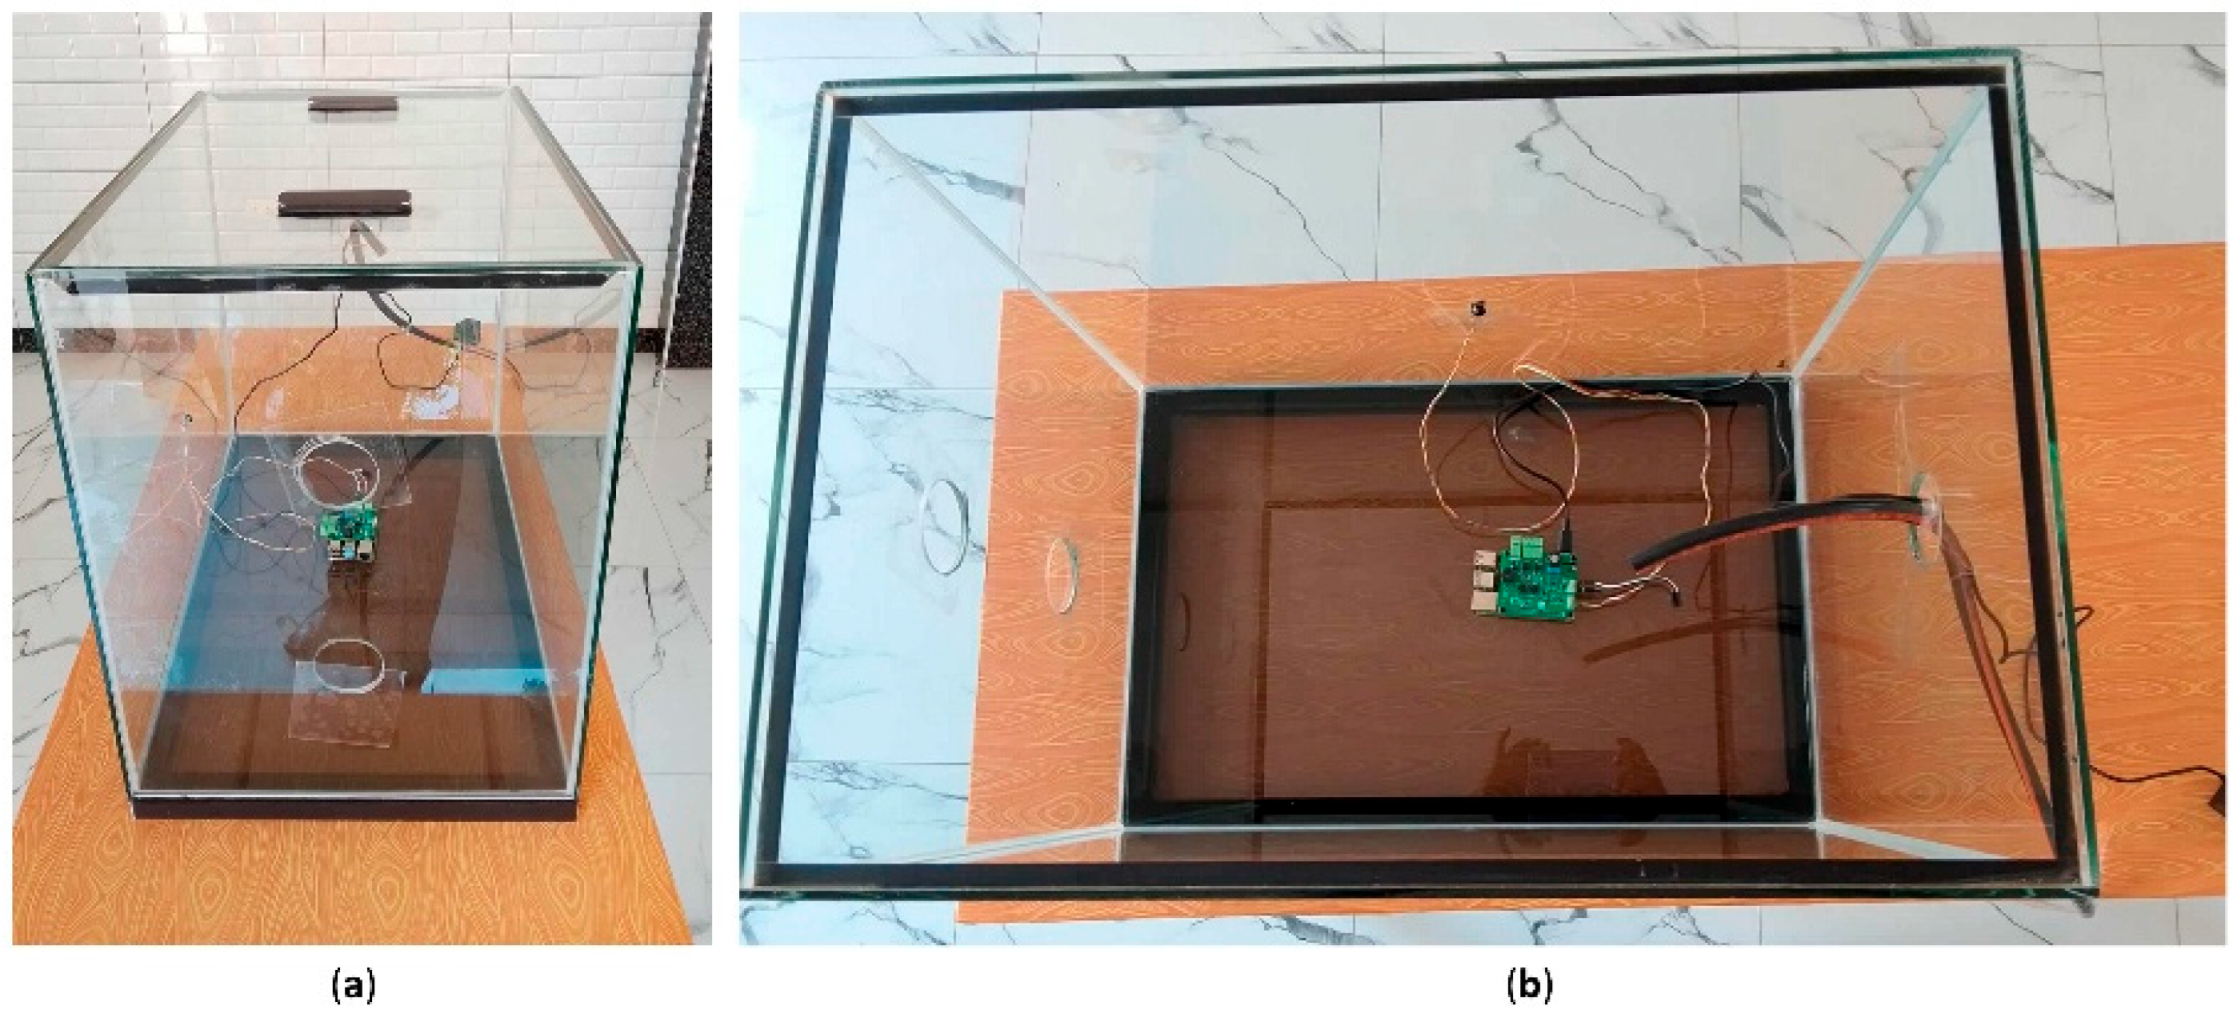
The experimental procedure began with the injection of gas from an LPG cylinder over a period of one minute, followed by a ten-minute dispersion interval inside the controlled glass chamber. This injection–dispersion cycle was repeated several times throughout the experiment. During each session, thermal images and gas sensor readings were continuously recorded at a sampling frequency of 5 s, over a total duration of approximately 120 min distributed across three different days. As a result, a dataset comprising 4860 samples was obtained, simultaneously integrating both visual and sensor information for subsequent analysis. The complete experimental setup within the controlled glass chamber environment is illustrated in Figure 3.
Figure 3. Experimental setup in glass chamber: (a) front view of the electronic circuit and (b) top view of the internal arrangement.
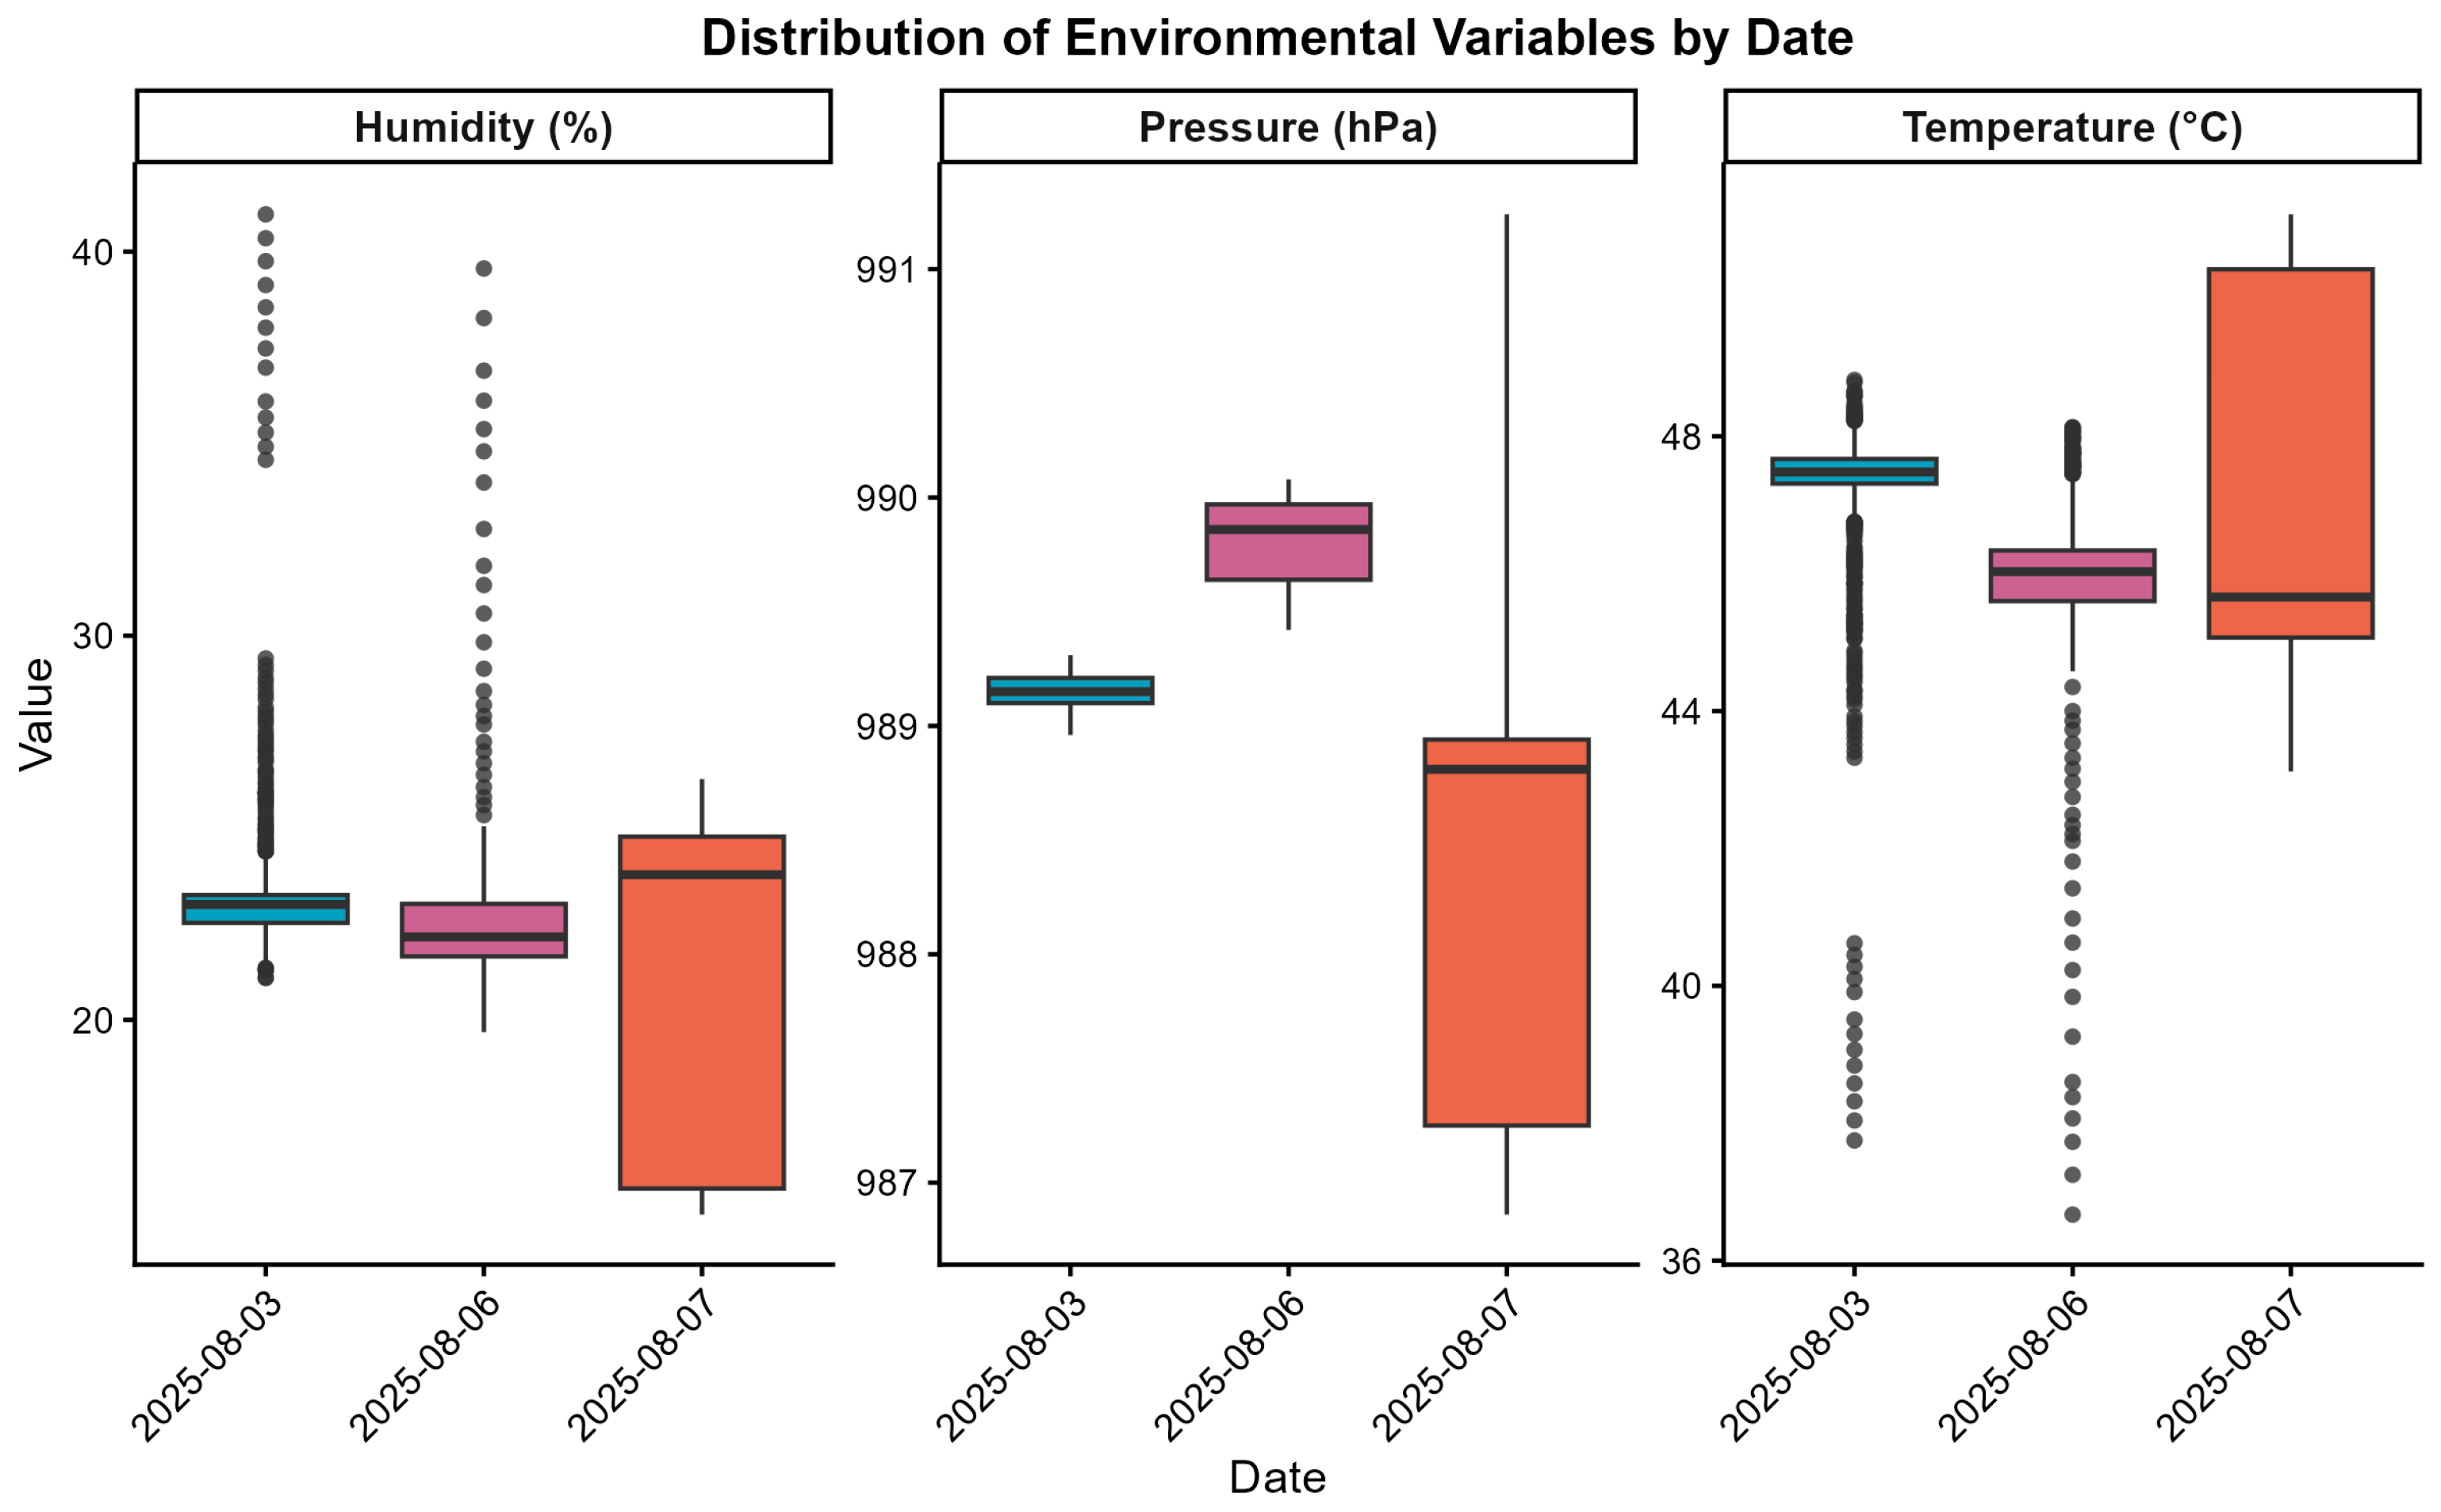
We conducted continuous monitoring of environmental conditions within the controlled glass chamber during the propane dispersion sessions. The recorded parameters were ambient temperature of 46.9 ± 2.3 °C, relative humidity of 22 ± 3.6%, and atmospheric pressure of 989 ± 1.2 hPa. These values remained within stable ranges throughout the experiment, ensuring the consistency and reliability of thermal image measurements and gas sensors. The distribution of these environmental parameters is presented in Figure A1.

2.2. Framework for Quantitative Estimation of Propane Gas Concentration

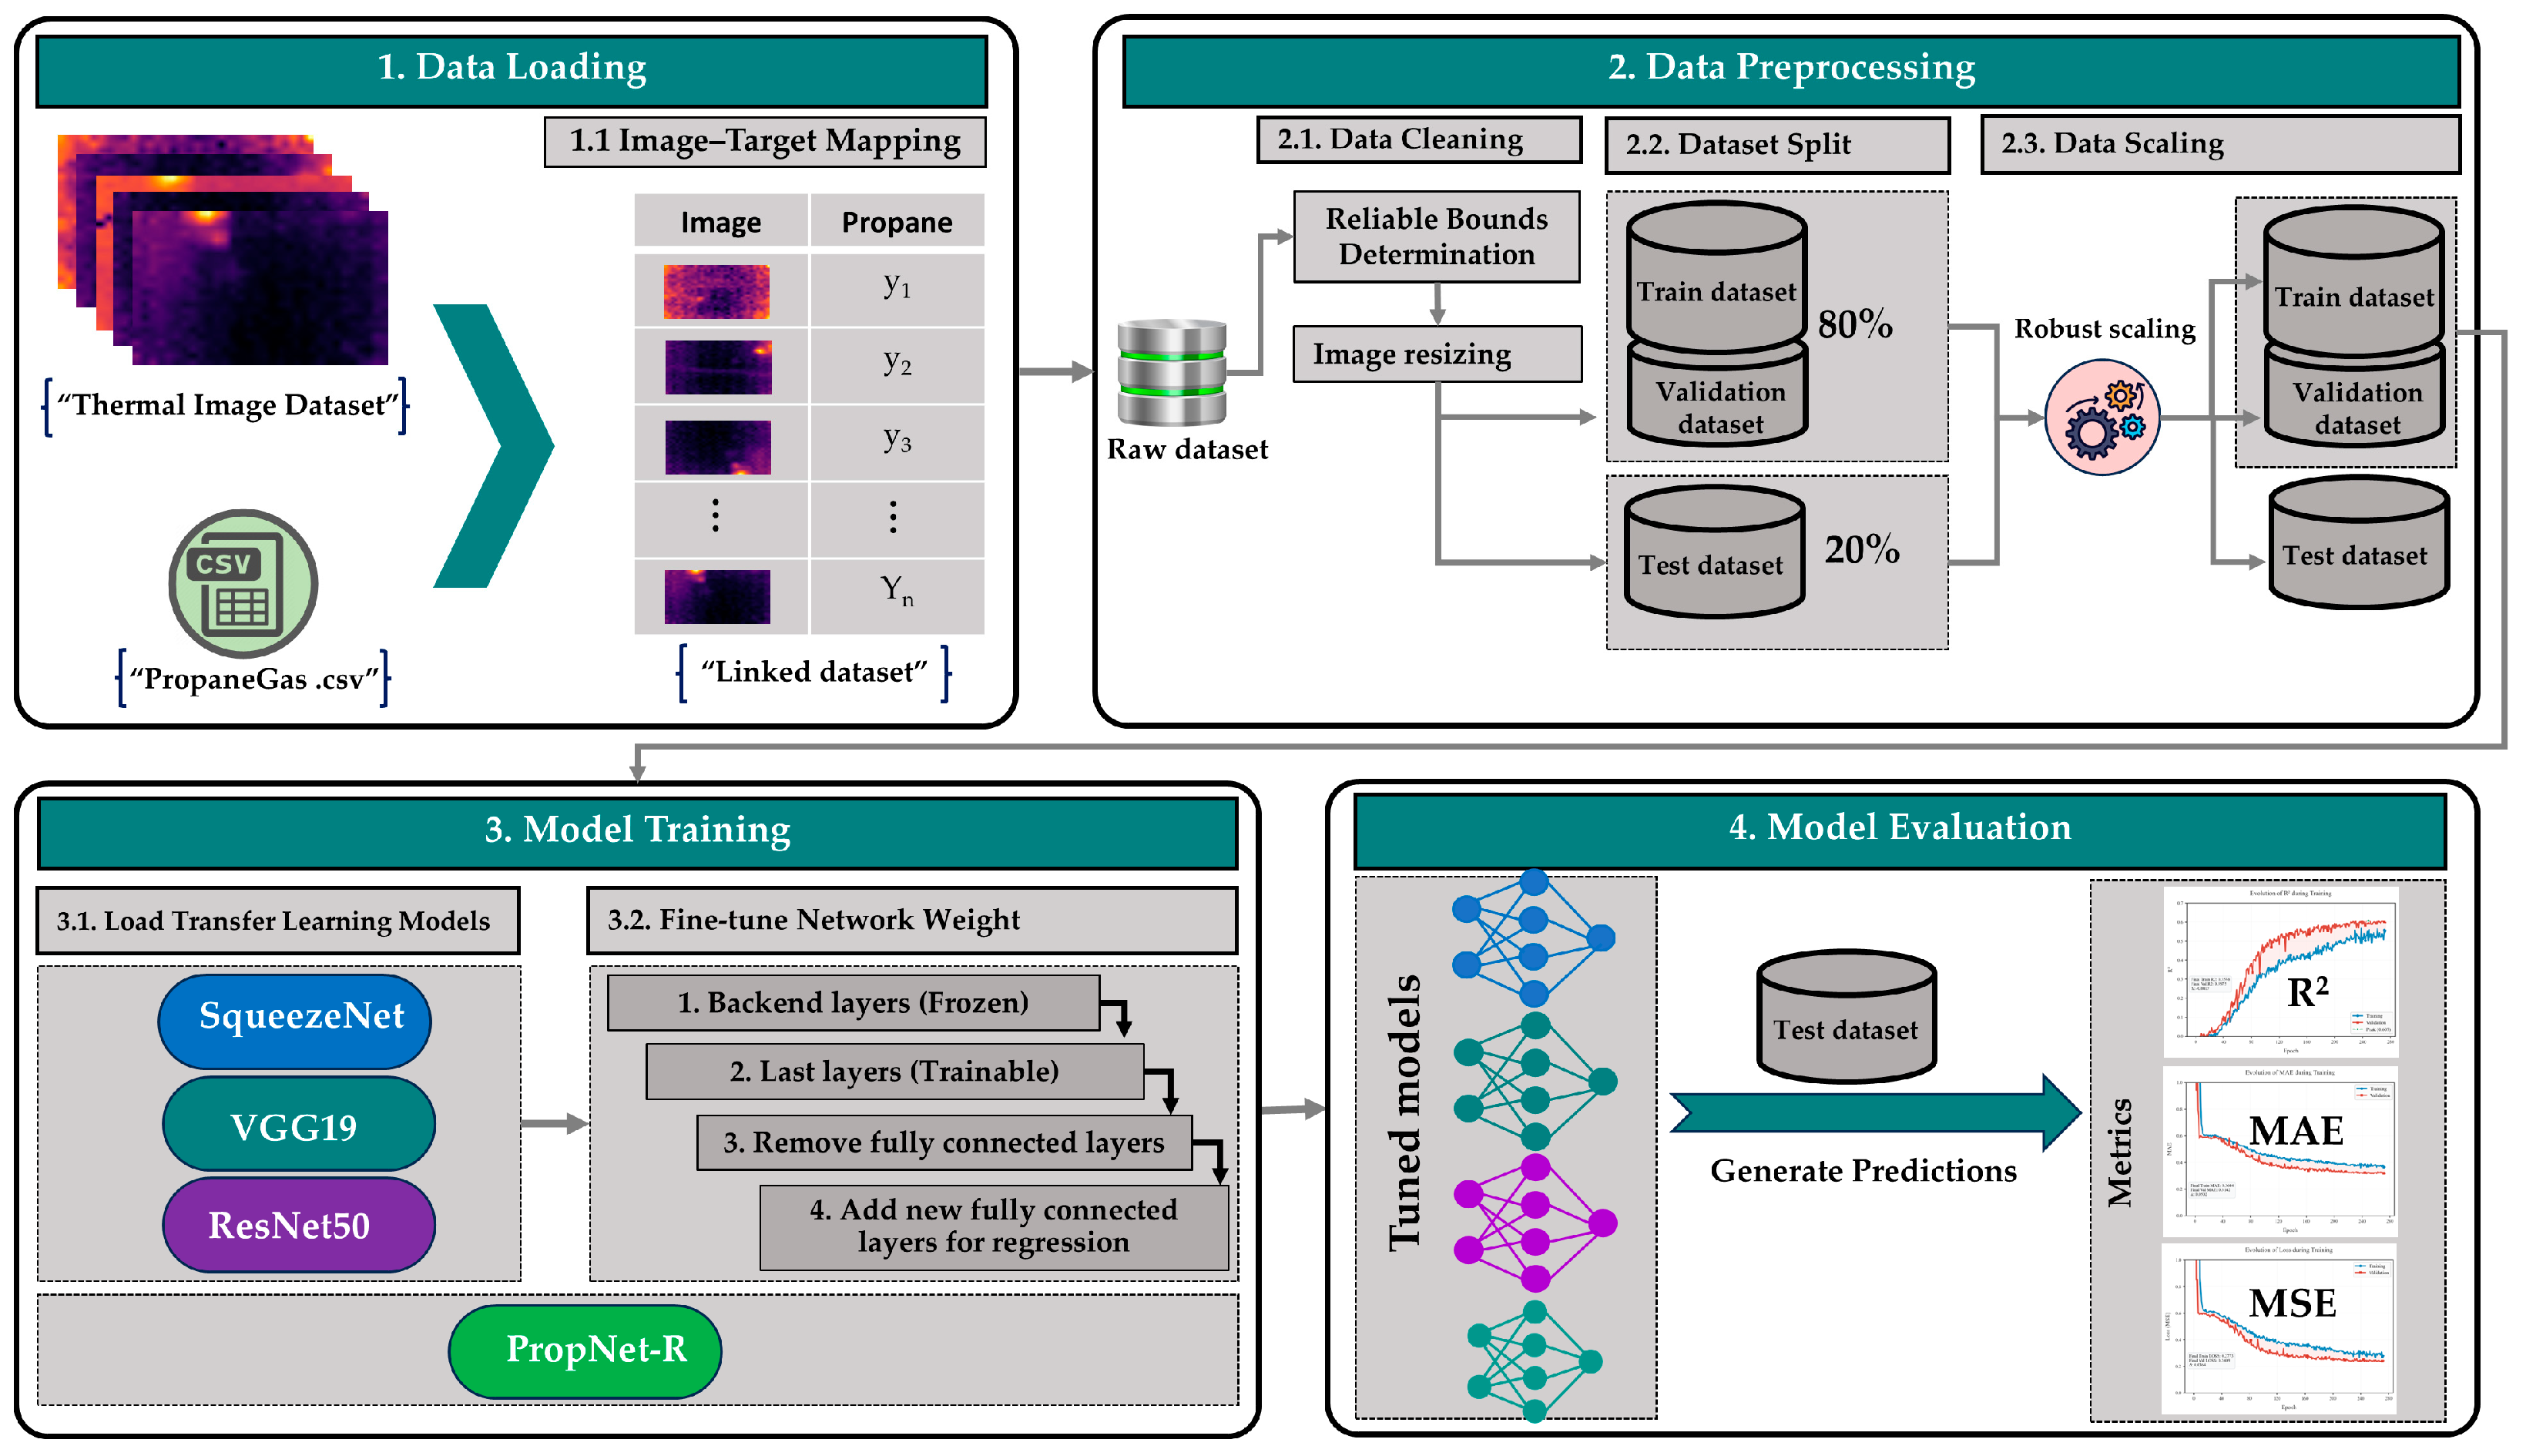
Figure 4 presents the proposed framework for quantitative estimation of propane concentration from thermal images. This framework is structured into four main stages: (1) Data Loading, (2) Data Preprocessing, (3) Model Training, and (4) Model Evaluation.
Figure 4. Proposed framework for quantitative estimation of propane concentration.

2.2.1. Data Loading

At this stage, the dataset was structured from the information collected during the experimental procedure. A total of 4860 color thermal images were available, each with a resolution of 960 × 720 pixels, synchronously captured with propane concentration measurements expressed in parts per million (ppm). These measurements were stored in a CSV file. The correspondence between each image and its associated concentration value was established through timestamp matching, resulting in a regression-oriented dataset in which each instance contains the image file path and the corresponding quantitative propane concentration value.

2.2.2. Data Preprocessing

Data preprocessing plays an important role given its influence on deep learning model performance [,], particularly in regression problems with thermal images []. It has been demonstrated that even minor variations in preprocessing procedures can generate greater variability than that introduced by modifications in network architecture, evidencing their critical impact on results []. The following subsections describe the specific activities carried out during this phase.
Data Cleaning
Within the preprocessing stage, data cleaning constitutes an essential aspect. In this case, the employed sensors could be exposed to external interference that manifests as noise in the measurements. Such sensor-induced noise can significantly affect machine learning model performance; therefore, its proper treatment is essential to minimize prediction error [].
To ensure the reliability of the observations and to discard measurements dominated by instrumental noise or extreme outliers, the k σ rule was applied. In this approach, two data subsets are considered: L m i n , comprising the 15% lowest observations of propane concentration, and L m a x , corresponding to the 15% highest. For each subset, the mean μ and the standard deviation σ were calculated. Finally, κ represents the confidence factor, acting as a weighting parameter that determines the degree of tolerance to the natural variability of the data: larger κ values lead to wider thresholds, whereas smaller values yield stricter thresholds. Based on these values, the reliable minimum and maximum thresholds were defined, as shown in Equations (1) and (2).
T m i n = μ L m i n + κ σ L m i n ,
T m a x = μ L m a x + κ σ L m a x ,
In this work, κ = 3 was used, in accordance with the three-sigma rule commonly applied in statistical process control, anomaly detection, and sensor noise filtering [].
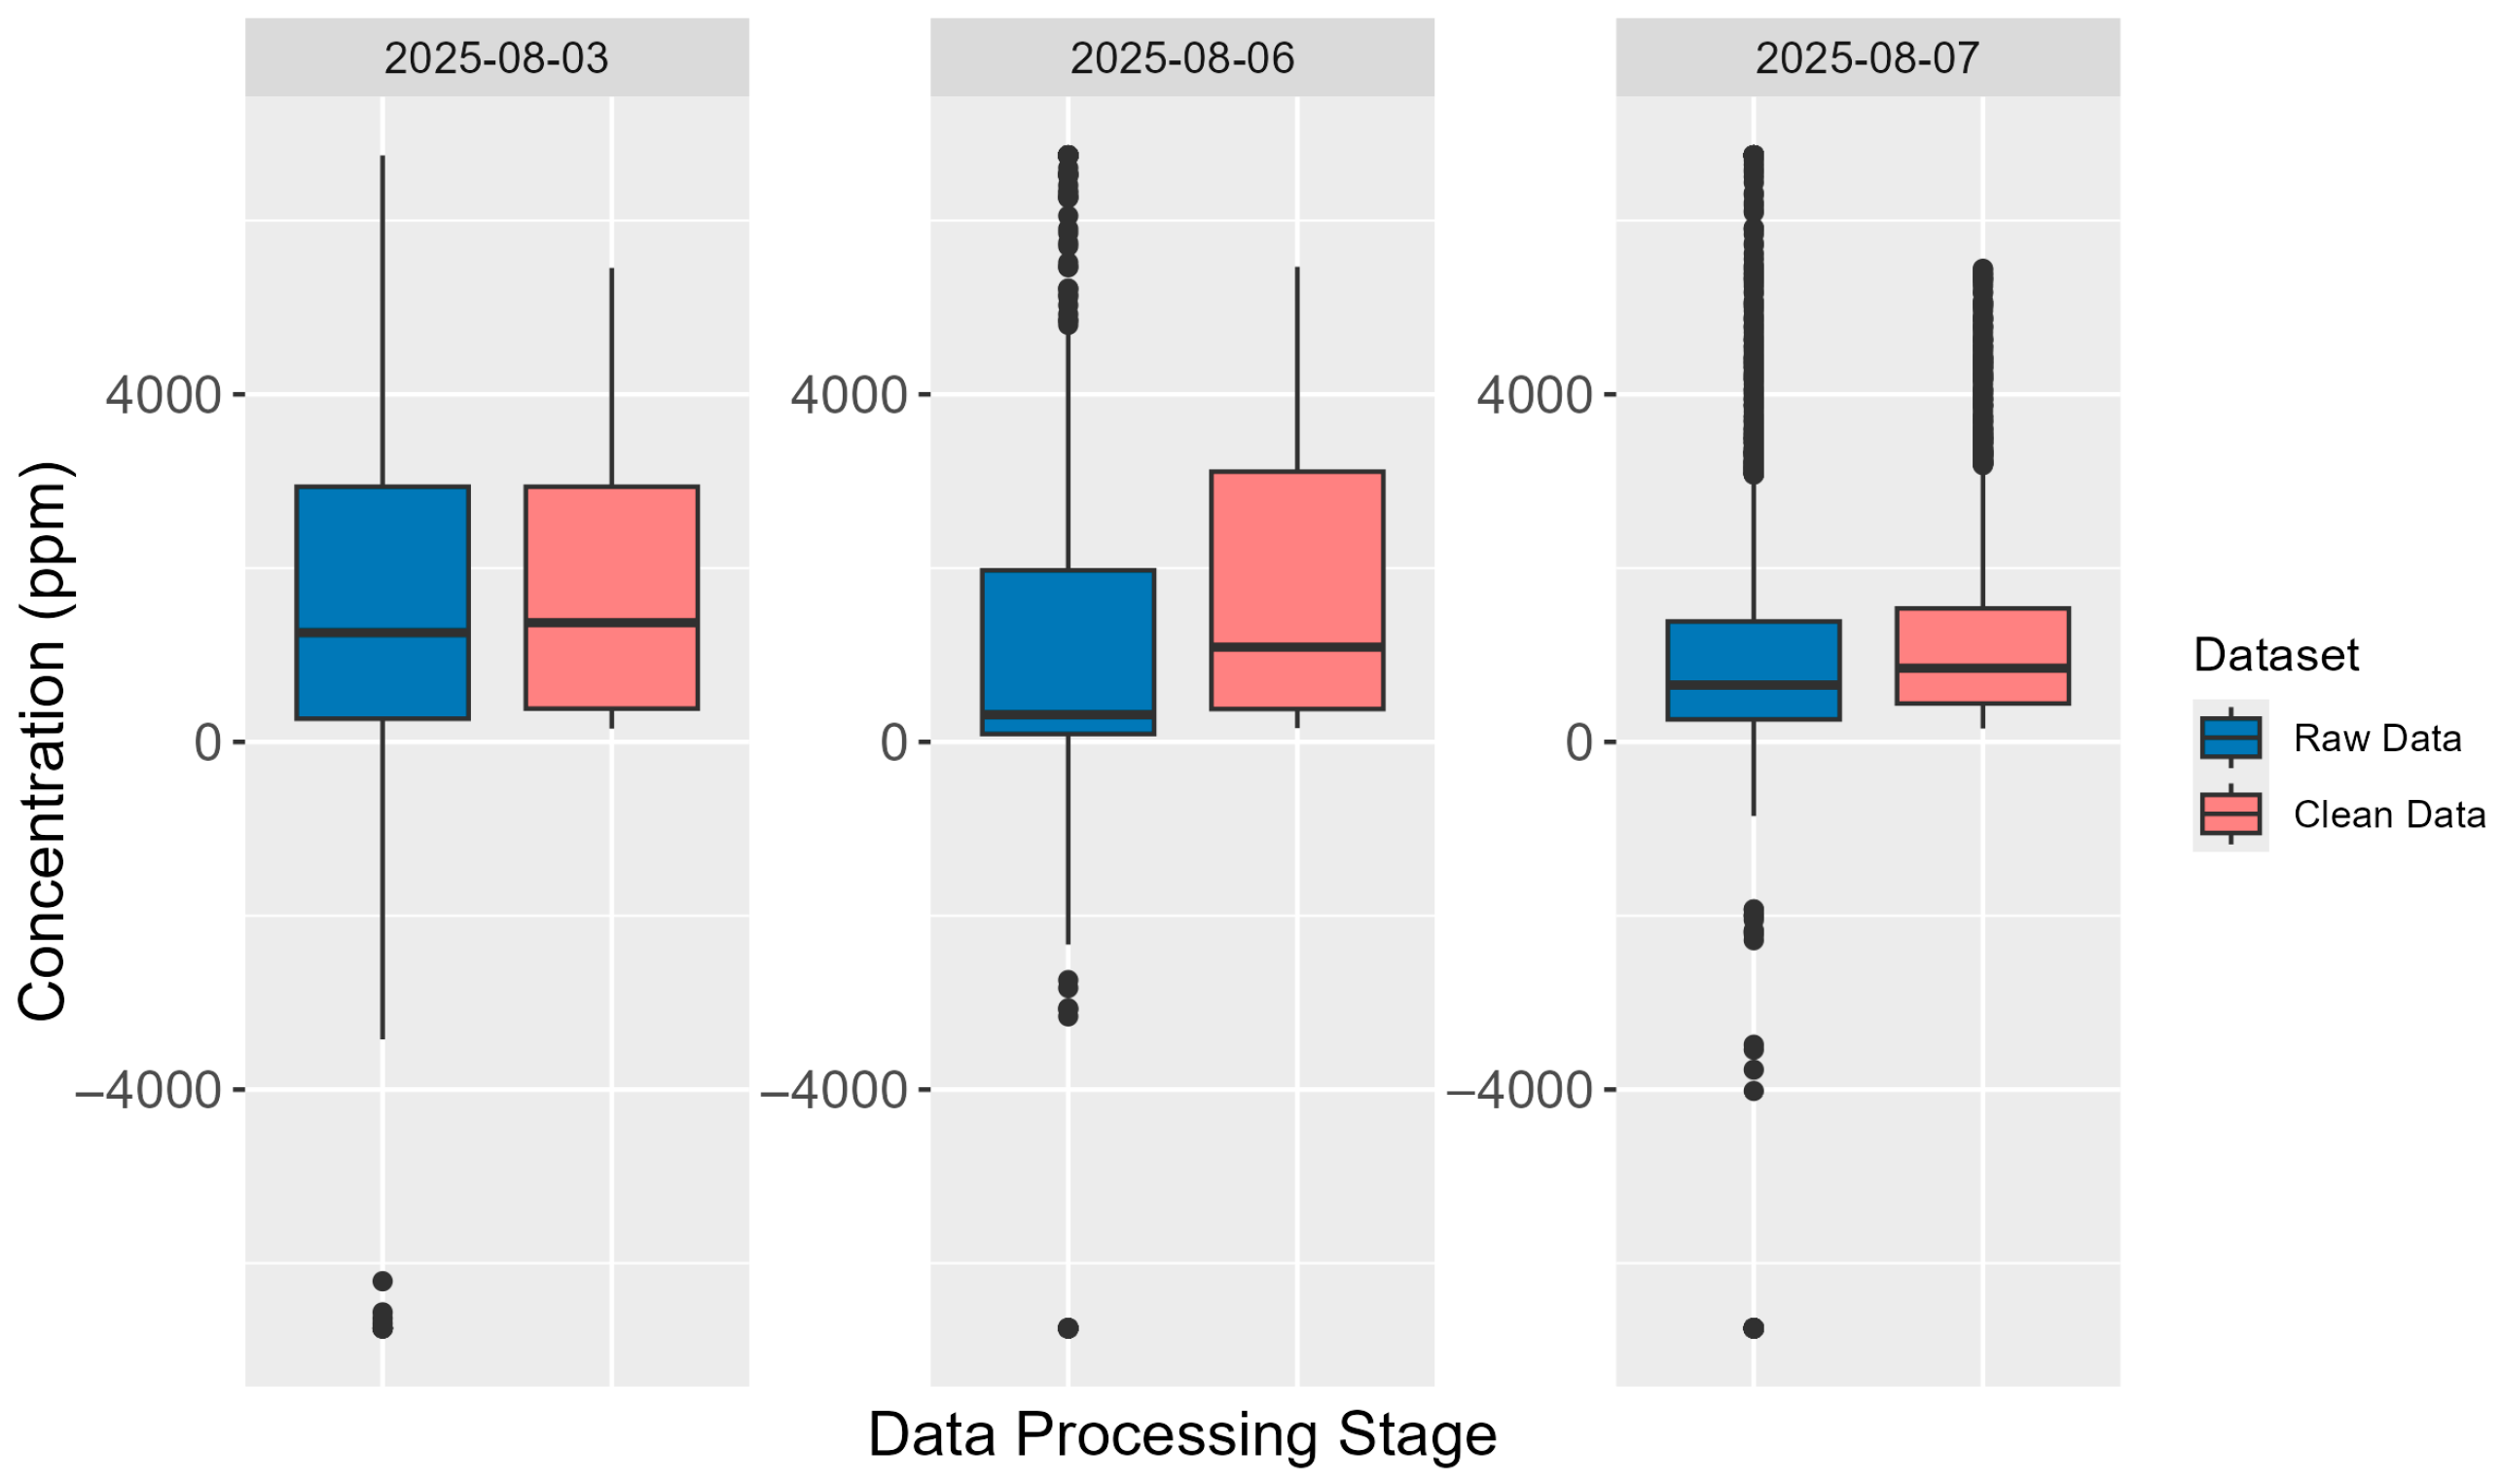
Figure 5 displays the distribution of propane gas concentration measurements recorded before (blue) and after the data filtering process (light coral), through which observations significantly affected by sensor noise were systematically removed.
Figure 5. Distribution of propane gas concentration measurements before and after data filtering.
To conclude this phase, thermal images were resized to 256 × 256 pixels using bilinear interpolation, standardizing their dimensions to ensure compatibility with the regression model. Figure 6 shows three randomly selected examples after applying this procedure.
Figure 6. Thermal images representing propane gas concentration after spatial resizing.
As a result of this task, a clean dataset was obtained comprising 3574 propane gas concentration records, measured in parts per million, along with their corresponding associated thermal images.
Data Splitting
A fundamental step in constructing convolutional neural network models is the partitioning of the dataset into training, validation, and test subsets [,,]. While the training set is employed to adjust the model parameters, the validation set enables monitoring of its performance during the fitting process and prevents overfitting. Finally, the test set remains isolated and is used exclusively to evaluate the model’s generalization capability once training is completed.
The dataset was divided using an initial proportion of 80% for training and 20% for testing. From the training subset, an additional 20% was further allocated for validation, resulting in 2287 images for training, 572 for validation, and 715 for testing. The partitioning was performed randomly using a fixed random seed to ensure reproducibility and to prevent data leakage between subsets. Each image was assigned exclusively to one subset (training, validation, or testing), thereby eliminating any overlap or similarity and ensuring the statistical independence of the data partitions.
Data Scaling
Data scaling constitutes an essential step in preprocessing, as it ensures that all input features are within a comparable range [,]. In regression tasks with convolutional neural networks, scaling the target variable is particularly important, as it reduces the magnitude of values to a more uniform range. This not only facilitates the network’s ability to learn more stable relationships between the representations extracted from images and the desired output, but also improves numerical precision during training and accelerates model convergence [,].
In this study, robust scaling using RobustScaler from scikit-learn was employed to mitigate outlier effects in propane concentration measurements. The scaler was fitted exclusively on the training set and applied to all datasets using consistent parameters. This technique utilizes median and interquartile range, making it suitable for non-Gaussian distributions with outliers. The mathematical formulation is detailed in Appendix A.2.

2.2.3. Model Training

Model training was conducted using the PyTorch deep learning framework (version 2.6.0 + cu118), which offers native support for CUDA 11.8 and enabled GPU acceleration throughout the experiments. This phase involved two key tasks: loading pre-trained models via transfer learning and fine-tuning their weights for regression. Both are detailed below.
Load Transfer Learning Models
Transfer learning constitutes a machine learning approach where a pre-trained model is adapted to solve a new specific problem []. Through this technique, models can be initialized with weights previously optimized on extensive datasets such as ImageNet []. This approach is particularly valuable in contexts where data are scarce or difficult to obtain, as in our case: thermal images representing propane gas concentrations in parts per million.
Although most transfer learning applications in thermal imaging have focused on classification, their principles of low-level feature extraction are equally useful for regression tasks. The initial layers of CNNs learn edge, texture, and gradient detectors that are invariant to the spectral domain, which facilitates their transfer to thermal images. A direct precedent in regression is provided by Zhang et al. [], who employed ResNet50 with mid-infrared spectral images to predict CO2 concentrations in exhaust gases, demonstrating the feasibility of pretrained CNNs for continuous estimations in the infrared domain.
In our case, we selected SqueezeNet [], VGG19 [], and ResNet50 [] for three reasons. First, they have shown positive results in thermal and infrared imaging: SqueezeNet, VGG19, and ResNet50 have been applied to fault detection in electrical equipment through thermography [,], gas detection in mid-infrared spectral images [], and fire recognition with infrared images []. Second, they represent contrasting architectural paradigms: SqueezeNet (~1.2 M parameters) as a lightweight and efficient network, VGG19 (~144 M) as a deep sequential architecture, and ResNet50 (~25 M) as a residual network that enables greater trainable depth, which allowed us to analyze the effect of complexity in the thermal domain. Third, all of them provide pretrained weights on ImageNet, whose low-level feature extractors have been shown to be transferable to thermal images under fine-tuning schemes.
Fine-Tune Network Weight
The fine-tuning technique consists of selectively adapting a previously trained model to improve its performance on a specific task through strategic modifications to its architecture and configuration []. This approach typically focuses on the final layers of the model, as they are most directly responsible for decision-making in tasks such as classification or regression. However, fine-tuning is not limited to structural adjustments: it also involves optimizing key hyperparameters, such as learning rate and batch size, which directly influence convergence speed and the model’s ability to effectively adapt to new datasets [,].
The following presents the application of fine-tuning on the SqueezeNet, VGG19 and ResNet50 models for predicting propane gas concentration in ppm from thermal images.
  • The implementation of SqueezeNet v1.1 retained the frozen initial convolutional layer to preserve low-level feature extraction, while fine-tuning all subsequent layers. After adapting it to the regression task, the final model contained 723,009 parameters, of which 721,217 were trainable and 1792 remained frozen. Fine-tuning focused on the last ten layers, corresponding to Fire modules 2 through 9 and the final convolutional layer.
The original classifier was redesigned for regression by incorporating a channel reduction layer, a dropout-based regularization layer, and an adaptive average pooling mechanism, ultimately producing a scalar value representing propane gas concentration. Figure 7 presents a conceptual diagram of the architecture and the training configuration.
Figure 7. Fine-tuned SqueezeNet architecture for propane concentration estimation.
In Table 1, we present the specific details of the unfrozen layers for training in this model.
Table 1. Fine-tuned layers of the SqueezeNet architecture.
  • In the case of VGG19, a conservative fine-tuning strategy was adopted to mitigate early overfitting identified in preliminary experiments. The original architecture comprises approximately 143.7 million parameters. Following adaptation to the regression problem, the final model was reduced to approximately 23.2 million parameters, of which approximately 5.6 million remained trainable and 17.7 million were kept frozen. Training was concentrated solely on the last convolutional layer of the feature extractor and on the new fully connected head designed for the regression task.
The fine-tuning consisted of replacing the original classifier with an output head specifically designed for regression tasks. This configuration includes a dimensionality reduction layer, a nonlinear activation function, and regularization through dropout. Figure 8 illustrates the adapted architecture, highlighting the unfrozen components, the modified regression head, and the applied regularization strategy.
Figure 8. Fine-tuned VGG19 architecture for propane concentration estimation.
We present the specific details of the unfrozen layers for training of this model in Table 2.
Table 2. Fine-tuned layers of the VGG19 architecture.
  • The base architecture of ResNet50, composed of approximately 23.6 million parameters, was initially frozen in its entirety. Subsequently, the residual blocks were organized into a unified list grouping the four main sets of the network, layer1 (3 blocks), layer2 (4 blocks), layer3 (6 blocks), and layer4 (3 blocks), constituting a total of 16 architectural components. From this structure, only the upper portion of the model was enabled for training, corresponding to the last block of layer4 (layer4.2) and the regression head. Thus, the model was reduced to approximately 4.5 million trainable parameters, while 19.1 million remained frozen.
As with the two previous baseline models, the final layer was replaced with a new output head designed for regression. This incorporates dropout regularization, an intermediate dimensional reduction layer, nonlinear activations, and additional dropout before the final regression output. Figure 9 graphically presents this architecture, highlighting the unfrozen components, the modified classifier, and the applied regularization strategy.
Figure 9. Fine-tuned ResNet50 architecture for propane concentration estimation.
The specific details of the unfrozen layers for training of this model are presented in Table 3.
Table 3. Fine-tuned layers of the ResNet50 architecture.
Table 4 presents a comparative summary of the main hyperparameters used during training and fine-tuning of the transfer learning models implemented in this study.
Table 4. Summary of hyperparameters used in fine-tuning pre-trained models on thermal images.
Recognizing the inherent architectural differences among SqueezeNet, VGG19, and ResNet50, the hyperparameters presented in Table 4 were selected after implementing an individualized optimization process aimed at maximizing the specific performance of each model. The methodology focused on the learning rate of the Adam optimizer and the L2 regularization coefficient (implemented as the weight_decay parameter in the optimizer), parameters that directly affect convergence and generalization in regression tasks. Experiments were conducted with dropout values of [0.5, 0.7 and 0.75] across all architectures, which are commonly used in convolutional neural network studies [,]. For ResNet50, overfitting was more pronounced; therefore, a Batch Normalization layer was added, and the dropout rates were adjusted to [0.4, 0.3]. The early stopping criterion was also refined by reducing the patience parameter from 20 to 15 epochs, allowing earlier termination once the validation loss plateaued. These adjustments enhanced training stability and reduced overfitting while preserving generalization performance. The search ranges were defined based on numerical stability limits and regularization effectiveness reported in previous fine-tuning studies with pretrained models [,]. Random search was employed with 15 configurations per model over 20 epochs on the training set, providing efficient exploration of the hyperparameter space. We present the hyperparameters, search space, and optimal values for each model in Appendix A.3, Table A2.
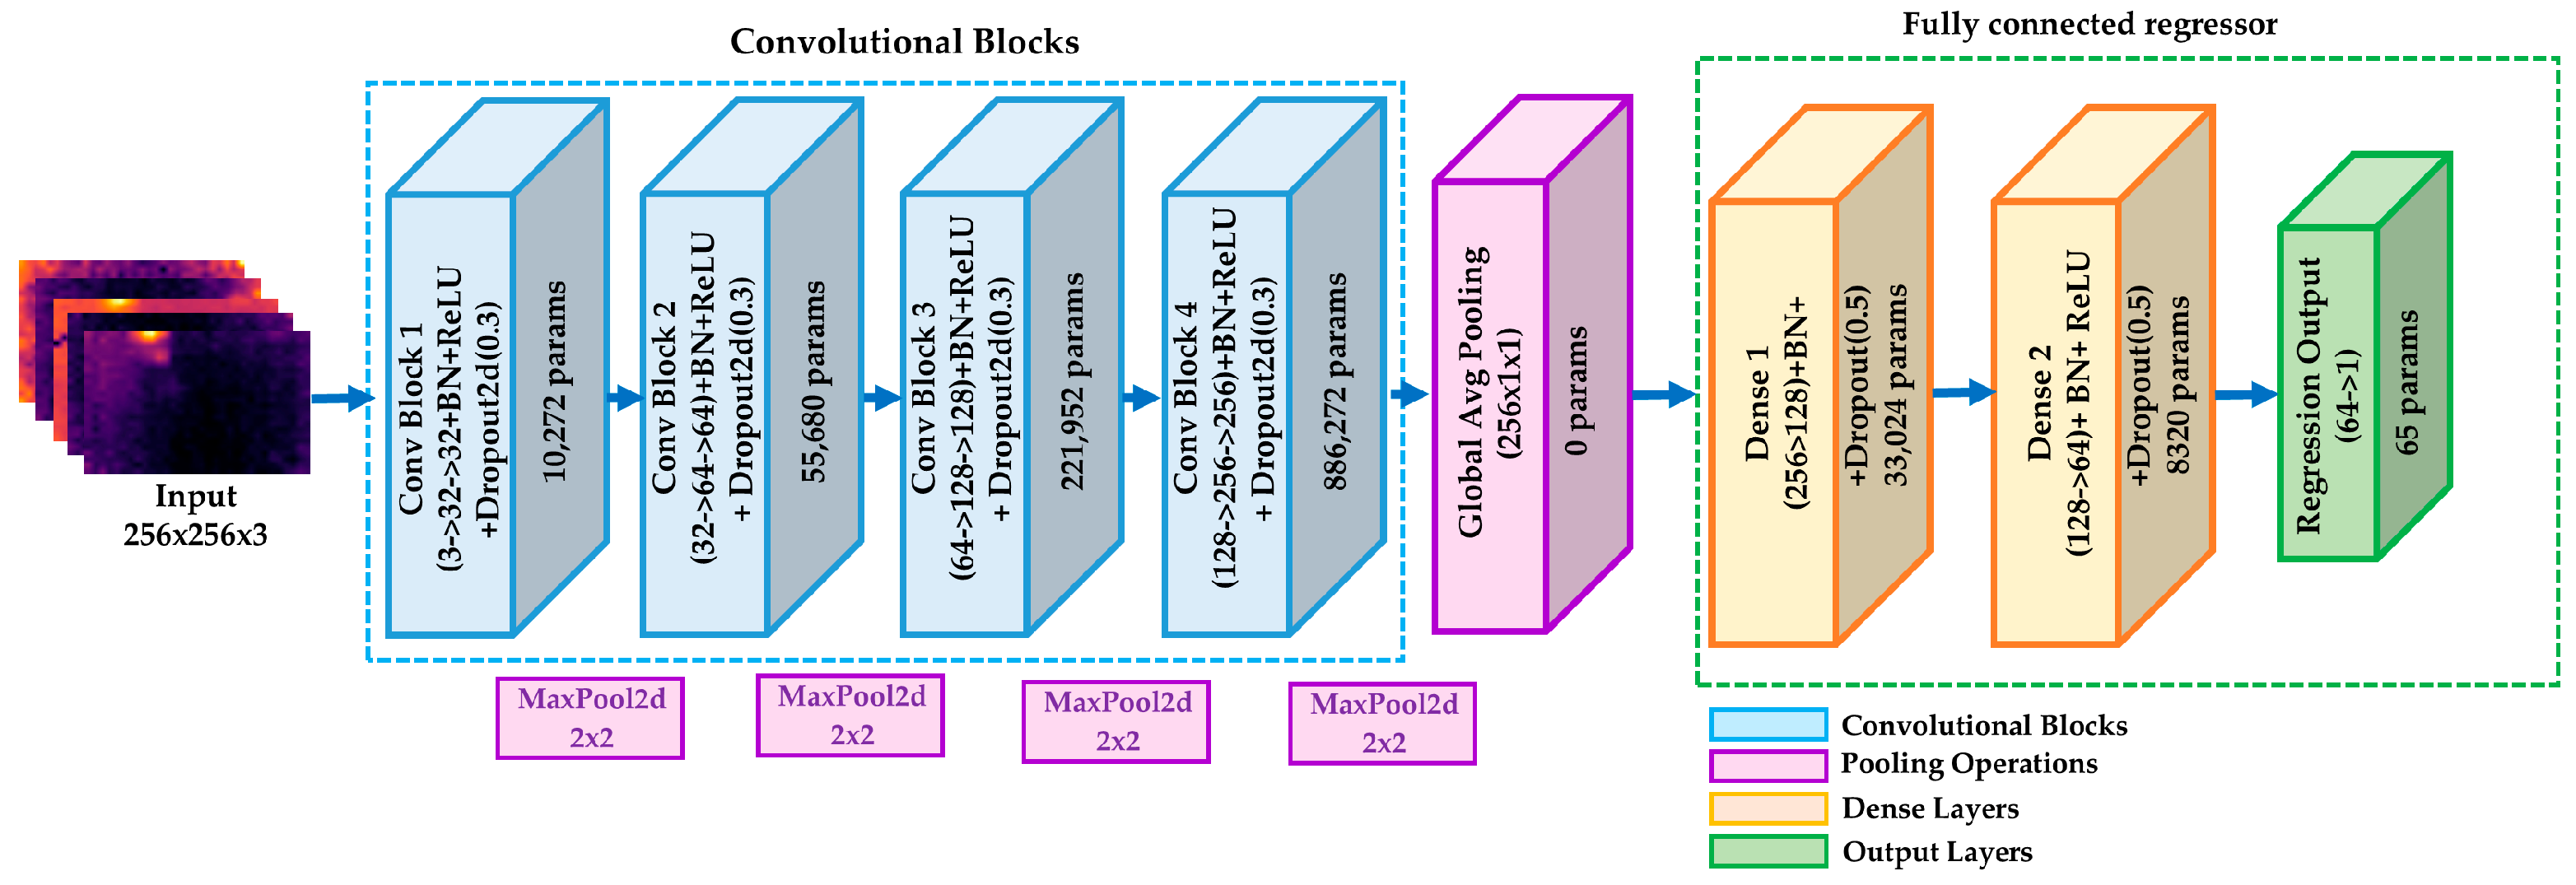
  • The custom convolutional neural network architecture (PropNet-R) was designed to quantitatively estimate propane gas concentration from thermal images, predicting a single scalar value in ppm corresponding to the entire image, as recorded by the sensor at the time of capture. The network is organized into four progressive convolutional blocks that follow a systematic channel expansion pattern: 3→32→64→128→256.
The expansion pattern in PropNet-R was adopted based on empirical design principles widely used in convolutional architectures, where progressive enlargement of feature maps enables hierarchical feature extraction. This geometric progression allows hierarchical extraction of features: from low-level features (edges, textures) in initial layers to complex semantic representations in deep layers [,,]. Similar patterns have been successfully employed in recent studies on thermal image analysis and gas detection [,,], where the increase in channel depth contributed to better representation and regression accuracy.
Each block comprises two sequential convolutional layers with 3 × 3 kernels, followed by batch normalization, non-linear activation, and spatial downsampling through max-pooling operations. This hierarchical configuration enables the extraction of features ranging from low-level patterns to complex domain-specific representations.
To enhance generalization and prevent overfitting in feature maps, spatial regularization was applied after each convolutional block using a probabilistic masking strategy. The feature extraction process concludes with a global aggregation mechanism that compresses the spatial dimensions into a one-dimensional vector of 256 elements, ensuring invariance to input resolution.
The final regression head adopts a minimalist design with three fully connected layers: 256→128→64→1. It integrates normalization in the initial dense layer and applies dropout-based regularization in the intermediate layers to improve robustness.
The complete architecture comprises approximately 1.22 million trainable parameters, primarily distributed between the convolutional blocks (1,174,176 parameters, 96.6%) and a compact regression head (41,409 parameters, 3.4%). Weight initialization was performed using the Kaiming (He initialization) scheme, which promotes stable gradient propagation during training. Figure 10 illustrates the detailed structure of PropNet-R, highlighting the active components and regularization strategies employed.
Figure 10. PropNet-R architecture for propane concentration estimation.

2.2.4. Model Evaluation

Model performance was assessed using the test dataset. The validation set was employed during the training process to monitor model fitting and support hyperparameter selection, whereas the test set remained completely isolated and was used exclusively for the final performance evaluation. Since the target variable is continuous, standard regression metrics were used: coefficient of determination (R2), mean absolute error (MAE), and mean squared error (MSE). These metrics allow quantifying prediction accuracy and characterizing the goodness of fit of the model in regression scenarios.
Let y i be the observed value, y ^ i the predicted value, y ¯ the mean of the observed values, and n the number of observations in the test set. Based on these variables, the metrics are mathematically formalized in Equations (3)–(5).
R 2 = 1 i = 1 n ( y i y ^ i ) 2 i = 1 n ( y i y ¯ ) 2   ,
M A E = 1 n i = 1 n y i y ^ i   ,
M S E = 1 n i = 1 n y i y ^ i 2 ,

3. Results

In this section, we present the results obtained with our PropNet-R architecture for estimating propane gas concentration from thermal images. To evaluate its effectiveness, we compared PropNet-R’s performance with three widely recognized models in the computer vision field: SqueezeNet, VGG19, and ResNet50, all adapted through fine-tuning to address our regression problem.
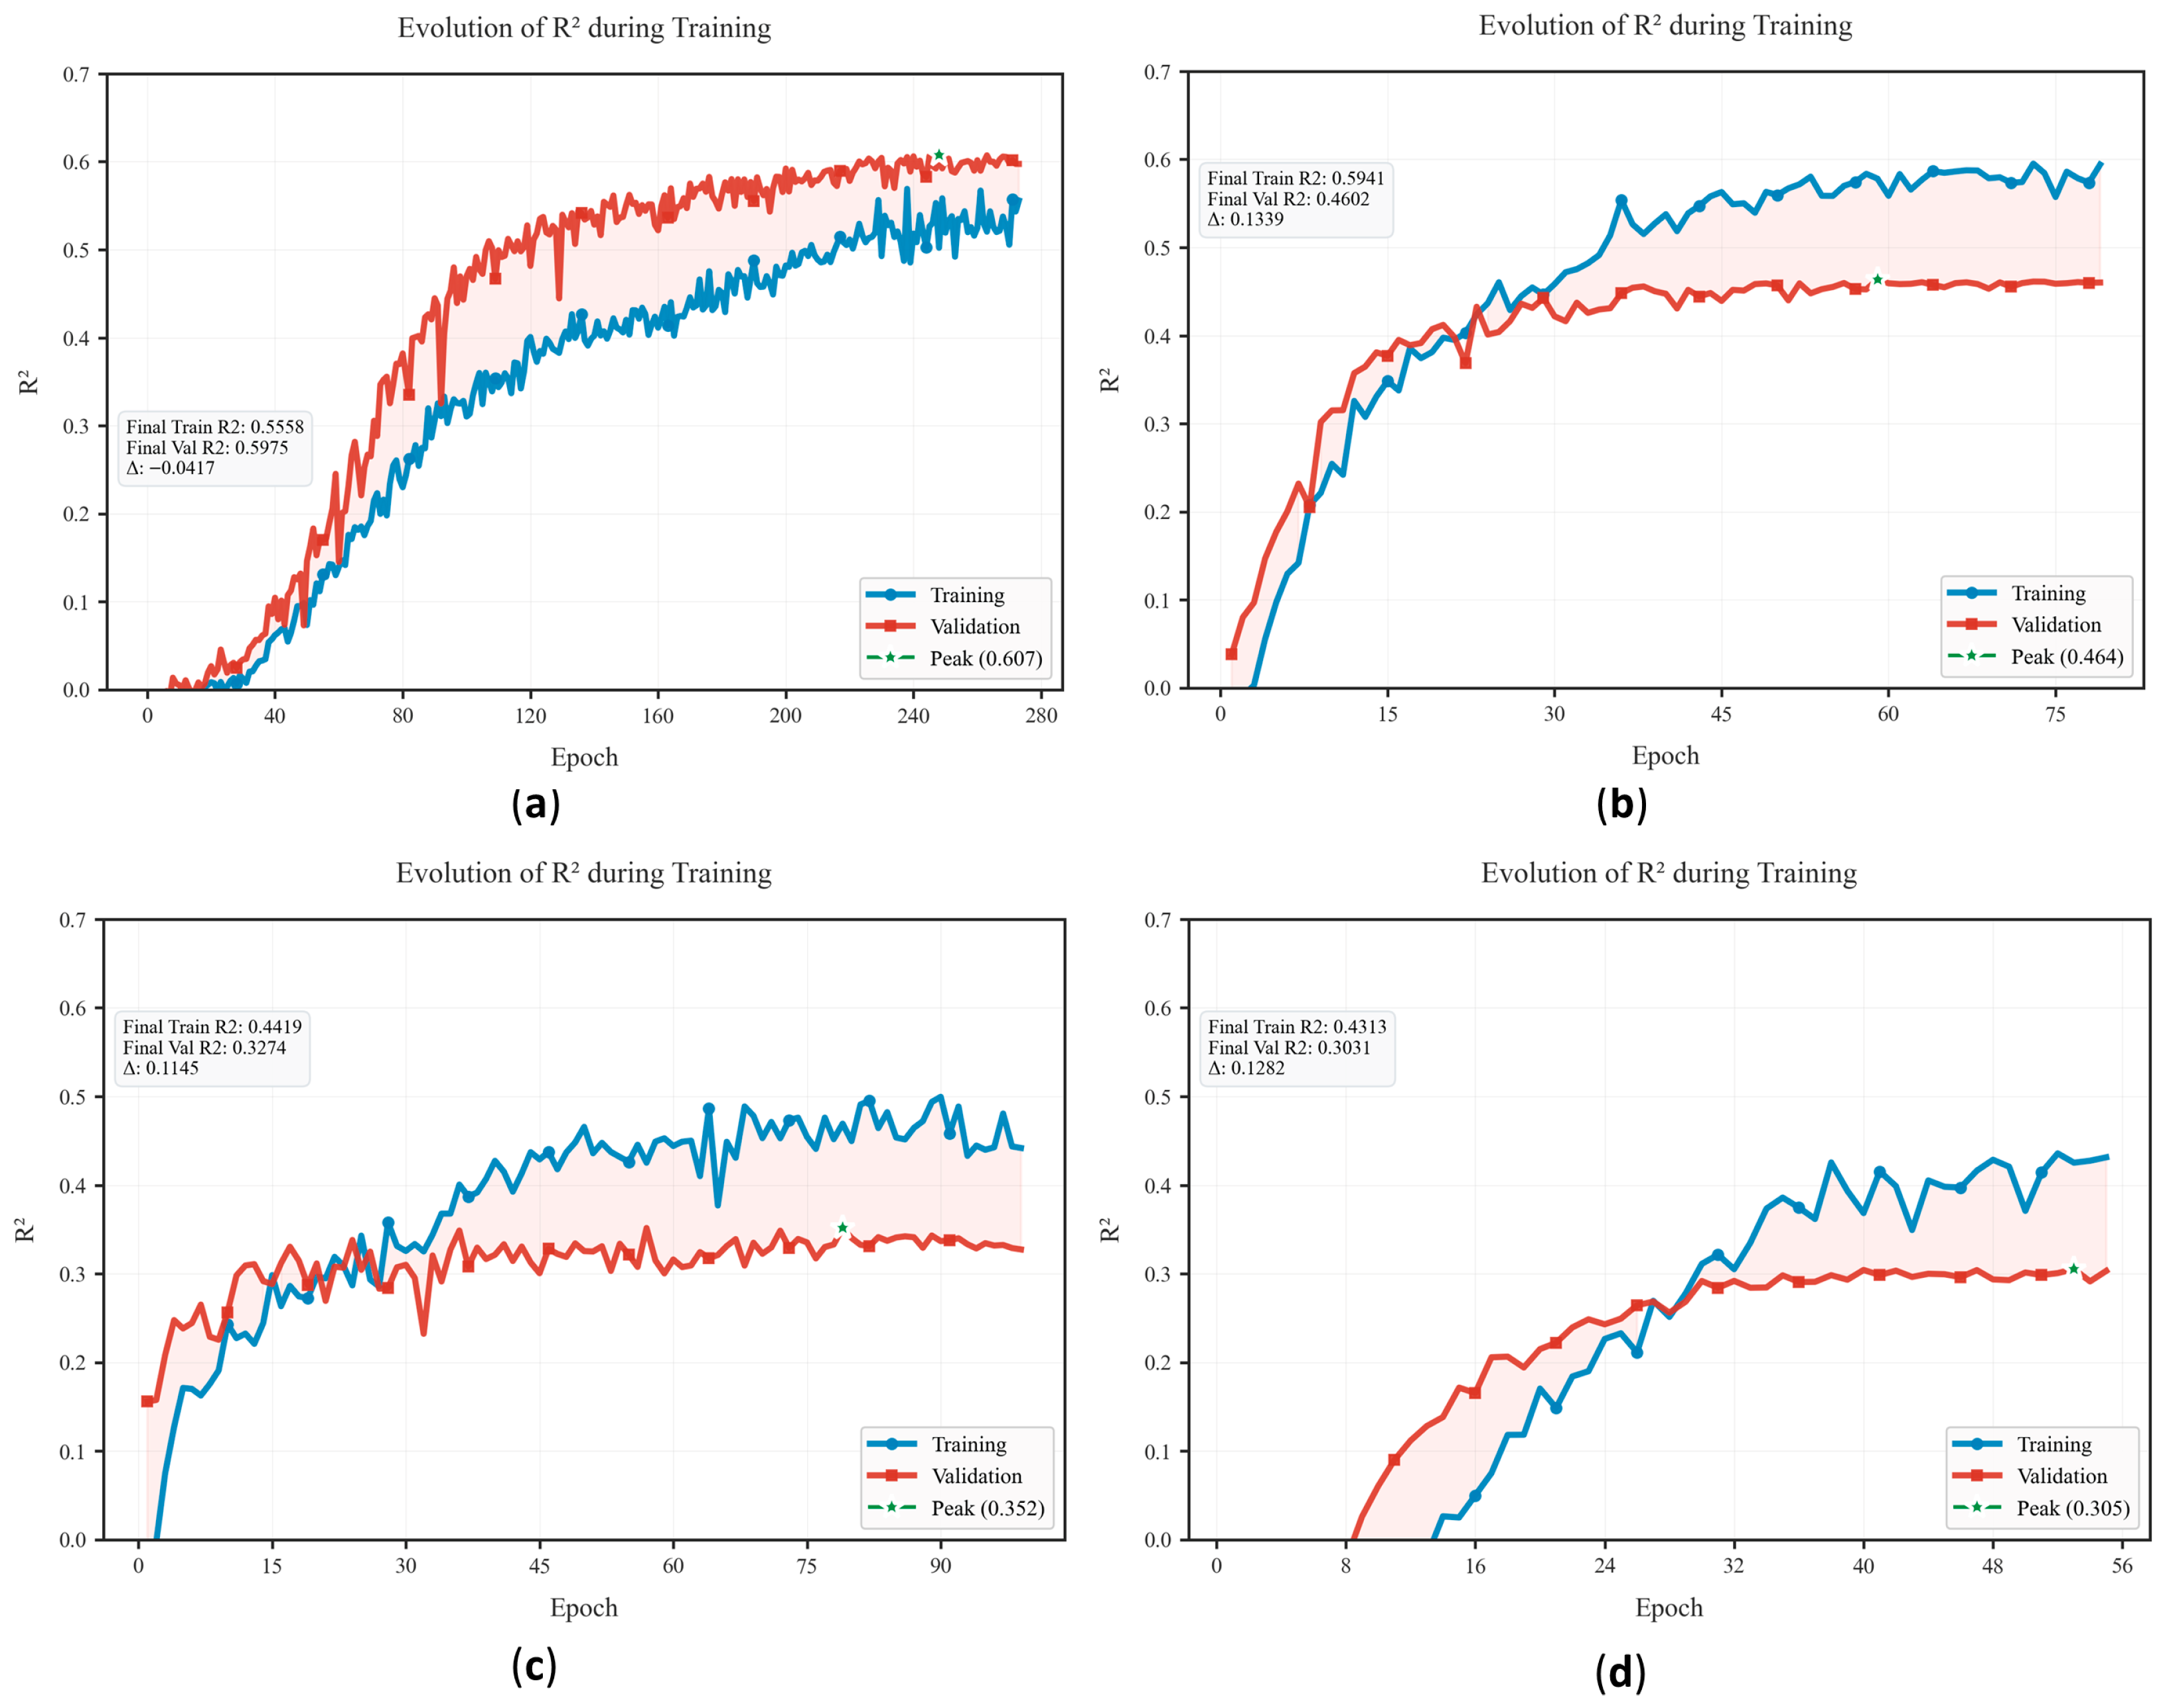
Figure 11 illustrates the evolution of the coefficient of determination (R2) during the training of the four evaluated models. Although 300 training epochs were initially defined, all models stopped earlier due to the early stopping mechanism with a patience of 20. Figure 11a shows that PropNet-R, despite requiring approximately 280 epochs to converge, exhibits a stable and consistent upward trend, achieving the best validation performance with an R2 of 0.607. SqueezeNet (Figure 11b) achieved the second-highest performance with an R2 of 0.464, converging after approximately 80 epochs. The VGG19 and ResNet50 models (Figure 11c,d, respectively) obtained R2 values of 0.352 and 0.305, indicating a lower predictive capacity on the validation set and suggesting greater difficulty in learning meaningful patterns from thermal images.
Figure 11. Evolution of the coefficient of determination (R2) during training for (a) PropNet-R; (b) SqueezeNet; (c) VGG19 and (d) ResNet50.
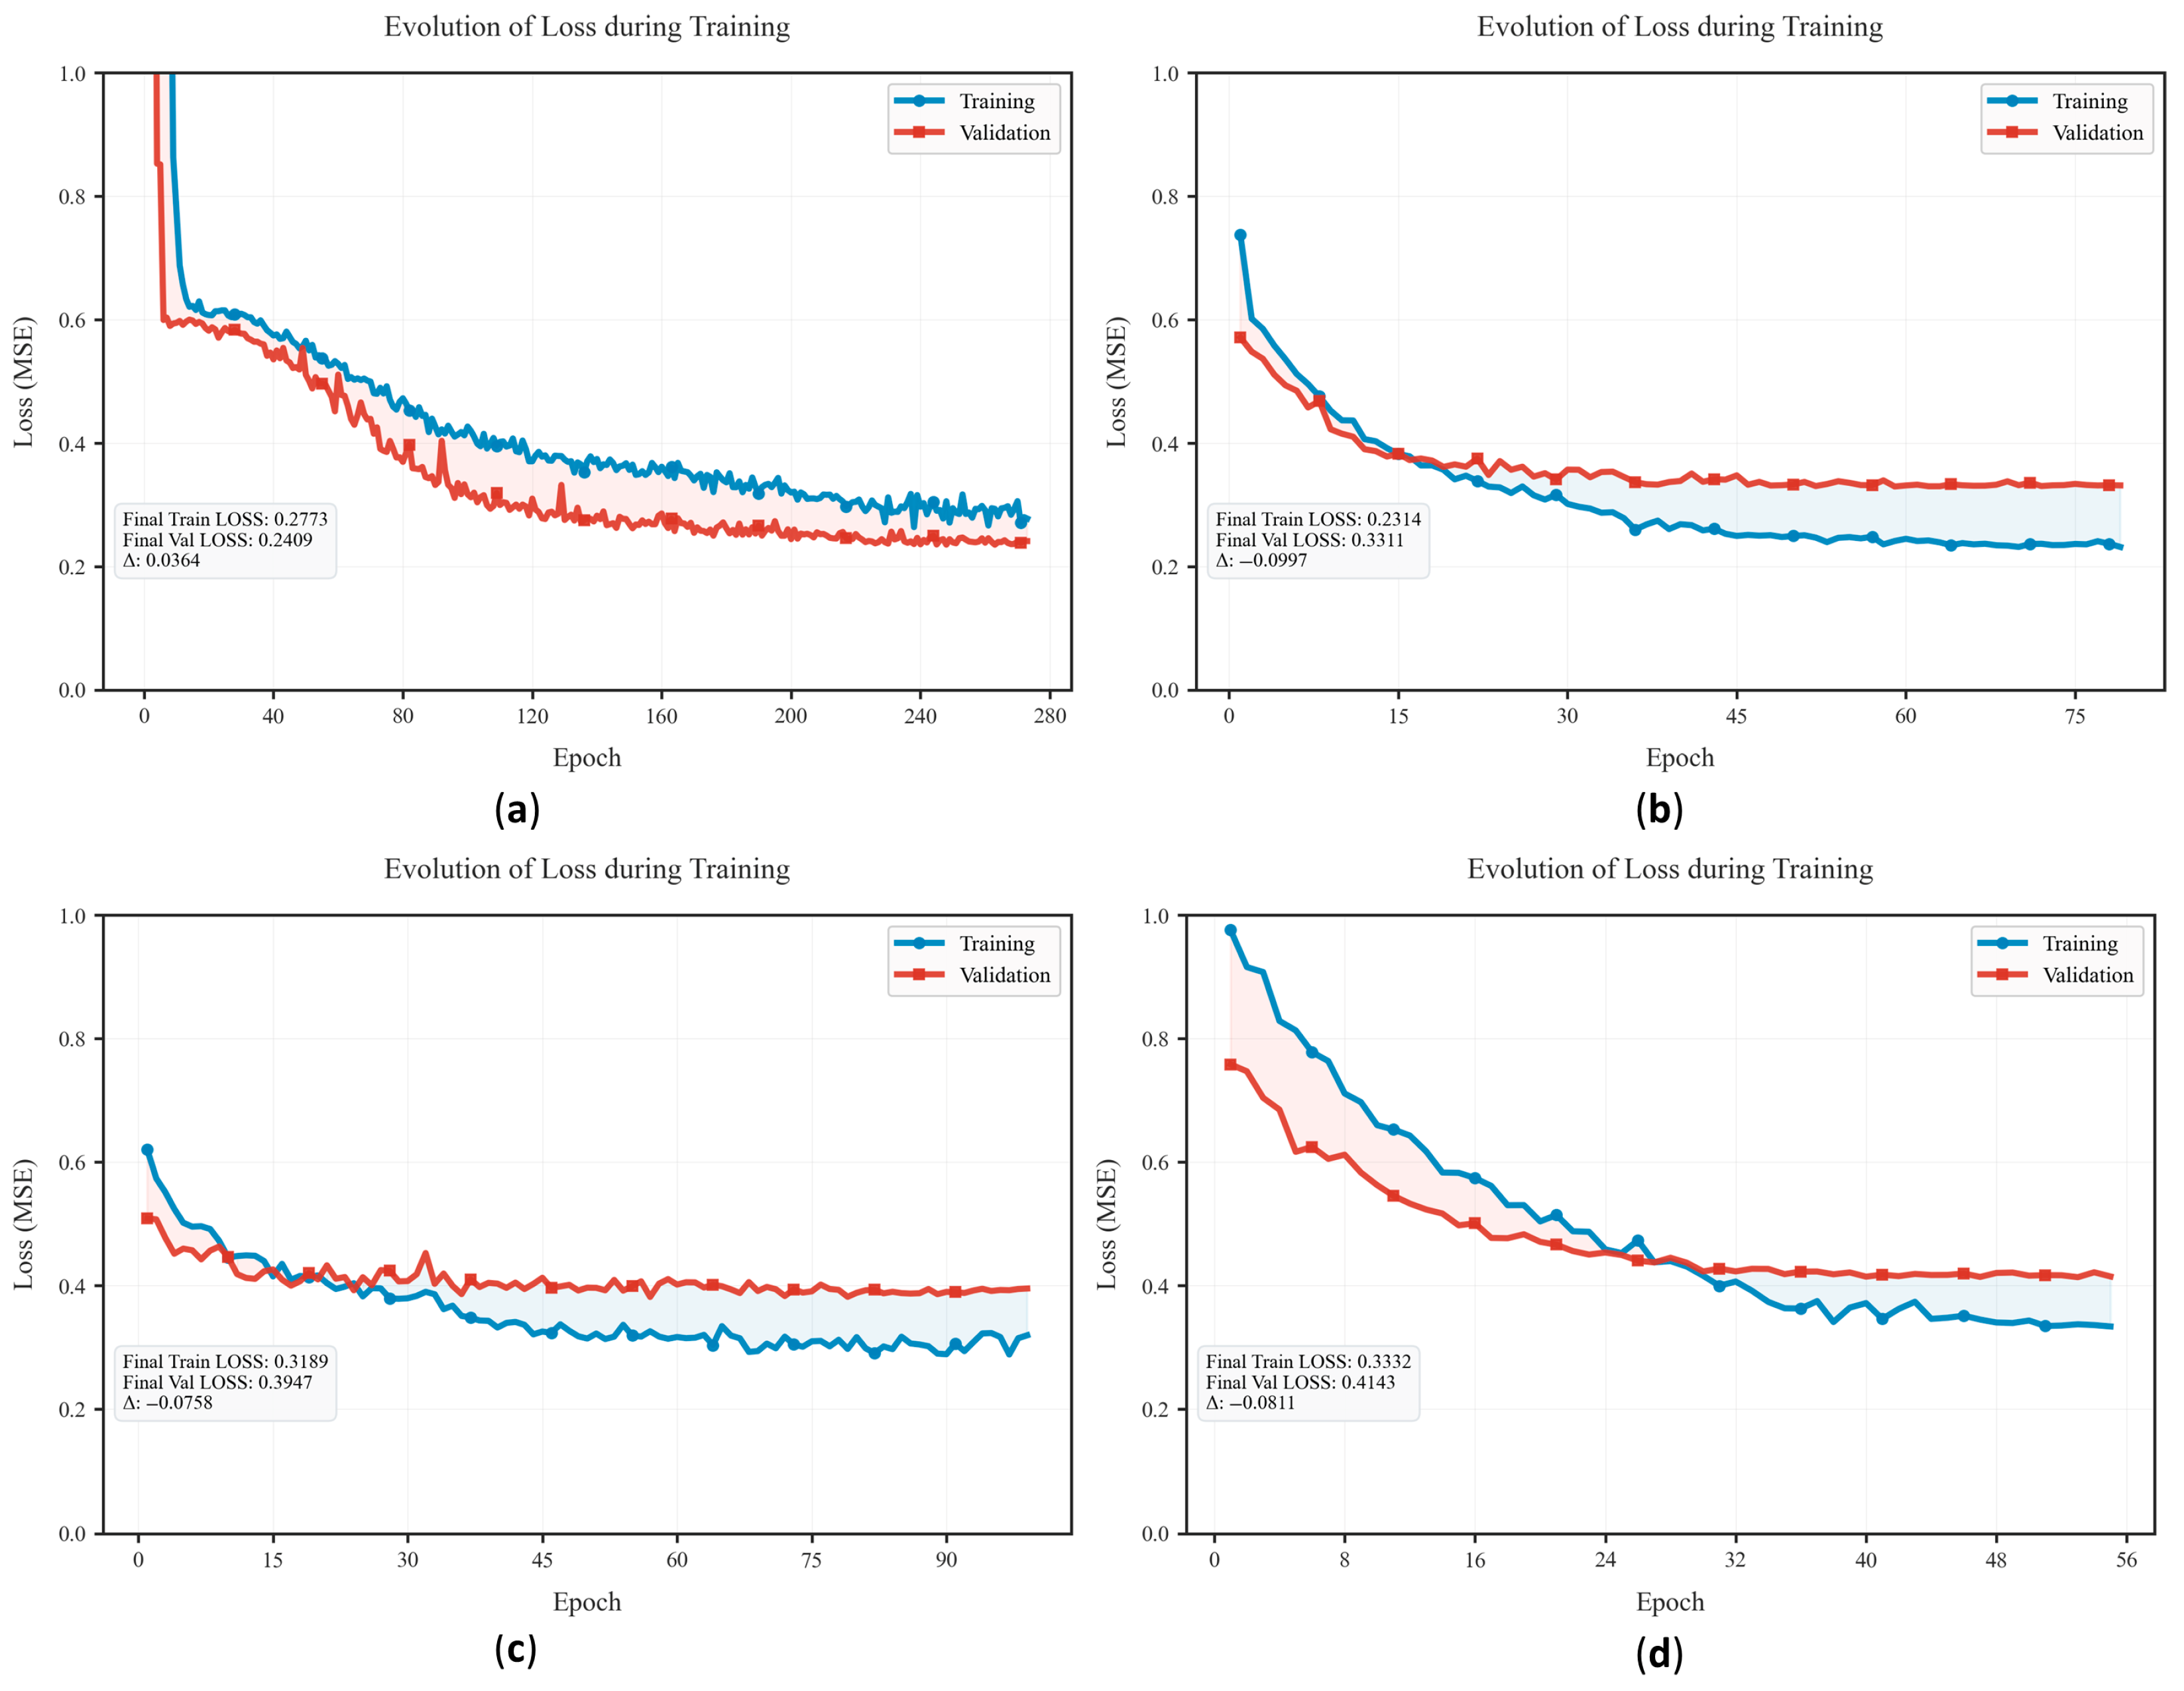
The loss function plots shown in Figure 12a–d allow for an analysis of model convergence and provide insights into the training dynamics. In particular, Figure 12a shows that PropNet-R exhibits a constant and sustained reduction of the mean squared error (MSE), reaching a final value of 0.241. Among the baseline models, SqueezeNet (Figure 12b) converges with an MSE of 0.331, VGG19 (Figure 12c) reaches 0.395, while ResNet50 (Figure 12d) exhibits the highest MSE at 0.414. Although PropNet-R requires more training epochs, it achieves a more stable convergence compared to the baseline models.
Figure 12. Evolution of Loss (MSE) during training for (a) PropNet-R; (b) SqueezeNet; (c) VGG19 and (d) ResNet50.
The evolution of mean absolute error (MAE), shown in Figure 13, confirms the patterns observed in previous metrics. PropNet-R (Figure 13a) maintains its characteristic stability during convergence, achieving a final MAE of 0.314, the lowest among the evaluated models. SqueezeNet (Figure 13b) records the second-lowest final MAE at 0.391, while VGG19 (Figure 13c) and ResNet50 (Figure 13d) reach values of 0.425 and 0.449, respectively. This progression aligns with the performance ranking observed in the test metrics reported in Table 5.
Figure 13. Evolution of mean absolute error (MAE) during training for (a) PropNet-R; (b) SqueezeNet; (c) VGG19; and (d) ResNet50.
Table 5. Comparative performance of the models evaluated on training and test sets *.
Table 5 shows that PropNet-R achieves superior performance on the test set, with MSE = 0.240 and RMSE = 0.489, demonstrating improved generalization with nearly identical metrics between training and test sets (ΔMSE = 0.004). This stability indicates effective regularization that prevents overfitting while maintaining predictive accuracy. The MSE values confirm that PropNet-R minimizes prediction variance more effectively than the baseline models.
In contrast, ResNet50 and VGG19 exhibit overfitting, with MSE increases of 0.061 and 0.066 between training and test sets, reaching test values of 0.474 and 0.447, respectively. Despite reasonable training performance, these pre-trained models struggle to generalize, likely due to their large parameter counts (approximately 23.6 and 26.4 million in the adapted versions), which favor memorization of thermal noise over meaningful feature extraction. SqueezeNet shows intermediate behavior (test MSE = 0.374, ΔMSE = 0.045), consistent with its more compact architecture of 723,000 parameters in the domain-adapted version.
Regarding the coefficient of determination, PropNet-R maintains virtually identical R2 values between training (0.607) and testing (0.614), evidencing generalization capability for quantitative estimation of propane concentrations. Additionally, the Pearson correlation coefficient (r = 0.786) validates the strong linear relationship between predictions and actual values. These results indicate that, under conditions of limited data and presence of thermal noise, PropNet-R, with its feature extraction architecture (3→32→64→128→256) and regression head (256→128→64→1), represents the most efficient option, combining predictive capacity with cross-set stability.
Table 6 summarizes the computational efficiency of the evaluated models. PropNet-R stands out for achieving the lowest inference time (4.897 ± 0.005 ms per image) and the lowest GPU memory usage (408.53 MB), outperforming the reference models in both aspects. In terms of trainable parameters, PropNet-R comprises approximately 1.2 million—more than SqueezeNet (721,217)—yet remains suitable for scenarios involving limited data and thermal noise, where efficiency is prioritized without compromising representational capacity.
Table 6. Computational efficiency of CNN models in thermal regression.

4. Discussion

This study addressed the challenge of quantitatively estimating propane concentrations from thermal images using deep learning. The results reveal clear differences in both predictive performance and generalization capability across the evaluated models. PropNet-R achieved a coefficient of determination R2 = 0.614, explaining approximately 61% of the variability in propane concentrations. This value represents an improvement of 21.7 percentage points over the second-best model, SqueezeNet (R2 = 0.397). The difference is both technically significant and operationally relevant in gas monitoring applications, where predictive accuracy directly impacts system reliability.
The transfer learning baselines displayed different levels of adaptation to thermal imaging despite fine-tuning. ResNet50 and VGG19 showed larger training–validation gaps than SqueezeNet, likely reflecting an architectural mismatch between natural-image priors and thermal representations. Their larger parameter counts (23.6 M and 23.2 M) also demanded stronger regularization to prevent memorization of training-specific noise instead of learning generalizable concentration–temperature relationships. Among these baselines, SqueezeNet achieved the best performance, outperforming both deeper architectures. Its compact structure contributed to this outcome, as fine-tuning all layers except the first convolution enabled the network to adapt effectively to thermal-specific features without severe overfitting.
For VGG19, unfreezing additional convolutional blocks beyond conv5 caused rapid overfitting even with dropout, so training was limited to the last block and the regression head, yielding more stable results. In ResNet50, extending fine-tuning beyond layer4.2 also reduced generalization. To address this, a Batch Normalization layer was added, dropout rates were adjusted to [0.4, 0.3], and the early stopping patience was reduced from 20 to 15 epochs to halt training once validation loss plateaued. SqueezeNet, due to its compact design, allowed broader fine-tuning—all layers except the initial convolution were retrained—achieving adaptation to thermal features without severe overfitting. The final settings were determined through systematic optimization of learning rate and weight decay (Table A2) combined with selective layer freezing to ensure stable convergence. Additional experiments tested dropout values of [0.5, 0.7, 0.75] across all models, as well as wide search spaces for learning rate and regularization parameters (Table A2). Although other setups, such as partial unfreezing of earlier blocks or layer-wise adaptive learning rates, were explored, the chosen configuration offered the best balance between stability and generalization for this dataset.
Our findings are related to those of Elgohary et al. [], who evaluated four transfer learning models (AlexNet, SqueezeNet, VGG19, and GoogLeNet) applied to thermal images of electrical transformer rooms for fault classification. In their study, SqueezeNet achieved a validation accuracy of 87.83% and a loss of 0.293. Similarly, Mahmoud et al. [] evaluated eleven pre-trained architectures for binary fault detection in switchgear using thermal images, where SqueezeNet achieved a test accuracy of 96.77%. In our case, although the objective was different—quantitative estimation of propane concentrations through regression—SqueezeNet behaved in a relatively more stable manner than the other reference architectures, achieving MSE = 0.374 and R2 = 0.397 on the test set. While this level of variance explanation cannot be considered high, it does suggest that, among the generic models considered, SqueezeNet offers a more consistent foundation for addressing regression tasks with thermal data.
Regarding ResNet50, our findings suggest a tendency toward overfitting, as indicated by a performance gap between training and testing phases (MSE increasing from 0.413 to 0.474; ΔMSE = 0.061). This behavior contrasts with that reported by Zhang et al. [], who developed a CO2 concentration prediction model in ship emissions from mid-infrared spectral images using ResNet50. In their study, the model demonstrated high predictive accuracy and low discrepancy with respect to actual values with MAE < 0.15, validating the capability of this architecture to capture the relationship between radiometric signals and gas concentrations under controlled laboratory conditions. The divergence from our results could be explained by the more complex and noisy nature of thermal data in the propane monitoring context, where spatial resolution and environmental conditions introduce additional variability.
The results suggest that PropNet-R presents promising characteristics for integration into continuous gas monitoring systems, acting as a complement to conventional chemical sensors. Unlike CNN-based approaches relying solely on binary detection, the proposed model offers quantitative estimates that enable implementation of gradual response protocols adjusted to specific concentration levels. This functionality contributes to improved responsiveness in industrial environments, while reinforcing critical redundancy in safety systems: when direct sensors fail or are compromised, automated thermal analysis ensures continuity of monitoring and reduces personnel exposure to hazardous conditions []. Additionally, this approach enables detection of concentrations across wider fields of view compared to point sensors []. Collectively, the complementarity between both modalities constitutes a safer, more resilient, and sustainable strategy for gas leak management.
Furthermore, PropNet-R’s computational efficiency reinforces its practical viability. With inference times below 5 ms per image and moderate memory requirements, the model processes continuous thermal image streams in near real-time on standard hardware. This performance, combined with its fully trainable architecture, enables effective integration into continuous monitoring systems with rapid leak response. Note that this study evaluated only prediction performance; total system response time, including image acquisition and preprocessing, remains for future assessment.
Despite these computational advantages, the results must be interpreted within the constraints of the experimental design. Measurements were conducted in controlled laboratory conditions using a glass chamber, which enabled precise variable control but does not fully represent real operational complexity. The dataset, while carefully synchronized, covers a specific concentration range and environmental profile. Factors such as ambient temperature variations, humidity fluctuations, air currents, and external thermal interference—common in industrial settings—were not systematically evaluated and may affect model performance. Additionally, the LPG composition used (60% C3H8, 40% C4H10, specific to Peru) may limit applicability to regions with different propane–butane ratios.
Practical deployment introduces additional considerations. While the model runs efficiently on standard computing hardware, thermal imaging cameras remain necessary for data acquisition. System calibration across diverse operational environments and long-term performance validation require further investigation. Although performance is reported in normalized units for consistency, future work must verify that prediction errors remain within acceptable margins relative to propane’s lower explosive limit (LEL) and occupational exposure standards to ensure safe real-world deployment.
These results establish a foundation for methodological extensions. Validation in uncontrolled industrial environments represents the immediate priority, followed by assessment under variable environmental conditions and extension to other combustible gases common in industrial applications.

5. Conclusions

This study demonstrates that architectures designed for thermal image regression outperform generic transfer learning approaches in quantitative gas concentration estimation. PropNet-R achieved MSE = 0.240 and R2 = 0.614. The model surpassed SqueezeNet (MSE = 0.374, R2 = 0.397) in both metrics. Deep generic architectures (ResNet50, VGG19) failed to adapt effectively even after fine-tuning, exhibiting considerable overfitting with test MSE values exceeding 0.44 and R2 below 0.30, while the proposed specialized architecture outperformed all baseline models.
PropNet-R’s inference time below 5 ms and standard hardware requirements enable real-time deployment without specialized computing infrastructure, reducing implementation costs and energy consumption. This computational efficiency aligns with sustainable technology principles while providing quantitative concentration estimates that complement traditional point sensors.
The sustainability implications are direct. PropNet-R strengthens the redundancy of safety systems in facilities handling combustible gases, particularly when direct sensors fail or become compromised. This reduces accident risk and facilitates real-time decision-making. In high-vulnerability scenarios such as processing plants, LPG warehouses, or urban areas with aging infrastructure, its implementation can directly protect human lives, prevent material losses, and ensure regulatory compliance. Likewise, automated thermal analysis covers broader fields of view than point sensors, establishing a safer, more resilient, and sustainable strategy for gas leak management.
Field validation in industrial environments remains the immediate priority. Testing under variable conditions will establish operational boundaries before deployment. Extension to other combustible gases and edge device optimization represent secondary objectives.
This work establishes thermal image regression as a viable approach for continuous gas monitoring that balances technical performance with sustainability: reduced hardware requirements, lower energy consumption, decreased sensor waste, and improved worker safety. The methodology contributes to SDG 9 (Industry, Innovation and Infrastructure) and SDG 11 (Sustainable Cities and Communities) through safer, more resource-efficient industrial operations.

Author Contributions

Conceptualization, L.A.H.-A., J.C.P.-L., D.J.S.-P., N.J.U.-G., E.E.C.-V. and Y.V.-N.; methodology, L.A.H.-A., J.C.P.-L., J.M.B.-A. and J.A.A.-P.; software, L.A.H.-A., D.R.E., D.D.C.-A. and N.J.U.-G.; validation, E.E.C.-V., L.A.H.-A., J.C.P.-L. and D.D.C.-A.; formal analysis, E.E.C.-V., L.A.H.-A., J.M.B.-A., N.J.U.-G. and J.A.A.-P.; investigation, L.A.H.-A., J.C.P.-L., D.R.E., D.D.C.-A., Y.V.-N., J.M.B.-A. and D.J.S.-P.; resources, L.A.H.-A. and J.C.P.-L.; data curation, L.A.H.-A., J.C.P.-L., Y.V.-N., J.A.A.-P. and E.E.C.-V.; writing—original draft preparation, L.A.H.-A., J.C.P.-L., N.J.U.-G., E.E.C.-V., Y.V.-N., J.M.B.-A., J.A.A.-P. and D.J.S.-P.; writing—review and editing, L.A.H.-A., J.C.P.-L., J.M.B.-A., E.E.C.-V., Y.V.-N., D.R.E., J.A.A.-P. and D.D.C.-A.; visualization, L.A.H.-A. and E.E.C.-V.; supervision, L.A.H.-A. and J.C.P.-L.; project administration, L.A.H.-A. and J.C.P.-L.; funding acquisition, L.A.H.-A. and J.C.P.-L. All authors have read and agreed to the published version of the manuscript.

Funding

This research was funded by Universidad Nacional Amazónica de Madre de Dios, grant number (2024-1CGI-19). The APC was funded by Universidad Nacional Amazónica de Madre de Dios.

Institutional Review Board Statement

Not applicable.

Data Availability Statement

The data used in this study are available upon request by contacting the corresponding author, Luis Alberto Holgado-Apaza, via email at lholgado@unamad.edu.pe. Interested parties are encouraged to reach out to the author to obtain access to the data.

Conflicts of Interest

The authors declare no conflicts of interest.

Appendix A

Appendix A.1

Table A1 shows the hardware specifications used for multisensor data collection for gas leak detection.
Table A1. System hardware components and specifications.
ComponentModelKey SpecificationsReferences
Processing UnitRaspberry Pi 4 Model BARM Cortex-A72, 40 GPIO pins, Bluetooth 5.0, WiFi[]
Gas SensorTGS6810Propane/methane detection, linear response, low power[,,]
Thermal CameraAdafruit MLX9064032 × 24 IR array, −40 °C to 300 °C, 32 Hz max[]
Temperature, humidity, air pressure and air quality sensorBME690Operating range
Pressure: 300 to 1100 hPa
Humidity: 0 to 100%
Temperature: −40 to 85 °C
[]

Appendix A.2

For a given concentration value x, where Q75 and Q25 represent the 75th and 25th percentiles of the training data, respectively, and Q50 represents the median, the robust scaling transformation is defined by Equation (A1).
y = ( x Q 50 ) ( Q 75 Q 25 )

Appendix A.3

Table A2. Search spaces and optimal hyperparameter values for each architecture.
ModelHyperparameterSearch SpaceOptimal Value
SqueezeNetlr[0.0000: 0.002] step 0.00011.00 × 10−4
weight_decay[0.00: 0.100] step 0.016.00 × 10−2
VGG19lr[0.0000: 0.002] step 0.00013.00 × 10−4
weight_decay[0.000: 0.050] step 0.0052.50 × 10−2
ResNet50lr[0.00000: 0.0002] step 0.000015.00 × 10−5
weight_decay[0.000: 0.010] step 0.0017.00 × 10−3
PropNet-Rlr[0.000: 0.020] step 0.0011.00 × 10−3
weight_decay[0.000: 0.010] step 0.0011.00 × 10−3

Appendix A.4

Figure A1 presents the daily statistical distributions of temperature, relative humidity, and atmospheric pressure recorded during the propane dispersion experiments.
Figure A1. Distribution of Environmental Variables by Date.

References

  1. Synák, F.; Čulík, K.; Rievaj, V.; Gaňa, J. Liquefied Petroleum Gas as an Alternative Fuel. Transp. Res. Procedia 2019, 40, 527–534. [Google Scholar] [CrossRef]
  2. Gould, C.F.; Urpelainen, J. LPG as a Clean Cooking Fuel: Adoption, Use, and Impact in Rural India. Energy Policy 2018, 122, 395–408. [Google Scholar] [CrossRef]
  3. Khanwilkar, S.; Gould, C.F.; DeFries, R.; Habib, B.; Urpelainen, J. Firewood, Forests, and Fringe Populations: Exploring the Inequitable Socioeconomic Dimensions of Liquified Petroleum Gas (LPG) Adoption in India. Energy Res. Soc. Sci. 2021, 75, 102012. [Google Scholar] [CrossRef]
  4. Zhou, L.; He, W.; Kong, Y.; Zhang, Z. Fuel Upgrading in the Kitchen: When Cognition of Biodiversity Conservation and Climate Change Facilitates Household Cooking Energy Transition in Nine Nature Reserves and Their Adjacent Regions. Energy 2025, 320, 135445. [Google Scholar] [CrossRef]
  5. Kim, D.S.; Chung, B.J.; Son, S.Y.; Lee, J. Developments of the In-Home Display Systems for Residential Energy Monitoring. In Proceedings of the 2013 IEEE International Conference on Consumer Electronics (ICCE), Las Vegas, NV, USA, 11–14 January 2013; pp. 108–109. [Google Scholar] [CrossRef]
  6. Martins, J.; Brito, F.P. Alternative Fuels for Internal Combustion Engines. Energies 2020, 13, 4086. [Google Scholar] [CrossRef]
  7. Selim, M.Y.E.-S. Liquefied Petroleum Gas. In Alternative Fuels for Transportation; CRC Press: Boca Raton, FL, USA, 2016; pp. 203–226. [Google Scholar] [CrossRef]
  8. Hashem, G.T.; Al-Dawody, M.F.; Sarris, I.E. The Characteristics of Gasoline Engines with the Use of LPG: An Experimental and Numerical Study. Int. J. Thermofluids 2023, 18, 100316. [Google Scholar] [CrossRef]
  9. Woo, S.; Lee, J.; Lee, K. Experimental Study on the Performance of a Liquefied Petroleum Gas Engine According to the Air Fuel Ratio. Fuel 2021, 303, 121330. [Google Scholar] [CrossRef]
  10. Woo, S.; Lee, J.; Lee, K. Investigation of Injection Characteristics for Optimization of Liquefied Petroleum Gas Applied to a Direct-Injection Engine. Energy Rep. 2023, 9, 2130–2139. [Google Scholar] [CrossRef]
  11. Zahir, M.T.; Sagar, M.; Imam, Y.; Yadav, A.; Yadav, P. A Review on Gsm Based LPG Leakage Detection and Controller. In Proceedings of the 4th International Conference on Information Management & Machine Intelligence, Jaipur, India, 23–24 December 2022. [Google Scholar] [CrossRef]
  12. Bhagyashree, D.; Alkesh, G.; Sahil, M.; Ayush, T.; Abhishek, G.; Aman, N. LPG Gas Leakage Detection and Alert System. Int. J. Res. Appl. Sci. Eng. Technol. 2023, 11, 3302–3305. [Google Scholar] [CrossRef]
  13. Hu, Q.; Qian, X.; Shen, X.; Zhang, Q.; Ma, C.; Pang, L.; Liang, Y.; Feng, H.; Yuan, M. Investigations on Vapor Cloud Explosion Hazards and Critical Safe Reserves of LPG Tanks. J. Loss Prev. Process Ind. 2022, 80, 104904. [Google Scholar] [CrossRef]
  14. Terzioglu, L.; Iskender, H. Modeling the Consequences of Gas Leakage and Explosion Fire in Liquefied Petroleum Gas Storage Tank in Istanbul Technical University, Maslak Campus. Process. Saf. Prog. 2021, 40, 319–326. [Google Scholar] [CrossRef]
  15. Yang, J.; Liu, Z.; Xia, D.; Zhang, C.; Yang, Y. A Plasma Partial Oxidation Approach for Removal of Leaked LPG in Confined Spaces. Process. Saf. Environ. Prot. 2024, 188, 694–702. [Google Scholar] [CrossRef]
  16. Gabhane, L.R.; Kanidarapu, N.R. Environmental Risk Assessment Using Neural Network in Liquefied Petroleum Gas Terminal. Toxics 2023, 11, 348. [Google Scholar] [CrossRef]
  17. Karthi, S.P.; Sri, P.J.; Kumar, M.M.; Akash, S.; Lavanya, S.; Varshan, K.H. Arduino Based Crizon Gas Detector System. In Proceedings of the 2021 5th International Conference on Electronics, Communication and Aerospace Technology (ICECA), Coimbatore, India, 2–4 December 2021; Volume 2021, pp. 383–387. [Google Scholar] [CrossRef]
  18. Duong, P.A.; Lee, J.; Kang, H. LPG Dispersion in Confined Spaces: A Comprehensive Review. Eng. Rep. 2025, 7, e70064. [Google Scholar] [CrossRef]
  19. Rahayu, N.; Tinggi, S.; Bengkulu, I.A. Early Warning Of Leaking Lpg Gas Through Short Message Service (Sms) And Loudspeaker Tool Using Arduino Uno. J. Appl. Eng. Technol. Sci. 2020, 1, 91–102. [Google Scholar] [CrossRef]
  20. Pawar, S.; Korde, M.; Bhujade, P.; Auti, P. Intelligent Life Saver System with Gas Leakage. Int. J. Adv. Res. Sci. Commun. Technol. 2023, 3, 244–248. [Google Scholar] [CrossRef]
  21. Ahmed, S.; Rahman, M.J.; Razzak, M.A. Design and Development of an IoT-Based LPG Gas Leakage Detector for Households and Industries. In Proceedings of the 2023 IEEE World AI IoT Congress (AIIoT), Seattle, WA, USA, 7–10 June 2023; pp. 762–767. [Google Scholar] [CrossRef]
  22. Munahar, S.; Purnomo, B.C.; Ferdiansyah, N.; Widodo, E.M.; Aman, M.; Rusdjijati, R.; Setiyo, M. Risk-Based Leak Analysis of an LPG Storage Tank: A Case Study. Indones. J. Sci. Technol. 2022, 7, 37–64. [Google Scholar] [CrossRef]
  23. Pateriya, P.K.; Munna, A.A.; Saha, A.; Biswas, H.; Ahammed, A.; Shah, A. IoT-Based LPG Gas Leakage Detection and Prevention System. SSRN Electron. J. 2021. [Google Scholar] [CrossRef]
  24. Kimura, A.; Kudou, J.; Yuzui, T.; Itoh, H.; Oka, H. Numerical Simulation on Diffusion Behavior of Leaked Fuel Gas in Machinary Room. J. JIME 2021, 56, 638–645. [Google Scholar] [CrossRef]
  25. Bariha, N.; Ojha, D.K.; Srivastava, V.C.; Mishra, I.M. Fire and Risk Analysis during Loading and Unloading Operation in Liquefied Petroleum Gas (LPG) Bottling Plant. J. Loss Prev. Process Ind. 2023, 81, 104928. [Google Scholar] [CrossRef]
  26. Naveen, P.; Teja, K.R.; Reddy, K.S.; Sam, S.M.; Kumar, M.D.; Saravanan, M. A Comprehensive Review on Gas Leakage Monitoring and Alerting System Using IoT Devices. In Proceedings of the 2022 International Conference on Computer, Power and Communications (ICCPC), Chennai, India, 14–16 December 2022; pp. 242–246. [Google Scholar] [CrossRef]
  27. CTIF. Informe Mundial de Estadísticas de Incendios n.° 29 con un análisis exhaustivo de las estadísticas de incendios de 2022 | CTIF—Asociación Internacional de Servicios de Bomberos Para una Ciudadanía Más Segura Gracias a la Capacitación de Bomberos. Available online: https://www.ctif.org/news/world-fire-statistics-report-no-29-comprehensive-analysis-fire-statistics-2022 (accessed on 27 August 2025).
  28. OSINERGMIN. Informe de Resultados Consumo y Usos de Los Hidrocarburos Líquidos y GLP Encuesta Residencial de Consumo y Usos de Energía-ERCUE 2018; Osinergmin: Lima, Peru, 2020. [Google Scholar]
  29. CGBVP. Estadística de Emergencias Atendidas a Nivel Nacional. Available online: https://www.bomberosperu.gob.pe/diprein/Estadisticas/po_contenido_estadisticas.asp (accessed on 27 August 2025).
  30. OSINERGMIN. El Mercado Del GLP En El Perú: Problemática y Propuestas de Solución; Osinergmin: Lima, Peru, 2011. [Google Scholar]
  31. Wu, S.; Zhong, X.; Qu, Z.; Wang, Y.; Li, L.; Zeng, C. Infrared Gas Detection and Concentration Inversion Based on Dual-Temperature Background Points. Photonics 2023, 10, 490. [Google Scholar] [CrossRef]
  32. Zhang, M.; Chen, G.; Lin, P.; Dong, D.; Jiao, L. Gas Imaging with Uncooled Thermal Imager. Sensors 2024, 24, 1327. [Google Scholar] [CrossRef]
  33. Wang, J.; Lin, Y.; Zhao, Q.; Luo, D.; Chen, S.; Chen, W.; Peng, X. Invisible Gas Detection: An RGB-Thermal Cross Attention Network and a New Benchmark. Comput. Vis. Image Underst. 2024, 248, 104099. [Google Scholar] [CrossRef]
  34. Mahmoud, K.A.A.; Badr, M.M.; Elmalhy, N.A.; Hamdy, R.A.; Ahmed, S.; Mordi, A.A. Transfer Learning by Fine-Tuning Pre-Trained Convolutional Neural Network Architectures for Switchgear Fault Detection Using Thermal Imaging. Alex. Eng. J. 2024, 103, 327–342. [Google Scholar] [CrossRef]
  35. Elgohary, A.A.; Badr, M.M.; Elmalhy, N.A.; Hamdy, R.A.; Ahmed, S.; Mordi, A.A. Transfer of Learning in Convolutional Neural Networks for Thermal Image Classification in Electrical Transformer Rooms. Alex. Eng. J. 2024, 105, 423–436. [Google Scholar] [CrossRef]
  36. Zhang, Z.; Wang, H.; Cao, K.; Li, Y. Using a Convolutional Neural Network and Mid-Infrared Spectral Images to Predict the Carbon Dioxide Content of Ship Exhaust. Remote Sens. 2023, 15, 2721. [Google Scholar] [CrossRef]
  37. Cao, X.; Shi, X.; Wang, Y. Infrared Fire Image Recognition Algorithm Based on ResNet50 and Transfer Learning. In Proceedings of the 2nd International Conference on Cyber Security, Artificial Intelligence and Digital Economy (CSAIDE 2023), Nanjing, China, 3–5 March 2023; Volume 12718, pp. 438–444. [Google Scholar] [CrossRef]
  38. Attallah, O.; Elhelw, A.M. Gas Leakage Recognition Using Manifold Convolutional Neural Networks and Infrared Thermal Images. In Proceedings of the 2023 Congress in Computer Science, Computer Engineering, & Applied Computing (CSCE), Las Vegas, NV, USA, 24–27 July 2023; Volume 2023, pp. 2003–2008. [Google Scholar] [CrossRef]
  39. Wang, J.; Ji, J.; Ravikumar, A.P.; Savarese, S.; Brandt, A.R. VideoGasNet: Deep Learning for Natural Gas Methane Leak Classification Using an Infrared Camera. Energy 2022, 238, 121516. [Google Scholar] [CrossRef]
  40. Bin, J.; Bahrami, Z.; Rahman, C.A.; Du, S.; Rogers, S.; Liu, Z. Foreground Fusion-Based Liquefied Natural Gas Leak Detection Framework From Surveillance Thermal Imaging. IEEE Trans. Emerg. Top. Comput. Intell. 2023, 7, 1151–1162. [Google Scholar] [CrossRef]
  41. Wang, S.H.; Chou, T.I.; Chiu, S.W.; Tang, K.T. Using a Hybrid Deep Neural Network for Gas Classification. IEEE Sens. J. 2021, 21, 6401–6407. [Google Scholar] [CrossRef]
  42. Saleem, F.; Ahmad, Z.; Kim, J.M. Real-Time Pipeline Leak Detection: A Hybrid Deep Learning Approach Using Acoustic Emission Signals. Appl. Sci. 2024, 15, 185. [Google Scholar] [CrossRef]
  43. Spandonidis, C.; Theodoropoulos, P.; Giannopoulos, F. A Combined Semi-Supervised Deep Learning Method for Oil Leak Detection in Pipelines Using IIoT at the Edge. Sensors 2022, 22, 4105. [Google Scholar] [CrossRef]
  44. Zhang, E.; Zhang, E. Gas Pipeline Leakage Detection Based on Multiple Multimodal Deep Feature Selections and Optimized Deep Forest Classifier. Front. Environ. Sci. 2025, 13, 1569621. [Google Scholar] [CrossRef]
  45. Sharma, A.; Khullar, V.; Kansal, I.; Chhabra, G.; Arora, P.; Popli, R.; Kumar, R. Gas Detection and Classification Using Multimodal Data Based on Federated Learning. Sensors 2024, 24, 5904. [Google Scholar] [CrossRef]
  46. Attallah, O. Multitask Deep Learning-Based Pipeline for Gas Leakage Detection via E-Nose and Thermal Imaging Multimodal Fusion. Chemosensors 2023, 11, 364. [Google Scholar] [CrossRef]
  47. Zhang, E.; Zhang, E. Development of A Multimodal Deep Feature Fusion with Ensemble Learning Architecture for Real-Time Gas Leak Detection. In Proceedings of the 2024 IEEE 3rd International Conference on Computing and Machine Intelligence (ICMI), Mt Pleasant, MI, USA, 13–14 April 2024. [Google Scholar] [CrossRef]
  48. Zhang, X.; Shi, J.; Huang, X.; Xiao, F.; Yang, M.; Huang, J.; Yin, X.; Sohail Usmani, A.; Chen, G. Towards Deep Probabilistic Graph Neural Network for Natural Gas Leak Detection and Localization without Labeled Anomaly Data. Expert Syst. Appl. 2023, 231, 120542. [Google Scholar] [CrossRef]
  49. Wang, S.; Bi, Y.; Shi, J.; Wu, Q.; Zhang, C.; Huang, S.; Gao, W.; Bi, M. Deep Learning-Based Hydrogen Leakage Localization Prediction Considering Sensor Layout Optimization in Hydrogen Refueling Stations. Process. Saf. Environ. Prot. 2024, 189, 549–560. [Google Scholar] [CrossRef]
  50. Zhang, L.; Wu, Q.; Liu, M.; Chen, H.; Wang, D.; Li, X.; Ba, Q. Hydrogen Leakage Location Prediction in a Fuel Cell System of Skid-Mounted Hydrogen Refueling Stations. Energies 2025, 18, 228. [Google Scholar] [CrossRef]
  51. Yan, W.; Liu, W.; Zhang, Q.; Bi, H.; Jiang, C.; Liu, H.; Wang, T.; Dong, T.; Ye, X. Multisource Multimodal Feature Fusion for Small Leak Detection in Gas Pipelines. IEEE Sens. J. 2024, 24, 1857–1865. [Google Scholar] [CrossRef]
  52. Spandonidis, C.; Theodoropoulos, P.; Giannopoulos, F.; Galiatsatos, N.; Petsa, A. Evaluation of Deep Learning Approaches for Oil & Gas Pipeline Leak Detection Using Wireless Sensor Networks. Eng. Appl. Artif. Intell. 2022, 113, 104890. [Google Scholar] [CrossRef]
  53. Ji, H.; An, C.H.; Lee, M.; Yang, J.; Park, E. Fused Deep Neural Networks for Sustainable and Computational Management of Heat-Transfer Pipeline Diagnosis. Dev. Built Environ. 2023, 14, 100144. [Google Scholar] [CrossRef]
  54. Yao, C.; Nagao, M.; Datta-Gupta, A.; Mishra, S. An Efficient Deep Learning-Based Workflow for Real-Time CO2 Plume Visualization in Saline Aquifer Using Distributed Pressure and Temperature Measurements. Geoenergy Sci. Eng. 2024, 239, 212990. [Google Scholar] [CrossRef]
  55. Xu, S.; Wang, X.; Sun, Q.; Dong, K. MWIRGas-YOLO: Gas Leakage Detection Based on Mid-Wave Infrared Imaging. Sensors 2024, 24, 4345. [Google Scholar] [CrossRef] [PubMed]
  56. Narkhede, P.; Walambe, R.; Mandaokar, S.; Chandel, P.; Kotecha, K.; Ghinea, G. Gas Detection and Identification Using Multimodal Artificial Intelligence Based Sensor Fusion. Appl. Syst. Innov. 2021, 4, 3. [Google Scholar] [CrossRef]
  57. Hosny, K.M.; Magdi, A.; Salah, A.; El-Komy, O.; Lashin, N.A. Internet of Things Applications Using Raspberry-Pi: A Survey. Int. J. Electr. Comput. Eng. 2023, 13, 902–910. [Google Scholar] [CrossRef]
  58. Zekovic, A. Survey of Internet of Things Applications Using Raspberry Pi and Computer Vision. In Proceedings of the 2023 31st Telecommunications Forum (TELFOR), Belgrade, Serbia, 21–22 November 2023. [Google Scholar] [CrossRef]
  59. Prieto-Luna, J.C.; Alarcón-Sucasaca, A.; Fernández-Romero, V.; Turpo-Galeano, Y.H.; Delgado-Berrocal, Y.R.; Holgado-Apaza, L.A. Automated Monitoring System for Estrus Signs in Cattle Using Precision Livestock Farming with IoT Technology in the Peruvian Amazon. Rev. Cient. Sist. Inform. 2025, 5, e837. [Google Scholar] [CrossRef]
  60. Farrel, G.E.; Yahya, W.; Basuki, A.; Amron, K.; Siregar, R.A. Scalable Edge Computing Cluster Using a Set of Raspberry Pi: A Framework. In Proceedings of the 8th International Conference on Sustainable Information Engineering and Technology, Badung, Indonesia, 24–25 October 2023; pp. 287–296. [Google Scholar] [CrossRef]
  61. Gizinski, T.; Cao, X. Design, Implementation and Performance of an Edge Computing Prototype Using Raspberry Pis. In Proceedings of the 2022 IEEE 12th Annual Computing and Communication Workshop and Conference (CCWC), Las Vegas, NV, USA, 26–29 January 2022; Volume 2022, pp. 592–601. [Google Scholar] [CrossRef]
  62. Salka, T.D.; Hanafi, M.B.; Rahman, S.M.S.A.A.; Zulperi, D.B.M.; Omar, Z. Plant Leaf Disease Detection and Classification Using Convolution Neural Networks Model: A Review. Artif. Intell. Rev. 2025, 58, 1–66. [Google Scholar] [CrossRef]
  63. Lathuilière, S.; Mesejo, P.; Alameda-Pineda, X.; Horaud, R. A Comprehensive Analysis of Deep Regression. IEEE Trans. Pattern Anal. Mach. Intell. 2020, 42, 2065–2081. [Google Scholar] [CrossRef]
  64. Biju, V.G.; Schmitt, A.M.; Engelmann, B. Assessing the Influence of Sensor-Induced Noise on Machine-Learning-Based Changeover Detection in CNC Machines. Sensors 2024, 24, 330. [Google Scholar] [CrossRef] [PubMed]
  65. Mao, Y.; Li, J.; Qi, Z.; Yuan, J.; Xu, X.; Jin, X.; Du, X. Research on Outlier Detection Methods for Dam Monitoring Data Based on Post-Data Classification. Buildings 2024, 14, 2758. [Google Scholar] [CrossRef]
  66. Zhang, W.; Belcheva, V.; Ermakova, T. Interpretable Deep Learning for Diabetic Retinopathy: A Comparative Study of CNN, ViT, and Hybrid Architectures. Computers 2025, 14, 187. [Google Scholar] [CrossRef]
  67. Cardim, G.P.; Reis Neto, C.B.; Nascimento, E.S.; Cardim, H.P.; Casaca, W.; Negri, R.G.; Cabrera, F.C.; dos Santos, R.J.; da Silva, E.A.; Dias, M.A. A Study of COVID-19 Diagnosis Applying Artificial Intelligence to X-Rays Images. Computers 2025, 14, 163. [Google Scholar] [CrossRef]
  68. Manalı, D.; Demirel, H.; Eleyan, A. Deep Learning Based Breast Cancer Detection Using Decision Fusion. Computers 2024, 13, 294. [Google Scholar] [CrossRef]
  69. Holgado-Apaza, L.A.; Isuiza-Perez, D.D.; Ulloa-Gallardo, N.J.; Vilchez-Navarro, Y.; Aragon-Navarrete, R.N.; Quispe Layme, W.; Quispe-Layme, M.; Castellon-Apaza, D.D.; Choquejahua-Acero, R.; Prieto-Luna, J.C. A Machine Learning Approach to Identifying Key Predictors of Peruvian School Principals’ Job Satisfaction. Front. Educ. 2025, 10, 1580683. [Google Scholar] [CrossRef]
  70. Talukder, M.A.; Sharmin, S.; Uddin, M.A.; Islam, M.M.; Aryal, S. MLSTL-WSN: Machine Learning-Based Intrusion Detection Using SMOTETomek in WSNs. Int. J. Inf. Secur. 2024, 23, 2139–2158. [Google Scholar] [CrossRef]
  71. Omar, A.; Abd El-Hafeez, T. Optimizing Epileptic Seizure Recognition Performance with Feature Scaling and Dropout Layers. Neural Comput. Appl. 2024, 36, 2835–2852. [Google Scholar] [CrossRef]
  72. Linkon, A.H.M.; Labib, M.M.; Hasan, T.; Hossain, M.; Jannat, M.E. Deep Learning in Prostate Cancer Diagnosis and Gleason Grading in Histopathology Images: An Extensive Study. Inform. Med. Unlocked 2021, 24, 100582. [Google Scholar] [CrossRef]
  73. Iandola, F.N.; Han, S.; Moskewicz, M.W.; Ashraf, K.; Dally, W.J.; Keutzer, K. SqueezeNet: AlexNet-Level Accuracy with 50x Fewer Parameters and <0.5MB Model Size. arXiv 2016, arXiv:1602.07360. [Google Scholar]
  74. Simonyan, K.; Zisserman, A. Very Deep Convolutional Networks for Large-Scale Image Recognition. In Proceedings of the 3rd International Conference on Learning Representations, ICLR 2015, San Diego, CA, USA, 7–9 May 2015. [Google Scholar]
  75. He, K.; Zhang, X.; Ren, S.; Sun, J. Deep Residual Learning for Image Recognition. In Proceedings of the 2016 IEEE Conference on Computer Vision and Pattern Recognition (CVPR), Las Vegas, NV, USA, 27–30 June 2016; pp. 770–778. [Google Scholar] [CrossRef]
  76. Swati, Z.N.K.; Zhao, Q.; Kabir, M.; Ali, F.; Ali, Z.; Ahmed, S.; Lu, J. Brain Tumor Classification for MR Images Using Transfer Learning and Fine-Tuning. Comput. Med. Imaging Graph. 2019, 75, 34–46. [Google Scholar] [CrossRef]
  77. Sharma, P.; Nayak, D.R.; Balabantaray, B.K.; Tanveer, M.; Nayak, R. A Survey on Cancer Detection via Convolutional Neural Networks: Current Challenges and Future Directions. Neural Netw. 2024, 169, 637–659. [Google Scholar] [CrossRef] [PubMed]
  78. Ahmad, M.; Mazzara, M.; Distefano, S. Regularized CNN Feature Hierarchy for Hyperspectral Image Classification. Remote Sens. 2021, 13, 2275. [Google Scholar] [CrossRef]
  79. Bera, S.; Shrivastava, V.K. Effect of Dropout on Convolutional Neural Network for Hyperspectral Image Classification. Lect. Notes Electr. Eng. 2023, 1056, 121–131. [Google Scholar] [CrossRef]
  80. Weng, W.; Zhu, X. U-Net: Convolutional Networks for Biomedical Image Segmentation. IEEE Access 2015, 9, 16591–16603. [Google Scholar] [CrossRef]
  81. Andrushia, A.D.; Anand, N.; Lublóy, É.; Arulraj, P. Deep Learning Based Thermal Crack Detection on Structural Concrete Exposed to Elevated Temperature. Adv. Struct. Eng. 2021, 24, 1896–1909. [Google Scholar] [CrossRef]
  82. Guo, S.; Yi, S.; Chen, M.; Zhang, Y. PIFRNet: A Progressive Infrared Feature-Refinement Network for Single Infrared Image Super-Resolution. Infrared Phys. Technol. 2025, 147, 105779. [Google Scholar] [CrossRef]
  83. Mao, K.; Li, R.; Cheng, J.; Huang, D.; Song, Z.; Liu, Z.K. PL-Net: Progressive Learning Network for Medical Image Segmentation. Front. Bioeng. Biotechnol. 2024, 12, 1414605. [Google Scholar] [CrossRef]
  84. Raspberry Pi Foundation. Raspberry Pi 4 Model B. Available online: https://www.raspberrypi.com/products/raspberry-pi-4-model-b/ (accessed on 28 August 2025).
  85. Aishwarya, K.; Nirmala, R.; Navamathavan, R. Recent Advancements in Liquefied Petroleum Gas Sensors: A Topical Review. Sens. Int. 2021, 2, 100091. [Google Scholar] [CrossRef]
  86. Tladi, B.C.; Kroon, R.E.; Swart, H.C.; Motaung, D.E. A Holistic Review on the Recent Trends, Advances, and Challenges for High-Precision Room Temperature Liquefied Petroleum Gas Sensors. Anal. Chim. Acta 2023, 1253, 341033. [Google Scholar] [CrossRef] [PubMed]
  87. Figaro USA Inc. Gas Sensor (TGS6810-D00). Available online: https://www.figaro.co.jp/en/product/docs/tgs6810-d00_product%20infomation%28en%29_rev03.pdf (accessed on 28 August 2025).
  88. Adafruit. MLX90640 IR Thermal Camera Breakout. 2024. Available online: https://www.adafruit.com/product/4407 (accessed on 28 August 2025).
  89. BOSCH. Gas Sensor BME690 | Bosch Sensortec. Available online: https://www.bosch-sensortec.com/products/environmental-sensors/gas-sensors/bme690/ (accessed on 1 October 2025).
Disclaimer/Publisher’s Note: The statements, opinions and data contained in all publications are solely those of the individual author(s) and contributor(s) and not of MDPI and/or the editor(s). MDPI and/or the editor(s) disclaim responsibility for any injury to people or property resulting from any ideas, methods, instructions or products referred to in the content.

Article Metrics

Citations

Article Access Statistics

Multiple requests from the same IP address are counted as one view.